
3D Concrete Printing Market Overview:
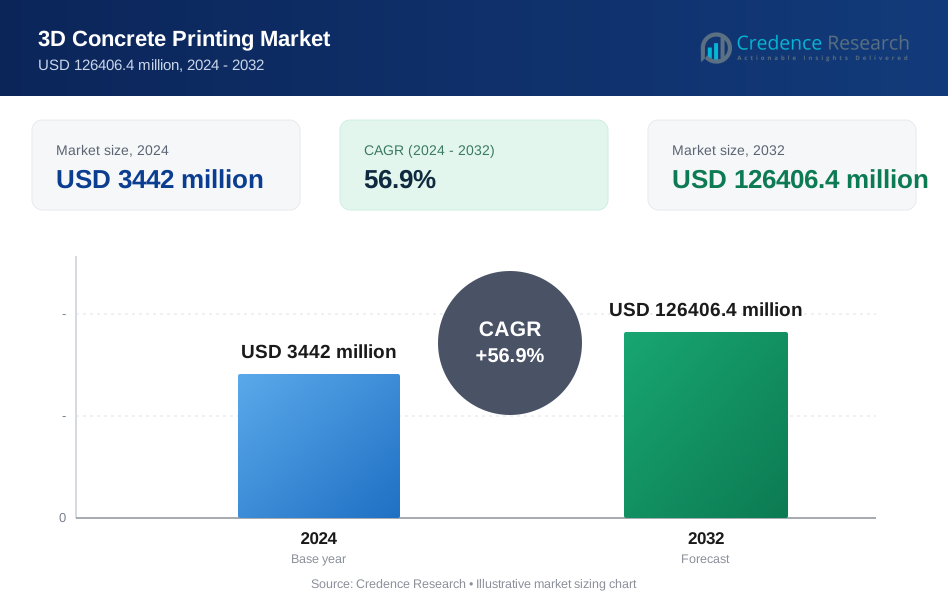
3D Concrete Printing Market was valued at USD 3442 million in 2024 and is anticipated to reach USD 126406.4 million by 2032, growing at a CAGR of 56.9 % during the forecast period.
| REPORT ATTRIBUTE | DETAILS |
|---|---|
| Historical Period | 2020-2023 |
| Base Year | 2024 |
| Forecast Period | 2025-2032 |
| 3D Concrete Printing Market Size 2024 | USD 3442 million |
| 3D Concrete Printing Market, CAGR | 56.9% |
| 3D Concrete Printing Market Size 2032 | USD 126406.4 million |
3D Concrete Printing Market Insights
- Growing demand for automation, reduced labor dependence, and cost-efficient construction drives wider acceptance of large-format printing systems in both public and private sectors.
- Emerging trends include wider use of geopolymer mixes, faster extrusion systems, and growing deployment of printed homes, bridges, and decorative structural components.
- Key players such as ICON Technology Inc., COBOD International A/S, Winsun, and Apis Cor strengthen competition through partnerships, pilot projects, and innovations in print speed, build size, and material performance.
- North America leads with 37% share, while Europe follows with strong sustainability initiatives; residential housing remains the largest segment, driven by demand for rapid and affordable construction solutions.
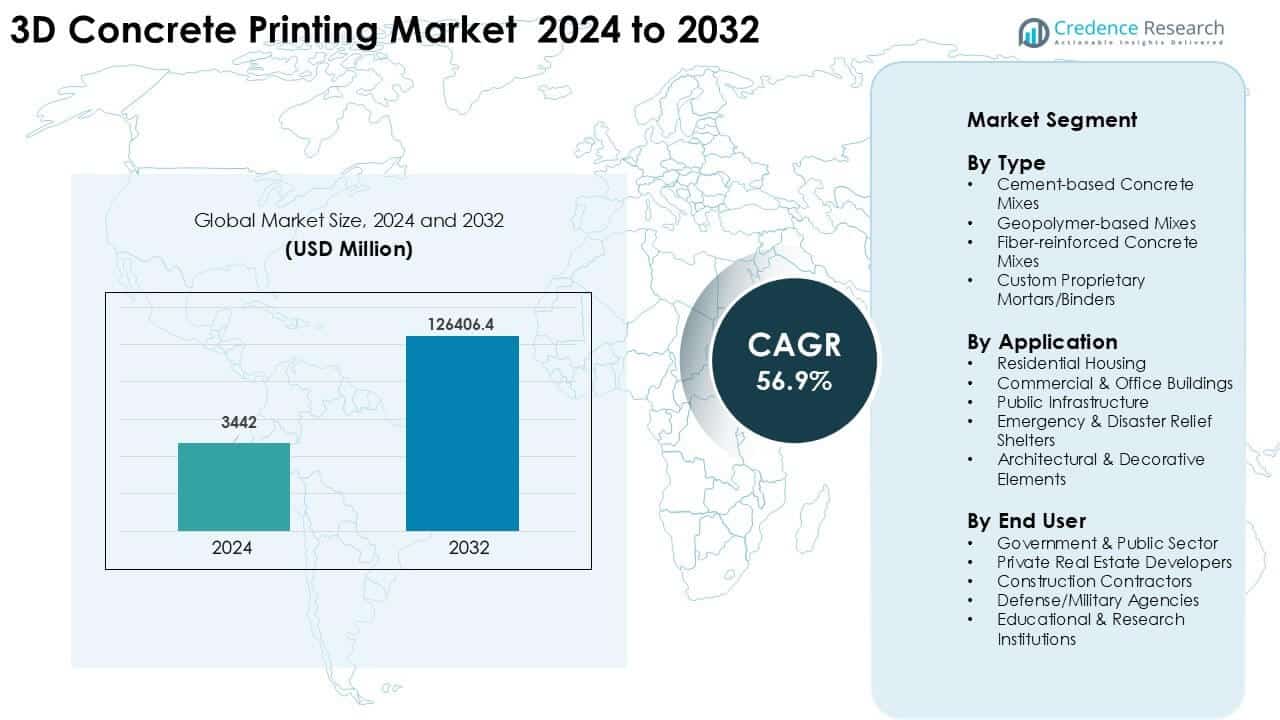
3D Concrete Printing Market Segmentation Analysis:
By Type
Cement-based concrete mixes lead the 3D concrete printing market with about 46% share, driven by wide availability, low cost, and strong mechanical strength for structural applications. Builders prefer these mixes for walls, frames, and large components due to consistent extrusion performance. Geopolymer mixes gain traction for sustainable builds with reduced carbon output. Fiber-reinforced concrete supports higher durability needs in seismic or load-bearing structures. Custom proprietary binders expand in advanced projects that need fast curing, higher precision, and complex shapes.
- For instance, Alquist 3D printed 16‑ft walls in seven days using tailored mixes that cut print time by nearly two‑thirds compared with manual block builds.
By Application
Residential housing dominates the application segment with around 41% share, supported by rising demand for affordable homes and faster construction cycles. Automated printing reduces labor needs and shortens project timelines, which attracts private developers. Commercial and office buildings adopt the technology for customized façades and complex geometry. Public infrastructure expands due to printed bridges, utilities, and street fixtures. Emergency shelters grow as governments use rapid-build systems for disaster response. Decorative elements rise due to demand for customized architectural designs.
- For instance, a 29‑m 3D‑printed pedestrian bridge in Nijmegen was built with targeted material use for structural integrity. Emergency shelters grow as governments use rapid‑build systems for disaster response. Decorative elements rise due to demand for customized architectural designs.
By End User
Construction contractors hold the largest share at nearly 38%, as they integrate 3D printing to cut labor costs, reduce waste, and speed up project delivery. Contractors also use printed elements for modular and repeatable structures. Government and public sector bodies adopt the technology for housing schemes and public infrastructure. Private real estate developers support growth through high-volume residential projects. Defense agencies test printed bunkers and field shelters for rapid deployment. Educational and research institutions advance material science and structural validation, supporting broader market adoption.
Key Growth Drivers
Automation Demand and Labor Shortages
Automation needs drive strong growth in the 3D concrete printing market as construction firms face labor shortages, rising wages, and pressure to complete projects faster. Automated printing reduces manual work, increases safety, and delivers consistent structural accuracy through controlled material placement. The method limits human errors, lowers waste, and supports lean construction practices. Contractors also benefit from faster build cycles that help them meet strict timelines and reduce project overruns. These factors make printing attractive for large housing and commercial projects. Public agencies increasingly integrate automated technologies into long-term infrastructure programs, which expands the market’s adoption. The combined push from efficiency, lower labor dependence, and safety compliance strengthens demand across global construction markets.
- For instance, COBOD’s BOD2 system enabled PERI to print a full two-story building in Germany with a wall output rate of up to 10 tons per hour, reducing manual labor while improving build precision. Automated printing reduces manual work, increases safety, and delivers consistent structural accuracy through controlled material placement.
Sustainability and Material Efficiency
Sustainability goals act as a key driver as governments and developers seek lower-carbon building methods. 3D printing reduces cement demand through optimized pathing and creates minimal waste compared with traditional formwork. Geopolymer and low-carbon binders support climate commitments and appeal to cities targeting greener construction. The method also reduces transport needs because printing occurs on-site, which cuts emissions and logistics costs. Efficient energy use and improved thermal performance help printed designs meet modern building standards. These strengths make 3D printing suitable for green housing, public infrastructure, and eco-focused commercial projects. As climate regulations tighten, sustainable materials and efficient production methods enhance adoption across both private and government sectors, reinforcing long-term market expansion.
- For instance, WASP’s Crane WASP system printed a soil-and-fiber-based wall set that improved thermal resistance by over 30% compared with standard concrete walls in controlled testing. These strengths make 3D printing suitable for green housing, public infrastructure, and eco-focused commercial projects. As climate regulations tighten, sustainable materials and efficient production methods enhance adoption across both private and government sectors, reinforcing long-term market expansion.
Affordable Housing and Rapid Construction Needs
Growing demand for affordable and fast-build housing significantly boosts market growth. Many countries face severe housing shortages, and 3D printing helps reduce construction costs while speeding up delivery. Printed walls, shells, and modular units cut project durations and allow large housing developments to progress quickly. Disaster-prone regions also benefit from rapid-deploy printed shelters that support emergency response efforts. Developers gain improved return on investment by compressing build schedules and lowering labor requirements. Governments adopt printed housing pilots to meet social housing targets. Combined benefits of speed, cost reduction, and scalable deployment position 3D printing as an effective solution for global housing challenges.
Key Trends & Opportunities
Adoption of Advanced Materials
Evolving material innovation shapes major opportunities in the 3D concrete printing market. Geopolymer mixes lower emissions and deliver better durability for sustainable projects. Fiber-reinforced blends enhance strength for seismic, industrial, and military applications. Proprietary binders improve curing time and geometric precision, which enables architects to design complex elements with ease. These materials expand use cases across infrastructure, multi-storey structures, and premium architectural projects. As performance standards rise globally, demand for specialized mixes presents new commercial opportunities for material developers and equipment suppliers.
- For instance, Black Buffalo 3D tested its proprietary ink with the ICC-ES AC509 standard and achieved compressive strength above 6,000 psi, making it suitable for structural walls. Fiber-reinforced blends enhance strength for seismic, industrial, and military applications.
Expansion of Infrastructure and Large-Scale Printing
Large-scale 3D printing creates strong growth prospects as governments explore printed bridges, culverts, utility structures, and transport elements. These projects reduce construction time and improve durability through automated layer consistency. Remote and harsh environments also benefit from on-site printing, which avoids complex logistics. Public funding for infrastructure modernization supports adoption of industrial-grade printers. This trend strengthens collaboration among contractors, equipment companies, and public agencies.
- For instance, the U.S. Marine Corps tested ICON’s large-format system to print field structures reaching over 9 feet in height, demonstrating defense interest in deployable printing. This trend strengthens collaboration among contractors, equipment companies, and public agencies.
Key Challenges
Regulatory and Certification Barriers
Lack of standardized codes for 3D-printed structures remains a major challenge. Many regions require extensive testing to verify fire resistance, structural integrity, and long-term durability, which delays project approvals. Limited certification frameworks create uncertainty for contractors and developers. These barriers slow expansion into large commercial and public projects. Without clear guidelines, insurers and financiers hesitate to support printed builds, affecting market confidence.
High Initial Costs and Skills Gap
High capital investment in printers, mixers, software, and robotics limits adoption among smaller contractors. Training needs for operating printers, designing printable structures, and validating builds also increase costs. Skilled engineers and technicians remain in short supply across many regions. This skills gap slows market growth and raises operational risks for early adopters. As technology matures, training programs and cost reductions will be essential to market scalability.
Regional Analysis
North America
North America holds about 37% share of the 3D concrete printing market, driven by strong adoption in residential projects, military infrastructure, and public housing programs. The United States leads growth due to active government pilots and investments in automated construction to reduce labor shortages. Developers use printing for affordable housing, customized façades, and rapid modular structures. Canada supports growth through sustainability-focused building codes that favor low-carbon printed materials. The region benefits from strong R&D activity, advanced printer manufacturers, and widespread testing of printed bridges and utilities, which strengthens long-term commercialization.
Europe
Europe accounts for nearly 32% share, supported by strict sustainability mandates and rapid uptake of low-carbon printable mixes. Countries like Germany, Denmark, and the Netherlands lead commercial adoption through printed homes, public structures, and architectural projects. Strong regulations on waste reduction and energy efficiency push builders toward automated solutions. The region also benefits from active collaboration between universities, startups, and construction firms. Printed pedestrian bridges, decorative elements, and municipal structures gain traction across urban areas. Government-backed innovation programs and green building incentives continue to expand the region’s 3D printing footprint.
Asia Pacific
Asia Pacific holds around 22% share, with rapid expansion driven by large-scale housing needs, urbanization, and government-supported construction innovation. China, Japan, and India invest in automated building systems to speed up housing delivery and reduce labor dependence. Printed disaster-relief shelters and low-cost homes gain strong momentum across developing markets. Advanced materials research in Japan and South Korea supports performance improvement. Regional construction giants invest in industrial-scale printers to support high-density projects. Growing smart city programs, coupled with rising demand for cost-efficient builds, further accelerate 3D concrete printing adoption.
Latin America
Latin America captures nearly 6% share, supported by growing need for affordable housing and faster construction in urban centers. Countries like Mexico and Brazil lead adoption due to active pilot projects focused on low-income communities. Printed walls, small homes, and social housing units help reduce build time and costs. Regional interest grows in disaster-resilient printed structures, especially in storm-prone regions. Limited skilled labor availability also supports automated methods. As local governments explore sustainable materials and cost-efficient construction, the region shows steady potential for long-term market growth.
Middle East & Africa
The Middle East & Africa region holds about 3% share, driven by rising interest in futuristic construction methods and rapid-build capabilities. The UAE leads the market through national mandates promoting 3D-printed buildings and large-scale commercial projects. Saudi Arabia supports adoption through smart city megaprojects integrating automated technologies. In Africa, countries explore printed housing solutions for low-income populations and disaster-prone areas. Material efficiency and reduced labor dependence appeal to contractors across the region. As infrastructure spending increases, automated printing gains visibility as a scalable and cost-effective construction method.
3D Concrete Printing Market Segmentations:
By Type
- Cement-based Concrete Mixes
- Geopolymer-based Mixes
- Fiber-reinforced Concrete Mixes
- Custom Proprietary Mortars/Binders
By Application
- Residential Housing
- Commercial & Office Buildings
- Public Infrastructure
- Emergency & Disaster Relief Shelters
- Architectural & Decorative Elements
By End User
- Government & Public Sector
- Private Real Estate Developers
- Construction Contractors
- Defense/Military Agencies
- Educational & Research Institutions
By Geography
- North America
- U.S.
- Canada
- Mexico
- Europe
- Germany
- France
- U.K.
- Italy
- Spain
- Rest of Europe
- Asia Pacific
- China
- Japan
- India
- South Korea
- South-east Asia
- Rest of Asia Pacific
- Latin America
- Brazil
- Argentina
- Rest of Latin America
- Middle East & Africa
- GCC Countries
- South Africa
- Rest of the Middle East and Africa
Competitive Landscape
The competitive landscape of the 3D concrete printing market features leading companies such as ICON Technology Inc., Vertico B.V., BetAbram d.o.o., Hyperion Robotics Oy, COBOD International A/S, Apis Cor Inc., CyBe Construction B.V., XtreeE, Winsun, and Contour Crafting Corporation. These companies focus on advanced printer platforms, automated construction systems, and high-performance printable materials to strengthen their market presence. Many players partner with real estate developers, government agencies, and research institutions to scale commercial deployments in housing, infrastructure, and architectural projects. Firms also invest in larger robotic printers, faster extrusion systems, and specialized binders that support complex designs and rapid build cycles. Strategic moves involve global expansion, pilot project execution, and long-term collaborations that help validate printed structures for regulatory approval. As competition increases, companies differentiate through print speed, build size, material compatibility, and project delivery efficiency. This innovation-driven environment accelerates adoption across global construction markets.
Key Player Analysis
- ICON Technology, Inc.
- Vertico B.V.
- BetAbram d.o.o.
- Hyperion Robotics Oy
- COBOD International A/S
- Apis Cor Inc.
- CyBe Construction B.V.
- XtreeE
- Winsun (Yingchuang Building Technique Co., Ltd.)
- Contour Crafting Corporation
Recent Developments
- In October 2024, CyBe Construction B.V.: SCI brought CyBe’s RC 3D concrete printer to Ohio to deliver 3D-printed homes, targeting faster, lower-cost housing and planned expansion into nearby U.S. states using CyBe technology.
- In October 2024, Contour Crafting Corporation: Contour Crafting unveiled the D-Crafter, a transportable construction 3D printer with up to 200 m² build area, aimed at rapid on-site concrete printing with faster setup and higher mobility for large projects.
- In March 2024, Winsun (Yingchuang Building Technique Co., Ltd.): Winsun re-entered the global spotlight by creating U.S. subsidiary Gaudi Tech to 3D print concrete houses, starting new residential projects and positioning its gantry systems for broader North American deployment.
Report Coverage
The research report offers an in-depth analysis based on Type, Application, End-User and Geography. It details leading market players, providing an overview of their business, product offerings, investments, revenue streams, and key applications. Additionally, the report includes insights into the competitive environment, SWOT analysis, current market trends, as well as the primary drivers and constraints. Furthermore, it discusses various factors that have driven market expansion in recent years. The report also explores market dynamics, regulatory scenarios, and technological advancements that are shaping the industry. It assesses the impact of external factors and global economic changes on market growth. Lastly, it provides strategic recommendations for new entrants and established companies to navigate the complexities of the market.
Future Outlook
- The market will expand as more countries adopt automated construction for housing and public projects.
- Faster printers and advanced materials will support larger, taller, and more complex printed structures.
- Governments will integrate printed homes and shelters into affordable housing and disaster response programs.
- Sustainability rules will push wider adoption of low-carbon and geopolymer-based printable mixes.
- Commercial developers will use printing to speed up project timelines and reduce labor costs.
- Infrastructure printing, including bridges and utilities, will gain strong momentum in urban regions.
- Certification frameworks will mature, allowing easier approval of printed buildings.
- Remote and harsh environments will adopt printing due to reduced logistics and on-site fabrication benefits.
- Competition among global players will intensify as new entrants introduce modular printing systems.
- Integration of AI, robotics, and digital twins will streamline design, automation, and quality control.
Request a Free Sample
Fill in your details and we'll send you a free sample report.
- Sample data tables & charts
- Research methodology
Need a Custom Version of This Report?
Tailor the scope, geography, or segments to your exact requirements.
- Custom geography or segment scope
- Direct access to our analyst team
Frequently Asked Questions
What is the current market size for 3D Concrete Printing Market, and what is its projected size in 2032?
At what Compound Annual Growth Rate is 3D Concrete Printing Market projected to grow between 2024 and 2032?
Which 3D Concrete Printing Market segment held the largest share in 2024?
What are the primary factors fueling the growth of 3D Concrete Printing Market?
Who are the leading companies in 3D Concrete Printing Market?
Which region commanded the largest share of 3D Concrete Printing Market?
Table of Content
Chapter 1. Report Introduction
- 1.1 Report Description & Purpose
- 1.1.1 Report Title & Market Definition
- 1.1.2 Unique Selling Propositions (USP) & Key Differentiators
- 1.1.3 Value Proposition for Stakeholders
- 1.2 Research Objectives
- 1.2.1 Market Sizing Objectives (Volume & Revenue)
- 1.2.2 Segmentation Objectives
- 1.2.3 Competitive Intelligence Objectives
- 1.2.4 Forecast & Scenario Objectives
- 1.3 Report Scope
- 1.3.1 3D Concrete Printing Scope – Types & Subtypes Covered
- 1.3.2 Geographic Scope – Regions & Countries Covered
- 1.3.3 Historical Period, Base Year & Forecast Period (2024; forecast to 2032)
- 1.3.4 Inclusions & Exclusions
- 1.4 HS Code & Classification Framework
- 1.5 Currency, Units & Pricing Basis
- 1.6 Target Stakeholders
- 1.7 Limitations & Assumptions
Chapter 2. Executive Summary
- 2.1 Global 3D Concrete Printing Market Snapshot
- 2.1.1 Market Size – Historical (2024) & Forecast (2024-2032) (2024: USD 3442 million → 2032: USD 126406.4 million)
- 2.1.2 Volume & Revenue – Global Totals
- 2.1.3 Key Market Highlights – Top Five Facts
- 2.2 3D Concrete Printing Market Segmentation Snapshot
- 2.2.1 Market Split by Region – 2024 vs. 2032
- 2.3 Competitive Snapshot
- 2.3.1 Top 10 Players by Revenue Share – 2024
- 2.3.2 Top 10 Players by Volume Share – 2024
- 2.3.3 Recent Strategic Developments (18-Month Summary)
- 2.4 Key Investment Highlights & Strategic Conclusions
Chapter 3. 3D Concrete Printing Market Dynamics & Industry Analysis
- 3.1 Market Overview & Context
- 3.1.1 3D Concrete Printing Market Position in the Broader Automotive Value Chain
- 3.1.2 OEM vs. Replacement Market Dynamics
- 3.1.3 Market Maturity & Development Stage by Region
- 3.2 3D Concrete Printing Market Drivers
- 3.3 3D Concrete Printing Market Restraints & Challenges
- 3.4 3D Concrete Printing Market Opportunities
- 3.5 Porter's Five Forces Analysis
- 3.5.1 Threat of New Entrants
- 3.5.2 Bargaining Power of Suppliers
- 3.5.3 Bargaining Power of Buyers
- 3.5.4 Threat of Substitutes
- 3.5.5 Competitive Rivalry – Intensity Assessment
- 3.6 3D Concrete Printing Value Chain Analysis
- 3.6.1 Upstream – Raw Material/Input Suppliers
- 3.6.1.1 Raw Material/Input 1
- 3.6.1.2 Raw Material/Input 2
- 3.6.1.3 Raw Material/Input 3
- 3.6.2 Midstream – Production/Manufacturing/Service Delivery
- 3.6.2.1 Production/Process Overview
- 3.6.2.2 Key Facility Locations & Capacity by Manufacturer
- 3.6.3 Downstream – Distribution & End Consumer
- 3.6.3.1 Primary Channel – B2B/OEM
- 3.6.3.2 Secondary Channels – Dealer, Retail, Online, Direct
- 3.6.4 Value Chain Profitability Analysis
- 3.6.1 Upstream – Raw Material/Input Suppliers
- 3.7 PESTEL Analysis
- 3.7.1 Political Factors
- 3.7.2 Economic Factors
- 3.7.3 Social Factors
- 3.7.4 Technological Factors
- 3.7.5 Environmental Factors
- 3.7.6 Legal Factors
- 3.8 3D Concrete Printing Supply Chain Analysis
- 3.8.1 Raw Material/Input Supply Risk Assessment
- 3.8.2 Manufacturing Concentration Risk (Geographic Exposure)
- 3.8.3 Trade Disruption Impact Analysis
- 3.9 Regulatory & Policy Landscape
Note: The regulatory and policy landscape section covers regulations based on their applicability to the market, 3D Concrete Printing category, geography, and scope of the study. Only regulatory frameworks with a material impact on operations, compliance, trade, sustainability, or market access are analyzed in detail.
Chapter 4. Key Investment Pockets & Opportunity Analysis
- 4.1 3D Concrete Printing Market Attractiveness Analysis
- 4.1.1 By Region – Investment Attractiveness Matrix (Volume × CAGR)
- 4.2 Absolute Revenue Growth Opportunity
- 4.2.1 By Region – Absolute USD Growth Through 2032
- 4.3 Incremental Volume Opportunity
- 4.3.1 By Region – Incremental Volume Through 2032
- 4.3.2 Segment – Incremental Volume
- 4.4 Emerging Submarket Opportunity Deep Dive (Subject to Applicability)
- 4.5 Emerging Market Opportunity Scorecards
- 4.5.1 United States
- 4.5.2 Europe
- 4.5.3 Asia
- 4.5.4 Middle East & Africa
Note: Emerging Market Opportunity Scorecards will be included based on relevance and strategic importance. Regions listed are indicative and may vary depending on data availability and market dynamics.
Chapter 5. 3D Concrete Printing Import-Export Analysis & Trade Flows
- 5.1 Global Trade Overview
- 5.1.1 Global Export Value by Country (2024)
- 5.1.2 Global Export Volume by Country (2024)
- 5.1.3 Global Import Value by Country (2024)
- 5.1.4 Global Import Volume by Country (2024)
- 5.1.5 Net Trade Balance by Country (2024)
- 5.2 Export Analysis – Segment
- 5.2.1 Type 1 (HS Code)
- 5.2.2 Type 2 (HS Code)
- 5.2.3 Type 3 (HS Code)
- 5.2.4 Type 4 (HS Code)
- 5.2.5 Type 5 (HS Code)
- 5.3 Import Analysis – Segment
- 5.3.1 Type 1 (HS Code)
- 5.3.2 Type 2 (HS Code)
- 5.3.3 Type 3 (HS Code)
- 5.3.4 Type 4 (HS Code)
- 5.3.5 Type 5 (HS Code)
- 5.4 Average Unit Trade Prices
- 5.4.1 Average Export Price – Segment & Country
- 5.4.2 Average Import Price – Segment & Source Country
- 5.4.3 Price Trends (2024)
- 5.5 Key Trade Route Analysis
- 5.5.1 Trade Route 1
- 5.5.2 Trade Route 2
- 5.5.3 Trade Route 3
- 5.5.4 Trade Route 4
- 5.5.5 Trade Route 5
- 5.6 Trade Policy Impact Assessment
- 5.6.1 US Anti-Dumping & Section 301 Tariffs
- 5.6.2 EU Customs Union Impact
- 5.6.3 Major Free Trade Agreements
- 5.6.4 USMCA Rules of Origin
Note: Trade policy analysis will be included only where relevant to the 3D Concrete Printing market.
Chapter 6. Competitive Landscape & Company Benchmarking
- 6.1 3D Concrete Printing Market Concentration & Structure
- 6.1.1 Herfindahl-Hirschman Index (HHI) – vs. 2024
- 6.1.2 Tier 1, Tier 2 & Tier 3 Market Structure
- 6.1.3 Global, Regional & Local Player Dynamics
- 6.2 3D Concrete Printing Market Share Analysis – 2024
- 6.2.1 Global Revenue Share by Company
- 6.2.2 Global Volume Share by Company
- 6.2.3 Regional Revenue Share
- 6.2.4 Market Share Evolution ( vs. 2024)
- 6.2.5 OEM Segment Share by Company
- 6.2.6 Replacement Segment Share by Company
- 6.3 Production/Delivery Capacity & Facility Analysis
- 6.3.1 Global Installed Capacity
- 6.3.2 Capacity Utilization Rates
- 6.3.3 Production/Output Volume
- 6.3.4 Facility Locations & Capacity Map
- 6.3.5 Planned Capacity Additions
- 6.4 3D Concrete Printing Competitive Benchmarking Matrix
- 6.4.1 Revenue, Volume, CAGR & Profitability Comparison
- 6.4.2 Channel Revenue Mix
- 6.4.3 Geographic Revenue Exposure
- 6.4.4 R&D Intensity
- 6.4.5 Sustainability Maturity
- 6.5 Strategic Developments in 3D Concrete Printing (Last 24 Months)
- 6.5.1 Mergers, Acquisitions & Divestments
- 6.5.2 New 3D Concrete Printing Launches
- 6.5.3 Facility Expansions
- 6.5.4 Strategic Alliances, Joint Ventures & Partnerships
- 6.5.5 Distribution Expansion & Market Entry
- 6.5.6 Sustainability & ESG Initiatives
- 6.6 Competitive Strategy Mapping
- 6.6.1 Leader, Challenger, Follower & Niche Classification
- 6.6.2 Pricing Strategy Comparison
- 6.6.3 Channel Strategy Matrix
Note: Strategic developments are included based on their materiality and the availability of reliable information.
Chapter 7. Global 3D Concrete Printing Market – By Distribution Channel
- 7.1 Segment Overview
- 7.1.1 Volume & Revenue Split by Channel (2024 & 2032)
- 7.1.2 Channel Mix Evolution (2024-2032)
Chapter 8. Regional Market Analysis – Global Overview
- 8.1 Global Regional Overview
- 8.1.1 Regional Volume Share
- 8.1.2 Regional Revenue Share
- 8.1.3 Regional Volume by Region
- 8.1.4 Regional Revenue by Region
- 8.1.5 Regional Forecast Through 2032
- 8.2 Cross-Regional Segment Analysis
- 8.2.1 By Distribution Channel
- 8.2.2 By Brand/Price Tier
Chapter 9. North America 3D Concrete Printing Market
- 9.1 United States
- 9.2 Canada
- 9.3 Mexico
Chapter 10. Europe 3D Concrete Printing Market
- 10.1 Germany
- 10.2 France
- 10.3 Italy
- 10.4 United Kingdom
- 10.5 Spain
- 10.6 Poland
- 10.7 Russia
- 10.8 Netherlands
- 10.9 Belgium
- 10.10 Sweden
- 10.11 Denmark
- 10.12 Norway
- 10.13 Rest of Europe
Chapter 11. Asia Pacific 3D Concrete Printing Market
- 11.1 China
- 11.2 India
- 11.3 Japan
- 11.4 South Korea
- 11.5 Thailand
- 11.6 Indonesia
- 11.7 Vietnam
- 11.8 Malaysia
- 11.9 Australia
- 11.10 Rest of Asia Pacific
Chapter 12. Latin America 3D Concrete Printing Market
- 12.1 Brazil
- 12.2 Argentina
- 12.3 Colombia
- 12.4 Chile
- 12.5 Rest of Latin America
Chapter 13. Middle East 3D Concrete Printing Market
- 13.1 Saudi Arabia
- 13.2 United Arab Emirates
- 13.3 Turkey
- 13.4 Israel
- 13.5 Iran
- 13.6 Rest of the Middle East
Chapter 14. Africa 3D Concrete Printing Market
- 14.1 South Africa
- 14.2 Egypt
- 14.3 Nigeria
- 14.4 Morocco
- 14.5 Rest of Africa
Chapter 15. 3D Concrete Printing Company Profiles
- 15.1 [Company 01]
- 15.1.1 Company Overview
- 15.1.2 Key Management Personnel
- 15.1.3 Products & Services Portfolio
- 15.1.4 Financial Performance
- 15.1.5 Key Market Focus & Geographic Presence
- 15.1.6 Recent Developments & Strategic Initiatives
Note: The company profile list is preliminary and may change based on research findings, market developments, data availability, and client requirements.
Chapter 16. Appendices
- Appendix A – List of Abbreviations & Acronyms
- Appendix B – Industry Classification Code Reference – Full Series
- Appendix C – Production & Capacity Data Tables
- Appendix D – End-Use & Demand Base Tables
- Appendix E – Consumption & Replacement Rate Assumptions
- Appendix F – ASP Reference Tables
- Appendix G – Manufacturing & Facility Database
- Appendix H – Import-Export Data Tables
- Appendix I – Regulatory Summary Tables
- Appendix J – Primary Research Participant List (Anonymized)
- Appendix K – Primary Research Questionnaire Framework
- Appendix L – Data Sources & Bibliography
- Appendix M – Market Size Divergence & Source Comparison
Chapter 17. Research Methodology
- 17.1 Research Framework & Philosophy
- 17.2 Secondary Research – Sources, Hierarchy & Data Extraction
- 17.3 Data Modeling – Bottom-Up & Top-Down Market Sizing
- 17.4 Primary Research – Stakeholder Framework, LOI & Sample Sizes
- 17.5 Forecast Methodology – Regression, Scenario & Sensitivity Analysis
- 17.6 Quality Control – Four-Layer Validation Framework
- 17.7 Limitations & Standard Assumptions
- 17.8 Disclaimer
