
| REPORT ATTRIBUTE | DETAILS |
|---|---|
| Historical Period | 2020-2023 |
| Base Year | 2024 |
| Forecast Period | 2025-2032 |
| Aramid Paper Market Size 2024 | USD 766.7 million |
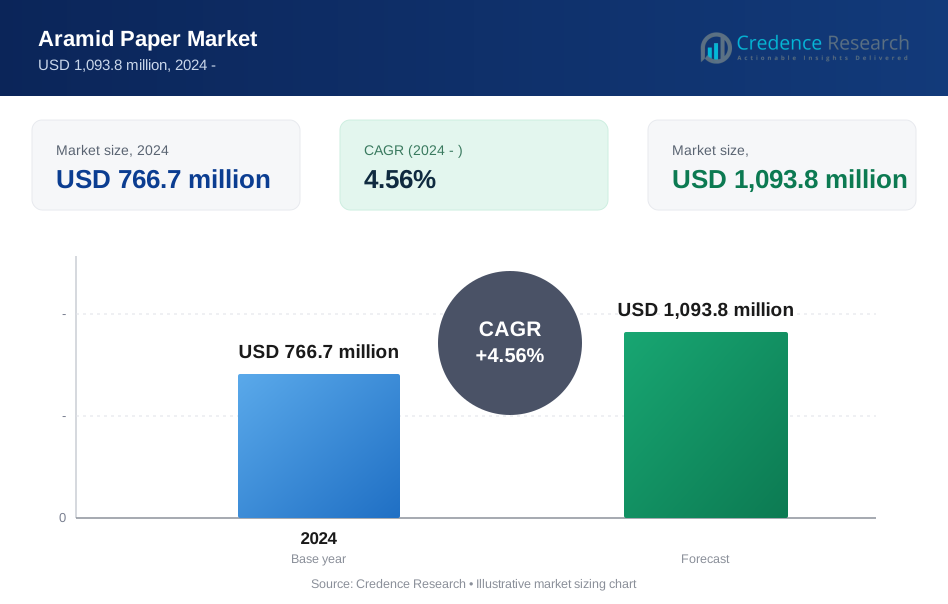
| Aramid Paper Market, CAGR | 4.56% |
| Aramid Paper Market Size 2032 | USD 1,093.8 million |
Market Overview
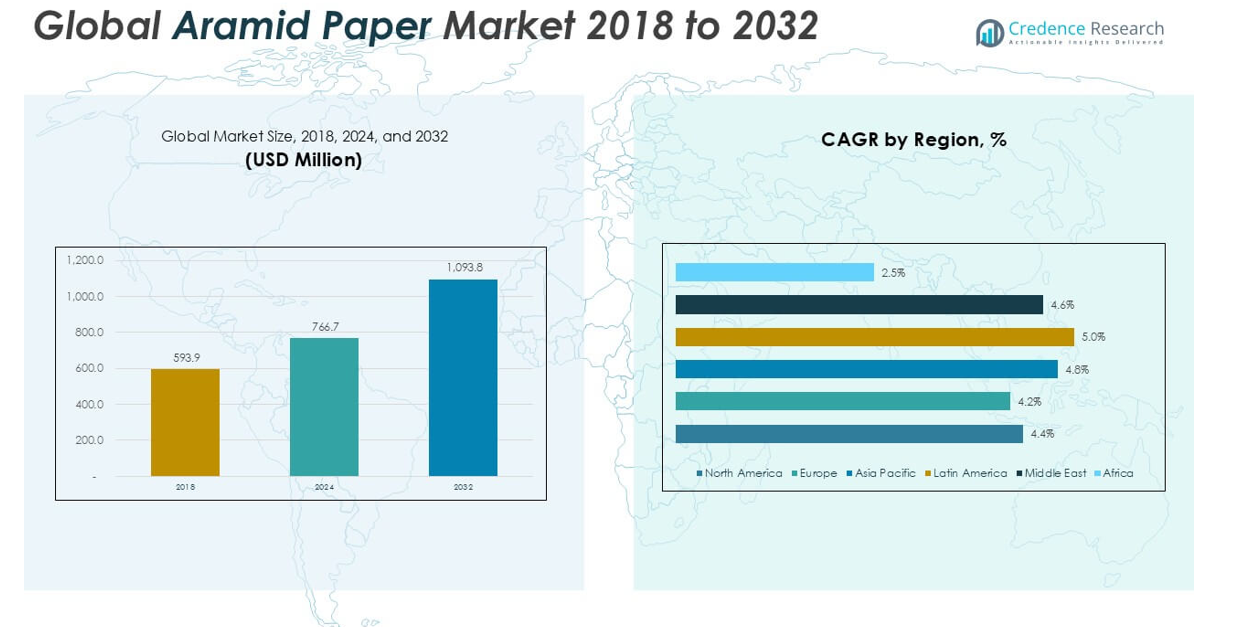
The Aramid Paper market size was valued at USD 593.9 million in 2018, increased to USD 766.7 million in 2024, and is anticipated to reach USD 1,093.8 million by 2032, at a CAGR of 4.56% during the forecast period.
The Aramid Paper market features leading players recognized for their technological expertise, diverse product portfolios, and commitment to quality. Key companies driving industry innovation and growth include DuPont, TEIJIN ARAMID B.V., Yantai Tayho Advanced Materials Co., Ltd., Kermel, and Shenzhen Longpont Co., Ltd. These organizations consistently invest in research, capacity expansion, and new product development to maintain their competitive edge. Regionally, Asia Pacific holds the largest market share, accounting for 42.2% of the global market in 2024. The region’s dominance stems from rapid industrialization, strong demand across electrical and automotive sectors, and robust manufacturing capabilities, positioning it as a key driver in the global Aramid Paper industry.
Market Insights
- The Aramid Paper market reached USD 766.7 million in 2024 and is projected to achieve USD 1,093.8 million by 2032, reflecting a CAGR of 4.56%.
- Growth is fueled by increasing demand for high-performance insulation materials in electrical, automotive, and aerospace sectors, with meta-aramid paper holding the largest product segment share.
- The market trends highlight advancements in manufacturing technology, a shift towards energy-efficient solutions, and rising adoption of aramid paper in next-generation electronics and safety applications.
- Competitive dynamics are defined by continuous innovation, product development, and strategic expansions by major players, while high production costs and raw material prices act as key restraints, impacting price-sensitive regions.
- Asia Pacific leads the market with 42.2% share in 2024, followed by Europe and North America, while electrical insulation remains the dominant application segment due to robust infrastructure and modernization projects across these regions.
Market Segmentation Analysis:
By Product Type
Meta-aramid paper dominates the Aramid Paper market, accounting for the largest market share in 2024. Its superior thermal stability, excellent electrical insulation, and chemical resistance make it the preferred choice across critical industries such as electrical insulation and power distribution. Manufacturers continue to favor meta-aramid paper for its consistent performance in harsh environments and cost-effectiveness, driving steady demand. Para-aramid paper, though used in applications demanding higher strength, occupies a smaller market share due to its relatively higher cost and more specialized use cases.
- For instance, DuPont’s Nomex meta-aramid paper withstands continuous operating temperatures up to 220°C and is specified in over 80% of transformer insulation projects worldwide, with more than 200 million transformers utilizing Nomex insulation to date.
By Application
Electrical insulation emerges as the leading application segment in the Aramid Paper market, capturing the highest revenue share. The growing adoption of meta-aramid paper in electrical and electronic components is propelled by rising demand for high-performance insulation materials in transformers, motors, and generators. Its robust dielectric strength and thermal endurance ensure reliable performance, supporting market expansion. The electrical insulation segment maintains its dominance, supported by infrastructure modernization and stringent safety regulations across developed and emerging economies.
- For instance, Hitachi Energy deploys aramid insulation in over 10,000 units of its latest transformer series annually, leveraging the paper’s capacity to maintain dielectric strength above 15 kV/mm, which enhances safety and reliability.
Market Overview
Increasing Demand from Electrical and Electronics Sector
Rising investments in electrical infrastructure and renewable energy projects have fueled the demand for high-performance insulation materials, positioning aramid paper as a preferred solution. Its exceptional thermal stability and dielectric properties make it indispensable for transformers, motors, and other critical equipment. Rapid urbanization and grid modernization initiatives in both emerging and developed markets further accelerate market growth, as manufacturers and utilities seek reliable and safe insulation options that meet stringent industry standards.
- For instance, ABB integrates aramid paper in wind turbine generators, reporting improved operational lifespans by up to 8 years compared to conventional cellulose-based insulation.
Expansion of Aerospace & Defense Applications
The aerospace and defense industry represents a significant growth driver for the Aramid Paper market, with manufacturers prioritizing lightweight, durable, and flame-resistant materials. Aramid paper’s high strength-to-weight ratio and inherent resistance to extreme temperatures support its adoption in aircraft structures, cabin interiors, and protective armor. As global defense spending rises and commercial aviation continues to expand, demand for advanced materials like aramid paper is expected to remain strong in these safety-critical applications.
- For instance, Teijin’s Technora aramid paper features in over 200 Boeing 787 Dreamliner aircraft, reducing overall aircraft weight by 450 kg per unit and contributing to improved fuel efficiency and fire protection.
Growing Emphasis on Sustainability and Energy Efficiency
Environmental regulations and a global push toward energy efficiency are prompting manufacturers to adopt materials that offer longevity and support sustainable practices. Aramid paper’s long lifecycle, recyclability, and reduced maintenance requirements help companies minimize environmental impact and operational costs. The trend toward green certification in building and electrical applications further elevates the adoption of aramid paper as a preferred eco-friendly insulation material in various end-use industries.
Key Trends & Opportunities
Emergence of Next-Generation Electronics
Technological advancements in miniaturization and the evolution of high-performance electronics create new opportunities for aramid paper manufacturers. The material’s superior insulation capabilities and heat resistance align well with the needs of advanced consumer devices and compact industrial equipment. As demand grows for smart devices, electric vehicles, and IoT infrastructure, aramid paper stands out as a reliable component for safe and efficient electronic performance.
- For instance, Samsung utilizes meta-aramid paper in the battery insulation of its Galaxy S24 Ultra smartphones, enabling safe operation under internal battery temperatures up to 140°C during fast charging cycles.
Rising Investments in Power Distribution Networks
Ongoing upgrades to power distribution systems, especially in emerging economies, open avenues for increased adoption of aramid paper. Governments and private players are investing in efficient and safe grid components to reduce power loss and enhance reliability. These efforts directly boost demand for advanced insulation materials, with aramid paper gaining preference due to its performance in high-voltage and demanding operational environments.
- For instance, China State Grid installed over 35,000 km of power lines insulated with aramid paper-based solutions in 2023, aiming to reduce grid failure incidents linked to insulation degradation.
Key Challenges
High Production and Raw Material Costs
The Aramid Paper market faces challenges from the high cost of raw materials and complex manufacturing processes. Production involves specialized chemicals and rigorous quality standards, leading to higher costs than traditional insulation papers. This cost structure can limit adoption, especially in price-sensitive markets, and prompts manufacturers to focus on cost optimization and process innovation.
Limited Availability of Skilled Workforce
A shortage of skilled labor in advanced material manufacturing can impede growth in the Aramid Paper market. The production of aramid fibers and papers demands specialized knowledge and technical expertise. The industry must invest in training programs and workforce development to ensure quality standards and meet the growing demand for high-performance insulation materials.
Competition from Alternative Insulation Materials
Aramid paper faces stiff competition from other insulation materials, such as mica, fiberglass, and advanced polymers. These alternatives often offer lower costs or specific performance benefits in certain applications. To maintain market share, aramid paper manufacturers must continually innovate and highlight the superior attributes of their products, such as longevity, safety, and performance under extreme conditions.
Regional Analysis
North America
North America holds a significant position in the Aramid Paper market, representing a market size of USD 111.53 million in 2018 and reaching USD 142.54 million in 2024. It is projected to achieve USD 200.60 million by 2032, reflecting a CAGR of 4.4%. North America accounts for approximately 18.6% of the global market share in 2024. Strong demand from the electrical, aerospace, and automotive industries, along with a focus on advanced insulation and safety solutions, continues to drive growth across the United States and Canada.
Europe
Europe commands a substantial share in the Aramid Paper market, valued at USD 135.94 million in 2018 and increasing to USD 172.15 million in 2024. The market is expected to reach USD 239.21 million by 2032, registering a CAGR of 4.2%. Europe holds about 22.5% of the global market share in 2024. The region benefits from stringent safety standards and sustained investments in power distribution and aerospace sectors, with Germany, France, and the UK leading adoption due to a strong industrial base and innovation focus.
Asia Pacific
Asia Pacific leads the global Aramid Paper market, holding the largest market share of approximately 42.2% in 2024. The regional market grew from USD 246.81 million in 2018 to USD 323.38 million in 2024, and it is forecasted to reach USD 470.33 million by 2032, at a CAGR of 4.8%. Growth is propelled by rapid industrialization, infrastructure investments, and expanding automotive and electronics manufacturing, particularly in China, Japan, and India. The region’s robust demand for high-performance insulation materials continues to shape global trends.
Latin America
Latin America represents a smaller but steadily growing segment in the Aramid Paper market, with a market size of USD 36.88 million in 2018, rising to USD 48.93 million in 2024. It is anticipated to reach USD 72.30 million by 2032, at the highest regional CAGR of 5.0%. The region holds around 6.4% of the global market share in 2024. Market expansion is driven by growing investments in energy infrastructure, modernization of power distribution networks, and increasing adoption of safety standards in Brazil and Mexico.
Middle East
The Middle East holds a moderate position in the Aramid Paper market, starting at USD 50.83 million in 2018 and rising to USD 65.89 million in 2024. The market is projected to reach USD 94.50 million by 2032, achieving a CAGR of 4.6%. The Middle East accounts for approximately 8.6% of global market share in 2024. Investments in energy, oil and gas, and infrastructure sectors support demand, with GCC countries focusing on grid upgrades and industrial safety.
Africa
Africa captures a smaller share of the Aramid Paper market, valued at USD 11.88 million in 2018 and increasing to USD 13.82 million in 2024. It is expected to reach USD 16.84 million by 2032, reflecting a CAGR of 2.5%. Africa represents around 1.8% of the global market share in 2024. Market growth is limited by slower industrial development and infrastructure investments; however, ongoing modernization efforts and adoption of high-performance materials in select industries offer future potential.
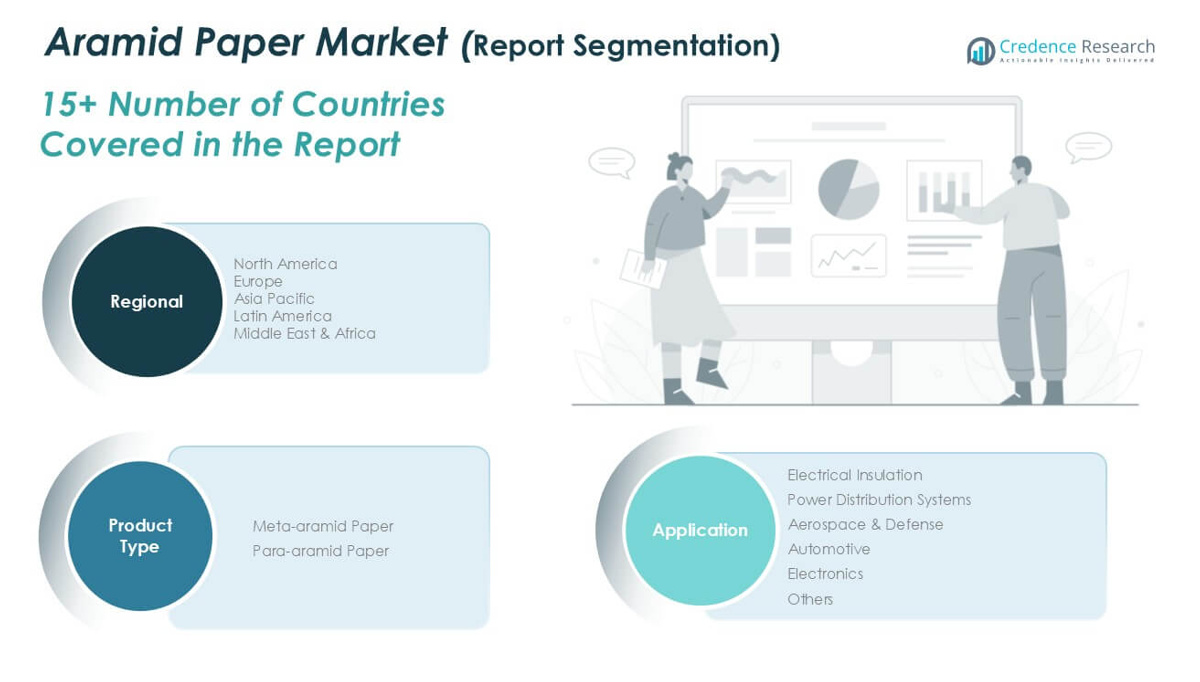
Market Segmentations:
By Product Type:
- Meta-aramid Paper
- Para-aramid Paper
By Application:
- Electrical Insulation
- Power Distribution Systems
- Aerospace & Defense
- Automotive
- Electronics
- Others
By Geography:
- North America
- U.S.
- Canada
- Mexico
- Europe
- Germany
- France
- U.K.
- Italy
- Spain
- Rest of Europe
- Asia Pacific
- China
- Japan
- India
- South Korea
- South-east Asia
- Rest of Asia Pacific
- Latin America
- Brazil
- Argentina
- Rest of Latin America
- Middle East & Africa
- GCC Countries
- South Africa
- Rest of the Middle East and Africa
Competitive Landscape
The Aramid Paper Market demonstrates a moderately concentrated landscape, with a few major companies holding substantial shares due to their strong technological capabilities and established distribution networks. It exhibits characteristics of high entry barriers, including significant capital requirements, advanced manufacturing expertise, and the need for consistent product quality. The market favors players who can invest in research and development, leading to continuous product innovation and improved performance attributes. Intense competition among leading firms drives advancements in insulation, thermal stability, and durability, which are critical for demanding end-use sectors. The market is marked by long-term contracts with key customers in electrical, automotive, and aerospace industries, promoting stable demand and recurring business. It faces supply-side challenges related to raw material availability and cost fluctuations. It aligns closely with industry certifications and regulatory standards, ensuring reliability and safety across applications. The preference for high-performance and sustainable materials supports ongoing market evolution and shapes future opportunities.
Key Player Analysis
- DuPont
- Shenzhen Longpont Co., Ltd.
- TEIJIN ARAMID B.V.
- SRO Aramid (Jiangsu) Co.
- Yantai Tayho Advanced Materials Co., Ltd.
- Kermel
- Huvis Corporation
- Liren Electrical Insulation Materials PTE Ltd.
- WJF Chemicals Co., Ltd.
Recent Developments
- In January 2024, DuPont partnered with Point Blank Enterprises (PBE), a provider of protective solutions for military and law enforcement professionals, to offer body armor made with Kevlar EXO aramid fiber for the state and local law enforcement departments in North America
- In 2023, Kolon Industries Inc. announced plans to double the output of its para-aramid products by the end of 2023 through the expansion of its Gumi plant to respond to surging demand. The expansion is expected to increase the production capacity to 15,000 tons per year from 7,500 tons.
- In 2022, DuPont introduced a new product called Kevlar N636 1 mil paper, which is an affordable and easy-to-use solution for aerospace customers looking to make honeycomb core panels that are 20% lighter or more. This can result in lower operating costs for aircraft, increased range or payload, and a reduced carbon footprint.
Market Concentration & Characteristics
The competitive landscape of the Aramid Paper market features a mix of global leaders and specialized regional players, each focusing on technological advancement and product quality. DuPont maintains a dominant position, leveraging its strong research capabilities and extensive product portfolio to set industry benchmarks. Companies such as TEIJIN ARAMID B.V., Yantai Tayho Advanced Materials Co., Ltd., and Kermel have established robust manufacturing operations and continuously invest in expanding their product lines for electrical insulation, automotive, and aerospace sectors. Competition is fueled by the introduction of advanced grades, improvements in manufacturing efficiency, and investment in research and development. Companies actively pursue partnerships and collaborations to access new technologies and extend their market reach. The landscape also sees efforts to balance quality with cost-effectiveness, reflecting the growing need for reliable and affordable high-performance materials across diverse application sectors.
Report Coverage
The research report offers an in-depth analysis based on Product Type, Application, and Geography. It details leading market players, providing an overview of their business, product offerings, investments, revenue streams, and key applications. Additionally, the report includes insights into the competitive environment, SWOT analysis, current market trends, as well as the primary drivers and constraints. Furthermore, it discusses various factors that have driven market expansion in recent years. The report also explores market dynamics, regulatory scenarios, and technological advancements that are shaping the industry. It assesses the impact of external factors and global economic changes on market growth. Lastly, it provides strategic recommendations for new entrants and established companies to navigate the complexities of the market.
Future Outlook
- The Aramid Paper Market will expand steadily due to rising demand in electrical insulation and automotive industries.
- Innovative grades offering enhanced thermal resistance and dielectric strength will drive product adoption.
- Manufacturers will invest in automation and scale up production to meet global infrastructure needs.
- Partnerships with electronics and aerospace OEMs will facilitate customized product development.
- Industry regulations and safety standards will increase adoption of certified high-performance materials.
- Manufacturers will explore bio-based and recyclable aramid alternatives to meet sustainability targets.
- Expansion into emerging markets will diversify regional revenue streams and reduce dependency on mature economies.
- Digitalization of supply chains will improve transparency and reduce production lead times.
- R&D efforts will focus on lightweighting to support electric vehicle and aerospace applications.
- Competitive pressure will intensify innovation and drive incremental cost reductions across the value chain.
Request a Free Sample
Fill in your details and we'll send you a free sample report.
- Sample data tables & charts
- Research methodology
Need a Custom Version of This Report?
Tailor the scope, geography, or segments to your exact requirements.
- Custom geography or segment scope
- Direct access to our analyst team
Frequently Asked Questions
What is the current size of the Aramid Paper Market?
What factors are driving the growth of the Aramid Paper Market?
What are some challenges faced by the Aramid Paper Market?
Who are the major players in the Aramid Paper Market?
Who are the major players in this market?
Table of Content
Chapter 1. Report Introduction
- 1.1 Report Description & Purpose
- 1.1.1 Report Title & Market Definition
- 1.1.2 Unique Selling Propositions (USP) & Key Differentiators
- 1.1.3 Value Proposition for Stakeholders
- 1.2 Research Objectives
- 1.2.1 Market Sizing Objectives (Volume & Revenue)
- 1.2.2 Segmentation Objectives
- 1.2.3 Competitive Intelligence Objectives
- 1.2.4 Forecast & Scenario Objectives
- 1.3 Report Scope
- 1.3.1 Aramid Paper Scope – Types & Subtypes Covered
- 1.3.2 Geographic Scope – Regions & Countries Covered
- 1.3.3 Historical Period, Base Year & Forecast Period (2024; forecast to the forecast period)
- 1.3.4 Inclusions & Exclusions
- 1.4 HS Code & Classification Framework
- 1.5 Currency, Units & Pricing Basis
- 1.6 Target Stakeholders
- 1.7 Limitations & Assumptions
Chapter 2. Executive Summary
- 2.1 Global Aramid Paper Market Snapshot
- 2.1.1 Market Size – Historical (2024) & Forecast (the forecast period) (2024: USD 766.7 million → forecast year: USD 1,093.8 million)
- 2.1.2 Volume & Revenue – Global Totals
- 2.1.3 Key Market Highlights – Top Five Facts
- 2.2 Aramid Paper Market Segmentation Snapshot
- 2.2.1 Market Split by Region – 2024 vs.
- 2.3 Competitive Snapshot
- 2.3.1 Top 10 Players by Revenue Share – 2024
- 2.3.2 Top 10 Players by Volume Share – 2024
- 2.3.3 Recent Strategic Developments (18-Month Summary)
- 2.4 Key Investment Highlights & Strategic Conclusions
Chapter 3. Aramid Paper Market Dynamics & Industry Analysis
- 3.1 Market Overview & Context
- 3.1.1 Aramid Paper Market Position in the Broader Automotive Value Chain
- 3.1.2 OEM vs. Replacement Market Dynamics
- 3.1.3 Market Maturity & Development Stage by Region
- 3.2 Aramid Paper Market Drivers
- 3.3 Aramid Paper Market Restraints & Challenges
- 3.4 Aramid Paper Market Opportunities
- 3.5 Porter's Five Forces Analysis
- 3.5.1 Threat of New Entrants
- 3.5.2 Bargaining Power of Suppliers
- 3.5.3 Bargaining Power of Buyers
- 3.5.4 Threat of Substitutes
- 3.5.5 Competitive Rivalry – Intensity Assessment
- 3.6 Aramid Paper Value Chain Analysis
- 3.6.1 Upstream – Raw Material/Input Suppliers
- 3.6.1.1 Raw Material/Input 1
- 3.6.1.2 Raw Material/Input 2
- 3.6.1.3 Raw Material/Input 3
- 3.6.2 Midstream – Production/Manufacturing/Service Delivery
- 3.6.2.1 Production/Process Overview
- 3.6.2.2 Key Facility Locations & Capacity by Manufacturer
- 3.6.3 Downstream – Distribution & End Consumer
- 3.6.3.1 Primary Channel – B2B/OEM
- 3.6.3.2 Secondary Channels – Dealer, Retail, Online, Direct
- 3.6.4 Value Chain Profitability Analysis
- 3.6.1 Upstream – Raw Material/Input Suppliers
- 3.7 PESTEL Analysis
- 3.7.1 Political Factors
- 3.7.2 Economic Factors
- 3.7.3 Social Factors
- 3.7.4 Technological Factors
- 3.7.5 Environmental Factors
- 3.7.6 Legal Factors
- 3.8 Aramid Paper Supply Chain Analysis
- 3.8.1 Raw Material/Input Supply Risk Assessment
- 3.8.2 Manufacturing Concentration Risk (Geographic Exposure)
- 3.8.3 Trade Disruption Impact Analysis
- 3.9 Regulatory & Policy Landscape
Note: The regulatory and policy landscape section covers regulations based on their applicability to the market, Aramid Paper category, geography, and scope of the study. Only regulatory frameworks with a material impact on operations, compliance, trade, sustainability, or market access are analyzed in detail.
Chapter 4. Key Investment Pockets & Opportunity Analysis
- 4.1 Aramid Paper Market Attractiveness Analysis
- 4.1.1 By Region – Investment Attractiveness Matrix (Volume × CAGR)
- 4.2 Absolute Revenue Growth Opportunity
- 4.2.1 By Region – Absolute USD Growth Through the forecast period
- 4.3 Incremental Volume Opportunity
- 4.3.1 By Region – Incremental Volume Through the forecast period
- 4.3.2 Segment – Incremental Volume
- 4.4 Emerging Submarket Opportunity Deep Dive (Subject to Applicability)
- 4.5 Emerging Market Opportunity Scorecards
- 4.5.1 United States
- 4.5.2 Europe
- 4.5.3 Asia
- 4.5.4 Middle East & Africa
Note: Emerging Market Opportunity Scorecards will be included based on relevance and strategic importance. Regions listed are indicative and may vary depending on data availability and market dynamics.
Chapter 5. Aramid Paper Import-Export Analysis & Trade Flows
- 5.1 Global Trade Overview
- 5.1.1 Global Export Value by Country (2024)
- 5.1.2 Global Export Volume by Country (2024)
- 5.1.3 Global Import Value by Country (2024)
- 5.1.4 Global Import Volume by Country (2024)
- 5.1.5 Net Trade Balance by Country (2024)
- 5.2 Export Analysis – Segment
- 5.2.1 Type 1 (HS Code)
- 5.2.2 Type 2 (HS Code)
- 5.2.3 Type 3 (HS Code)
- 5.2.4 Type 4 (HS Code)
- 5.2.5 Type 5 (HS Code)
- 5.3 Import Analysis – Segment
- 5.3.1 Type 1 (HS Code)
- 5.3.2 Type 2 (HS Code)
- 5.3.3 Type 3 (HS Code)
- 5.3.4 Type 4 (HS Code)
- 5.3.5 Type 5 (HS Code)
- 5.4 Average Unit Trade Prices
- 5.4.1 Average Export Price – Segment & Country
- 5.4.2 Average Import Price – Segment & Source Country
- 5.4.3 Price Trends (2024)
- 5.5 Key Trade Route Analysis
- 5.5.1 Trade Route 1
- 5.5.2 Trade Route 2
- 5.5.3 Trade Route 3
- 5.5.4 Trade Route 4
- 5.5.5 Trade Route 5
- 5.6 Trade Policy Impact Assessment
- 5.6.1 US Anti-Dumping & Section 301 Tariffs
- 5.6.2 EU Customs Union Impact
- 5.6.3 Major Free Trade Agreements
- 5.6.4 USMCA Rules of Origin
Note: Trade policy analysis will be included only where relevant to the Aramid Paper market.
Chapter 6. Competitive Landscape & Company Benchmarking
- 6.1 Aramid Paper Market Concentration & Structure
- 6.1.1 Herfindahl-Hirschman Index (HHI) – vs. 2024
- 6.1.2 Tier 1, Tier 2 & Tier 3 Market Structure
- 6.1.3 Global, Regional & Local Player Dynamics
- 6.2 Aramid Paper Market Share Analysis – 2024
- 6.2.1 Global Revenue Share by Company
- 6.2.2 Global Volume Share by Company
- 6.2.3 Regional Revenue Share
- 6.2.4 Market Share Evolution ( vs. 2024)
- 6.2.5 OEM Segment Share by Company
- 6.2.6 Replacement Segment Share by Company
- 6.3 Production/Delivery Capacity & Facility Analysis
- 6.3.1 Global Installed Capacity
- 6.3.2 Capacity Utilization Rates
- 6.3.3 Production/Output Volume
- 6.3.4 Facility Locations & Capacity Map
- 6.3.5 Planned Capacity Additions
- 6.4 Aramid Paper Competitive Benchmarking Matrix
- 6.4.1 Revenue, Volume, CAGR & Profitability Comparison
- 6.4.2 Channel Revenue Mix
- 6.4.3 Geographic Revenue Exposure
- 6.4.4 R&D Intensity
- 6.4.5 Sustainability Maturity
- 6.5 Strategic Developments in Aramid Paper (Last 24 Months)
- 6.5.1 Mergers, Acquisitions & Divestments
- 6.5.2 New Aramid Paper Launches
- 6.5.3 Facility Expansions
- 6.5.4 Strategic Alliances, Joint Ventures & Partnerships
- 6.5.5 Distribution Expansion & Market Entry
- 6.5.6 Sustainability & ESG Initiatives
- 6.6 Competitive Strategy Mapping
- 6.6.1 Leader, Challenger, Follower & Niche Classification
- 6.6.2 Pricing Strategy Comparison
- 6.6.3 Channel Strategy Matrix
Note: Strategic developments are included based on their materiality and the availability of reliable information.
Chapter 7. Global Aramid Paper Market – By Distribution Channel
- 7.1 Segment Overview
- 7.1.1 Volume & Revenue Split by Channel (2024 & )
- 7.1.2 Channel Mix Evolution (the forecast period)
Chapter 8. Regional Market Analysis – Global Overview
- 8.1 Global Regional Overview
- 8.1.1 Regional Volume Share
- 8.1.2 Regional Revenue Share
- 8.1.3 Regional Volume by Region
- 8.1.4 Regional Revenue by Region
- 8.1.5 Regional Forecast Through the forecast period
- 8.2 Cross-Regional Segment Analysis
- 8.2.1 By Distribution Channel
- 8.2.2 By Brand/Price Tier
Chapter 9. North America Aramid Paper Market
- 9.1 United States
- 9.2 Canada
- 9.3 Mexico
Chapter 10. Europe Aramid Paper Market
- 10.1 Germany
- 10.2 France
- 10.3 Italy
- 10.4 United Kingdom
- 10.5 Spain
- 10.6 Poland
- 10.7 Russia
- 10.8 Netherlands
- 10.9 Belgium
- 10.10 Sweden
- 10.11 Denmark
- 10.12 Norway
- 10.13 Rest of Europe
Chapter 11. Asia Pacific Aramid Paper Market
- 11.1 China
- 11.2 India
- 11.3 Japan
- 11.4 South Korea
- 11.5 Thailand
- 11.6 Indonesia
- 11.7 Vietnam
- 11.8 Malaysia
- 11.9 Australia
- 11.10 Rest of Asia Pacific
Chapter 12. Latin America Aramid Paper Market
- 12.1 Brazil
- 12.2 Argentina
- 12.3 Colombia
- 12.4 Chile
- 12.5 Rest of Latin America
Chapter 13. Middle East Aramid Paper Market
- 13.1 Saudi Arabia
- 13.2 United Arab Emirates
- 13.3 Turkey
- 13.4 Israel
- 13.5 Iran
- 13.6 Rest of the Middle East
Chapter 14. Africa Aramid Paper Market
- 14.1 South Africa
- 14.2 Egypt
- 14.3 Nigeria
- 14.4 Morocco
- 14.5 Rest of Africa
Chapter 15. Aramid Paper Company Profiles
- 15.1 [Company 01]
- 15.1.1 Company Overview
- 15.1.2 Key Management Personnel
- 15.1.3 Products & Services Portfolio
- 15.1.4 Financial Performance
- 15.1.5 Key Market Focus & Geographic Presence
- 15.1.6 Recent Developments & Strategic Initiatives
Note: The company profile list is preliminary and may change based on research findings, market developments, data availability, and client requirements.
Chapter 16. Appendices
- Appendix A – List of Abbreviations & Acronyms
- Appendix B – Industry Classification Code Reference – Full Series
- Appendix C – Production & Capacity Data Tables
- Appendix D – End-Use & Demand Base Tables
- Appendix E – Consumption & Replacement Rate Assumptions
- Appendix F – ASP Reference Tables
- Appendix G – Manufacturing & Facility Database
- Appendix H – Import-Export Data Tables
- Appendix I – Regulatory Summary Tables
- Appendix J – Primary Research Participant List (Anonymized)
- Appendix K – Primary Research Questionnaire Framework
- Appendix L – Data Sources & Bibliography
- Appendix M – Market Size Divergence & Source Comparison
Chapter 17. Research Methodology
- 17.1 Research Framework & Philosophy
- 17.2 Secondary Research – Sources, Hierarchy & Data Extraction
- 17.3 Data Modeling – Bottom-Up & Top-Down Market Sizing
- 17.4 Primary Research – Stakeholder Framework, LOI & Sample Sizes
- 17.5 Forecast Methodology – Regression, Scenario & Sensitivity Analysis
- 17.6 Quality Control – Four-Layer Validation Framework
- 17.7 Limitations & Standard Assumptions
- 17.8 Disclaimer
