
Biopesticides Market Overview:
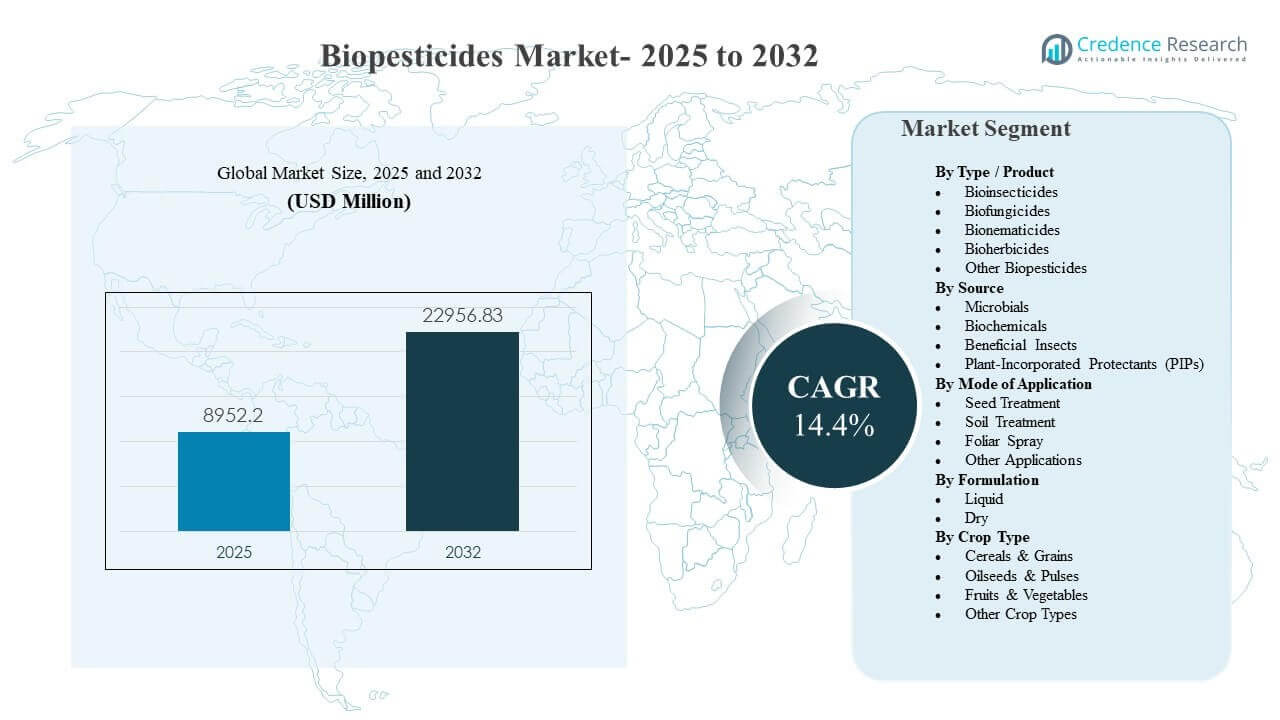
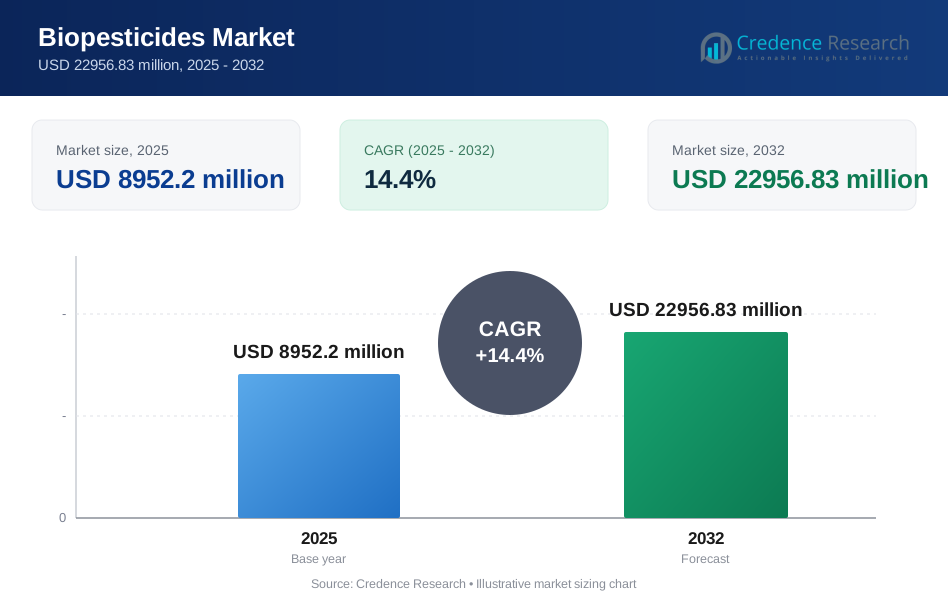
The global Biopesticides Market size was estimated at USD 8952.2 million in 2025 and is expected to reach USD 22956.83 million by 2032, growing at a CAGR of 14.4% from 2025 to 2032. Growth is primarily driven by rising adoption of integrated pest management programs as growers seek effective pest and disease control solutions with improved safety and residue profiles for domestic consumption and export supply chains. Commercialization is also accelerating as manufacturers expand portfolios across microbial and biochemical actives and improve product consistency through better formulation and application compatibility across both specialty crops and broad-acre row crops.
| REPORT ATTRIBUTE | DETAILS |
|---|---|
| Historical Period | 2020-2024 |
| Base Year | 2025 |
| Forecast Period | 2026-2032 |
| Biopesticides Market Size 2025 | USD 8952.2 million |
| Biopesticides Market, CAGR | 14.4% |
| Biopesticides Market Size 2032 | USD 22956.83 million |
Key Market Trends & Insights
- The Biopesticides Market is projected to expand from USD 8952.2 million in 2025 to USD 22956.83 million by 2032, registering 14.4% CAGR over 2025–2032.
- Biofungicides accounted for the largest share of 39.2% in 2025, supported by sustained fungal disease pressure across high-value cropping systems.
- Microbials represented 50.9% share in 2025, reflecting strong alignment with IPM programs and continued innovation in strains and formulation stability.
- Seed treatment held 41.0% share in 2025, underpinned by demand for early-stage protection and predictable integration into seed processing workflows.
- North America led the regional landscape with a 37.8% share in 2025, indicating mature commercialization, wider distribution, and stronger adoption across conventional and sustainable programs.
Segment Analysis
The Biopesticides Market is shaped by rising demand for biological alternatives that can be integrated into conventional crop protection programs, supported by improved product performance and broader registration coverage across crops and pests. Microbial solutions remain central to adoption because they can provide targeted activity and fit well into resistance management and rotation strategies. Seed treatment is a major usage route due to its operational efficiency and the ability to protect crops during early establishment, which improves field stand and reduces dependence on repeated in-season applications.
Product-led momentum is strongest in biofungicides, where disease pressure and crop value density make consistent biological use economically viable for growers. Across formulation choices, liquid formats are increasingly preferred for compatibility with existing mixing, dosing, and sprayer systems, although dry formats retain relevance in specific supply chains and storage conditions. Crop adoption is broadening beyond specialty fruits and vegetables toward cereals and grains as suppliers enhance field reliability, distribution scale, and technical advisory support for broad-acre growers.
By Type / Product Insights
Biofungicides accounted for the largest share of 39.2% in 2025. This leadership is supported by persistent fungal disease incidence across horticulture and row crops, where yield quality and marketability risks are high. Biofungicides are also increasingly positioned within resistance management programs as complementary tools to conventional chemistry rotation. Expanded labels, improved shelf-life, and better tank-mix compatibility are strengthening repeat usage and grower confidence.
By Source Insights
Microbials accounted for the largest share of 50.9% in 2025. Microbial actives are widely adopted due to their targeted modes of action and fit with integrated pest management approaches across multiple crop types. Advances in strain selection, fermentation scale-up, and formulation stabilization have improved performance consistency under variable field conditions. Stronger distributor networks and on-farm advisory programs also support broader penetration and correct-use practices.
By Mode of Application Insights
Seed Treatment accounted for the largest share of 41.0% in 2025. This approach leads because it provides early-stage protection against soilborne pests and pathogens with minimal changes to farm operations. Seed treatment also supports consistent dose delivery and predictable coverage, which is critical for large-scale deployment in cereals and grains. Increasing availability of compatible biological seed-applied products is reinforcing adoption across commercial seed systems.
By Formulation Insights
Liquid formulations are widely preferred because they integrate smoothly into existing mixing and application systems and enable flexible dosing strategies across crop stages. Liquids also tend to support easier handling at farm and distributor levels, which can improve compliance and reduce preparation time. Ongoing innovation in stabilizers and carriers is improving shelf-life and field persistence, which enhances perceived reliability. Dry formulations remain relevant where storage stability, transport constraints, or specific delivery mechanisms favor dry handling.
By Crop Type Insights
Cereals & Grains accounted for the largest share of 41.6% in 2025. Large acreage coverage and recurring pest and disease pressure create a strong baseline demand for biological solutions as complementary tools. Commercial focus is shifting toward broad-acre deployment, supported by better product positioning, distributor availability, and agronomic guidance for correct timing. Residue compliance and sustainability targets in grain supply chains further strengthen adoption across key growing regions.
Biopesticides Market Drivers
Expansion of integrated pest management adoption
Integrated pest management adoption is accelerating as growers seek balanced programs that reduce resistance risks and maintain long-term efficacy. Biopesticides fit these programs because they can complement conventional actives and provide differentiated modes of action. Wider availability of biological solutions across pest and disease targets is improving feasibility across crop calendars. Increased advisory support from distributors and manufacturers is also improving application timing and outcomes. This combination is strengthening repeat purchase behavior and long-term adoption.
- For instance, ICAR-released Trichoderma-based products in India have demonstrated 45–55% reduction in key diseases such as spot blotch in wheat and sheath blight in rice, alongside 15–25% reductions in chemical pesticide use at farm level.
Tightening residue expectations in food supply chains
Food buyers and export channels increasingly require compliance with stricter residue expectations and sustainability reporting. Biopesticides are often positioned as tools to help meet these requirements while maintaining crop protection coverage. Growers adopt biologicals to support pre-harvest intervals, quality protection, and market access for high-value crops. Retail and processor standards reinforce demand for residue-conscious programs across fruits, vegetables, and selected row crops. These dynamics continue to lift demand across multiple regions.
- For instance, programs using biologicals in the final 7–14 days before harvest have enabled growers to comply with tighter pre-harvest intervals while still maintaining disease control levels comparable to full-chemical programs.
Improving product performance through formulation and delivery innovation
Performance consistency has historically been a key barrier, but product development is improving stability, shelf-life, and field persistence. Advances in formulation systems, carriers, and application compatibility are improving reliability across variable conditions. Seed treatment compatibility strengthens scale-up because it integrates into established commercial seed workflows. Better mixing properties and tank-mix fit expand in-season usability via foliar sprays and soil applications. These improvements reduce perceived risk and support broader commercial rollouts.
Portfolio expansion and commercialization by large agribusiness players
Major crop protection companies and specialized biological firms are expanding portfolios through internal R&D, acquisitions, and partnerships. Broader portfolios enable bundling and program-based selling, which simplifies decision-making for growers. Expanded distribution reach improves product availability and technical support in key agricultural regions. Increased marketing investment and field trial data strengthen trust in biological solutions. Together, these factors accelerate adoption and deepen penetration across crop segments.
Biopesticides Market Challenges
Biopesticides adoption faces ongoing challenges related to variable performance under different environmental and agronomic conditions. Biological actives can be sensitive to temperature, UV exposure, and storage conditions, which can affect field efficacy and grower confidence. Regulatory pathways and product registration requirements vary widely by country, adding time and cost burdens for expansion. Farmer awareness and correct-use practices can be inconsistent, especially where advisory services are limited. These factors can slow repeat usage and scaling in certain markets.
- For instance, Certis Biologicals reported that its Bacillus-based fungicide Double Nickel showed more than a 30 percentage point drop in disease control when trials were shifted from shaded to full-sun, high-UV plots, underscoring sensitivity to field conditions.
Cost and value perception remains a barrier in price-sensitive regions and broad-acre cropping where growers prioritize predictable return on investment. Biological products may require more precise timing, higher application frequency, or supportive agronomic practices to deliver consistent outcomes. Supply chain constraints, including cold-chain or storage requirements for specific microbial products, can also limit distribution reach. Competition from established chemical solutions can reduce switching intent, particularly during severe pest outbreaks. Addressing these issues requires stronger field data, training, and improved product robustness.
Biopesticides Market Trends and Opportunities
Commercial programs are increasingly structured around integrated solutions that combine biologicals with conventional products, rather than positioning biologicals as direct replacements. This creates opportunity for program selling, bundled offerings, and season-long crop plans that improve outcomes and simplify grower decisions. Seed treatment remains an important gateway for scaling biologicals in cereals and grains because it allows standardized delivery at scale. Improving compatibility with farm equipment and mixing routines supports adoption with minimal operational friction. These shifts expand addressable acreage beyond traditional specialty crop strongholds.
- For instance, Bayer’s Acceleron seed-applied technologies bundle biological inoculants with fungicides and insecticides on more than 90 million acres of corn and soybeans annually in North America to deliver standardized, multi-mode protection.
There is also growing opportunity in differentiated biofungicide and microbial pipelines as suppliers improve strain discovery and stability. Partnerships between biological innovators and global crop protection players can accelerate commercialization and distribution reach. Adoption in export-oriented horticulture is supported by residue-sensitive supply chains and quality requirements that favor biological integration. Emerging markets provide long-term upside as distribution networks improve and local regulatory frameworks mature. Continued technical training and advisory support can amplify value realization and strengthen grower retention.
Regional Insights
North America
North America accounted for 37.8% share in 2025. The region benefits from strong commercialization capabilities, established distributor networks, and higher adoption of integrated pest management programs. Growers increasingly integrate biologicals into rotation strategies to support resistance management and residue expectations in select value chains. Seed treatment use is supported by mature commercial seed systems and standardized application workflows. Product adoption is also supported by strong field trial activity and technical support availability.
Europe
Europe accounted for 16.1% share in 2025. The market is supported by strong sustainability focus and greater willingness to incorporate biologicals into crop protection programs, especially in horticulture. Fragmentation across countries and crop profiles can create uneven adoption rates, making local distribution and advisory strength critical. Demand is reinforced by programs emphasizing reduced chemical load and improved environmental compatibility. Expansion opportunities are strongest where suppliers can deliver consistent performance and clear use guidance across diverse climates and agronomic practices.
Asia Pacific
Asia Pacific accounted for 34.6% share in 2025. Large agricultural acreage, expanding horticulture production, and rising focus on crop quality are supporting biological adoption across multiple countries. Increasing commercialization and product availability are helping shift biologicals from niche use toward broader crop programs. Adoption is strengthened by demand for pest and disease control solutions aligned with evolving food safety expectations. Growth is also supported by improving distributor coverage and rising technical assistance in high-production belts.
Latin America
Latin America accounted for 5.2% share in 2025. The region’s demand is linked to export-driven crop systems where quality and compliance requirements support biopesticide adoption. Uptake is strongest where biological solutions demonstrate consistent performance and fit within established spray and soil treatment routines. Distribution reach and agronomic advisory capacity can vary by country, affecting adoption speed. Opportunities are supported by expanded registrations and program-based selling into high-value crop segments.
Middle East & Africa
Middle East & Africa accounted for 6.3% share in 2025. Demand is driven by intensifying horticulture production and rising focus on quality outcomes in controlled and semi-controlled growing systems. Adoption is constrained by affordability considerations and uneven access to specialized distribution and technical training. Biological solutions gain traction where suppliers provide robust guidance on timing and integrated program design. Improving supply chains and localized product positioning can support broader market development over the forecast period.
Competitive Landscape
Competition in the Biopesticides Market is shaped by portfolio breadth, technical performance, distribution depth, and the ability to provide agronomic support that drives correct-use outcomes. Companies differentiate through strain discovery, formulation improvements, and expanded label coverage across crops and pest targets. Partnerships and acquisitions are commonly used to accelerate pipeline expansion and improve regional commercialization capabilities. Strong field validation programs and advisory networks are critical to building grower confidence and increasing repeat usage. Pricing and program integration strategies also influence adoption, particularly in broad-acre cropping systems.
BASF SE is positioned to strengthen its biological crop protection footprint through portfolio expansion and commercialization focus across insect and disease control solutions. The company’s approach typically emphasizes scaling distribution reach, improving formulation performance, and integrating biologicals into broader crop protection programs. Progress in this space is supported by strategic collaborations and acquisitions that enhance biological innovation and manufacturing capabilities. BASF SE’s emphasis on field performance and program selling aligns with grower priorities for predictable outcomes. This positioning supports deeper penetration across both specialty and selected broad-acre crops.
The industry research and growth report includes detailed analyses of the competitive landscape of the market and information about key companies, including:
- BASF SE
- Bayer AG
- Syngenta Group
- UPL Ltd.
- Corteva Agriscience
- FMC Corporation
- Valent BioSciences LLC
- Koppert Biological Systems
- Marrone Bio Innovations (MBI)
- Certis Biologicals
- Sumitomo Chemical Co., Ltd.
- AgBiome
- Andermatt Group AG
- Lallemand Plant Care
Qualitative and quantitative analysis of companies has been conducted to help clients understand the wider business environment as well as the strengths and weaknesses of key industry players. Data is qualitatively analyzed to categorize companies as pure play, category-focused, industry-focused, and diversified; it is quantitatively analyzed to categorize companies as dominant, leading, strong, tentative, and weak.
Recent Developments
- In March 2026, Syngenta Crop Protection signed a Memorandum of Understanding with French greentech company Amoéba SA to develop and commercialize biocontrol solutions based on Amoéba’s biocontrol active substance for cereals and field crops in the EU and UK, aiming to offer advanced biological crop protection options and address resistance challenges in the biopesticides space.
- In January 2026, BASF Agricultural Solutions announced that it had reached an agreement to acquire AgBiTech, a specialist in biological insect control solutions, expanding BASF’s portfolio in the biopesticides and broader biological crop protection market; the transaction is expected to close in the first half of 2026, subject to regulatory approvals.
- In May 2025, Super Growers launched Omnicide IPM, a next‑generation biopesticide formulated with advanced nano‑emulsion technology that combines essential oils to deliver safer, more effective control of pests, fungi, and spores for farms of all sizes.
- In November 2025, Corteva announced its first bioinsecticide as part of a suite of “nature‑inspired solutions” designed to protect crops such as apples, oranges, wheat, rice, and corn, reinforcing the company’s strategy to grow its biological crop protection and biopesticides offering.
Report Scope
| Report Attribute | Details |
| Market size value in 2025 | USD 8952.2 million |
| Revenue forecast in 2032 | USD 22956.83 million |
| Growth rate (CAGR) | 14.4% (2025–2032) |
| Base year | 2025 |
| Forecast period | 2026-2032 |
| Quantitative units | USD million |
| Segments covered | By Type / Product Outlook: Bioinsecticides, Biofungicides, Bionematicides, Bioherbicides, Other Biopesticides; By Source Outlook: Microbials, Biochemicals, Beneficial Insects, Plant-Incorporated Protectants (PIPs); By Mode of Application Outlook: Seed Treatment, Soil Treatment, Foliar Spray, Other Applications; By Formulation Outlook: Liquid, Dry; By Crop Type Outlook: Cereals & Grains, Oilseeds & Pulses, Fruits & Vegetables, Other Crop Types |
| Regional scope | North America, Europe, Asia Pacific, Latin America, Middle East & Africa |
| Key companies profiled | BASF SE; Bayer AG; Syngenta Group; UPL Ltd.; Corteva Agriscience; FMC Corporation; Valent BioSciences LLC; Koppert Biological Systems; Marrone Bio Innovations (MBI); Certis Biologicals; Sumitomo Chemical Co., Ltd.; AgBiome; Andermatt Group AG; Lallemand Plant Care. |
| No.of Pages | 327 |
Segmentation
By Type / Product
- Bioinsecticides
- Biofungicides
- Bionematicides
- Bioherbicides
- Other Biopesticides
By Source
- Microbials
- Biochemicals
- Beneficial Insects
- Plant-Incorporated Protectants (PIPs)
By Mode of Application
- Seed Treatment
- Soil Treatment
- Foliar Spray
- Other Applications
By Formulation
- Liquid
- Dry
By Crop Type
- Cereals & Grains
- Oilseeds & Pulses
- Fruits & Vegetables
- Other Crop Types
By Region
- North America
- U.S.
- Canada
- Mexico
- Europe
- Germany
- France
- U.K.
- Italy
- Spain
- Rest of Europe
- Asia Pacific
- China
- Japan
- India
- South Korea
- South-east Asia
- Rest of Asia Pacific
- Latin America
- Brazil
- Argentina
- Rest of Latin America
- Middle East & Africa
- GCC Countries
- South Africa
- Rest of the Middle East and Africa
Request a Free Sample
Fill in your details and we'll send you a free sample report.
- Sample data tables & charts
- Research methodology
Need a Custom Version of This Report?
Tailor the scope, geography, or segments to your exact requirements.
- Custom geography or segment scope
- Direct access to our analyst team
Frequently Asked Questions
What is the market size of the Biopesticides Market in 2025 and the forecast for 2032?
What is the CAGR for the Biopesticides Market during 2025–2032?
Which is the largest segment in the Biopesticides Market?
What factors are driving growth in the Biopesticides Market?
Who are the leading companies in the Biopesticides Market?
Which region leads the Biopesticides Market in 2025?
Table of Content
Chapter 1. Report Introduction
- 1.1 Report Description & Purpose
- 1.1.1 Report Title & Market Definition
- 1.1.2 Unique Selling Propositions (USP) & Key Differentiators
- 1.1.3 Value Proposition for Stakeholders
- 1.2 Research Objectives
- 1.2.1 Market Sizing Objectives (Volume & Revenue)
- 1.2.2 Segmentation Objectives
- 1.2.3 Competitive Intelligence Objectives
- 1.2.4 Forecast & Scenario Objectives
- 1.3 Report Scope
- 1.3.1 Biopesticides Scope – Types & Subtypes Covered
- 1.3.2 Geographic Scope – Regions & Countries Covered
- 1.3.3 Historical Period, Base Year & Forecast Period (2025; forecast to 2032)
- 1.3.4 Inclusions & Exclusions
- 1.4 HS Code & Classification Framework
- 1.5 Currency, Units & Pricing Basis
- 1.6 Target Stakeholders
- 1.7 Limitations & Assumptions
Chapter 2. Executive Summary
- 2.1 Global Biopesticides Market Snapshot
- 2.1.1 Market Size – Historical (2025) & Forecast (2025-2032) (2025: USD 8952.2 million → 2032: USD 22956.83 million)
- 2.1.2 Volume & Revenue – Global Totals
- 2.1.3 Key Market Highlights – Top Five Facts
- 2.2 Biopesticides Market Segmentation Snapshot
- 2.2.1 Market Split by Region – 2025 vs. 2032
- 2.3 Competitive Snapshot
- 2.3.1 Top 10 Players by Revenue Share – 2025
- 2.3.2 Top 10 Players by Volume Share – 2025
- 2.3.3 Recent Strategic Developments (18-Month Summary)
- 2.4 Key Investment Highlights & Strategic Conclusions
Chapter 3. Biopesticides Market Dynamics & Industry Analysis
- 3.1 Market Overview & Context
- 3.1.1 Biopesticides Market Position in the Broader Automotive Value Chain
- 3.1.2 OEM vs. Replacement Market Dynamics
- 3.1.3 Market Maturity & Development Stage by Region
- 3.2 Biopesticides Market Drivers
- 3.3 Biopesticides Market Restraints & Challenges
- 3.4 Biopesticides Market Opportunities
- 3.5 Porter's Five Forces Analysis
- 3.5.1 Threat of New Entrants
- 3.5.2 Bargaining Power of Suppliers
- 3.5.3 Bargaining Power of Buyers
- 3.5.4 Threat of Substitutes
- 3.5.5 Competitive Rivalry – Intensity Assessment
- 3.6 Biopesticides Value Chain Analysis
- 3.6.1 Upstream – Raw Material/Input Suppliers
- 3.6.1.1 Raw Material/Input 1
- 3.6.1.2 Raw Material/Input 2
- 3.6.1.3 Raw Material/Input 3
- 3.6.2 Midstream – Production/Manufacturing/Service Delivery
- 3.6.2.1 Production/Process Overview
- 3.6.2.2 Key Facility Locations & Capacity by Manufacturer
- 3.6.3 Downstream – Distribution & End Consumer
- 3.6.3.1 Primary Channel – B2B/OEM
- 3.6.3.2 Secondary Channels – Dealer, Retail, Online, Direct
- 3.6.4 Value Chain Profitability Analysis
- 3.6.1 Upstream – Raw Material/Input Suppliers
- 3.7 PESTEL Analysis
- 3.7.1 Political Factors
- 3.7.2 Economic Factors
- 3.7.3 Social Factors
- 3.7.4 Technological Factors
- 3.7.5 Environmental Factors
- 3.7.6 Legal Factors
- 3.8 Biopesticides Supply Chain Analysis
- 3.8.1 Raw Material/Input Supply Risk Assessment
- 3.8.2 Manufacturing Concentration Risk (Geographic Exposure)
- 3.8.3 Trade Disruption Impact Analysis
- 3.9 Regulatory & Policy Landscape
Note: The regulatory and policy landscape section covers regulations based on their applicability to the market, Biopesticides category, geography, and scope of the study. Only regulatory frameworks with a material impact on operations, compliance, trade, sustainability, or market access are analyzed in detail.
Chapter 4. Key Investment Pockets & Opportunity Analysis
- 4.1 Biopesticides Market Attractiveness Analysis
- 4.1.1 By Region – Investment Attractiveness Matrix (Volume × CAGR)
- 4.2 Absolute Revenue Growth Opportunity
- 4.2.1 By Region – Absolute USD Growth Through 2032
- 4.3 Incremental Volume Opportunity
- 4.3.1 By Region – Incremental Volume Through 2032
- 4.3.2 Segment – Incremental Volume
- 4.4 Emerging Submarket Opportunity Deep Dive (Subject to Applicability)
- 4.5 Emerging Market Opportunity Scorecards
- 4.5.1 United States
- 4.5.2 Europe
- 4.5.3 Asia
- 4.5.4 Middle East & Africa
Note: Emerging Market Opportunity Scorecards will be included based on relevance and strategic importance. Regions listed are indicative and may vary depending on data availability and market dynamics.
Chapter 5. Biopesticides Import-Export Analysis & Trade Flows
- 5.1 Global Trade Overview
- 5.1.1 Global Export Value by Country (2025)
- 5.1.2 Global Export Volume by Country (2025)
- 5.1.3 Global Import Value by Country (2025)
- 5.1.4 Global Import Volume by Country (2025)
- 5.1.5 Net Trade Balance by Country (2025)
- 5.2 Export Analysis – Segment
- 5.2.1 Type 1 (HS Code)
- 5.2.2 Type 2 (HS Code)
- 5.2.3 Type 3 (HS Code)
- 5.2.4 Type 4 (HS Code)
- 5.2.5 Type 5 (HS Code)
- 5.3 Import Analysis – Segment
- 5.3.1 Type 1 (HS Code)
- 5.3.2 Type 2 (HS Code)
- 5.3.3 Type 3 (HS Code)
- 5.3.4 Type 4 (HS Code)
- 5.3.5 Type 5 (HS Code)
- 5.4 Average Unit Trade Prices
- 5.4.1 Average Export Price – Segment & Country
- 5.4.2 Average Import Price – Segment & Source Country
- 5.4.3 Price Trends (2025)
- 5.5 Key Trade Route Analysis
- 5.5.1 Trade Route 1
- 5.5.2 Trade Route 2
- 5.5.3 Trade Route 3
- 5.5.4 Trade Route 4
- 5.5.5 Trade Route 5
- 5.6 Trade Policy Impact Assessment
- 5.6.1 US Anti-Dumping & Section 301 Tariffs
- 5.6.2 EU Customs Union Impact
- 5.6.3 Major Free Trade Agreements
- 5.6.4 USMCA Rules of Origin
Note: Trade policy analysis will be included only where relevant to the Biopesticides market.
Chapter 6. Competitive Landscape & Company Benchmarking
- 6.1 Biopesticides Market Concentration & Structure
- 6.1.1 Herfindahl-Hirschman Index (HHI) – vs. 2025
- 6.1.2 Tier 1, Tier 2 & Tier 3 Market Structure
- 6.1.3 Global, Regional & Local Player Dynamics
- 6.2 Biopesticides Market Share Analysis – 2025
- 6.2.1 Global Revenue Share by Company
- 6.2.2 Global Volume Share by Company
- 6.2.3 Regional Revenue Share
- 6.2.4 Market Share Evolution ( vs. 2025)
- 6.2.5 OEM Segment Share by Company
- 6.2.6 Replacement Segment Share by Company
- 6.3 Production/Delivery Capacity & Facility Analysis
- 6.3.1 Global Installed Capacity
- 6.3.2 Capacity Utilization Rates
- 6.3.3 Production/Output Volume
- 6.3.4 Facility Locations & Capacity Map
- 6.3.5 Planned Capacity Additions
- 6.4 Biopesticides Competitive Benchmarking Matrix
- 6.4.1 Revenue, Volume, CAGR & Profitability Comparison
- 6.4.2 Channel Revenue Mix
- 6.4.3 Geographic Revenue Exposure
- 6.4.4 R&D Intensity
- 6.4.5 Sustainability Maturity
- 6.5 Strategic Developments in Biopesticides (Last 24 Months)
- 6.5.1 Mergers, Acquisitions & Divestments
- 6.5.2 New Biopesticides Launches
- 6.5.3 Facility Expansions
- 6.5.4 Strategic Alliances, Joint Ventures & Partnerships
- 6.5.5 Distribution Expansion & Market Entry
- 6.5.6 Sustainability & ESG Initiatives
- 6.6 Competitive Strategy Mapping
- 6.6.1 Leader, Challenger, Follower & Niche Classification
- 6.6.2 Pricing Strategy Comparison
- 6.6.3 Channel Strategy Matrix
Note: Strategic developments are included based on their materiality and the availability of reliable information.
Chapter 7. Global Biopesticides Market – By Distribution Channel
- 7.1 Segment Overview
- 7.1.1 Volume & Revenue Split by Channel (2025 & 2032)
- 7.1.2 Channel Mix Evolution (2025-2032)
Chapter 8. Regional Market Analysis – Global Overview
- 8.1 Global Regional Overview
- 8.1.1 Regional Volume Share
- 8.1.2 Regional Revenue Share
- 8.1.3 Regional Volume by Region
- 8.1.4 Regional Revenue by Region
- 8.1.5 Regional Forecast Through 2032
- 8.2 Cross-Regional Segment Analysis
- 8.2.1 By Distribution Channel
- 8.2.2 By Brand/Price Tier
Chapter 9. North America Biopesticides Market
- 9.1 United States
- 9.2 Canada
- 9.3 Mexico
Chapter 10. Europe Biopesticides Market
- 10.1 Germany
- 10.2 France
- 10.3 Italy
- 10.4 United Kingdom
- 10.5 Spain
- 10.6 Poland
- 10.7 Russia
- 10.8 Netherlands
- 10.9 Belgium
- 10.10 Sweden
- 10.11 Denmark
- 10.12 Norway
- 10.13 Rest of Europe
Chapter 11. Asia Pacific Biopesticides Market
- 11.1 China
- 11.2 India
- 11.3 Japan
- 11.4 South Korea
- 11.5 Thailand
- 11.6 Indonesia
- 11.7 Vietnam
- 11.8 Malaysia
- 11.9 Australia
- 11.10 Rest of Asia Pacific
Chapter 12. Latin America Biopesticides Market
- 12.1 Brazil
- 12.2 Argentina
- 12.3 Colombia
- 12.4 Chile
- 12.5 Rest of Latin America
Chapter 13. Middle East Biopesticides Market
- 13.1 Saudi Arabia
- 13.2 United Arab Emirates
- 13.3 Turkey
- 13.4 Israel
- 13.5 Iran
- 13.6 Rest of the Middle East
Chapter 14. Africa Biopesticides Market
- 14.1 South Africa
- 14.2 Egypt
- 14.3 Nigeria
- 14.4 Morocco
- 14.5 Rest of Africa
Chapter 15. Biopesticides Company Profiles
- 15.1 [Company 01]
- 15.1.1 Company Overview
- 15.1.2 Key Management Personnel
- 15.1.3 Products & Services Portfolio
- 15.1.4 Financial Performance
- 15.1.5 Key Market Focus & Geographic Presence
- 15.1.6 Recent Developments & Strategic Initiatives
Note: The company profile list is preliminary and may change based on research findings, market developments, data availability, and client requirements.
Chapter 16. Appendices
- Appendix A – List of Abbreviations & Acronyms
- Appendix B – Industry Classification Code Reference – Full Series
- Appendix C – Production & Capacity Data Tables
- Appendix D – End-Use & Demand Base Tables
- Appendix E – Consumption & Replacement Rate Assumptions
- Appendix F – ASP Reference Tables
- Appendix G – Manufacturing & Facility Database
- Appendix H – Import-Export Data Tables
- Appendix I – Regulatory Summary Tables
- Appendix J – Primary Research Participant List (Anonymized)
- Appendix K – Primary Research Questionnaire Framework
- Appendix L – Data Sources & Bibliography
- Appendix M – Market Size Divergence & Source Comparison
Chapter 17. Research Methodology
- 17.1 Research Framework & Philosophy
- 17.2 Secondary Research – Sources, Hierarchy & Data Extraction
- 17.3 Data Modeling – Bottom-Up & Top-Down Market Sizing
- 17.4 Primary Research – Stakeholder Framework, LOI & Sample Sizes
- 17.5 Forecast Methodology – Regression, Scenario & Sensitivity Analysis
- 17.6 Quality Control – Four-Layer Validation Framework
- 17.7 Limitations & Standard Assumptions
- 17.8 Disclaimer
