
Market Overview
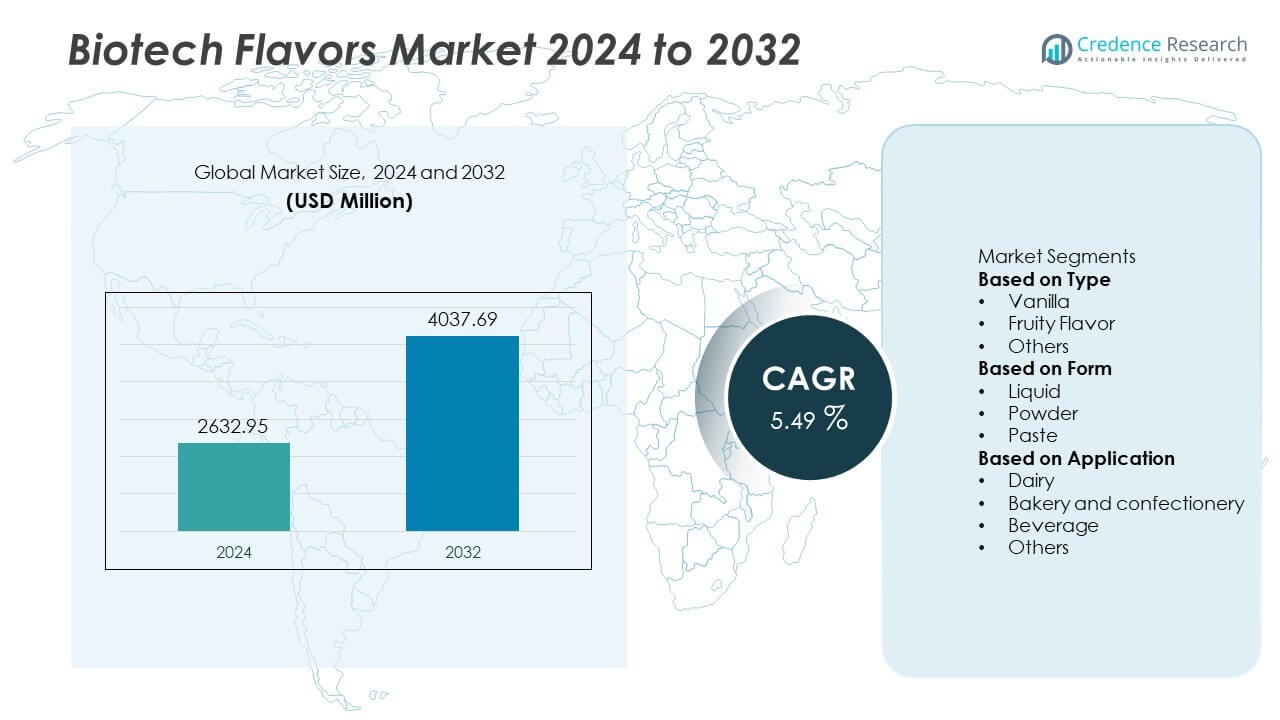
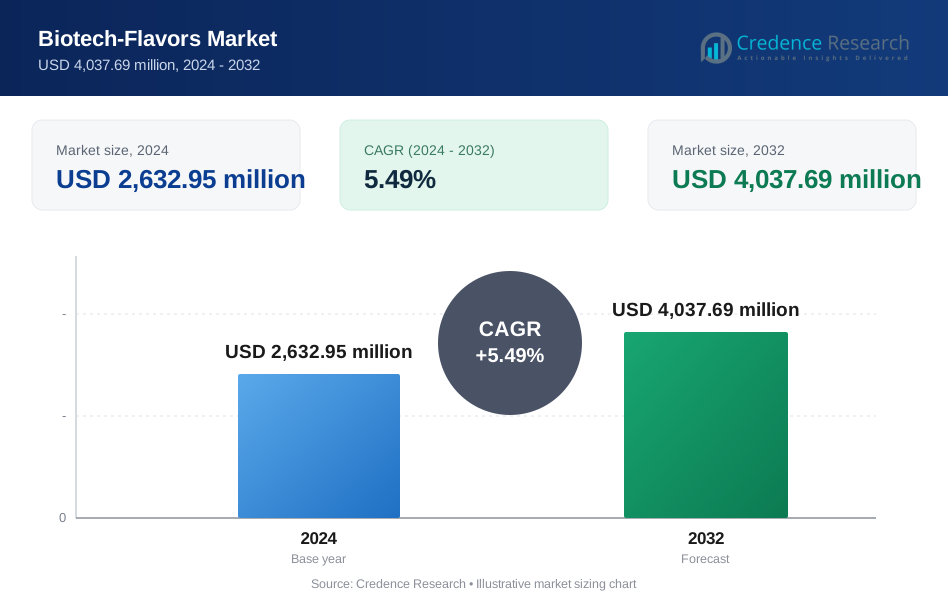
The Biotech Flavors Market reached USD 2,632.95 million in 2024 and is projected to rise to USD 4,037.69 million by 2032, registering a CAGR of 5.49% during the forecast period.
| REPORT ATTRIBUTE | DETAILS |
|---|---|
| Historical Period | 2020-2023 |
| Base Year | 2024 |
| Forecast Period | 2025-2032 |
| Biotech Flavors Market Size 2024 | USD 2,632.95 Million |
| Biotech Flavors Market, CAGR | 5.49% |
| Biotech Flavors Market Size 2032 | USD 4,037.69 Million |
The Biotech Flavors market includes leading players such as Givaudan SA, Firmenich SA, Symrise AG, International Flavors & Fragrances Inc. (IFF), Takasago International Corporation, Sensient Technologies Corporation, Kerry Group plc, Bell Flavors & Fragrances Inc., Flavorchem Corporation, and T. Hasegawa Co., Ltd. These companies strengthen their position through investments in fermentation technology, clean-label formulations, and sustainable flavor development. Asia Pacific stands as the leading region with a 33% share due to strong food manufacturing growth and rapid adoption of natural flavors. North America follows with a 31% share driven by high demand for clean-label and plant-based products, while Europe holds a 29% share supported by strict regulatory standards and mature R&D ecosystems.
Market Insights
- The Biotech Flavors market reached USD 2,632.95 million in 2024 and will grow at a CAGR of 5.49% through 2032.
- Demand rises as natural and clean-label ingredients drive vanilla, fruity, and other biotech flavors, with vanilla holding a 46% share and liquid formats leading with a 52% share.
- Trends strengthen around sustainable fermentation, plant-based product expansion, and flavor stability solutions supporting dairy, beverages, and bakery applications, with dairy holding a 39% share.
- Competition intensifies among Givaudan, Firmenich, Symrise, IFF, Takasago, and others as they expand fermentation capacity, improve purity, and strengthen global collaborations amid cost and regulatory restraints.
- Asia Pacific leads with a 33% regional share, followed by North America at 31%, Europe at 29%, Latin America at 4%, and Middle East & Africa at 3%, supported by rising clean-label adoption and stronger biotech flavor integration.
Market Segmentation Analysis:
By Type
Vanilla leads the Biotech Flavors market with a 46% share due to strong demand in dairy, confectionery, and beverage formulations. Vanilla benefits from clean-label trends and a stable supply enabled by biotech fermentation. Fruity flavors hold a growing share as brands develop natural fruit profiles for juices, yogurts, and flavored water. Other flavors expand steadily as product developers adopt biotechnology to enhance aroma stability and reduce reliance on seasonal raw materials. Strong interest in natural taste modulation further supports wider adoption across global food manufacturing.
- For instance, Givaudan leverages biotechnology, including fermentation, to produce natural vanillin as part of its palette of over 200 aroma molecules. The company uses these advanced methods to ensure a stable and consistent supply of high-purity ingredients, a critical advantage during potential crop shortages of natural vanilla beans, which only meet about 1% of the global vanillin demand.
By Form
The liquid form dominates the market with a 52% share because manufacturers prefer fast solubility and accurate dosing in large-scale production. Liquids support consistent flavor dispersion in beverages, dairy mixes, and sauces. Powdered biotech flavors occupy a notable share driven by longer shelf life and simple transport. Paste formats grow in niche bakery and dessert applications where concentrated aroma strength matters. Demand across all forms rises as processing facilities shift toward clean-label formulations and predictable, fermentation-based flavor supplies.
- For instance, Symrise operates its Nantong flavor production facility in China with an annual output capacity of 45,000 tons of flavors and fragrances, supporting large-scale liquid and powder flavor manufacturing.
By Application
Dairy holds the dominant position with a 39% share, supported by strong flavor use in ice creams, yogurts, flavored milk, and cheese snacks. Biotech flavors help achieve uniform taste, better stability, and reduced reliance on natural crop-derived extracts. Bakery and confectionery products show steady expansion as manufacturers use biotech alternatives to improve aroma consistency. Beverages adopt fermentation-based fruity and vanilla notes for juices, soft drinks, and energy drinks. Other applications grow as brands pursue natural flavors that meet regulatory expectations and support steady product innovation.
Key Growth Drivers
Rising Demand for Natural and Clean-Label Ingredients
The market grows as food and beverage companies shift toward natural, clean-label formulations. Biotech flavors provide consistent quality without dependence on crop cycles, making them a reliable alternative to traditional extraction. Brands use fermentation-derived vanilla, fruity notes, and specialty flavors to meet consumer expectations for transparency and safety. Regulatory support for natural flavor classifications further accelerates adoption. Growing preference for sustainable sourcing and reduced environmental impact strengthens demand across dairy, beverages, and confectionery.
- For instance, Evolva supplies fermentation-based vanillin with a production capacity that has been scaled up in recent years to meet growing demand for natural ingredients, ensuring stable availability during periods of vanilla bean shortages.
Advancements in Fermentation and Enzyme-Based Production
Improved fermentation and enzyme-engineering technologies enhance yield, purity, and flavor profile accuracy. These advancements allow producers to replicate complex natural aromas at scale, lowering production costs and ensuring stable supply. Enhanced microbial processes support faster development cycles and reduce variability in raw materials. Companies invest in precision fermentation systems to improve customization and shorten lead times. These innovations boost supply chain efficiency and allow manufacturers to respond rapidly to changing flavor trends.
- For instance, the global capacity for precision fermentation-derived product manufacturing is approximately 16 million liters across various producers, enabling high-purity flavor compound generation.
Expansion of Functional and Specialty Food Applications
The rising consumption of functional foods, protein-based snacks, and fortified beverages creates strong opportunities for biotech flavor integration. Formulators use biotech-based ingredients to mask off-notes from plant proteins, vitamins, and nutraceutical additives. These flavors offer stability under heat and pH variations, improving product performance in diverse applications. Growth in ready-to-drink beverages, clean-label bakery products, and dairy alternatives widens the adoption base. The trend supports increased flavor innovation and broadens market penetration across global food categories.
Key Trends & Opportunities
Growth of Sustainable and Low-Impact Flavor Production
Sustainability drives new opportunities as biotech flavors reduce pressure on natural resources such as vanilla beans and fruit crops. Fermentation-based production lowers water consumption, land use, and carbon emissions. Companies position biotech flavors as eco-efficient alternatives that meet corporate sustainability goals. The shift aligns with environmental compliance policies and ethical sourcing requirements. This trend encourages wider product development across premium snacks, beverages, and frozen desserts.
- For instance, the ADM advanced flavor production facility in Pinghu is a 27,000+ square meter plant that will serve as ADM's flavor supply hub in the Asia-Pacific region, leveraging expertise and technologies to meet customer demand for healthy, delicious foods and beverages from nature.
Increasing Use in Plant-Based and Alternative Food Products
Plant-based dairy, meat, and bakery alternatives rely heavily on biotech flavors to enhance taste and remove undesirable notes. Fermentation-derived flavors provide consistent sensory performance without synthetic additives. Rising adoption of protein-rich products amplifies the need for stable and natural flavor systems. Brands use biotech vanilla, cocoa, and fruit profiles to improve texture perception and consumer acceptance. This creates a strong growth pathway in global vegan and flexitarian markets.
- For instance, Takasago utilizes advanced analytical technologies to identify and develop flavors for plant-based foods, including methods to address off-notes and replicate the cooked flavor profile of meat.
Key Challenges
High Production Costs and Technology Investment Requirements
Biotech flavor production demands advanced fermentation equipment, controlled environments, and skilled technical teams. These requirements increase initial capital expenditure and raise operational costs for small and mid-sized producers. Scaling operations adds complexity due to stringent purity and safety standards. Companies must balance innovation with cost efficiency to maintain competitive pricing. These financial barriers slow adoption in emerging markets and limit the entry of new producers.
Regulatory Complexity Across Multiple Regions
Regulatory definitions of “natural,” “bio-based,” and “fermentation-derived” flavors vary across regions, creating compliance challenges for global manufacturers. Companies must navigate diverse labeling rules, ingredient approval processes, and documentation requirements. This increases time-to-market and raises administrative burdens. Differences in safety assessments and import regulations complicate international expansion. Ensuring alignment with evolving regional standards demands continuous monitoring and investment in regulatory expertise.
Regional Analysis
North America
North America holds a 31% share of the Biotech Flavors market due to strong adoption in dairy, beverages, and clean-label bakery products. Brands in the United States and Canada use fermentation-derived flavors to achieve steady supply and avoid volatility in natural vanilla and fruit crops. Regulatory clarity around natural flavor classification supports faster commercialization. Food manufacturers prefer biotech solutions for consistency, sustainability, and reduced ingredient variability. Growth in plant-based dairy and functional beverages further strengthens demand. Investments in precision fermentation facilities and partnerships between flavor houses and biotech firms reinforce the region’s leadership and push innovation across multiple flavor categories.
Europe
Europe captures a 29% share driven by strict clean-label standards and high demand for natural, sustainable ingredients. Manufacturers in Germany, France, the United Kingdom, and the Netherlands integrate biotech flavors into dairy, confectionery, and premium bakery categories to meet consumer expectations for transparency. The region benefits from strong R&D ecosystems and regulatory support for bio-based flavor production. Fermentation technology adoption rises as producers reduce reliance on conventional vanilla and fruit extracts. Growing demand for vegan and plant-based foods expands biotech flavor usage. Sustainability commitments by major European food brands further accelerate market expansion and reinforce long-term industry development.
Asia Pacific
Asia Pacific leads global expansion with a 33% share driven by large-scale food manufacturing and growing preference for natural flavors. China, Japan, India, and South Korea invest in fermentation-based production to improve supply stability and reduce dependence on imported botanical extracts. High consumption of flavored dairy, beverages, and confectionery strengthens market penetration. Rising incomes and consumer interest in cleaner formulations support rapid adoption. Regional manufacturers integrate biotech fruity and vanilla profiles to improve consistency across high-volume production lines. Strong government focus on biotechnology innovation, coupled with fast growth in plant-based products, positions Asia Pacific as the most dynamic regional market.
Latin America
Latin America holds a 4% share, supported by rising adoption in beverages, confectionery, and dairy categories. Brazil and Mexico lead regional demand as manufacturers shift toward stable, natural flavors amid raw material price fluctuations. Fermentation-derived vanilla gains acceptance due to high volatility in traditional vanilla sourcing. Local brands explore biotech fruity and cocoa profiles to enhance product consistency and shelf stability. Growing interest in clean-label food launches and expanding bakery production support wider adoption. Investments in regional R&D and collaboration with global flavor houses help accelerate technology transfer, strengthening the region’s ability to scale biotech flavor solutions.
Middle East & Africa
The Middle East & Africa region accounts for a 3% share, driven by gradual adoption of natural and fermentation-based flavors in beverages, dairy desserts, and bakery products. Countries such as the UAE, Saudi Arabia, and South Africa show increasing interest in clean-label and sustainable ingredients. Limited local raw material availability encourages the shift toward biotech vanilla and fruity notes for consistent supply. Global flavor producers expand partnerships with regional food manufacturers to introduce stable, high-purity biotech flavor systems. Growth in premium snacks, ready-to-drink beverages, and flavored dairy products supports steady market development, while rising investments in food innovation hubs enhance long-term prospects.
Market Segmentations:
By Type
- Vanilla
- Fruity Flavor
- Others
By Form
- Liquid
- Powder
- Paste
By Application
- Dairy
- Bakery and confectionery
- Beverage
- Others
By Geography
- North America
- U.S.
- Canada
- Mexico
- Europe
- Germany
- France
- U.K.
- Italy
- Spain
- Rest of Europe
- Asia Pacific
- China
- Japan
- India
- South Korea
- South-east Asia
- Rest of Asia Pacific
- Latin America
- Brazil
- Argentina
- Rest of Latin America
- Middle East & Africa
- GCC Countries
- South Africa
- Rest of the Middle East and Africa
Competitive Landscape
The competitive landscape or analysis of the Biotech Flavors market features major players such as Givaudan SA, Firmenich SA, Symrise AG, International Flavors & Fragrances Inc. (IFF), Takasago International Corporation, Sensient Technologies Corporation, Kerry Group plc, Bell Flavors & Fragrances Inc., Flavorchem Corporation, and T. Hasegawa Co., Ltd. These companies compete through innovation in fermentation technologies, enzyme engineering, and natural flavor formulation. Leading firms invest in advanced bioprocessing systems to enhance flavor purity, stability, and repeatability across large-scale production. Partnerships with food and beverage manufacturers strengthen application development in dairy, beverages, and bakery categories. Many players expand microbial fermentation capabilities to reduce reliance on traditional crop-derived extracts and secure consistent supply. Sustainability commitments also drive investments in low-impact production systems. Competitive strategies focus on diversifying biotech fruity and vanilla profiles, strengthening regulatory compliance, and enhancing clean-label product portfolios to capture rising global demand.
Key Player Analysis
- Sensient Technologies Corporation
- Flavorchem Corporation
- Hasegawa Co., Ltd.
- Takasago International Corporation
- Bell Flavors & Fragrances Inc.
- Kerry Group plc
- Symrise AG
- Firmenich SA
- International Flavors & Fragrances Inc. (IFF)
- Givaudan SA
Recent Developments
- In February 2025, Sensient also acquired French firm Biolie (a white-biotech natural ingredient extractor) to strengthen its biotechnology/fermentation-derived ingredient capabilities.
- In February 2025, T. Hasegawa USA completed a major renovation and expansion of its Flavor Innovation Center in Cerritos, California.
- In 2025, Sensient Technologies Corporation announced that its flavours business is developing flavours through biotransformation as part of its innovation programme.
Report Coverage
The research report offers an in-depth analysis based on Type, Form, Application and Geography. It details leading market players, providing an overview of their business, product offerings, investments, revenue streams, and key applications. Additionally, the report includes insights into the competitive environment, SWOT analysis, current market trends, as well as the primary drivers and constraints. Furthermore, it discusses various factors that have driven market expansion in recent years. The report also explores market dynamics, regulatory scenarios, and technological advancements that are shaping the industry. It assesses the impact of external factors and global economic changes on market growth. Lastly, it provides strategic recommendations for new entrants and established companies to navigate the complexities of the market.
Future Outlook
- Demand for clean-label and natural flavor solutions will expand across major food categories.
- Fermentation and enzyme engineering advancements will improve yield, purity, and flavor accuracy.
- Adoption in plant-based dairy, meat, and bakery alternatives will accelerate global growth.
- Biotech vanilla and fruity profiles will replace unstable crop-based extracts in large-scale production.
- Investment in sustainable and low-impact flavor manufacturing will increase among leading companies.
- Precision fermentation facilities will expand in Asia Pacific, North America, and Europe.
- Partnerships between flavor houses and food manufacturers will speed product commercialization.
- Regulatory clarity for natural fermentation-derived flavors will support wider market acceptance.
- Demand for masking agents in protein-rich and functional foods will strengthen biotech flavor usage.
- Rising interest in flavor customization will drive innovation in specialty and region-specific flavor profiles.
Request a Free Sample
Fill in your details and we'll send you a free sample report.
- Sample data tables & charts
- Research methodology
Need a Custom Version of This Report?
Tailor the scope, geography, or segments to your exact requirements.
- Custom geography or segment scope
- Direct access to our analyst team
Frequently Asked Questions
What is the current market size for the Biotech Flavors market, and what is its projected size in 2032?
At what Compound Annual Growth Rate is the Biotech Flavors market projected to grow between 2025 and 2032?
Which Biotech Flavors market segment held the largest share in 2024?
What are the primary factors fueling the growth of the Biotech Flavors market?
Who are the leading companies in the Biotech Flavors market?
Which region commanded the largest share of the Biotech Flavors market in 2024?
Table of Content
Chapter 1. Report Introduction
- 1.1 Report Description & Purpose
- 1.1.1 Report Title & Market Definition
- 1.1.2 Unique Selling Propositions (USP) & Key Differentiators
- 1.1.3 Value Proposition for Stakeholders
- 1.2 Research Objectives
- 1.2.1 Market Sizing Objectives (Volume & Revenue)
- 1.2.2 Segmentation Objectives
- 1.2.3 Competitive Intelligence Objectives
- 1.2.4 Forecast & Scenario Objectives
- 1.3 Report Scope
- 1.3.1 Biotech-Flavors Scope – Types & Subtypes Covered
- 1.3.2 Geographic Scope – Regions & Countries Covered
- 1.3.3 Historical Period, Base Year & Forecast Period (2024; forecast to 2032)
- 1.3.4 Inclusions & Exclusions
- 1.4 HS Code & Classification Framework
- 1.5 Currency, Units & Pricing Basis
- 1.6 Target Stakeholders
- 1.7 Limitations & Assumptions
Chapter 2. Executive Summary
- 2.1 Global Biotech-Flavors Market Snapshot
- 2.1.1 Market Size – Historical (2024) & Forecast (2024-2032) (2024: USD 2,632.95 million → 2032: USD 4,037.69 million)
- 2.1.2 Volume & Revenue – Global Totals
- 2.1.3 Key Market Highlights – Top Five Facts
- 2.2 Biotech-Flavors Market Segmentation Snapshot
- 2.2.1 Market Split by Region – 2024 vs. 2032
- 2.3 Competitive Snapshot
- 2.3.1 Top 10 Players by Revenue Share – 2024
- 2.3.2 Top 10 Players by Volume Share – 2024
- 2.3.3 Recent Strategic Developments (18-Month Summary)
- 2.4 Key Investment Highlights & Strategic Conclusions
Chapter 3. Biotech-Flavors Market Dynamics & Industry Analysis
- 3.1 Market Overview & Context
- 3.1.1 Biotech-Flavors Market Position in the Broader Automotive Value Chain
- 3.1.2 OEM vs. Replacement Market Dynamics
- 3.1.3 Market Maturity & Development Stage by Region
- 3.2 Biotech-Flavors Market Drivers
- 3.3 Biotech-Flavors Market Restraints & Challenges
- 3.4 Biotech-Flavors Market Opportunities
- 3.5 Porter's Five Forces Analysis
- 3.5.1 Threat of New Entrants
- 3.5.2 Bargaining Power of Suppliers
- 3.5.3 Bargaining Power of Buyers
- 3.5.4 Threat of Substitutes
- 3.5.5 Competitive Rivalry – Intensity Assessment
- 3.6 Biotech-Flavors Value Chain Analysis
- 3.6.1 Upstream – Raw Material/Input Suppliers
- 3.6.1.1 Raw Material/Input 1
- 3.6.1.2 Raw Material/Input 2
- 3.6.1.3 Raw Material/Input 3
- 3.6.2 Midstream – Production/Manufacturing/Service Delivery
- 3.6.2.1 Production/Process Overview
- 3.6.2.2 Key Facility Locations & Capacity by Manufacturer
- 3.6.3 Downstream – Distribution & End Consumer
- 3.6.3.1 Primary Channel – B2B/OEM
- 3.6.3.2 Secondary Channels – Dealer, Retail, Online, Direct
- 3.6.4 Value Chain Profitability Analysis
- 3.6.1 Upstream – Raw Material/Input Suppliers
- 3.7 PESTEL Analysis
- 3.7.1 Political Factors
- 3.7.2 Economic Factors
- 3.7.3 Social Factors
- 3.7.4 Technological Factors
- 3.7.5 Environmental Factors
- 3.7.6 Legal Factors
- 3.8 Biotech-Flavors Supply Chain Analysis
- 3.8.1 Raw Material/Input Supply Risk Assessment
- 3.8.2 Manufacturing Concentration Risk (Geographic Exposure)
- 3.8.3 Trade Disruption Impact Analysis
- 3.9 Regulatory & Policy Landscape
Note: The regulatory and policy landscape section covers regulations based on their applicability to the market, Biotech-Flavors category, geography, and scope of the study. Only regulatory frameworks with a material impact on operations, compliance, trade, sustainability, or market access are analyzed in detail.
Chapter 4. Key Investment Pockets & Opportunity Analysis
- 4.1 Biotech-Flavors Market Attractiveness Analysis
- 4.1.1 By Region – Investment Attractiveness Matrix (Volume × CAGR)
- 4.2 Absolute Revenue Growth Opportunity
- 4.2.1 By Region – Absolute USD Growth Through 2032
- 4.3 Incremental Volume Opportunity
- 4.3.1 By Region – Incremental Volume Through 2032
- 4.3.2 Segment – Incremental Volume
- 4.4 Emerging Submarket Opportunity Deep Dive (Subject to Applicability)
- 4.5 Emerging Market Opportunity Scorecards
- 4.5.1 United States
- 4.5.2 Europe
- 4.5.3 Asia
- 4.5.4 Middle East & Africa
Note: Emerging Market Opportunity Scorecards will be included based on relevance and strategic importance. Regions listed are indicative and may vary depending on data availability and market dynamics.
Chapter 5. Biotech-Flavors Import-Export Analysis & Trade Flows
- 5.1 Global Trade Overview
- 5.1.1 Global Export Value by Country (2024)
- 5.1.2 Global Export Volume by Country (2024)
- 5.1.3 Global Import Value by Country (2024)
- 5.1.4 Global Import Volume by Country (2024)
- 5.1.5 Net Trade Balance by Country (2024)
- 5.2 Export Analysis – Segment
- 5.2.1 Type 1 (HS Code)
- 5.2.2 Type 2 (HS Code)
- 5.2.3 Type 3 (HS Code)
- 5.2.4 Type 4 (HS Code)
- 5.2.5 Type 5 (HS Code)
- 5.3 Import Analysis – Segment
- 5.3.1 Type 1 (HS Code)
- 5.3.2 Type 2 (HS Code)
- 5.3.3 Type 3 (HS Code)
- 5.3.4 Type 4 (HS Code)
- 5.3.5 Type 5 (HS Code)
- 5.4 Average Unit Trade Prices
- 5.4.1 Average Export Price – Segment & Country
- 5.4.2 Average Import Price – Segment & Source Country
- 5.4.3 Price Trends (2024)
- 5.5 Key Trade Route Analysis
- 5.5.1 Trade Route 1
- 5.5.2 Trade Route 2
- 5.5.3 Trade Route 3
- 5.5.4 Trade Route 4
- 5.5.5 Trade Route 5
- 5.6 Trade Policy Impact Assessment
- 5.6.1 US Anti-Dumping & Section 301 Tariffs
- 5.6.2 EU Customs Union Impact
- 5.6.3 Major Free Trade Agreements
- 5.6.4 USMCA Rules of Origin
Note: Trade policy analysis will be included only where relevant to the Biotech-Flavors market.
Chapter 6. Competitive Landscape & Company Benchmarking
- 6.1 Biotech-Flavors Market Concentration & Structure
- 6.1.1 Herfindahl-Hirschman Index (HHI) – vs. 2024
- 6.1.2 Tier 1, Tier 2 & Tier 3 Market Structure
- 6.1.3 Global, Regional & Local Player Dynamics
- 6.2 Biotech-Flavors Market Share Analysis – 2024
- 6.2.1 Global Revenue Share by Company
- 6.2.2 Global Volume Share by Company
- 6.2.3 Regional Revenue Share
- 6.2.4 Market Share Evolution ( vs. 2024)
- 6.2.5 OEM Segment Share by Company
- 6.2.6 Replacement Segment Share by Company
- 6.3 Production/Delivery Capacity & Facility Analysis
- 6.3.1 Global Installed Capacity
- 6.3.2 Capacity Utilization Rates
- 6.3.3 Production/Output Volume
- 6.3.4 Facility Locations & Capacity Map
- 6.3.5 Planned Capacity Additions
- 6.4 Biotech-Flavors Competitive Benchmarking Matrix
- 6.4.1 Revenue, Volume, CAGR & Profitability Comparison
- 6.4.2 Channel Revenue Mix
- 6.4.3 Geographic Revenue Exposure
- 6.4.4 R&D Intensity
- 6.4.5 Sustainability Maturity
- 6.5 Strategic Developments in Biotech-Flavors (Last 24 Months)
- 6.5.1 Mergers, Acquisitions & Divestments
- 6.5.2 New Biotech-Flavors Launches
- 6.5.3 Facility Expansions
- 6.5.4 Strategic Alliances, Joint Ventures & Partnerships
- 6.5.5 Distribution Expansion & Market Entry
- 6.5.6 Sustainability & ESG Initiatives
- 6.6 Competitive Strategy Mapping
- 6.6.1 Leader, Challenger, Follower & Niche Classification
- 6.6.2 Pricing Strategy Comparison
- 6.6.3 Channel Strategy Matrix
Note: Strategic developments are included based on their materiality and the availability of reliable information.
Chapter 7. Global Biotech-Flavors Market – By Distribution Channel
- 7.1 Segment Overview
- 7.1.1 Volume & Revenue Split by Channel (2024 & 2032)
- 7.1.2 Channel Mix Evolution (2024-2032)
Chapter 8. Regional Market Analysis – Global Overview
- 8.1 Global Regional Overview
- 8.1.1 Regional Volume Share
- 8.1.2 Regional Revenue Share
- 8.1.3 Regional Volume by Region
- 8.1.4 Regional Revenue by Region
- 8.1.5 Regional Forecast Through 2032
- 8.2 Cross-Regional Segment Analysis
- 8.2.1 By Distribution Channel
- 8.2.2 By Brand/Price Tier
Chapter 9. North America Biotech-Flavors Market
- 9.1 United States
- 9.2 Canada
- 9.3 Mexico
Chapter 10. Europe Biotech-Flavors Market
- 10.1 Germany
- 10.2 France
- 10.3 Italy
- 10.4 United Kingdom
- 10.5 Spain
- 10.6 Poland
- 10.7 Russia
- 10.8 Netherlands
- 10.9 Belgium
- 10.10 Sweden
- 10.11 Denmark
- 10.12 Norway
- 10.13 Rest of Europe
Chapter 11. Asia Pacific Biotech-Flavors Market
- 11.1 China
- 11.2 India
- 11.3 Japan
- 11.4 South Korea
- 11.5 Thailand
- 11.6 Indonesia
- 11.7 Vietnam
- 11.8 Malaysia
- 11.9 Australia
- 11.10 Rest of Asia Pacific
Chapter 12. Latin America Biotech-Flavors Market
- 12.1 Brazil
- 12.2 Argentina
- 12.3 Colombia
- 12.4 Chile
- 12.5 Rest of Latin America
Chapter 13. Middle East Biotech-Flavors Market
- 13.1 Saudi Arabia
- 13.2 United Arab Emirates
- 13.3 Turkey
- 13.4 Israel
- 13.5 Iran
- 13.6 Rest of the Middle East
Chapter 14. Africa Biotech-Flavors Market
- 14.1 South Africa
- 14.2 Egypt
- 14.3 Nigeria
- 14.4 Morocco
- 14.5 Rest of Africa
Chapter 15. Biotech-Flavors Company Profiles
- 15.1 [Company 01]
- 15.1.1 Company Overview
- 15.1.2 Key Management Personnel
- 15.1.3 Products & Services Portfolio
- 15.1.4 Financial Performance
- 15.1.5 Key Market Focus & Geographic Presence
- 15.1.6 Recent Developments & Strategic Initiatives
Note: The company profile list is preliminary and may change based on research findings, market developments, data availability, and client requirements.
Chapter 16. Appendices
- Appendix A – List of Abbreviations & Acronyms
- Appendix B – Industry Classification Code Reference – Full Series
- Appendix C – Production & Capacity Data Tables
- Appendix D – End-Use & Demand Base Tables
- Appendix E – Consumption & Replacement Rate Assumptions
- Appendix F – ASP Reference Tables
- Appendix G – Manufacturing & Facility Database
- Appendix H – Import-Export Data Tables
- Appendix I – Regulatory Summary Tables
- Appendix J – Primary Research Participant List (Anonymized)
- Appendix K – Primary Research Questionnaire Framework
- Appendix L – Data Sources & Bibliography
- Appendix M – Market Size Divergence & Source Comparison
Chapter 17. Research Methodology
- 17.1 Research Framework & Philosophy
- 17.2 Secondary Research – Sources, Hierarchy & Data Extraction
- 17.3 Data Modeling – Bottom-Up & Top-Down Market Sizing
- 17.4 Primary Research – Stakeholder Framework, LOI & Sample Sizes
- 17.5 Forecast Methodology – Regression, Scenario & Sensitivity Analysis
- 17.6 Quality Control – Four-Layer Validation Framework
- 17.7 Limitations & Standard Assumptions
- 17.8 Disclaimer
