
Market Overview
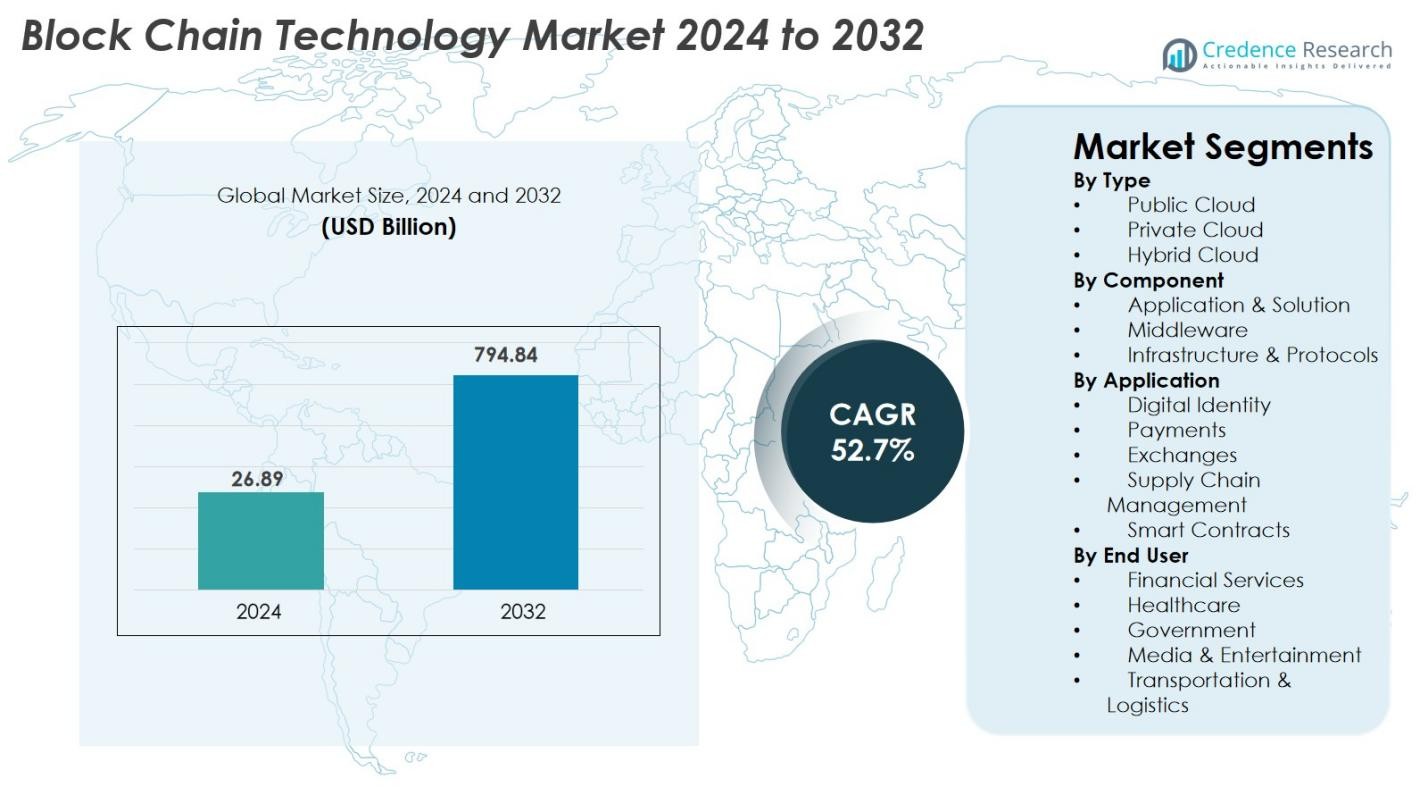
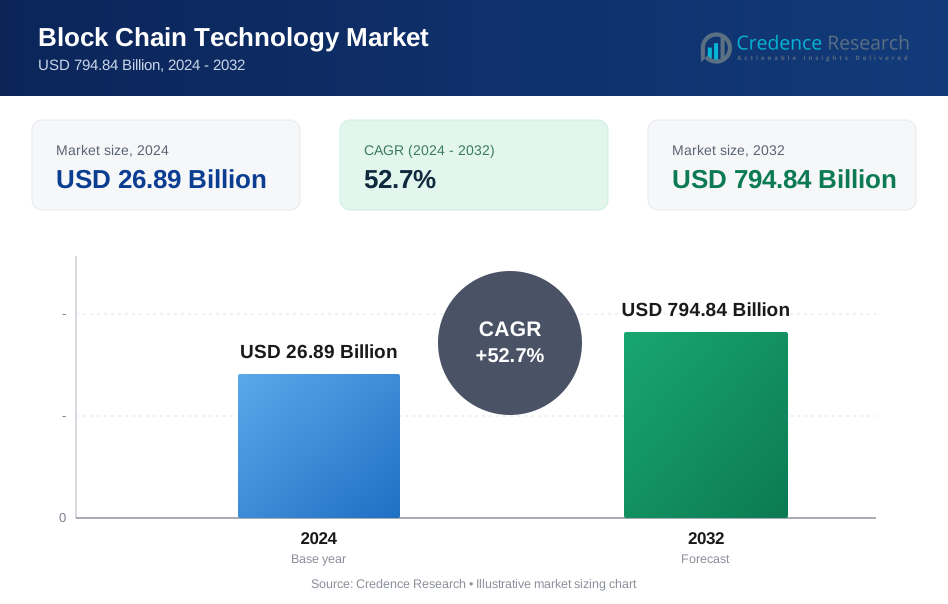
Block Chain Technology Market size was valued at USD 26.89 Billion in 2024 and is anticipated to reach USD 794.84 Billion by 2032, at a CAGR of 52.7% during the forecast period.
| REPORT ATTRIBUTE | DETAILS |
|---|---|
| Historical Period | 2020-2023 |
| Base Year | 2024 |
| Forecast Period | 2025-2032 |
| Block Chain Technology Market Size 2024 | USD 26.89 Billion |
| Block Chain Technology Market, CAGR | 52.7% |
| Block Chain Technology Market Size 2032 | USD 794.84 Billion |
Block Chain Technology Market is shaped by leading players such as IBM Corporation, Microsoft Corporation, The Linux Foundation, Chain, Circle Internet Financial LLC, Deloitte Touche Tohmatsu Limited, Blockchain Tech LTD, Digital Asset Holdings LLC, Global Arena Holding Inc. (GAHC), and Monax Labs, all of whom accelerate adoption through platform innovation, enterprise blockchain solutions, and decentralized application development. North America dominates the market with a 39.4% share, supported by mature digital infrastructure and strong investment in blockchain-enabled financial and enterprise applications. Europe follows with 27.8% share, driven by regulatory advancements, while Asia-Pacific accounts for 24.6%, emerging as the fastest-growing region due to rapid digitalization and expanding fintech ecosystems.
Market Insights
- Block Chain Technology Market was valued at USD 26.89 Billion in 2024 and is projected to reach USD 794.84 Billion by 2032, registering a CAGR of 52.7% during the forecast period.
- Growing demand for decentralized applications, secure digital payments, asset tokenization, and transparent supply chain networks drives rapid adoption, with the Public Cloud segment holding 48.6% share and Application & Solution accounting for 55.2% in 2024.
- Key trends include rising Web3 ecosystems, decentralized identity frameworks, and integration of AI and IoT to enable autonomous, secure, and scalable digital infrastructures across industries.
- Major players such as IBM, Microsoft, The Linux Foundation, Chain, Circle, Deloitte, and Monax Labs strengthen market expansion through platform innovation, partnerships, and enterprise-grade blockchain deployments.
- North America leads with 39.4% market share, followed by Europe at 27.8% and Asia-Pacific at 24.6%, while Latin America and Middle East & Africa collectively contribute emerging growth opportunities driven by digital transformation efforts.
Market Segmentation Analysis
By Type
The Block Chain Technology Market by type is led by the Public Cloud segment, commanding 48.6% share in 2024, driven by its high scalability, decentralized infrastructure, and lower deployment costs that attract SMEs and large enterprises. Private cloud adoption grows steadily due to enhanced data governance and security requirements from BFSI and healthcare organizations. Meanwhile, hybrid cloud gaining strong traction supports enterprises seeking flexibility, interoperability, and policy-controlled blockchain deployments for regulated industries. Growing digital transformation, cross-border data exchange, and enterprise-grade blockchain networks continue to reinforce demand across all cloud models.
- For instance, IBM expanded its Hyperledger Fabric-based services on IBM Cloud to boost controlled blockchain environments for financial institutions needing strict data-residency compliance.
By Component
The Block Chain Technology Market by component is dominated by the Application & Solution segment, accounting for 55.2% share in 2024, fueled by rising deployment of blockchain platforms for identity management, tokenization, smart contracts, and multi-party workflow automation. Middleware expands as enterprises require integration tools, APIs, and orchestration layers to connect legacy systems with decentralized networks. Infrastructure & Protocols see increasing uptake due to advancements in Layer-1 and Layer-2 scaling solutions. Strong enterprise focus on real-time transparency, tamper-proof data exchange, and operational automation supports sustained growth across all components.
- For instance, Consensys upgraded its Linea Layer-2 zkEVM network, reducing transaction fees and improving throughput for enterprise-grade smart-contract applications.
By Application
The Block Chain Technology Market by application is led by the Payments segment, holding 34.7% share in 2024, driven by rapid adoption of blockchain-based remittances, cross-border settlements, and digital currency infrastructure that reduces transaction costs and enhances speed. Supply chain management follows with accelerating use cases in traceability, provenance verification, and logistics automation. Smart contracts gain momentum across real estate, insurance, and enterprise workflow automation. Digital identity and exchanges also expand due to rising demand for decentralized authentication and secure asset trading, strengthened by regulatory modernization and enterprise blockchain integration.
Key Growth Drivers
Rapid Enterprise Adoption of Decentralized Applications (dApps)
Enterprise adoption of decentralized applications (dApps) is a major driver for the Block Chain Technology market as organizations increasingly prioritize automation, interoperability, and secure data exchange. Enterprises across BFSI, retail, healthcare, and logistics are deploying blockchain-based workflows to reduce manual processing, eliminate reconciliation, and establish trust across multi-stakeholder environments. dApps enable real-time auditability and immutability, improving compliance and operational transparency. The growing integration of smart contracts further accelerates process modernization in payments, supply chain tracking, insurance claims, and asset tokenization. As enterprises advance digital transformation and shift to cloud-native models, blockchain-enabled automation continues to accelerate market growth.
- For instance, Mastercard advanced its Multi-Token Network (MTN) pilot, enabling smart-contract-driven settlement and tokenized asset exchanges for enterprise payments.
Expansion of Blockchain in Digital Payments and Tokenized Financial Systems
The accelerating shift toward blockchain-enabled digital payments, cross-border transfers, and asset tokenization serves as a fundamental driver. Blockchain reduces settlement cycles from days to near-instant processing and significantly cuts operational costs, attracting strong adoption by banks and fintechs. The rise of CBDCs, stablecoins, and tokenized securities strengthens programmable and secure financial ecosystems. Demand for transparency, speed, and risk reduction across international corridors fuels adoption. Tokenization further democratizes access to assets such as real estate, commodities, and intellectual property. As global financial infrastructure modernizes, blockchain emerges as a core pillar for next-generation digital finance.
- For instance, JP Morgan expanded its JPM Coin platform to support 24/7 euro-denominated settlements, enabling near-real-time cross-border corporate payments.
Rising Need for Secure and Transparent Supply Chain Ecosystems
The increasing demand for traceable, resilient, and tamper-proof supply chain systems is another significant growth driver. Blockchain provides immutable product histories from manufacturing to delivery, supporting verification, fraud prevention, and regulatory compliance. Industries like pharmaceuticals, automotive, electronics, and food processing adopt blockchain to validate authenticity, monitor logistics flow, and automate settlements via smart contracts. ESG reporting, sustainability audits, and global trade compliance further push adoption. As supply chains become more global and interconnected, blockchain-based visibility improves efficiency, mitigates operational risks, and strengthens accountability, driving rapid enterprise uptake across sectors.
Key Trends & Opportunities
Growth of Web3 Ecosystems and Decentralized Identity Frameworks
The rise of Web3 ecosystems presents major opportunities as decentralized identity (DID), self-sovereign identity (SSI), and privacy-preserving authentication gain traction. Governments and enterprises explore blockchain-based identity systems to secure citizen data, eliminate identity fraud, and streamline onboarding processes. DID frameworks support digital governance, healthcare records, financial KYC, and secure enterprise access management. Web3 business models including blockchain-based content platforms, creator economies, metaverse applications, and loyalty ecosystems expand commercial possibilities. As privacy regulations strengthen globally, decentralized identity solutions become essential, offering long-term growth opportunities for vendors and service providers.
- For instance, European Union regulators advanced the EU Digital Identity Wallet pilot, integrating verifiable credentials for citizen authentication across public services.
Integration of AI, IoT, and Blockchain for Autonomous Digital Infrastructure
Blockchain’s convergence with AI and IoT unlocks new market opportunities by enabling autonomous, secure, and intelligent digital ecosystems. IoT devices generate vast data streams that blockchain secures through immutable records and decentralized authentication. AI enhances value by providing predictive analytics, fraud detection, automated decision-making, and compliance intelligence. These integrated systems support smart manufacturing, autonomous mobility, energy grids, agriculture, and smart city infrastructure. As industries adopt edge computing and distributed architectures, blockchain ensures data integrity and trust across interconnected devices, creating strong opportunities for next-generation digital infrastructure solutions.
- For instance, Bosch and Fetch.ai advanced their decentralized machine-learning network to enable autonomous IoT device coordination across mobility and energy ecosystems.
Key Challenges
Scalability Limitations and High Transaction Costs
Scalability remains a persistent challenge as many blockchain networks struggle with throughput limitations and latency during high transaction volumes. Enterprises requiring real-time processing such as payments, logistics, and trading platforms-face bottlenecks that constrain full-scale adoption. Network congestion often leads to fluctuating or high transaction fees, reducing cost-efficiency for large deployments. Although Layer-2 scaling, sharding, and improved consensus mechanisms offer improvements, interoperability gaps between protocols continue to hinder seamless integration. Additionally, energy-intensive consensus models conflict with sustainability goals, further challenging adoption in environmentally conscious industries.
Regulatory Uncertainty and Compliance Complexity
Regulatory ambiguity across global markets significantly impacts blockchain adoption, especially in digital assets, tokenization, and cross-border data operations. Differing national policies on cryptocurrencies, AML/KYC requirements, data sovereignty, and smart-contract enforceability create operational complexity for enterprises. This lack of harmonized regulation delays investment decisions and slows expansion in highly regulated sectors like BFSI and healthcare. Concerns around legal recognition of digital assets, taxation policies, intellectual property disputes, and privacy compliance deepen uncertainty. Until global regulatory frameworks stabilize and standardize, organizations remain cautious, limiting the pace of market penetration.
Regional Analysis
North America
North America leads the Block Chain Technology Market with a 39.4% share in 2024, driven by strong adoption across BFSI, healthcare, retail, government, and technology enterprises. The U.S. remains the major contributor due to its advanced digital infrastructure, high blockchain startup funding, and early deployment of DeFi platforms and Web3 applications. Major cloud providers and enterprise blockchain developers accelerate growth through partnerships and pilot programs. Increasing regulatory clarity around digital assets, along with expanding use cases in supply chain, payments, and identity management, continues to reinforce North America’s leading position.
Europe
Europe holds a 27.8% share in 2024, supported by strong regulatory frameworks, digital transformation programs, and widespread adoption of blockchain in financial services, trade documentation, and sustainability tracking. Countries such as Germany, the U.K., Switzerland, and the Netherlands lead advancements through government-backed blockchain initiatives and secure digital identity systems. The EU’s MiCA regulation enhances transparency and strengthens digital asset governance, boosting enterprise confidence. Growing deployment of blockchain in automotive supply chains, energy management, cross-border payments, and ESG reporting positions Europe as a rapidly maturing and innovation-driven blockchain ecosystem.
Asia-Pacific
Asia-Pacific accounts for 24.6% share in 2024 and remains the fastest-growing region due to large-scale investments in blockchain infrastructure, digital payment modernization, and government innovation frameworks. China, Japan, Singapore, South Korea, and India drive strong adoption across banking, logistics, manufacturing, and public services. Expanding use of CBDCs, smart city projects, and blockchain-based trade finance accelerates market growth. A vibrant fintech landscape, a mobile-first user base, and rapidly improving regulatory clarity strengthen adoption. Enterprise modernization and developer ecosystem expansion position Asia-Pacific as a pivotal global growth engine for blockchain technology.
Latin America
Latin America captured a 4.7% share in 2024, driven by increasing blockchain adoption in digital payments, financial inclusion, and supply chain transparency. Brazil, Mexico, Colombia, and Argentina emerge as the primary adopters, leveraging blockchain for remittances, identity verification, and agricultural traceability. Economic volatility and inflationary pressures encourage the use of blockchain-powered financial tools and tokenized assets. Government partnerships and private-sector innovation expand use cases in public services and trade documentation. Despite infrastructure gaps, rising fintech penetration and demand for decentralized financial systems strengthen the region’s growing blockchain ecosystem.
Middle East & Africa
The Middle East & Africa region holds a 3.5% share in 2024, supported by government-led digital transformation programs, smart city initiatives, and growing adoption of blockchain in energy management, logistics, and identity systems. The UAE and Saudi Arabia lead regional momentum with national blockchain roadmaps and large-scale digital government projects. African markets gain traction in supply chain digitization, cross-border payments, and land registry systems due to the need for transparency and financial accessibility. Increasing investment in fintech ecosystems and partnerships with global blockchain vendors continues to expand regional adoption.
Market Segmentations
By Type
- Public Cloud
- Private Cloud
- Hybrid Cloud
By Component
- Application & Solution
- Middleware
- Infrastructure & Protocols
By Application
- Digital Identity
- Payments
- Exchanges
- Supply Chain Management
- Smart Contracts
By End User
- Financial Services
- Healthcare
- Government
- Media & Entertainment
- Transportation & Logistics
By Geography
- North America
- U.S.
- Canada
- Mexico
- Europe
- Germany
- France
- U.K.
- Italy
- Spain
- Rest of Europe
- Asia Pacific
- China
- Japan
- India
- South Korea
- South-east Asia
- Rest of Asia Pacific
- Latin America
- Brazil
- Argentina
- Rest of Latin America
- Middle East & Africa
- GCC Countries
- South Africa
- Rest of the Middle East and Africa
Competitive Landscape
The Block Chain Technology market features a dynamic and rapidly evolving competitive landscape, shaped by technology leaders, enterprise solution providers, fintech innovators, and open-source blockchain foundations. Major players such as IBM Corporation, Microsoft Corporation, The Linux Foundation, Blockchain Tech LTD, Chain, Circle Internet Financial LLC, Deloitte Touche Tohmatsu Limited, Digital Asset Holdings LLC, Global Arena Holding Inc. (GAHC), and Monax Labs actively expand their blockchain portfolios through product innovation, strategic partnerships, and industry-specific solutions. Vendors increasingly focus on interoperability, scalability, tokenization frameworks, and enterprise-grade security to address growing demand across BFSI, supply chain, healthcare, government, and digital identity applications. Open-source ecosystems such as Hyperledger and Ethereum continue to accelerate adoption by enabling flexible, developer-driven blockchain deployment. Meanwhile, rising investment in Web3 platforms, digital asset infrastructure, and decentralized applications intensifies competition, pushing players to differentiate through advanced consensus mechanisms, cloud integration, and AI-driven automation capabilities.
Key Player Analysis
- Monax Labs
- IBM Corporation
- Chain
- Digital Asset Holdings, LLC
- Circle Internet Financial, LLC
- Blockchain Tech LTD
- Deloitte Touche Tohmatsu Limited
- Global Arena Holding, Inc. (GAHC)
- The Linux Foundation
- Microsoft Corporation
Recent Developments
- In December 2025, Blockchain Loyalty Corp. (BBLC) provided a corporate update highlighting progress on its AI-infrastructure division InfernoGrid and fintech platform Koilink, indicating developments in GPU-marketplace and fintech infrastructure.
- In December 2025, Intellistake announced plans to integrate blockchain infrastructure with space-based computing, partnering with Orbit AI for an “orbital cloud” network blending blockchain verification, decentralized communication and AI in orbit.
- In November 2025, TGCoin formally inaugurated its “Global Ecosystem Era” and announced a strategic partnership with Finstar Foundation marking a push to integrate AI, security and public-chain blockchain infrastructure.
Report Coverage
The research report offers an in-depth analysis based on Type, Component, Application, End-User and Geography. It details leading market players, providing an overview of their business, product offerings, investments, revenue streams, and key applications. Additionally, the report includes insights into the competitive environment, SWOT analysis, current market trends, as well as the primary drivers and constraints. Furthermore, it discusses various factors that have driven market expansion in recent years. The report also explores market dynamics, regulatory scenarios, and technological advancements that are shaping the industry. It assesses the impact of external factors and global economic changes on market growth. Lastly, it provides strategic recommendations for new entrants and established companies to navigate the complexities of the market.
Future Outlook
- The market will experience accelerated adoption as enterprises expand blockchain integration across finance, healthcare, logistics, and public services.
- Decentralized identity frameworks will gain widespread acceptance, strengthening privacy, authentication, and data ownership models.
- Tokenization of real-world assets will reshape investment models and broaden access to fractional asset ownership.
- Blockchain-enabled digital payments and CBDC ecosystems will significantly enhance cross-border transaction efficiency.
- Interoperability between blockchain networks will improve, enabling seamless communication across diverse platforms and protocols.
- Layer-2 scaling solutions and advanced consensus mechanisms will enhance network performance and reduce transaction costs.
- AI-driven automation will increasingly integrate with blockchain, enabling smarter analytics and autonomous digital operations.
- Supply chain traceability will see stronger adoption as industries prioritize transparency, sustainability, and compliance.
- Regulatory clarity across major markets will support stronger enterprise confidence and broader institutional investment.
- Web3 and decentralized applications will expand rapidly, creating new digital business models and user-centric ecosystems.
Request a Free Sample
Fill in your details and we'll send you a free sample report.
- Sample data tables & charts
- Research methodology
Need a Custom Version of This Report?
Tailor the scope, geography, or segments to your exact requirements.
- Custom geography or segment scope
- Direct access to our analyst team
Frequently Asked Questions
What is the current market size for Block Chain Technology Market, and what is its projected size in 2032?
At what Compound Annual Growth Rate is the Block Chain Technology Market projected to grow between 2025 and 2032?
Which Block Chain Technology Market segment held the largest share in 2024?
What are the primary factors fueling the growth of the Block Chain Technology Market?
Who are the leading companies in the Block Chain Technology Market?
Which region commanded the largest share of the Block Chain Technology Market in 2024?
Table of Content
Chapter 1. Report Introduction
- 1.1 Report Description & Purpose
- 1.1.1 Report Title & Market Definition
- 1.1.2 Unique Selling Propositions (USP) & Key Differentiators
- 1.1.3 Value Proposition for Stakeholders
- 1.2 Research Objectives
- 1.2.1 Market Sizing Objectives (Volume & Revenue) (Volume Where Applicable)
- 1.2.2 Segmentation Objectives
- 1.2.3 Competitive Intelligence Objectives
- 1.2.4 Forecast & Scenario Objectives
- 1.3 Report Scope
- 1.3.1 Block Chain Technology Scope – Segments & Subsegments Covered
- 1.3.2 Geographic Scope – Regions & Countries Covered
- 1.3.3 Historical Period, Base Year & Forecast Period (2024; forecast to 2032)
- 1.3.4 Inclusions & Exclusions
- 1.4 Industry Classification & Applicable Codes
- 1.5 Currency, Measurement Units & Valuation Basis
- 1.6 Target Stakeholders
- 1.7 Limitations & Assumptions
Chapter 2. Executive Summary
- 2.1 Global Block Chain Technology Market Snapshot
- 2.1.1 Market Size – Historical (2024) & Forecast (2024-2032) (2024: USD 26.89 Billion → 2032: USD 794.84 Billion)
- 2.1.2 Volume & Revenue – Global Totals (Volume Where Applicable)
- 2.1.3 Key Market Highlights – Top Five Facts
- 2.2 Block Chain Technology Market Segmentation Snapshot
- 2.2.1 Market Split by Region – 2024 vs. 2032
- 2.3 Competitive Snapshot
- 2.3.1 Top 10 Players by Revenue Share – 2024
- 2.3.2 Top 10 Players by Volume Share – 2024 (Volume Where Applicable)
- 2.3.3 Recent Strategic Developments (18-Month Summary)
- 2.4 Key Investment Highlights & Strategic Conclusions
Chapter 3. Block Chain Technology Market Dynamics & Industry Analysis
- 3.1 Market Overview & Context
- 3.1.1 Block Chain Technology Market Position in the Broader Industry Value Chain
- 3.1.2 Demand Structure & Purchasing Dynamics
- 3.1.3 Market Maturity & Development Stage by Region
- 3.2 Block Chain Technology Market Drivers
- 3.3 Block Chain Technology Market Restraints & Challenges
- 3.4 Block Chain Technology Market Opportunities
- 3.5 Porter's Five Forces Analysis
- 3.5.1 Threat of New Entrants
- 3.5.2 Bargaining Power of Suppliers
- 3.5.3 Bargaining Power of Buyers
- 3.5.4 Threat of Substitutes
- 3.5.5 Competitive Rivalry – Intensity Assessment
- 3.6 Block Chain Technology Value Chain Analysis
- 3.6.1 Upstream – Key Inputs, Resources & Suppliers
- 3.6.1.1 Key Input/Resource 1
- 3.6.1.2 Key Input/Resource 2
- 3.6.1.3 Key Input/Resource 3
- 3.6.2 Midstream – Core Operations & Value Creation
- 3.6.2.1 Operating Model & Process Overview
- 3.6.2.2 Key Operating Locations & Capabilities by Company
- 3.6.3 Downstream – Market Channels & End Users
- 3.6.3.1 Direct Sales & Customer Engagement Channels
- 3.6.3.2 Indirect Sales, Intermediaries & Partner Channels
- 3.6.4 Value Chain Profitability Analysis
- 3.6.1 Upstream – Key Inputs, Resources & Suppliers
- 3.7 PESTEL Analysis
- 3.7.1 Political Factors
- 3.7.2 Economic Factors
- 3.7.3 Social Factors
- 3.7.4 Technological Factors
- 3.7.5 Environmental Factors
- 3.7.6 Legal Factors
- 3.8 Block Chain Technology Supply Chain Analysis
- 3.8.1 Critical Input & Resource Availability Risk Assessment
- 3.8.2 Supplier & Operational Concentration Risk (Geographic Exposure)
- 3.8.3 Supply & Service Disruption Impact Analysis
- 3.9 Regulatory & Policy Landscape
Note: The regulatory and policy landscape section covers regulations based on their applicability to the market, Block Chain Technology category, geography, and scope of the study. Only regulatory frameworks with a material impact on operations, compliance, trade, sustainability, or market access are analyzed in detail.
Chapter 4. Key Investment Pockets & Opportunity Analysis
- 4.1 Block Chain Technology Market Attractiveness Analysis
- 4.1.1 By Region – Investment Attractiveness Matrix (Market Size × CAGR)
- 4.2 Absolute Revenue Growth Opportunity
- 4.2.1 By Region – Absolute Revenue Growth Through 2032
- 4.3 Incremental Demand Opportunity
- 4.3.1 By Region – Incremental Demand Through 2032
- 4.3.2 Segment – Incremental Demand
- 4.4 Emerging Submarket Opportunity Deep Dive (Subject to Applicability)
- 4.5 Priority Market Opportunity Scorecards
- 4.5.1 United States
- 4.5.2 Europe
- 4.5.3 Asia
- 4.5.4 Middle East & Africa
Note: Priority market opportunity scorecards reflect the geographic scope and strategic relevance of the study. Listed markets are indicative and may be adapted to the industry.
Chapter 5. Block Chain Technology Cross-Border Trade & Market Access Analysis
- 5.1 International Trade & Cross-Border Activity Overview
- 5.1.1 Global Export Value by Country (2024)
- 5.1.2 Global Export Volume by Country (2024) (Volume Where Applicable)
- 5.1.3 Global Import Value by Country (2024)
- 5.1.4 Global Import Volume by Country (2024) (Volume Where Applicable)
- 5.1.5 Net Trade Balance by Country (2024)
- 5.2 Export Analysis – Segment
- 5.2.1 Category 1 (Applicable Classification Code)
- 5.2.2 Category 2 (Applicable Classification Code)
- 5.2.3 Category 3 (Applicable Classification Code)
- 5.2.4 Category 4 (Applicable Classification Code)
- 5.2.5 Category 5 (Applicable Classification Code)
- 5.3 Import Analysis – Segment
- 5.3.1 Category 1 (Applicable Classification Code)
- 5.3.2 Category 2 (Applicable Classification Code)
- 5.3.3 Category 3 (Applicable Classification Code)
- 5.3.4 Category 4 (Applicable Classification Code)
- 5.3.5 Category 5 (Applicable Classification Code)
- 5.4 Cross-Border Pricing & Transaction Benchmarks
- 5.4.1 Export Pricing – Segment & Country
- 5.4.2 Import Pricing – Segment & Source Country
- 5.4.3 Price Trends (2024)
- 5.5 Key Cross-Border Trade & Delivery Routes
- 5.5.1 Cross-Border Trade/Delivery Route 1
- 5.5.2 Cross-Border Trade/Delivery Route 2
- 5.5.3 Cross-Border Trade/Delivery Route 3
- 5.5.4 Cross-Border Trade/Delivery Route 4
- 5.5.5 Cross-Border Trade/Delivery Route 5
- 5.6 Trade Policy & Market Access Impact Assessment
- 5.6.1 Tariff & Non-Tariff Barriers
- 5.6.2 Regional Trade & Economic Integration Frameworks
- 5.6.3 Bilateral & Multilateral Trade Agreements
- 5.6.4 Cross-Border Operating, Licensing & Localization Requirements
Note: This chapter applies where cross-border trade or delivery is relevant to Block Chain Technology. Goods, services, and digital offerings are assessed using applicable classifications and transaction measures. Import-export volumes, trade balances, and route analyses are included only where meaningful to the market.
Chapter 6. Competitive Landscape & Company Benchmarking
- 6.1 Block Chain Technology Market Concentration & Structure
- 6.1.1 Herfindahl-Hirschman Index (HHI) – vs. 2024
- 6.1.2 Leading, Mid-Sized & Emerging Player Structure
- 6.1.3 Global, Regional & Local Player Dynamics
- 6.2 Block Chain Technology Market Share Analysis – 2024
- 6.2.1 Global Revenue Share by Company
- 6.2.2 Global Volume Share by Company (Volume Where Applicable)
- 6.2.3 Regional Revenue Share
- 6.2.4 Market Share Evolution ( vs. 2024)
- 6.2.5 Company Market Share by Key Segment
- 6.2.6 Company Market Share by Customer Group
- 6.3 Operating Scale, Capacity & Infrastructure Analysis
- 6.3.1 Global Operating Scale & Supply Capacity
- 6.3.2 Resource Utilization & Operating Efficiency
- 6.3.3 Output, Service Delivery & Activity Metrics
- 6.3.4 Operating Footprint & Infrastructure Map
- 6.3.5 Planned Operational & Capacity Expansion
- 6.4 Block Chain Technology Competitive Benchmarking Matrix
- 6.4.1 Revenue, Growth, Profitability & Operating Metric Comparison
- 6.4.2 Channel Revenue Mix
- 6.4.3 Geographic Revenue Exposure
- 6.4.4 R&D Intensity
- 6.4.5 Sustainability Maturity
- 6.5 Strategic Developments in Block Chain Technology (Last 24 Months)
- 6.5.1 Mergers, Acquisitions & Divestments
- 6.5.2 New Products, Services & Solutions in Block Chain Technology
- 6.5.3 Operational & Infrastructure Expansions
- 6.5.4 Strategic Alliances, Joint Ventures & Partnerships
- 6.5.5 Distribution Expansion & Market Entry
- 6.5.6 Sustainability & ESG Initiatives
- 6.6 Competitive Strategy Mapping
- 6.6.1 Leader, Challenger, Follower & Niche Classification
- 6.6.2 Pricing Strategy Comparison
- 6.6.3 Channel Strategy Matrix
Note: Strategic developments are included based on their materiality and the availability of reliable information.
Chapter 7. Global Block Chain Technology Market – By Sales & Delivery Channel
- 7.1 Segment Overview
- 7.1.1 Volume & Revenue Split by Channel (2024 & 2032) (Volume Where Applicable)
- 7.1.2 Channel Mix Evolution (2024-2032)
Chapter 8. Regional Market Analysis – Global Overview
- 8.1 Global Regional Overview
- 8.1.1 Regional Volume Share (Volume Where Applicable)
- 8.1.2 Regional Revenue Share
- 8.1.3 Regional Volume by Region (Volume Where Applicable)
- 8.1.4 Regional Revenue by Region
- 8.1.5 Regional Forecast Through 2032
- 8.2 Cross-Regional Segment Analysis
- 8.2.1 By Sales & Delivery Channel
- 8.2.2 By Competitive Positioning & Price Tier
Chapter 9. North America Block Chain Technology Market
- 9.1 United States
- 9.2 Canada
- 9.3 Mexico
Chapter 10. Europe Block Chain Technology Market
- 10.1 Germany
- 10.2 France
- 10.3 Italy
- 10.4 United Kingdom
- 10.5 Spain
- 10.6 Poland
- 10.7 Russia
- 10.8 Netherlands
- 10.9 Belgium
- 10.10 Sweden
- 10.11 Denmark
- 10.12 Norway
- 10.13 Rest of Europe
Chapter 11. Asia Pacific Block Chain Technology Market
- 11.1 China
- 11.2 India
- 11.3 Japan
- 11.4 South Korea
- 11.5 Thailand
- 11.6 Indonesia
- 11.7 Vietnam
- 11.8 Malaysia
- 11.9 Australia
- 11.10 Rest of Asia Pacific
Chapter 12. Latin America Block Chain Technology Market
- 12.1 Brazil
- 12.2 Argentina
- 12.3 Colombia
- 12.4 Chile
- 12.5 Rest of Latin America
Chapter 13. Middle East Block Chain Technology Market
- 13.1 Saudi Arabia
- 13.2 United Arab Emirates
- 13.3 Turkey
- 13.4 Israel
- 13.5 Iran
- 13.6 Rest of the Middle East
Chapter 14. Africa Block Chain Technology Market
- 14.1 South Africa
- 14.2 Egypt
- 14.3 Nigeria
- 14.4 Morocco
- 14.5 Rest of Africa
Chapter 15. Block Chain Technology Company Profiles
- 15.1 [Company 01]
- 15.1.1 Company Overview
- 15.1.2 Key Management Personnel
- 15.1.3 Products & Services Portfolio
- 15.1.4 Financial Performance
- 15.1.5 Key Market Focus & Geographic Presence
- 15.1.6 Recent Developments & Strategic Initiatives
Note: The company profile list is preliminary and may change based on research findings, market developments, data availability, and client requirements.
Chapter 16. Appendices
- Appendix A – List of Abbreviations & Acronyms
- Appendix B – Industry Classification Code Reference – Full Series
- Appendix C – Supply, Output & Operating Capacity Data Tables
- Appendix D – End-Use & Demand Base Tables
- Appendix E – Demand, Adoption & Usage Assumptions
- Appendix F – Pricing & Revenue Metric Reference Tables
- Appendix G – Company Operations & Infrastructure Database
- Appendix H – Cross-Border Trade & Activity Data Tables (Where Applicable)
- Appendix I – Regulatory Summary Tables
- Appendix J – Primary Research Participant List (Anonymized)
- Appendix K – Primary Research Questionnaire Framework
- Appendix L – Data Sources & Bibliography
- Appendix M – Market Size Divergence & Source Comparison
Chapter 17. Research Methodology
- 17.1 Research Framework & Philosophy
- 17.2 Secondary Research – Sources, Hierarchy & Data Extraction
- 17.3 Data Modeling – Bottom-Up & Top-Down Market Sizing
- 17.4 Primary Research – Stakeholder Framework, LOI & Sample Sizes
- 17.5 Forecast Methodology – Regression, Scenario & Sensitivity Analysis
- 17.6 Quality Control – Four-Layer Validation Framework
- 17.7 Limitations & Standard Assumptions
- 17.8 Disclaimer
