
Bone Densitometer Systems Market Overview:
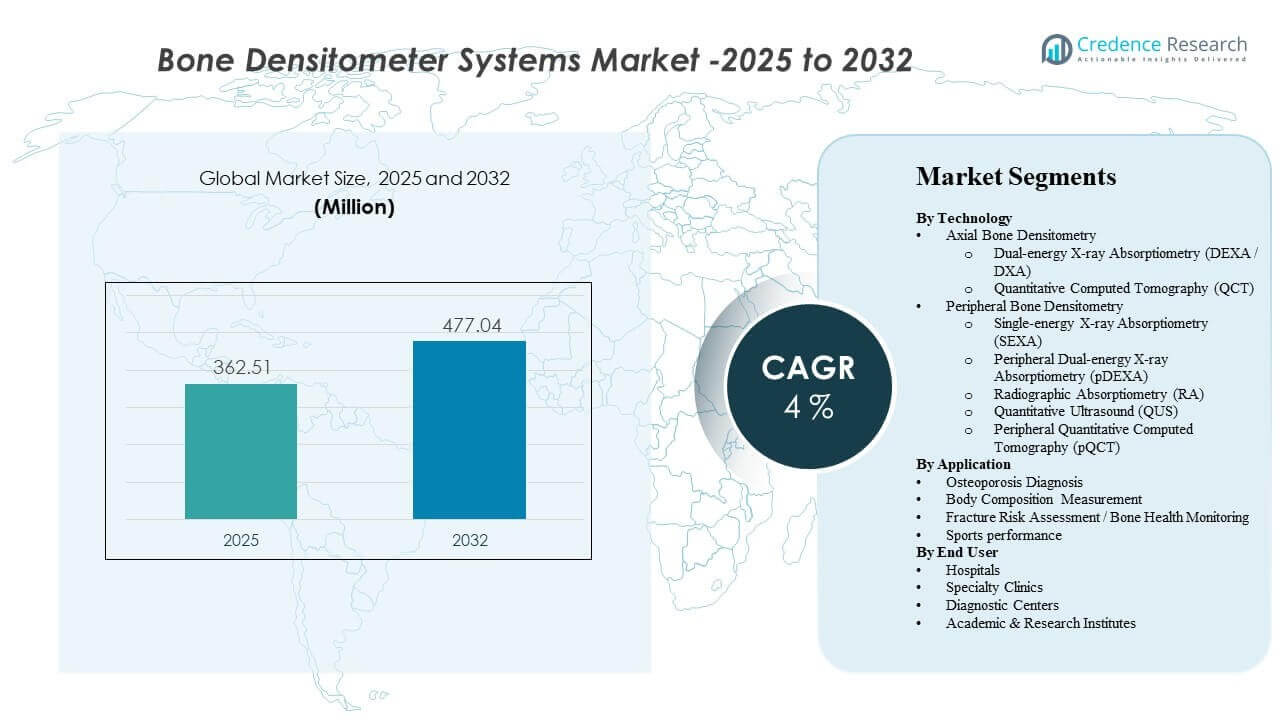
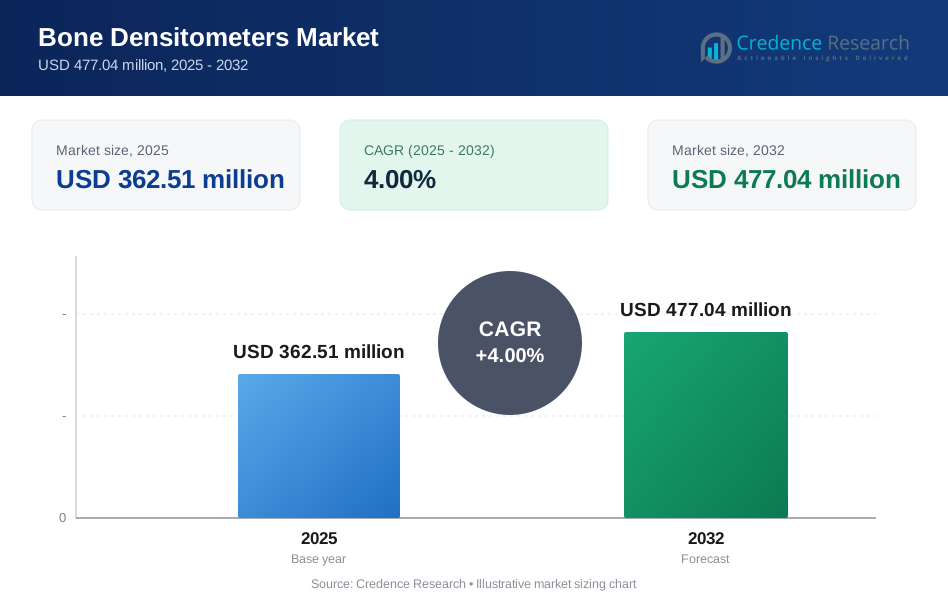
The global Bone Densitometer Systems Market size was estimated at USD 362.51 million in 2025 and is expected to reach USD 477.04 million by 2032, growing at a CAGR of 4% from 2025 to 2032. Increasing osteoporosis screening volumes in aging populations are reinforcing routine diagnostic demand for bone density assessments across hospitals and diagnostic centers. Growing use of body composition measurement in metabolic health, sports medicine, and preventive care is also expanding clinical use cases for densitometry platforms beyond traditional osteoporosis pathways.
| REPORT ATTRIBUTE | DETAILS |
|---|---|
| Historical Period | 2020-2024 |
| Base Year | 2025 |
| Forecast Period | 2026-2032 |
| Bone Densitometer Systems Market Size 2025 | USD 362.51 million |
| Bone Densitometer Systems Market, CAGR | 4% |
| Bone Densitometer Systems Market Size 2032 | USD 477.04 million |
Key Market Trends & Insights
- Osteoporosis diagnosis accounted for the largest share of 70.8% in 2025, reflecting the continued focus on screening, diagnosis, and therapy monitoring pathways.
- Dual-energy X-ray absorptiometry (DXA/DEXA) represented an estimated 63.4% share in 2025, supported by broad clinical familiarity and standard-of-care positioning.
- Body composition measurement is projected to grow at a 11.32% CAGR over the forecast period, driven by demand for lean mass, fat mass, and sarcopenia-related assessments.
- Asia Pacific is expected to be the fastest-growing region with a 8.19% CAGR over the forecast period, supported by expanding diagnostic infrastructure and rising awareness.
- North America held 25.10% share in 2025, reflecting higher testing penetration and established reimbursement-led diagnostic workflows.
Segment Analysis
The Bone Densitometer Systems Market demand profile is shaped by the mix of axial and peripheral testing requirements across routine osteoporosis diagnosis, longitudinal bone health monitoring, and emerging body composition use cases. In clinical practice, scan workflows are designed for high throughput, and densitometry exams are positioned as practical tests that support screening and follow-up decisions across primary and specialty care settings. The ability to deliver repeatable measurements is central to therapy monitoring, fracture risk assessment, and population-level screening programs.
System utilization is also influenced by operational convenience and patient experience considerations. Typical bone density scan workflows are designed to be completed quickly, supporting higher patient throughput in hospitals and diagnostic centers. Body composition assessment capabilities are increasingly used to extend utilization across metabolic health, weight management, sarcopenia evaluation, and sports-related performance monitoring, which broadens the relevance of densitometry systems beyond osteoporosis-only pathways.
Reimbursement and care pathway integration continue to influence adoption decisions by providers. When densitometry testing is embedded into preventive care guidelines and follow-up protocols, demand stabilizes and replacement cycles improve for installed systems. Technology differentiation also matters, particularly in balancing precision, radiation exposure considerations, portability, and ease of deployment in outpatient or decentralized settings.
By Technology Insights
Dual-energy X-ray absorptiometry (DEXA / DXA) accounted for the largest share of 63.4% in 2025. DXA systems lead because DXA systems are widely used for standardized bone mineral density assessment at clinically important axial sites and are well aligned with routine osteoporosis care pathways. DXA systems also support longitudinal monitoring, which is important for therapy response tracking and follow-up scheduling. DXA platforms further benefit from multi-purpose usage, as body composition measurement modules can increase system utilization within the same installed base.
By Application Insights
Osteoporosis Diagnosis accounted for the largest share of 70.8% in 2025. Osteoporosis diagnosis leads because osteoporosis screening and diagnostic confirmation remain the most established densitometry use case across hospitals, clinics, and diagnostic centers. Osteoporosis management requires repeat testing for monitoring and risk stratification, sustaining consistent testing volumes. Osteoporosis diagnosis workflows also align with clinical decision-making for fracture prevention and therapy selection, reinforcing demand for densitometry systems.
By End User Insights
Hospitals continue to represent a major adoption center because hospitals concentrate imaging workflows, specialist availability, and integrated diagnostic pathways for bone health assessment. Specialty clinics support demand through repeat monitoring in orthopedics, endocrinology, rheumatology, and sports medicine settings where densitometry supports decision-making and treatment tracking. Diagnostic centers expand market access through high-throughput outpatient testing and referral-based volumes. Academic and research institutes contribute through protocol-driven studies that use densitometry for bone health and body composition research applications.
Bone Densitometer Systems Market Drivers
Rising osteoporosis screening and monitoring demand
Bone health screening volumes are supported by aging populations and higher awareness of fracture prevention in routine care settings. Providers increasingly integrate bone density assessment into care pathways for post-menopausal women and other at-risk groups. Longitudinal monitoring needs also support repeat testing demand where therapy response tracking is required. Higher screening volumes improve utilization rates for installed densitometry systems, supporting replacement demand and technology upgrades.
- For instance, Hologic states that its Horizon DXA system completes bone density scans in about 10 to 30 seconds, while its atypical femur fracture assessment can be performed with a 15-second scan, supporting faster screening and follow-up throughput in routine practice.
Expansion of body composition measurement use cases
Body composition measurement is increasingly used in metabolic health management, obesity programs, and sarcopenia-related risk assessment. Providers adopt densitometry-based body composition measurement to support clinical evaluation of lean mass and fat distribution trends. Broader outpatient adoption is also supported by preventive care models where measurement-based monitoring is used to evaluate progress. These use cases increase system utilization and strengthen the value proposition for multi-functional densitometry systems.
Growth of outpatient diagnostics and referral-based testing
Diagnostic centers and outpatient clinics are expanding imaging services to meet demand for non-invasive screening tests. Referral-based pathways from primary care and specialty providers increase testing throughput outside hospitals. Outpatient-centric delivery models also prioritize fast workflow integration and operational efficiency. These shifts support adoption of densitometry systems that are easier to deploy, maintain, and schedule within routine diagnostic operations.
- For instance, DMS Imaging says its STRATOS DR can perform examinations in only 15 seconds per site, supports multiple users across different workstations, and enables DICOM-based import and export to PACS and RIS, features that fit high-turnover outpatient environments.
Technology improvements supporting workflow efficiency
Vendors continue to improve software and analytics capabilities to enhance reporting, precision, and consistency across repeat measurements. Workflow improvements support higher throughput and simplified technician training requirements. Enhanced analytics and integrated assessment tools help providers convert raw measurements into actionable clinical outputs. Continuous software updates and platform improvements extend installed system life and improve upgrade pathways for providers.
Bone Densitometer Systems Market Challenges
Capital equipment affordability and replacement cycle length remain important challenges for densitometry adoption, particularly in cost-sensitive settings. Providers often prioritize multi-modality imaging investments, which can delay densitometry purchases when budget constraints exist. Procurement cycles can be lengthy in public systems and tender-driven markets, which affects near-term unit shipments. Service coverage, calibration requirements, and staff training needs also influence total cost of ownership and can slow adoption in smaller facilities.
- For instance, GE HealthCare’s Lunar iDXA is designed for a 3.5 m x 3.2 m exam room, typically without operator shielding or special site preparation beyond a dedicated power outlet, while supporting patients up to 204 kg and operating at 750 VA during scanning, which reflects a clear effort to reduce installation complexity and expand clinical usability even though affordability barriers can still delay purchase decisions in smaller facilities.
Reimbursement variability and uneven guideline implementation can also limit market expansion. Some care settings may lack consistent screening pathways or structured referral programs, reducing test volumes and weakening utilization economics. Differences in clinical adoption across geographies can create demand concentration in a smaller number of high-penetration markets. Competitive pricing pressure may intensify in the mid-range segment, challenging vendors to maintain margins while delivering software and service improvements.
Bone Densitometer Systems Market Trends and Opportunities
A key opportunity is the growing emphasis on preventive care and risk stratification, where densitometry can be integrated into broader musculoskeletal and metabolic health programs. Clinical demand is expanding for measurement-based monitoring in weight management and sarcopenia assessment, which increases interest in body composition-enabled platforms. Workflow-driven outpatient adoption also creates room for systems that improve throughput and reduce operational burden. These factors support product differentiation in software analytics, reporting automation, and integrated risk assessment tools.
Decentralized testing and portable solutions represent another trend area, especially for outreach screening and smaller clinics. Demand for lower-footprint systems supports adoption of peripheral and portable modalities where appropriate clinical use cases exist. Partnerships with diagnostic networks and specialty clinics can accelerate adoption by embedding testing into referral pathways. Technology vendors that align clinical evidence, workflow design, and service capability can increase penetration across both mature and developing healthcare markets.
- For instance, BeamMed states that its MiniOmni portable bone density scanner enables patient screening 3 times faster, uses Sunlight Omnipath technology validated through thousands of Sunlight Omnisense installations worldwide since 2000, and has been proven across dozens of health providers and hundreds of clinics, highlighting its fit for decentralized screening environments.
Regional Insights
North America
North America accounted for 25.10% share in 2025, supported by higher diagnostic testing penetration and established osteoporosis management pathways. Hospitals and diagnostic centers contribute steady demand through routine screening and follow-up monitoring programs. Provider preference for standardized testing supports continued utilization of axial densitometry systems. Replacement demand is influenced by software updates, workflow efficiency improvements, and service coverage expectations.
Europe
Europe represented 22.65% share in 2025, reflecting strong alignment with aging demographics and established bone health pathways in many countries. Demand is supported by public healthcare screening programs and specialist-driven monitoring protocols. Procurement can be influenced by tender processes and system-level budgeting, which shapes replacement timing. Opportunities remain in expanding body composition use cases and improving outpatient access.
Asia Pacific
Asia Pacific led with 29.35% share in 2025 and is expected to be the fastest-growing region due to rising diagnostic infrastructure investment and increasing osteoporosis awareness. Large patient pools, expanding private diagnostics, and improving access to imaging services support volume growth. Adoption benefits from strengthening specialty care pathways and greater preventive screening adoption in urban healthcare networks. Increased focus on metabolic health and fitness-related assessment also supports body composition measurement demand.
Latin America
Latin America held 10.95% share in 2025, with demand concentrated in larger economies and private diagnostic networks. Access gaps and uneven distribution of imaging infrastructure shape adoption patterns. Hospitals and private diagnostic centers typically drive most testing volumes where referral networks are stronger. Market expansion is supported by gradual improvements in outpatient diagnostics and expanding specialty care coverage.
Middle East & Africa
Middle East & Africa accounted for 11.95% share in 2025, supported by demand concentration in higher-investment healthcare markets and private hospital expansion. Adoption varies widely by country due to differences in infrastructure maturity and reimbursement pathways. Growing investment in specialty hospitals and diagnostic centers supports gradual expansion. Opportunities exist for vendors with strong service capability and flexible deployment models in decentralized care settings.
Competitive Landscape
Competition in the Bone Densitometer Systems Market is shaped by technology performance, workflow efficiency, service coverage, and software-driven reporting capabilities. Vendors compete on measurement precision, throughput, ease of installation, and upgrade pathways that extend installed system value. Product positioning also depends on modality choice across axial and peripheral testing, with differentiation emerging in analytics features, reporting automation, and support for body composition measurement workflows. Provider decision-making often balances clinical standardization needs against total cost of ownership and operational fit.
BeamMed Ltd. is positioned around solutions that support accessible bone health assessment, including deployment models that can fit outpatient and decentralized screening workflows. BeamMed Ltd. differentiation typically emphasizes practical testing experiences, streamlined workflows, and alignment with screening-oriented use cases. BeamMed Ltd. also competes by enabling providers to expand testing availability beyond high-capital imaging centers. BeamMed Ltd. market traction depends on clinical fit, service capability, and adoption within referral and screening networks.
The industry research and growth report includes detailed analyses of the competitive landscape of the market and information about key companies, including:
- BeamMed Ltd.
- Diagnostic Medical Systems (DMS Imaging)
- Echolight S.p.A.
- GE HealthCare
- Hologic, Inc.
- OSTEOSYS Co., Ltd.
- Swissray International, Inc.
- Trivitron Healthcare
Qualitative and quantitative analysis of companies has been conducted to help clients understand the wider business environment as well as the strengths and weaknesses of key industry players. Data is qualitatively analyzed to categorize companies as pure play, category-focused, industry-focused, and diversified; it is quantitatively analyzed to categorize companies as dominant, leading, strong, tentative, and weak.
Recent Developments
- In March 2026, BPL Medical Technologies announced the acquisition of South Korea-based Yozma BMtech and, following the deal, launched BM Tech’s bone mineral density measuring systems in India and Dubai to expand its preventive healthcare, bone health, and women’s health diagnostics portfolio.
- In October 2025, Blackstone and TPG agreed to acquire Hologic, Inc. for up to $18.3 billion, and market coverage noted that the deal includes access to Hologic’s diagnostic imaging portfolio, including DXA bone densitometers.
- In Oct 2025, Echolight S.p.A. announced a demonstration of radiation-free bone density scanning at RSNA 2025, supporting positioning and adoption momentum. The update matters because major clinical imaging forums can influence provider awareness and technology evaluation cycles.
Report Scope
| Report Attribute | Details |
| Market size value in 2025 | USD 362.51 million |
| Revenue forecast in 2032 | USD 477.04 million by 2032 |
| Growth rate (CAGR) | 4% (2025–2032) |
| Base year | 2025 |
| Forecast period | 2026-2032 |
| Quantitative units | USD million |
| Segments covered | By Technology Outlook; By Application Outlook; By End User Outlook |
| Regional scope | North America, Europe, Asia Pacific, Latin America, Middle East & Africa |
| Key companies profiled | BeamMed Ltd., Diagnostic Medical Systems (DMS Imaging), Echolight S.p.A., GE HealthCare, Hologic, Inc., OSTEOSYS Co., Ltd., Swissray International, Inc., Trivitron Healthcare companies |
| No.of Pages | 334 |
Segmentation
By Technology
- Axial Bone Densitometry [Dual-energy X-ray Absorptiometry (DEXA / DXA), Quantitative Computed Tomography (QCT)]
- Peripheral Bone Densitometry [Single-energy X-ray Absorptiometry (SEXA), Peripheral Dual-energy X-ray Absorptiometry (pDEXA), Radiographic Absorptiometry (RA), Quantitative Ultrasound (QUS), Peripheral Quantitative Computed Tomography (pQCT)]
By Application
- Osteoporosis Diagnosis
- Body Composition Measurement
- Fracture Risk Assessment / Bone Health Monitoring
- Sports performance
By End User
- Hospitals
- Specialty Clinics
- Diagnostic Centers
- Academic & Research Institutes
By Region
- North America
- U.S.
- Canada
- Mexico
- Europe
- Germany
- France
- U.K.
- Italy
- Spain
- Rest of Europe
- Asia Pacific
- China
- Japan
- India
- South Korea
- South-east Asia
- Rest of Asia Pacific
- Latin America
- Brazil
- Argentina
- Rest of Latin America
- Middle East & Africa
- GCC Countries
- South Africa
- Rest of the Middle East and Africa
Request a Free Sample
Fill in your details and we'll send you a free sample report.
- Sample data tables & charts
- Research methodology
Need a Custom Version of This Report?
Tailor the scope, geography, or segments to your exact requirements.
- Custom geography or segment scope
- Direct access to our analyst team
Frequently Asked Questions
What is the market size of the Bone Densitometer Systems Market in 2025?
What is the forecasted market size by 2032?
What is the largest segment in this market?
What factors are driving market growth?
What are the primary applications of bone densitometry?
Which region leads the Bone Densitometer Systems Market in 2025?
Table of Content
Chapter 1. Report Introduction
- 1.1 Report Description & Purpose
- 1.1.1 Report Title & Market Definition
- 1.1.2 Unique Selling Propositions (USP) & Key Differentiators
- 1.1.3 Value Proposition for Stakeholders
- 1.2 Research Objectives
- 1.2.1 Market Sizing Objectives (Volume & Revenue) (Volume Where Applicable)
- 1.2.2 Segmentation Objectives
- 1.2.3 Competitive Intelligence Objectives
- 1.2.4 Forecast & Scenario Objectives
- 1.3 Report Scope
- 1.3.1 Bone Densitometers Scope – Segments & Subsegments Covered
- 1.3.2 Geographic Scope – Regions & Countries Covered
- 1.3.3 Historical Period, Base Year & Forecast Period (2025; forecast to 2032)
- 1.3.4 Inclusions & Exclusions
- 1.4 Industry Classification & Applicable Codes
- 1.5 Currency, Measurement Units & Valuation Basis
- 1.6 Target Stakeholders
- 1.7 Limitations & Assumptions
Chapter 2. Executive Summary
- 2.1 Global Bone Densitometers Market Snapshot
- 2.1.1 Market Size – Historical (2025) & Forecast (2025-2032) (2025: USD 362.51 million → 2032: USD 477.04 million)
- 2.1.2 Volume & Revenue – Global Totals (Volume Where Applicable)
- 2.1.3 Key Market Highlights – Top Five Facts
- 2.2 Bone Densitometers Market Segmentation Snapshot
- 2.2.1 Market Split by Region – 2025 vs. 2032
- 2.3 Competitive Snapshot
- 2.3.1 Top 10 Players by Revenue Share – 2025
- 2.3.2 Top 10 Players by Volume Share – 2025 (Volume Where Applicable)
- 2.3.3 Recent Strategic Developments (18-Month Summary)
- 2.4 Key Investment Highlights & Strategic Conclusions
Chapter 3. Bone Densitometers Market Dynamics & Industry Analysis
- 3.1 Market Overview & Context
- 3.1.1 Bone Densitometers Market Position in the Broader Industry Value Chain
- 3.1.2 Demand Structure & Purchasing Dynamics
- 3.1.3 Market Maturity & Development Stage by Region
- 3.2 Bone Densitometers Market Drivers
- 3.3 Bone Densitometers Market Restraints & Challenges
- 3.4 Bone Densitometers Market Opportunities
- 3.5 Porter's Five Forces Analysis
- 3.5.1 Threat of New Entrants
- 3.5.2 Bargaining Power of Suppliers
- 3.5.3 Bargaining Power of Buyers
- 3.5.4 Threat of Substitutes
- 3.5.5 Competitive Rivalry – Intensity Assessment
- 3.6 Bone Densitometers Value Chain Analysis
- 3.6.1 Upstream – Key Inputs, Resources & Suppliers
- 3.6.1.1 Key Input/Resource 1
- 3.6.1.2 Key Input/Resource 2
- 3.6.1.3 Key Input/Resource 3
- 3.6.2 Midstream – Core Operations & Value Creation
- 3.6.2.1 Operating Model & Process Overview
- 3.6.2.2 Key Operating Locations & Capabilities by Company
- 3.6.3 Downstream – Market Channels & End Users
- 3.6.3.1 Direct Sales & Customer Engagement Channels
- 3.6.3.2 Indirect Sales, Intermediaries & Partner Channels
- 3.6.4 Value Chain Profitability Analysis
- 3.6.1 Upstream – Key Inputs, Resources & Suppliers
- 3.7 PESTEL Analysis
- 3.7.1 Political Factors
- 3.7.2 Economic Factors
- 3.7.3 Social Factors
- 3.7.4 Technological Factors
- 3.7.5 Environmental Factors
- 3.7.6 Legal Factors
- 3.8 Bone Densitometers Supply Chain Analysis
- 3.8.1 Critical Input & Resource Availability Risk Assessment
- 3.8.2 Supplier & Operational Concentration Risk (Geographic Exposure)
- 3.8.3 Supply & Service Disruption Impact Analysis
- 3.9 Regulatory & Policy Landscape
Note: The regulatory and policy landscape section covers regulations based on their applicability to the market, Bone Densitometers category, geography, and scope of the study. Only regulatory frameworks with a material impact on operations, compliance, trade, sustainability, or market access are analyzed in detail.
Chapter 4. Key Investment Pockets & Opportunity Analysis
- 4.1 Bone Densitometers Market Attractiveness Analysis
- 4.1.1 By Region – Investment Attractiveness Matrix (Market Size × CAGR)
- 4.2 Absolute Revenue Growth Opportunity
- 4.2.1 By Region – Absolute Revenue Growth Through 2032
- 4.3 Incremental Demand Opportunity
- 4.3.1 By Region – Incremental Demand Through 2032
- 4.3.2 Segment – Incremental Demand
- 4.4 Emerging Submarket Opportunity Deep Dive (Subject to Applicability)
- 4.5 Priority Market Opportunity Scorecards
- 4.5.1 United States
- 4.5.2 Europe
- 4.5.3 Asia
- 4.5.4 Middle East & Africa
Note: Priority market opportunity scorecards reflect the geographic scope and strategic relevance of the study. Listed markets are indicative and may be adapted to the industry.
Chapter 5. Bone Densitometers Cross-Border Trade & Market Access Analysis
- 5.1 International Trade & Cross-Border Activity Overview
- 5.1.1 Global Export Value by Country (2025)
- 5.1.2 Global Export Volume by Country (2025) (Volume Where Applicable)
- 5.1.3 Global Import Value by Country (2025)
- 5.1.4 Global Import Volume by Country (2025) (Volume Where Applicable)
- 5.1.5 Net Trade Balance by Country (2025)
- 5.2 Export Analysis – Segment
- 5.2.1 Category 1 (Applicable Classification Code)
- 5.2.2 Category 2 (Applicable Classification Code)
- 5.2.3 Category 3 (Applicable Classification Code)
- 5.2.4 Category 4 (Applicable Classification Code)
- 5.2.5 Category 5 (Applicable Classification Code)
- 5.3 Import Analysis – Segment
- 5.3.1 Category 1 (Applicable Classification Code)
- 5.3.2 Category 2 (Applicable Classification Code)
- 5.3.3 Category 3 (Applicable Classification Code)
- 5.3.4 Category 4 (Applicable Classification Code)
- 5.3.5 Category 5 (Applicable Classification Code)
- 5.4 Cross-Border Pricing & Transaction Benchmarks
- 5.4.1 Export Pricing – Segment & Country
- 5.4.2 Import Pricing – Segment & Source Country
- 5.4.3 Price Trends (2025)
- 5.5 Key Cross-Border Trade & Delivery Routes
- 5.5.1 Cross-Border Trade/Delivery Route 1
- 5.5.2 Cross-Border Trade/Delivery Route 2
- 5.5.3 Cross-Border Trade/Delivery Route 3
- 5.5.4 Cross-Border Trade/Delivery Route 4
- 5.5.5 Cross-Border Trade/Delivery Route 5
- 5.6 Trade Policy & Market Access Impact Assessment
- 5.6.1 Tariff & Non-Tariff Barriers
- 5.6.2 Regional Trade & Economic Integration Frameworks
- 5.6.3 Bilateral & Multilateral Trade Agreements
- 5.6.4 Cross-Border Operating, Licensing & Localization Requirements
Note: This chapter applies where cross-border trade or delivery is relevant to Bone Densitometers. Goods, services, and digital offerings are assessed using applicable classifications and transaction measures. Import-export volumes, trade balances, and route analyses are included only where meaningful to the market.
Chapter 6. Competitive Landscape & Company Benchmarking
- 6.1 Bone Densitometers Market Concentration & Structure
- 6.1.1 Herfindahl-Hirschman Index (HHI) – vs. 2025
- 6.1.2 Leading, Mid-Sized & Emerging Player Structure
- 6.1.3 Global, Regional & Local Player Dynamics
- 6.2 Bone Densitometers Market Share Analysis – 2025
- 6.2.1 Global Revenue Share by Company
- 6.2.2 Global Volume Share by Company (Volume Where Applicable)
- 6.2.3 Regional Revenue Share
- 6.2.4 Market Share Evolution ( vs. 2025)
- 6.2.5 Company Market Share by Key Segment
- 6.2.6 Company Market Share by Customer Group
- 6.3 Operating Scale, Capacity & Infrastructure Analysis
- 6.3.1 Global Operating Scale & Supply Capacity
- 6.3.2 Resource Utilization & Operating Efficiency
- 6.3.3 Output, Service Delivery & Activity Metrics
- 6.3.4 Operating Footprint & Infrastructure Map
- 6.3.5 Planned Operational & Capacity Expansion
- 6.4 Bone Densitometers Competitive Benchmarking Matrix
- 6.4.1 Revenue, Growth, Profitability & Operating Metric Comparison
- 6.4.2 Channel Revenue Mix
- 6.4.3 Geographic Revenue Exposure
- 6.4.4 R&D Intensity
- 6.4.5 Sustainability Maturity
- 6.5 Strategic Developments in Bone Densitometers (Last 24 Months)
- 6.5.1 Mergers, Acquisitions & Divestments
- 6.5.2 New Products, Services & Solutions in Bone Densitometers
- 6.5.3 Operational & Infrastructure Expansions
- 6.5.4 Strategic Alliances, Joint Ventures & Partnerships
- 6.5.5 Distribution Expansion & Market Entry
- 6.5.6 Sustainability & ESG Initiatives
- 6.6 Competitive Strategy Mapping
- 6.6.1 Leader, Challenger, Follower & Niche Classification
- 6.6.2 Pricing Strategy Comparison
- 6.6.3 Channel Strategy Matrix
Note: Strategic developments are included based on their materiality and the availability of reliable information.
Chapter 7. Global Bone Densitometers Market – By Sales & Delivery Channel
- 7.1 Segment Overview
- 7.1.1 Volume & Revenue Split by Channel (2025 & 2032) (Volume Where Applicable)
- 7.1.2 Channel Mix Evolution (2025-2032)
Chapter 8. Regional Market Analysis – Global Overview
- 8.1 Global Regional Overview
- 8.1.1 Regional Volume Share (Volume Where Applicable)
- 8.1.2 Regional Revenue Share
- 8.1.3 Regional Volume by Region (Volume Where Applicable)
- 8.1.4 Regional Revenue by Region
- 8.1.5 Regional Forecast Through 2032
- 8.2 Cross-Regional Segment Analysis
- 8.2.1 By Sales & Delivery Channel
- 8.2.2 By Competitive Positioning & Price Tier
Chapter 9. North America Bone Densitometers Market
- 9.1 United States
- 9.2 Canada
- 9.3 Mexico
Chapter 10. Europe Bone Densitometers Market
- 10.1 Germany
- 10.2 France
- 10.3 Italy
- 10.4 United Kingdom
- 10.5 Spain
- 10.6 Poland
- 10.7 Russia
- 10.8 Netherlands
- 10.9 Belgium
- 10.10 Sweden
- 10.11 Denmark
- 10.12 Norway
- 10.13 Rest of Europe
Chapter 11. Asia Pacific Bone Densitometers Market
- 11.1 China
- 11.2 India
- 11.3 Japan
- 11.4 South Korea
- 11.5 Thailand
- 11.6 Indonesia
- 11.7 Vietnam
- 11.8 Malaysia
- 11.9 Australia
- 11.10 Rest of Asia Pacific
Chapter 12. Latin America Bone Densitometers Market
- 12.1 Brazil
- 12.2 Argentina
- 12.3 Colombia
- 12.4 Chile
- 12.5 Rest of Latin America
Chapter 13. Middle East Bone Densitometers Market
- 13.1 Saudi Arabia
- 13.2 United Arab Emirates
- 13.3 Turkey
- 13.4 Israel
- 13.5 Iran
- 13.6 Rest of the Middle East
Chapter 14. Africa Bone Densitometers Market
- 14.1 South Africa
- 14.2 Egypt
- 14.3 Nigeria
- 14.4 Morocco
- 14.5 Rest of Africa
Chapter 15. Bone Densitometers Company Profiles
- 15.1 [Company 01]
- 15.1.1 Company Overview
- 15.1.2 Key Management Personnel
- 15.1.3 Products & Services Portfolio
- 15.1.4 Financial Performance
- 15.1.5 Key Market Focus & Geographic Presence
- 15.1.6 Recent Developments & Strategic Initiatives
Note: The company profile list is preliminary and may change based on research findings, market developments, data availability, and client requirements.
Chapter 16. Appendices
- Appendix A – List of Abbreviations & Acronyms
- Appendix B – Industry Classification Code Reference – Full Series
- Appendix C – Supply, Output & Operating Capacity Data Tables
- Appendix D – End-Use & Demand Base Tables
- Appendix E – Demand, Adoption & Usage Assumptions
- Appendix F – Pricing & Revenue Metric Reference Tables
- Appendix G – Company Operations & Infrastructure Database
- Appendix H – Cross-Border Trade & Activity Data Tables (Where Applicable)
- Appendix I – Regulatory Summary Tables
- Appendix J – Primary Research Participant List (Anonymized)
- Appendix K – Primary Research Questionnaire Framework
- Appendix L – Data Sources & Bibliography
- Appendix M – Market Size Divergence & Source Comparison
Chapter 17. Research Methodology
- 17.1 Research Framework & Philosophy
- 17.2 Secondary Research – Sources, Hierarchy & Data Extraction
- 17.3 Data Modeling – Bottom-Up & Top-Down Market Sizing
- 17.4 Primary Research – Stakeholder Framework, LOI & Sample Sizes
- 17.5 Forecast Methodology – Regression, Scenario & Sensitivity Analysis
- 17.6 Quality Control – Four-Layer Validation Framework
- 17.7 Limitations & Standard Assumptions
- 17.8 Disclaimer
