
Cartilage Repair Regeneration Market Overview:
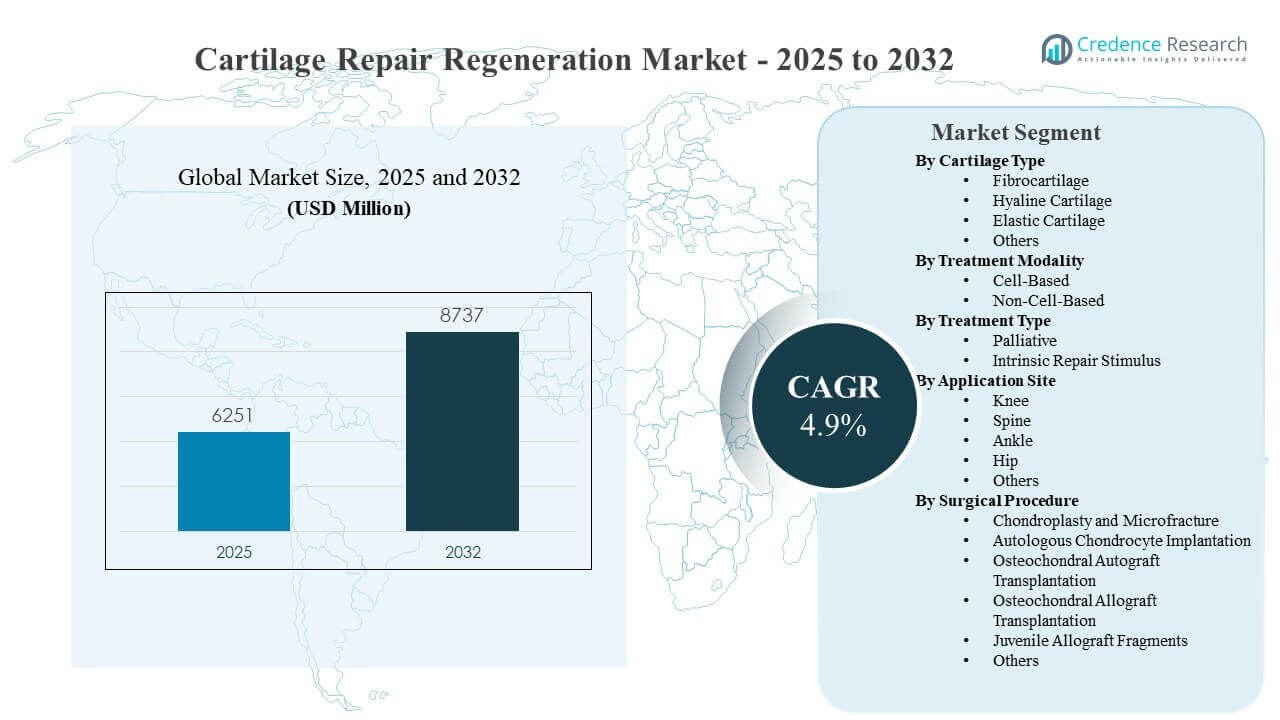
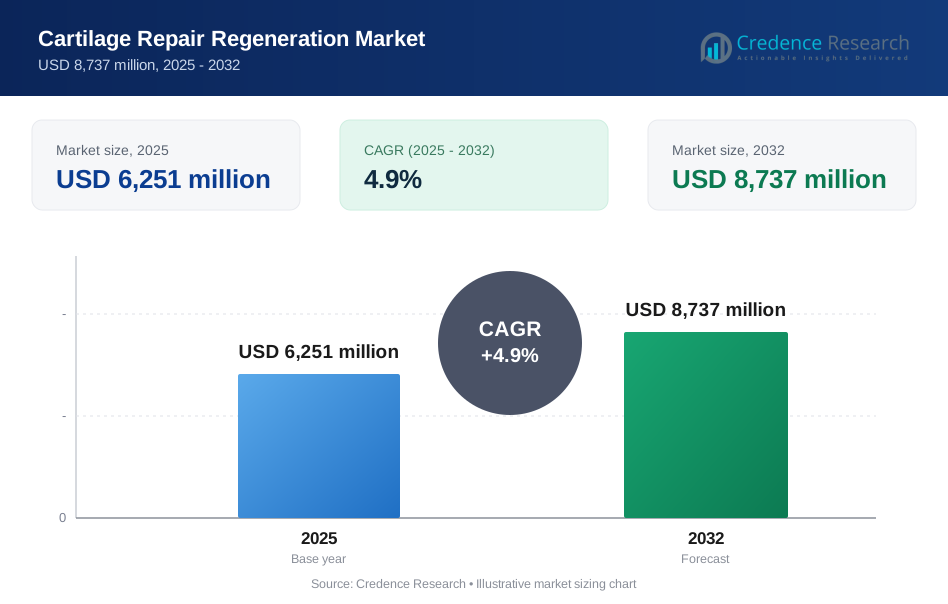
The global Cartilage Repair Regeneration Market size was estimated at USD 6,251 million in 2025 and is expected to reach USD 8,737 million by 2032, growing at a CAGR of 4.9% from 2025 to 2032. Demand is primarily driven by the rising clinical need to restore joint surface integrity in active and aging populations, where durable repair can reduce pain progression and delay more invasive interventions. Market momentum is further supported by expanding specialist orthopedic capacity and broader adoption of restorative techniques in high-volume sports medicine and cartilage centers.
| REPORT ATTRIBUTE | DETAILS |
|---|---|
| Historical Period | 2020-2024 |
| Base Year | 2025 |
| Forecast Period | 2026-2032 |
| Cartilage Repair Regeneration Market Size 2025 | USD 6,251 million |
| Cartilage Repair Regeneration Market, CAGR | 4.9% |
| Cartilage Repair Regeneration Market Size 2032 | USD 8,737 million |
Key Market Trends & Insights
- The market is projected to expand from USD 6,251 million (2025) to USD 8,737 million (2032) at a 4.9% CAGR (2025–2032).
- North America accounted for 43.35% of global revenue in 2025, reflecting higher procedure penetration and wider access to advanced restorative options.
- Hyaline cartilage held 63.90% share in 2025, supported by the high clinical focus on articular surface restoration in load-bearing joints.
- Cell-Based therapies captured 58.80% share in 2025, indicating continued preference for regenerative approaches in appropriately selected defects.
- Chondroplasty & microfracture represented 29.40% share in 2025, sustaining leadership due to accessibility and large addressable arthroscopy volumes.
Segment Analysis
Cartilage repair and regeneration demand is shaped by the need to address focal chondral and osteochondral defects with a mix of first-line and restorative interventions. Procedure selection typically depends on lesion size, patient age/activity profile, joint location, and surgeon preference, which together drive a blended market of high-throughput arthroscopic techniques and higher-value regenerative solutions. Reimbursement clarity, surgeon training, and standardized protocols in high-volume centers continue to influence adoption across repair modalities. Product differentiation increasingly focuses on predictable handling, reproducible outcomes, and post-operative rehabilitation compatibility.
Market growth is also supported by rising diagnosis rates, improved imaging access, and earlier intervention preferences in sports medicine pathways. As centers increase procedural standardization, suppliers benefit from bundled workflow support such as instrumentation, training, and service coverage. Patient expectations for faster recovery and return-to-activity reinforce demand for solutions that can deliver durable functional improvement. Over time, increased familiarity with restorative approaches is expanding the addressable pool beyond elite athletes into broader orthopedic patient populations.
By Cartilage Type Insights
Hyaline Cartilage accounted for the largest share of 63.90% in 2025. Hyaline cartilage restoration remains a priority because many clinically significant defects occur in articular surfaces that determine joint mechanics and long-term function. Specialized cartilage centers often channel complex cases into restorative pathways aligned to hyaline repair, supporting higher product utilization per procedure. Supplier portfolios increasingly emphasize repair quality, defect fill consistency, and integration with rehabilitation protocols to improve functional durability.
By Treatment Modality Insights
Cell-Based accounted for the largest share of 58.80% in 2025. Cell-based modalities continue to lead as surgeons pursue regenerative outcomes for appropriate lesions where longer-term restoration is prioritized. Concentration of procedures in specialized orthopedic and sports medicine centers supports repeat utilization supported by trained surgical teams. Adoption is reinforced when vendors provide standardized processing workflows, training programs, and dependable supply to reduce variability in real-world execution.
By Treatment Type Insights
Palliative accounted for the largest share of 52.10% in 2025. Palliative approaches retain a large base because they are widely available, familiar to surgeons, and frequently positioned earlier in treatment pathways for symptom relief and function improvement. High arthroscopy volumes in general orthopedic settings sustain demand for these procedures. Even as restorative options expand, palliative care remains clinically relevant for selected patients where lesion characteristics, comorbidities, or cost considerations guide decision-making.
By Application Site Insights
Knee accounted for the largest share of 47.30% in 2025. Knee cartilage repair dominates due to high incidence of sports injury, degenerative wear, and imaging-confirmed focal defects in a joint that strongly influences mobility and quality of life. Arthroscopic infrastructure and standardized knee workflows enable higher throughput and consistent adoption across hospitals and specialty centers. Suppliers benefit from established care pathways, predictable follow-up, and frequent procedural repetition that supports platform standardization.
By Surgical Procedure Insights
Chondroplasty and Microfracture accounted for the largest share of 29.40% in 2025. Leadership is sustained because these approaches are broadly accessible, scalable across sites, and aligned with high-volume arthroscopy routines. Many systems prioritize efficiency and procedural familiarity, which supports continued utilization in large patient cohorts. Vendors compete on instrumentation compatibility, workflow simplicity, and post-operative consistency, while also positioning upgrade pathways toward restorative techniques as case complexity increases.
Cartilage Repair Regeneration Market Drivers
Rising burden of joint cartilage defects and early intervention pathways
Increasing participation in sports and active lifestyles, combined with an aging population, is expanding the diagnosed pool of focal cartilage defects and degenerative lesions. Earlier imaging confirmation and orthopedic referral pathways increase procedural volumes in high-traffic joints, particularly the knee and ankle. Clinical preference for interventions that preserve joint structure supports adoption of both first-line arthroscopy solutions and restorative techniques. Providers increasingly prioritize standardized pathways that can reduce recovery variability and improve functional outcomes.
Growth in specialist orthopedic capacity and cartilage center expansion
Expansion of orthopedic hospitals, sports medicine clinics, and dedicated cartilage centers supports higher throughput and repeat procedural adoption. These centers typically implement standardized protocols, surgeon training programs, and post-operative rehabilitation coordination, which improves consistency and supports technology uptake. Vendor partnerships in training and case support strengthen procedure confidence and broaden the addressable base of trained surgeons. As procedure volumes grow, procurement decisions increasingly favor platforms with strong service and supply reliability.
- For instance, Arthrex's AutoCart system, deployed across 150+ specialized cartilage centers in North America by Q4 2024, enables single-stage autologous chondrocyte implantation for lesions ≤2 cm² in the knee and ≤1.5 cm² in the ankle, with BioCartilage extracellular matrix providing a 5-year shelf life that reduces inventory waste by 40% compared to cell-culture dependent alternatives.
Continued innovation in regenerative repair and restoration technologies
Advances in cell-based therapies, scaffolds, and defect-filling constructs are increasing the clinical toolkit available for cartilage restoration. Product improvements focused on handling, fixation reliability, and biological integration strengthen surgeon confidence and expand use in appropriately selected lesions. Better clinical evidence generation and refined patient selection protocols improve real-world performance perception. These dynamics support premium positioning for restorative solutions where durable function is prioritized.
Demand for minimally invasive solutions and improved recovery expectations
Patients and providers continue to favor minimally invasive procedures that can reduce hospital stay, enable predictable rehabilitation, and accelerate return to activity. Arthroscopy-based approaches remain central, supporting sustained volumes for widely accessible interventions. At the same time, demand for improved durability is pushing adoption of restorative solutions in specialist settings. Vendors that align products with rehabilitation protocols and outcome tracking benefit from stronger adoption and repeat use.
- For instance, Regentis Biomaterials' GelrinC achieved world-first quantitative validation using MOCART 2.0 scoring in its Phase II trial, demonstrating 94% morphologic cartilage regeneration at 60 months with repair tissue quality scores exceeding 85 out of 100 outperforming historical microfracture benchmarks by 23 percentage points in head-to-head MRI assessments.
Cartilage Repair Regeneration Market Challenges
Cartilage repair and regeneration outcomes remain sensitive to patient selection, lesion characteristics, surgical execution, and rehabilitation adherence, which can introduce variability across care settings. The market also faces complexity in aligning product choice to defect size and location, with different procedures suited to different clinical profiles. Reimbursement clarity and coverage depth can vary by country and payer type, influencing adoption of higher-cost restorative solutions. In some settings, limited surgeon training availability can slow consistent uptake of more complex modalities.
Operational challenges also include supply chain and scheduling requirements for certain regenerative workflows, as well as the need for consistent post-operative follow-up to protect outcomes. Procedure outcomes can be harder to standardize across decentralized care sites without robust training and clinical support. Hospitals often weigh total cost of care, including procedure time and reintervention risk, when selecting solutions. Competitive pressure increases as vendors position differentiated evidence, instrumentation compatibility, and service responsiveness to win standardized procurement decisions.
- For instance, Smith+Nephew's CARTIHEAL AGILI-C Cartilage Repair Implant reduced the relative risk of total knee arthroplasty or osteotomy by 87% at 48 months (1.2% vs. 9.5% conversion rate, p=0.003) compared to microfracture in a multicenter RCT, directly impacting reintervention cost models.
Cartilage Repair Regeneration Market Trends and Opportunities
A key trend is the progressive shift from purely symptomatic management toward structural restoration approaches in suitable patients, supported by greater awareness and expanded specialist capacity. Suppliers are increasingly integrating training, instrumentation, and workflow support into their commercial strategies to reduce variability and build procedural confidence. As providers track outcomes more consistently, products supported by stronger clinical evidence and repeatable handling are better positioned for premium utilization. This creates an opportunity for vendors to differentiate with standardized protocols and post-procedure monitoring support.
- For instance, Vericel Corporation's MACI (Matrix-Induced Autologous Chondrocyte Implantation) has demonstrated 97.1% overall insurance approval rates and sustained clinical improvements with 86% patient satisfaction at 15-year follow-up, supported by significant gains in IKDC, Lysholm, and KOOS scores across multiple studies.
Another opportunity lies in geographic expansion and service coverage improvements across emerging markets, where orthopedic procedure volumes are rising but access to advanced restorative options remains uneven. Vendors can grow share by offering tiered portfolios that match hospital purchasing realities while enabling step-up pathways to higher-value solutions. Partnerships with distributor networks, specialist societies, and cartilage centers can accelerate adoption. In parallel, faster-growing joints such as the ankle can support incremental demand for specialized repair pathways.
Regional Insights
North America
North America held 43.35% share in 2025, supported by strong procedure penetration, established orthopedic infrastructure, and wide availability of both high-throughput arthroscopy and advanced restorative options. Concentration of specialist centers enables consistent adoption of regenerative workflows, supported by structured training ecosystems. Procurement often favors suppliers with strong clinical evidence, dependable supply, and broad service coverage. Clinical pathways frequently emphasize timely intervention and rehabilitation coordination, supporting sustained procedural volumes.
Europe
Europe accounted for 25.40% share in 2025, supported by mature orthopedic care delivery and steady adoption across major markets. Public and mixed reimbursement structures can shape product selection and replacement timing, influencing the balance between first-line and restorative interventions. High surgical standards and guideline-driven pathways sustain procedure consistency, particularly in high-volume centers. Vendors that align offerings with procurement cycles and demonstrate workflow efficiency are better positioned for sustained adoption.
Asia Pacific
Asia Pacific represented 22.10% share in 2025, driven by expanding orthopedic capacity and rising diagnosis across large patient pools. Growth is supported by increasing sports medicine adoption in developed markets and expanding hospital capability in large emerging economies. Reimbursement and access remain heterogeneous, which influences the pace of adoption for premium restorative solutions. Vendors compete on performance-per-cost value, distributor reach, and clinician education to broaden utilization.
Latin America
Latin America captured 5.80% share in 2025, with demand concentrated in larger private hospital networks and metropolitan orthopedic centers. Access to advanced restorative options can be uneven, and price sensitivity influences product mix and procedural choices. Growth is supported by expanding arthroscopy adoption and rising awareness of focal defect treatment. Vendors that strengthen distributor coverage and deliver cost-aligned portfolio tiers can expand share in priority markets.
Middle East & Africa
Middle East & Africa held 3.35% share in 2025, supported by growth pockets in GCC countries and selected advanced centers in South Africa. Market size remains limited by uneven access, constrained reimbursement breadth in many countries, and smaller treated populations. Demand growth is strongest where private sector investment increases orthopedic specialization and arthroscopy capacity. Suppliers that build clinical education and ensure consistent availability can improve penetration over time.
Competitive Landscape
Competition is shaped by the coexistence of high-volume arthroscopy procedures and expanding restorative approaches, which drives vendors to differentiate across clinical evidence, surgeon training, and procedural workflow enablement. Companies compete on breadth of solutions spanning first-line repair to advanced restoration, supported by instrumentation compatibility and strong distribution/service networks. Specialist-center concentration increases the value of clinical support programs that improve execution consistency and outcomes. Product positioning also emphasizes predictable handling, reliable defect fill, and pathway alignment with rehabilitation expectations.
Smith+Nephew maintains a strong position in sports medicine ecosystems where arthroscopy penetration is high and standardized workflows influence procedural choice. Smith+Nephew’s portfolio approach aligns implants, instrumentation, and surgeon training initiatives with joint preservation and biological healing pathways, supporting utilization in specialized orthopedic settings. The company’s broad relationships with arthroscopy-heavy centers can strengthen adoption of step-up restorative options where indicated. Commercial emphasis on workflow enablement helps reduce variability and supports repeat use in high-throughput environments.
The industry research and growth report includes detailed analyses of the competitive landscape of the market and information about key companies, including:
- Smith+Nephew
- DePuy Synthes
- Zimmer Biomet
- Stryker Corporation
- Vericel Corporation
- Anika Therapeutics
- Arthrex, Inc.
- B. Braun Melsungen AG
- Medipost Co., Ltd.
- CONMED Corporation
- Geistlich Pharma AG
- Orthocell Ltd.
- AlloSource
Qualitative and quantitative analysis of companies has been conducted to help clients understand the wider business environment as well as the strengths and weaknesses of key industry players. Data is qualitatively analyzed to categorize companies as pure play, category-focused, industry-focused, and diversified; it is quantitatively analyzed to categorize companies as dominant, leading, strong, tentative, and weak.
Recent Developments
- In January 2026, Vericel Corporation received FDA approval for its new state-of-the-art advanced manufacturing facility in Burlington, Massachusetts, enabling commercial production of MACI (Matrix-Associated Autologous Chondrocyte Implantation) to begin in Q2 2026. This approval increases manufacturing capacity to support long-term growth and enables potential ex-U.S. MACI commercialization, marking a significant expansion of the company's flagship cartilage repair franchise.
- In December 2025, Cipla Ltd. launched Ciplostem, a cell therapy for Grade II and III knee osteoarthritis in India, in partnership with Stempeutics Research. This single-dose intra-articular injection contains 25 million ex vivo expanded, pooled, cultured adult human bone marrow-derived mesenchymal stem cells co-administered with hyaluronic acid, designed to work at the cellular level to support inflammation reduction, pain reduction, enhanced joint function, and cartilage quality preservation.
- In January 2024, Smith+Nephew plc completed its acquisition of CartiHeal Ltd. for $180 million (with up to $150 million in contingent payments) to gain access to Agili-C, a novel sports medicine technology for cartilage regeneration in the knee. This acquisition strengthened Smith+Nephew's regenerative therapy portfolio and positioned the company to transform cartilage repair outcomes with Agili-C's proven superiority to current standard of care.
- In April 2024, Zimmer Biomet Holdings, Inc. announced a partnership with Arthrogenics to develop next-generation cartilage repair solutions using biologic medicines. This collaboration leverages Zimmer Biomet's orthopedic device expertise with Arthrogenics' biologic medicine capabilities to advance cartilage regeneration therapies.
Report Scope
| Report Attribute | Details |
| Market size value in 2025 | USD 6,251 million |
| Revenue forecast in 2032 | USD 8,737 million |
| Growth rate (CAGR) | 4.9% (2025–2032) |
| Base year | 2025 |
| Forecast period | 2026–2032 |
| Quantitative units | USD million |
| Segments covered | By Cartilage Type; By Treatment Modality; By Treatment Type; By Application Site; By Surgical Procedure |
| Regional scope | North America; Europe; Asia Pacific; Latin America; Middle East & Africa |
| Key companies profiled | Smith+Nephew; DePuy Synthes; Zimmer Biomet; Stryker Corporation; Vericel Corporation; Anika Therapeutics; Arthrex, Inc.; B. Braun Melsungen AG; Medipost Co., Ltd.; CONMED Corporation; Geistlich Pharma AG; Orthocell Ltd.; AlloSource |
| No.of Pages | 338 |
By Segmentation
By Cartilage Type
- Fibrocartilage
- Hyaline Cartilage
- Elastic Cartilage
- Others
By Treatment Modality
- Cell-Based
- Non-Cell-Based
By Treatment Type
- Palliative
- Intrinsic Repair Stimulus
By Application Site
- Knee
- Spine
- Ankle
- Hip
- Others
By Surgical Procedure
- Chondroplasty and Microfracture
- Autologous Chondrocyte Implantation
- Osteochondral Autograft Transplantation
- Osteochondral Allograft Transplantation
- Juvenile Allograft Fragments
- Others
By Region
- North America
- U.S.
- Canada
- Mexico
- Europe
- Germany
- France
- U.K.
- Italy
- Spain
- Rest of Europe
- Asia Pacific
- China
- Japan
- India
- South Korea
- South-east Asia
- Rest of Asia Pacific
- Latin America
- Brazil
- Argentina
- Rest of Latin America
- Middle East & Africa
- GCC Countries
- South Africa
- Rest of the Middle East and Africa
Request a Free Sample
Fill in your details and we'll send you a free sample report.
- Sample data tables & charts
- Research methodology
Need a Custom Version of This Report?
Tailor the scope, geography, or segments to your exact requirements.
- Custom geography or segment scope
- Direct access to our analyst team
Frequently Asked Questions
What is the market size of the Cartilage Repair regeneration Market in 2025 and the forecast for 2032?
What is the expected CAGR for the Cartilage Repair regeneration Market during 2025–2032?
Which segment is the largest in 2025?
What factors are driving growth in the Cartilage Repair regeneration Market?
Who are the leading companies in the Cartilage Repair regeneration Market?
Which region leads the Cartilage Repair regeneration Market in 2025?
Table of Content
Chapter 1. Report Introduction
- 1.1 Report Description & Purpose
- 1.1.1 Report Title & Market Definition
- 1.1.2 Unique Selling Propositions (USP) & Key Differentiators
- 1.1.3 Value Proposition for Stakeholders
- 1.2 Research Objectives
- 1.2.1 Market Sizing Objectives (Volume & Revenue) (Volume Where Applicable)
- 1.2.2 Segmentation Objectives
- 1.2.3 Competitive Intelligence Objectives
- 1.2.4 Forecast & Scenario Objectives
- 1.3 Report Scope
- 1.3.1 Cartilage Repair Regeneration Scope – Segments & Subsegments Covered
- 1.3.2 Geographic Scope – Regions & Countries Covered
- 1.3.3 Historical Period, Base Year & Forecast Period (2025; forecast to 2032)
- 1.3.4 Inclusions & Exclusions
- 1.4 Industry Classification & Applicable Codes
- 1.5 Currency, Measurement Units & Valuation Basis
- 1.6 Target Stakeholders
- 1.7 Limitations & Assumptions
Chapter 2. Executive Summary
- 2.1 Global Cartilage Repair Regeneration Market Snapshot
- 2.1.1 Market Size – Historical (2025) & Forecast (2025-2032) (2025: USD 6,251 million → 2032: USD 8,737 million)
- 2.1.2 Volume & Revenue – Global Totals (Volume Where Applicable)
- 2.1.3 Key Market Highlights – Top Five Facts
- 2.2 Cartilage Repair Regeneration Market Segmentation Snapshot
- 2.2.1 Market Split by Region – 2025 vs. 2032
- 2.3 Competitive Snapshot
- 2.3.1 Top 10 Players by Revenue Share – 2025
- 2.3.2 Top 10 Players by Volume Share – 2025 (Volume Where Applicable)
- 2.3.3 Recent Strategic Developments (18-Month Summary)
- 2.4 Key Investment Highlights & Strategic Conclusions
Chapter 3. Cartilage Repair Regeneration Market Dynamics & Industry Analysis
- 3.1 Market Overview & Context
- 3.1.1 Cartilage Repair Regeneration Market Position in the Broader Industry Value Chain
- 3.1.2 Demand Structure & Purchasing Dynamics
- 3.1.3 Market Maturity & Development Stage by Region
- 3.2 Cartilage Repair Regeneration Market Drivers
- 3.3 Cartilage Repair Regeneration Market Restraints & Challenges
- 3.4 Cartilage Repair Regeneration Market Opportunities
- 3.5 Porter's Five Forces Analysis
- 3.5.1 Threat of New Entrants
- 3.5.2 Bargaining Power of Suppliers
- 3.5.3 Bargaining Power of Buyers
- 3.5.4 Threat of Substitutes
- 3.5.5 Competitive Rivalry – Intensity Assessment
- 3.6 Cartilage Repair Regeneration Value Chain Analysis
- 3.6.1 Upstream – Key Inputs, Resources & Suppliers
- 3.6.1.1 Key Input/Resource 1
- 3.6.1.2 Key Input/Resource 2
- 3.6.1.3 Key Input/Resource 3
- 3.6.2 Midstream – Core Operations & Value Creation
- 3.6.2.1 Operating Model & Process Overview
- 3.6.2.2 Key Operating Locations & Capabilities by Company
- 3.6.3 Downstream – Market Channels & End Users
- 3.6.3.1 Direct Sales & Customer Engagement Channels
- 3.6.3.2 Indirect Sales, Intermediaries & Partner Channels
- 3.6.4 Value Chain Profitability Analysis
- 3.6.1 Upstream – Key Inputs, Resources & Suppliers
- 3.7 PESTEL Analysis
- 3.7.1 Political Factors
- 3.7.2 Economic Factors
- 3.7.3 Social Factors
- 3.7.4 Technological Factors
- 3.7.5 Environmental Factors
- 3.7.6 Legal Factors
- 3.8 Cartilage Repair Regeneration Supply Chain Analysis
- 3.8.1 Critical Input & Resource Availability Risk Assessment
- 3.8.2 Supplier & Operational Concentration Risk (Geographic Exposure)
- 3.8.3 Supply & Service Disruption Impact Analysis
- 3.9 Regulatory & Policy Landscape
Note: The regulatory and policy landscape section covers regulations based on their applicability to the market, Cartilage Repair Regeneration category, geography, and scope of the study. Only regulatory frameworks with a material impact on operations, compliance, trade, sustainability, or market access are analyzed in detail.
Chapter 4. Key Investment Pockets & Opportunity Analysis
- 4.1 Cartilage Repair Regeneration Market Attractiveness Analysis
- 4.1.1 By Region – Investment Attractiveness Matrix (Market Size × CAGR)
- 4.2 Absolute Revenue Growth Opportunity
- 4.2.1 By Region – Absolute Revenue Growth Through 2032
- 4.3 Incremental Demand Opportunity
- 4.3.1 By Region – Incremental Demand Through 2032
- 4.3.2 Segment – Incremental Demand
- 4.4 Emerging Submarket Opportunity Deep Dive (Subject to Applicability)
- 4.5 Priority Market Opportunity Scorecards
- 4.5.1 United States
- 4.5.2 Europe
- 4.5.3 Asia
- 4.5.4 Middle East & Africa
Note: Priority market opportunity scorecards reflect the geographic scope and strategic relevance of the study. Listed markets are indicative and may be adapted to the industry.
Chapter 5. Cartilage Repair Regeneration Cross-Border Trade & Market Access Analysis
- 5.1 International Trade & Cross-Border Activity Overview
- 5.1.1 Global Export Value by Country (2025)
- 5.1.2 Global Export Volume by Country (2025) (Volume Where Applicable)
- 5.1.3 Global Import Value by Country (2025)
- 5.1.4 Global Import Volume by Country (2025) (Volume Where Applicable)
- 5.1.5 Net Trade Balance by Country (2025)
- 5.2 Export Analysis – Segment
- 5.2.1 Category 1 (Applicable Classification Code)
- 5.2.2 Category 2 (Applicable Classification Code)
- 5.2.3 Category 3 (Applicable Classification Code)
- 5.2.4 Category 4 (Applicable Classification Code)
- 5.2.5 Category 5 (Applicable Classification Code)
- 5.3 Import Analysis – Segment
- 5.3.1 Category 1 (Applicable Classification Code)
- 5.3.2 Category 2 (Applicable Classification Code)
- 5.3.3 Category 3 (Applicable Classification Code)
- 5.3.4 Category 4 (Applicable Classification Code)
- 5.3.5 Category 5 (Applicable Classification Code)
- 5.4 Cross-Border Pricing & Transaction Benchmarks
- 5.4.1 Export Pricing – Segment & Country
- 5.4.2 Import Pricing – Segment & Source Country
- 5.4.3 Price Trends (2025)
- 5.5 Key Cross-Border Trade & Delivery Routes
- 5.5.1 Cross-Border Trade/Delivery Route 1
- 5.5.2 Cross-Border Trade/Delivery Route 2
- 5.5.3 Cross-Border Trade/Delivery Route 3
- 5.5.4 Cross-Border Trade/Delivery Route 4
- 5.5.5 Cross-Border Trade/Delivery Route 5
- 5.6 Trade Policy & Market Access Impact Assessment
- 5.6.1 Tariff & Non-Tariff Barriers
- 5.6.2 Regional Trade & Economic Integration Frameworks
- 5.6.3 Bilateral & Multilateral Trade Agreements
- 5.6.4 Cross-Border Operating, Licensing & Localization Requirements
Note: This chapter applies where cross-border trade or delivery is relevant to Cartilage Repair Regeneration. Goods, services, and digital offerings are assessed using applicable classifications and transaction measures. Import-export volumes, trade balances, and route analyses are included only where meaningful to the market.
Chapter 6. Competitive Landscape & Company Benchmarking
- 6.1 Cartilage Repair Regeneration Market Concentration & Structure
- 6.1.1 Herfindahl-Hirschman Index (HHI) – vs. 2025
- 6.1.2 Leading, Mid-Sized & Emerging Player Structure
- 6.1.3 Global, Regional & Local Player Dynamics
- 6.2 Cartilage Repair Regeneration Market Share Analysis – 2025
- 6.2.1 Global Revenue Share by Company
- 6.2.2 Global Volume Share by Company (Volume Where Applicable)
- 6.2.3 Regional Revenue Share
- 6.2.4 Market Share Evolution ( vs. 2025)
- 6.2.5 Company Market Share by Key Segment
- 6.2.6 Company Market Share by Customer Group
- 6.3 Operating Scale, Capacity & Infrastructure Analysis
- 6.3.1 Global Operating Scale & Supply Capacity
- 6.3.2 Resource Utilization & Operating Efficiency
- 6.3.3 Output, Service Delivery & Activity Metrics
- 6.3.4 Operating Footprint & Infrastructure Map
- 6.3.5 Planned Operational & Capacity Expansion
- 6.4 Cartilage Repair Regeneration Competitive Benchmarking Matrix
- 6.4.1 Revenue, Growth, Profitability & Operating Metric Comparison
- 6.4.2 Channel Revenue Mix
- 6.4.3 Geographic Revenue Exposure
- 6.4.4 R&D Intensity
- 6.4.5 Sustainability Maturity
- 6.5 Strategic Developments in Cartilage Repair Regeneration (Last 24 Months)
- 6.5.1 Mergers, Acquisitions & Divestments
- 6.5.2 New Products, Services & Solutions in Cartilage Repair Regeneration
- 6.5.3 Operational & Infrastructure Expansions
- 6.5.4 Strategic Alliances, Joint Ventures & Partnerships
- 6.5.5 Distribution Expansion & Market Entry
- 6.5.6 Sustainability & ESG Initiatives
- 6.6 Competitive Strategy Mapping
- 6.6.1 Leader, Challenger, Follower & Niche Classification
- 6.6.2 Pricing Strategy Comparison
- 6.6.3 Channel Strategy Matrix
Note: Strategic developments are included based on their materiality and the availability of reliable information.
Chapter 7. Global Cartilage Repair Regeneration Market – By Sales & Delivery Channel
- 7.1 Segment Overview
- 7.1.1 Volume & Revenue Split by Channel (2025 & 2032) (Volume Where Applicable)
- 7.1.2 Channel Mix Evolution (2025-2032)
Chapter 8. Regional Market Analysis – Global Overview
- 8.1 Global Regional Overview
- 8.1.1 Regional Volume Share (Volume Where Applicable)
- 8.1.2 Regional Revenue Share
- 8.1.3 Regional Volume by Region (Volume Where Applicable)
- 8.1.4 Regional Revenue by Region
- 8.1.5 Regional Forecast Through 2032
- 8.2 Cross-Regional Segment Analysis
- 8.2.1 By Sales & Delivery Channel
- 8.2.2 By Competitive Positioning & Price Tier
Chapter 9. North America Cartilage Repair Regeneration Market
- 9.1 United States
- 9.2 Canada
- 9.3 Mexico
Chapter 10. Europe Cartilage Repair Regeneration Market
- 10.1 Germany
- 10.2 France
- 10.3 Italy
- 10.4 United Kingdom
- 10.5 Spain
- 10.6 Poland
- 10.7 Russia
- 10.8 Netherlands
- 10.9 Belgium
- 10.10 Sweden
- 10.11 Denmark
- 10.12 Norway
- 10.13 Rest of Europe
Chapter 11. Asia Pacific Cartilage Repair Regeneration Market
- 11.1 China
- 11.2 India
- 11.3 Japan
- 11.4 South Korea
- 11.5 Thailand
- 11.6 Indonesia
- 11.7 Vietnam
- 11.8 Malaysia
- 11.9 Australia
- 11.10 Rest of Asia Pacific
Chapter 12. Latin America Cartilage Repair Regeneration Market
- 12.1 Brazil
- 12.2 Argentina
- 12.3 Colombia
- 12.4 Chile
- 12.5 Rest of Latin America
Chapter 13. Middle East Cartilage Repair Regeneration Market
- 13.1 Saudi Arabia
- 13.2 United Arab Emirates
- 13.3 Turkey
- 13.4 Israel
- 13.5 Iran
- 13.6 Rest of the Middle East
Chapter 14. Africa Cartilage Repair Regeneration Market
- 14.1 South Africa
- 14.2 Egypt
- 14.3 Nigeria
- 14.4 Morocco
- 14.5 Rest of Africa
Chapter 15. Cartilage Repair Regeneration Company Profiles
- 15.1 [Company 01]
- 15.1.1 Company Overview
- 15.1.2 Key Management Personnel
- 15.1.3 Products & Services Portfolio
- 15.1.4 Financial Performance
- 15.1.5 Key Market Focus & Geographic Presence
- 15.1.6 Recent Developments & Strategic Initiatives
Note: The company profile list is preliminary and may change based on research findings, market developments, data availability, and client requirements.
Chapter 16. Appendices
- Appendix A – List of Abbreviations & Acronyms
- Appendix B – Industry Classification Code Reference – Full Series
- Appendix C – Supply, Output & Operating Capacity Data Tables
- Appendix D – End-Use & Demand Base Tables
- Appendix E – Demand, Adoption & Usage Assumptions
- Appendix F – Pricing & Revenue Metric Reference Tables
- Appendix G – Company Operations & Infrastructure Database
- Appendix H – Cross-Border Trade & Activity Data Tables (Where Applicable)
- Appendix I – Regulatory Summary Tables
- Appendix J – Primary Research Participant List (Anonymized)
- Appendix K – Primary Research Questionnaire Framework
- Appendix L – Data Sources & Bibliography
- Appendix M – Market Size Divergence & Source Comparison
Chapter 17. Research Methodology
- 17.1 Research Framework & Philosophy
- 17.2 Secondary Research – Sources, Hierarchy & Data Extraction
- 17.3 Data Modeling – Bottom-Up & Top-Down Market Sizing
- 17.4 Primary Research – Stakeholder Framework, LOI & Sample Sizes
- 17.5 Forecast Methodology – Regression, Scenario & Sensitivity Analysis
- 17.6 Quality Control – Four-Layer Validation Framework
- 17.7 Limitations & Standard Assumptions
- 17.8 Disclaimer
