
Market Overview
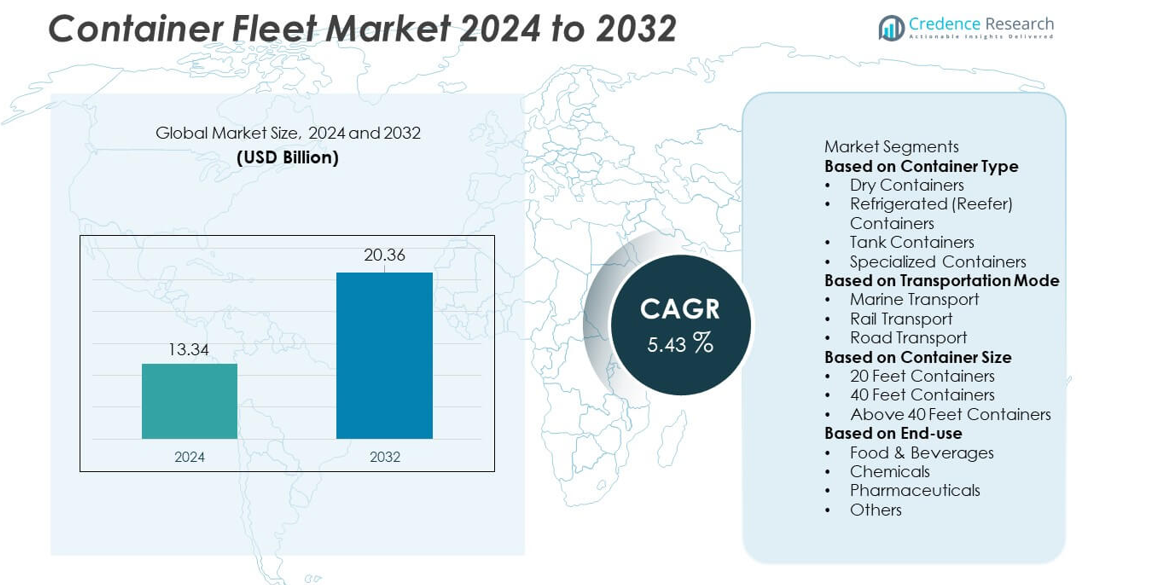
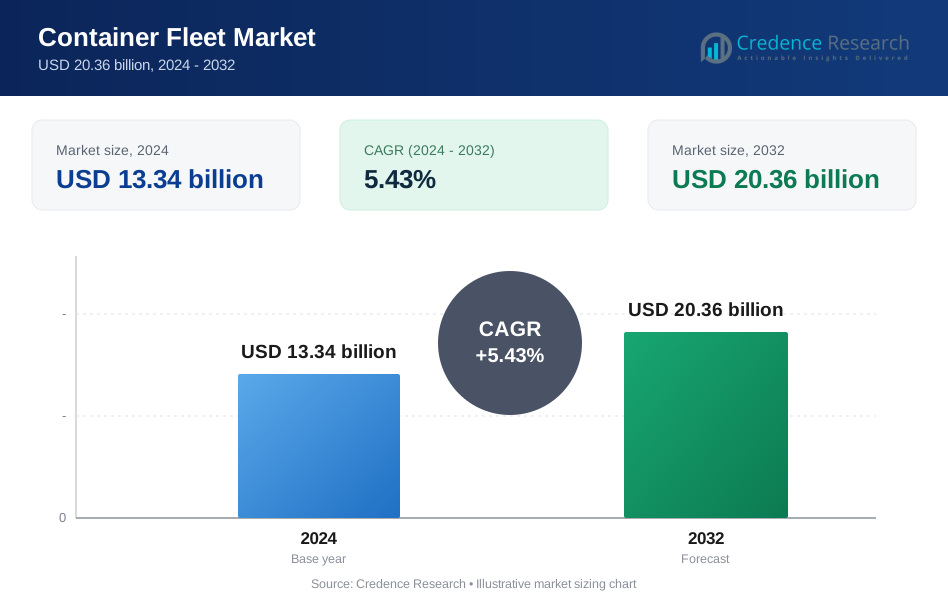
The Container Fleet market was valued at USD 13.34 billion in 2024 and is projected to reach USD 20.36 billion by 2032, expanding at a CAGR of 5.43 % during the forecast period.
| REPORT ATTRIBUTE | DETAILS |
|---|---|
| Historical Period | 2020-2023 |
| Base Year | 2024 |
| Forecast Period | 2025-2032 |
| Container Fleet Market Size 2024 | USD 13.34 billion |
| Container Fleet Market, CAGR | 5.43% |
| Container Fleet Market Size 2032 | USD 20.36 billion |
The Container Fleet market is shaped by leading players such as Maersk Container Industry, Triton International, Textainer Group Holdings, CIMC, Florens, CAI International, Seaco Global, Singamas, Evergreen Marine, and Ocean Network Express. These companies strengthen their position through large-scale fleet expansions, long-term leasing strategies, and adoption of smart container technologies that enhance tracking, maintenance, and cargo safety. Asia Pacific leads the market with a 34% share due to strong export-driven manufacturing and high port throughput. Europe follows with a 28% share supported by advanced intermodal networks, while North America holds a 32% share driven by strong import volumes and established logistics infrastructure.
Market Insights
- The Container Fleet market reached USD 13.34 billion in 2024 and will grow at a CAGR of 5.43 percent through 2032.
- Strong global trade flows drive demand for dry containers, which lead the market with a 62 percent share supported by high utilization across marine, rail, and road transport.
- Digital tracking systems, smart container monitoring, and rising cold-chain requirements shape key trends, boosting adoption of reefer and tank containers across major trade routes.
- Competition among Maersk, Triton, Textainer, CIMC, Florens, CAI, Seaco, Singamas, Evergreen, and ONE accelerates fleet modernization, while high repositioning costs and steel price volatility act as key restraints.
- Asia Pacific leads regional demand with a 34 percent share, followed by North America at 32 percent and Europe at 28 percent, while 40-foot containers dominate size preference with a 54 percent market share.
Market Segmentation Analysis:
By Container Type
Dry containers lead the market with a 62% share, supported by strong demand from consumer goods, electronics, textiles, and industrial product shipments. Their versatility, lower handling cost, and suitability for global logistics networks strengthen widespread adoption across marine, rail, and road transportation. Refrigerated containers continue to grow as cold-chain requirements rise in food, pharmaceutical, and perishable goods transport. Tank containers gain traction due to increasing chemical and liquid cargo movement, while specialized containers serve niche sectors such as heavy machinery and hazardous materials. The shift toward standardized fleet operations further boosts demand for dry containers across major trade routes.
- For instance, Maersk Container Industry is a known manufacturer of reefer units and CIMC (China International Marine Containers) is a prominent manufacturer of dry containers, the largest in the world. Standard container floors are designed to carry a forklift truck with a maximum axle load of 5,460 kg.
By Transportation Mode
Marine transport dominates the market with a 71% share, driven by extensive use of container ships for long-distance and bulk cargo movement. Global trade expansion, port infrastructure development, and rising intercontinental shipments strongly support this segment. Rail transport grows as intermodal logistics improve and countries invest in cross-border freight corridors. Road transport remains essential for last-mile and short-haul movement, supporting container repositioning between ports, warehouses, and industrial hubs. Rising trade volumes and integrated logistics networks ensure that marine transport continues to lead, while rail and road modes expand through multimodal connectivity initiatives.
- For instance, Ocean Network Express deployed its AI-enabled stowage planning system that optimizes loading for vessels carrying up to 24,000 TEU, while Union Pacific added 1,200 double-stack railcars with a 32.5-ton axle load rating to support inland container movement.
By Container Size
40-foot containers hold the largest market share at 54%, driven by higher loading capacity, better cost efficiency per unit, and widespread adoption in international marine transport. Their suitability for bulk commodities, retail goods, and large-volume shipments makes them the preferred choice for shipping lines and logistics companies. The 20-foot segment remains significant in heavy cargo transport, especially metals, machinery, and industrial materials requiring weight-focused loads. Containers above 40 feet grow steadily due to rising demand for high-cube units in e-commerce and lightweight consumer products. Fleet optimization strategies continue to boost demand for 40-foot containers across global shipping networks.
Key Growth Drivers
Rising Global Trade and Expanding Intermodal Logistics
Growing international trade volumes strengthen demand for container fleets as manufacturers, retailers, and exporters rely on standardized containerized transport for efficient global distribution. Expanding intermodal logistics networks enable smooth cargo movement across marine, rail, and road systems, increasing container utilization rates. E-commerce growth and rising cross-border shipments further boost fleet expansion. Ports and logistics hubs invest in advanced handling systems that support faster container turnaround, encouraging operators to expand fleets. These developments collectively drive sustained demand for container assets across major trade corridors.
- For instance, DP World installed 35 automated stacking cranes (ASCs) at its Jebel Ali Terminal 4 project, which can handle twin-lift containers to a combined weight of 70 tonnes.
Increasing Demand for Cold-Chain and Hazardous Goods Transport
Refrigerated and tank container demand grows as food, pharmaceutical, and chemical industries expand global distribution operations. Rising consumption of temperature-sensitive products and stricter regulatory compliance for hazardous goods strengthen adoption of specialized container types. Cold-chain logistics expansion in Asia Pacific, Europe, and North America boosts reefer container deployment. Tank containers gain traction as shippers shift from drums and bulk carriers to safer and more efficient transport units. This increase in specialized cargo handling contributes significantly to overall fleet growth.
- For instance, Maersk Container Industry upgraded its Star Cool refrigeration system with a variable-speed drive unit reducing power consumption by 30% and supporting temperature control down to –40°C, while CIMC produced more than 200,000 tank containers equipped with 4-bar test pressure shells and 6-mm stainless steel walls to meet global chemical safety regulations.
Fleet Modernization and Rising Focus on Operational Efficiency
Shipping lines and leasing companies modernize container fleets to improve durability, reduce maintenance costs, and enhance cargo safety. Newer containers with lightweight materials, corrosion resistance, and smart-tracking systems support more efficient asset management. Operators adopt digital monitoring technologies that track container location, condition, and utilization, improving fleet rotation efficiency. Growing emphasis on sustainability encourages adoption of eco-friendly materials and energy-efficient refrigerated units. These modernization efforts help reduce operational costs and improve container lifecycle performance, driving market expansion.
Key Trends & Opportunities
Digitalization and Smart Container Adoption
Smart container technologies gain momentum as operators deploy IoT sensors, GPS tracking, and real-time monitoring tools to improve visibility across the supply chain. Digital platforms enable predictive maintenance, enhanced security, and automated documentation, reducing operational delays. Smart reefers provide temperature and humidity monitoring for sensitive cargo, expanding opportunities in food and pharmaceutical transport. Integration of AI and analytics supports optimized fleet planning and container repositioning. This digital shift creates strong opportunities for service providers offering connected and data-driven logistics solutions.
- For instance, Hapag-Lloyd has equipped over 1.5 million containers with its Hapag-Lloyd LIVE technology, which utilizes devices from partners like ORBCOMM and Nexxiot featuring internal temperature probes, GPS units, and shock sensors capable of transmitting data frequently.
Growth of Sustainable and Eco-Friendly Container Solutions
Environmental regulations and corporate sustainability targets drive investment in eco-friendly container materials and energy-efficient designs. Adoption of lightweight steel, aluminum, and composite containers reduces emissions and improves fuel efficiency across transportation modes. Solar-powered reefers and low-emission refrigerants gain traction as operators focus on greener cold-chain logistics. Circular-economy initiatives promote refurbishment and recycling of aging containers, creating opportunities in aftermarket services. These sustainability trends support long-term fleet modernization and enable operators to meet global environmental compliance standards.
- For instance, the use of solar power in refrigerated containers is a known approach to boost energy efficiency and minimize the use of diesel or grid electricity, which helps reduce operating costs.
Key Challenges
Container Imbalance and Rising Repositioning Costs
Frequent trade imbalances between import-heavy and export-heavy regions create container shortages in some markets and surpluses in others. This imbalance increases the need for costly container repositioning, especially across long-distance routes. Operators face higher empty-move expenses, delayed returns, and inefficient fleet utilization. Limited digital integration across ports and shipping networks further complicates asset tracking. Addressing these challenges requires advanced forecasting tools, better intermodal coordination, and expanded regional depots to reduce repositioning costs.
Fluctuating Raw Material Prices and High Maintenance Costs
Steel price volatility and increased production costs affect the manufacturing and leasing of new containers. Maintenance expenses rise as older containers require frequent repairs, inspections, and regulatory compliance checks. Harsh weather conditions, corrosion, and heavy-use cycles shorten container lifespan, increasing operational burdens. Specialized containers, such as reefers and tank units, add higher energy and servicing costs. These financial pressures slow fleet expansion for smaller operators and increase dependency on leasing models across the industry.
Regional Analysis
North America
North America holds a 32% market share, driven by high containerized trade volumes, strong intermodal networks, and widespread adoption of advanced fleet management technologies. The region benefits from well-developed port infrastructure, efficient rail connectivity, and strong demand across consumer goods, automotive, and pharmaceutical sectors. Leasing companies expand fleets to support rising imports from Asia and growing e-commerce-driven freight movement. Investments in digital tracking, cold-chain expansion, and inland logistics hubs further strengthen container utilization rates. Continuous modernization of transport corridors positions North America as a key contributor to global fleet growth.
Europe
Europe accounts for a 28% market share, supported by extensive maritime trade, strong exports, and advanced logistics capabilities across major economies. Ports in Germany, the Netherlands, Belgium, and the U.K. function as major gateways connecting global and intra-regional trade routes. Demand for reefer and tank containers remains high due to strong chemical, food, and pharmaceutical industries. The region prioritizes sustainable transport systems, promoting fleet upgrades and energy-efficient reefer units. Intermodal freight corridors linking rail, road, and inland waterways strengthen fleet deployment and support stable growth across European supply chains.
Asia Pacific
Asia Pacific leads container movement with a 34% market share, driven by export-oriented manufacturing hubs in China, India, South Korea, Japan, and Southeast Asia. Large-scale production of electronics, automotive components, consumer goods, and chemicals fuels strong demand for dry, reefer, and tank containers. Expanding port capacity, rising trade agreements, and rapid e-commerce growth strengthen fleet requirements across regional and international routes. The region also witnesses increased adoption of smart container tracking and cold-chain expansion. Strong industrial growth and rising maritime freight volumes reinforce Asia Pacific’s dominant role in global container fleet expansion.
Latin America
Latin America holds a 4% market share, supported by increasing trade activity in agricultural products, mining outputs, food exports, and manufactured goods. Brazil, Mexico, Chile, and Argentina lead container demand as infrastructure improvements enhance port capacity and intermodal connectivity. Reefer containers gain traction due to rising exports of fruits, meat, and seafood. Regional logistics companies invest in fleet leasing to support international shipments and growing retail imports. Although economic instability remains a challenge, ongoing modernization efforts strengthen demand for efficient container transport across key trade corridors.
Middle East & Africa
The Middle East & Africa region represents a 2% market share, driven by expanding trade volumes, growing industrial output, and rising container usage in ports across the UAE, Saudi Arabia, South Africa, and Morocco. Major transshipment hubs such as Dubai and Jeddah support strong container throughput linked to Europe–Asia trade lanes. Demand for tank and reefer containers increases due to chemical production and food import requirements. Infrastructure development projects and free-trade zones support fleet expansion, though supply-chain gaps and limited rail connectivity slow wider adoption. Continuous investment in port upgrades supports steady market growth.
Market Segmentations:
By Container Type
- Dry Containers
- Refrigerated (Reefer) Containers
- Tank Containers
- Specialized Containers
By Transportation Mode
- Marine Transport
- Rail Transport
- Road Transport
By Container Size
- 20 Feet Containers
- 40 Feet Containers
- Above 40 Feet Containers
By End-use
- Food & Beverages
- Chemicals
- Pharmaceuticals
- Others
By Geography
- North America
- U.S.
- Canada
- Mexico
- Europe
- Germany
- France
- U.K.
- Italy
- Spain
- Rest of Europe
- Asia Pacific
- China
- Japan
- India
- South Korea
- South-east Asia
- Rest of Asia Pacific
- Latin America
- Brazil
- Argentina
- Rest of Latin America
- Middle East & Africa
- GCC Countries
- South Africa
- Rest of the Middle East and Africa
Competitive Landscape
Competitive landscape in the Container Fleet market features major players such as Maersk Container Industry, Triton International, Textainer Group Holdings, CIMC, Florens, CAI International, Seaco Global, Singamas, Evergreen Marine, and Ocean Network Express. These companies expand their market presence through large-scale fleet investments, long-term leasing contracts, and strong global distribution networks. Many operators focus on modernizing fleets with lightweight, durable materials and smart-tracking technologies to improve asset efficiency and reduce operational downtime. Leasing companies strengthen their portfolios to meet rising demand from shipping lines and logistics providers, particularly across Asia Pacific and North America. Manufacturers invest in sustainable container designs and enhanced reefer technologies to support temperature-sensitive cargo. Strategic collaborations with ports, freight forwarders, and intermodal operators further enhance container utilization. Growing emphasis on digital platforms, predictive maintenance, and fleet optimization tools intensifies competition and drives continuous innovation across the global container fleet industry.
Key Player Analysis
- Maersk Container Industry
- Triton International
- Textainer Group Holdings
- China International Marine Containers (CIMC)
- Florens Container Services
- CAI International
- Seaco Global
- Singamas Container Holdings
- Evergreen Marine Corp.
- Ocean Network Express (ONE)
Recent Developments
- In June 2025, Triton International unveiled a redesigned global corporate website to sharpen its brand identity.
- In June 2025, Triton International (Triton Container Sales division) launched a new online platform specifically for customers to browse refrigerated container inventory for sales.
Report Coverage
The research report offers an in-depth analysis based on Container Type, Transportation Mode, Container Size, End-use and Geography. It details leading market players, providing an overview of their business, product offerings, investments, revenue streams, and key applications. Additionally, the report includes insights into the competitive environment, SWOT analysis, current market trends, as well as the primary drivers and constraints. Furthermore, it discusses various factors that have driven market expansion in recent years. The report also explores market dynamics, regulatory scenarios, and technological advancements that are shaping the industry. It assesses the impact of external factors and global economic changes on market growth. Lastly, it provides strategic recommendations for new entrants and established companies to navigate the complexities of the market.
Future Outlook
- Global trade growth will continue to increase demand for larger and more efficient container fleets.
- Smart tracking technologies will gain wider adoption to improve visibility and reduce operational delays.
- Reefer container usage will rise as cold-chain logistics expand across food and pharmaceutical sectors.
- Fleet modernization will accelerate as operators shift to lightweight and eco-friendly container materials.
- Leasing models will grow as shipping lines seek flexibility and reduce capital investment burdens.
- Intermodal logistics integration will strengthen container utilization across marine, rail, and road networks.
- Demand for tank containers will increase due to expanding chemical and liquid cargo movement.
- Automation and digital platforms will enhance fleet management, forecasting, and repositioning strategies.
- Sustainability regulations will push operators to adopt low-emission reefer units and recyclable container designs.
- Asia Pacific will strengthen its leadership as manufacturing growth and port development drive higher container deployment.
Request a Free Sample
Fill in your details and we'll send you a free sample report.
- Sample data tables & charts
- Research methodology
Need a Custom Version of This Report?
Tailor the scope, geography, or segments to your exact requirements.
- Custom geography or segment scope
- Direct access to our analyst team
Frequently Asked Questions
What is the current market size for the Container Fleet market, and what is its projected size in 2032?
At what Compound Annual Growth Rate is the Container Fleet market projected to grow between 2025 and 2032?
What are the major growth drivers in the container fleet market?
What challenges does the container fleet market face?
Which region is leading in the container fleet industry?
Who are the leading companies in the Container Fleet market?
Table of Content
Chapter 1. Report Introduction
- 1.1 Report Description & Purpose
- 1.1.1 Report Title & Market Definition
- 1.1.2 Unique Selling Propositions (USP) & Key Differentiators
- 1.1.3 Value Proposition for Stakeholders
- 1.2 Research Objectives
- 1.2.1 Market Sizing Objectives (Volume & Revenue)
- 1.2.2 Segmentation Objectives
- 1.2.3 Competitive Intelligence Objectives
- 1.2.4 Forecast & Scenario Objectives
- 1.3 Report Scope
- 1.3.1 Container Fleet Scope – Types & Subtypes Covered
- 1.3.2 Geographic Scope – Regions & Countries Covered
- 1.3.3 Historical Period, Base Year & Forecast Period (2024; forecast to 2032)
- 1.3.4 Inclusions & Exclusions
- 1.4 HS Code & Classification Framework
- 1.5 Currency, Units & Pricing Basis
- 1.6 Target Stakeholders
- 1.7 Limitations & Assumptions
Chapter 2. Executive Summary
- 2.1 Global Container Fleet Market Snapshot
- 2.1.1 Market Size – Historical (2024) & Forecast (2024-2032) (2024: USD 13.34 billion → 2032: USD 20.36 billion)
- 2.1.2 Volume & Revenue – Global Totals
- 2.1.3 Key Market Highlights – Top Five Facts
- 2.2 Container Fleet Market Segmentation Snapshot
- 2.2.1 Market Split by Region – 2024 vs. 2032
- 2.3 Competitive Snapshot
- 2.3.1 Top 10 Players by Revenue Share – 2024
- 2.3.2 Top 10 Players by Volume Share – 2024
- 2.3.3 Recent Strategic Developments (18-Month Summary)
- 2.4 Key Investment Highlights & Strategic Conclusions
Chapter 3. Container Fleet Market Dynamics & Industry Analysis
- 3.1 Market Overview & Context
- 3.1.1 Container Fleet Market Position in the Broader Automotive Value Chain
- 3.1.2 OEM vs. Replacement Market Dynamics
- 3.1.3 Market Maturity & Development Stage by Region
- 3.2 Container Fleet Market Drivers
- 3.3 Container Fleet Market Restraints & Challenges
- 3.4 Container Fleet Market Opportunities
- 3.5 Porter's Five Forces Analysis
- 3.5.1 Threat of New Entrants
- 3.5.2 Bargaining Power of Suppliers
- 3.5.3 Bargaining Power of Buyers
- 3.5.4 Threat of Substitutes
- 3.5.5 Competitive Rivalry – Intensity Assessment
- 3.6 Container Fleet Value Chain Analysis
- 3.6.1 Upstream – Raw Material/Input Suppliers
- 3.6.1.1 Raw Material/Input 1
- 3.6.1.2 Raw Material/Input 2
- 3.6.1.3 Raw Material/Input 3
- 3.6.2 Midstream – Production/Manufacturing/Service Delivery
- 3.6.2.1 Production/Process Overview
- 3.6.2.2 Key Facility Locations & Capacity by Manufacturer
- 3.6.3 Downstream – Distribution & End Consumer
- 3.6.3.1 Primary Channel – B2B/OEM
- 3.6.3.2 Secondary Channels – Dealer, Retail, Online, Direct
- 3.6.4 Value Chain Profitability Analysis
- 3.6.1 Upstream – Raw Material/Input Suppliers
- 3.7 PESTEL Analysis
- 3.7.1 Political Factors
- 3.7.2 Economic Factors
- 3.7.3 Social Factors
- 3.7.4 Technological Factors
- 3.7.5 Environmental Factors
- 3.7.6 Legal Factors
- 3.8 Container Fleet Supply Chain Analysis
- 3.8.1 Raw Material/Input Supply Risk Assessment
- 3.8.2 Manufacturing Concentration Risk (Geographic Exposure)
- 3.8.3 Trade Disruption Impact Analysis
- 3.9 Regulatory & Policy Landscape
Note: The regulatory and policy landscape section covers regulations based on their applicability to the market, Container Fleet category, geography, and scope of the study. Only regulatory frameworks with a material impact on operations, compliance, trade, sustainability, or market access are analyzed in detail.
Chapter 4. Key Investment Pockets & Opportunity Analysis
- 4.1 Container Fleet Market Attractiveness Analysis
- 4.1.1 By Region – Investment Attractiveness Matrix (Volume × CAGR)
- 4.2 Absolute Revenue Growth Opportunity
- 4.2.1 By Region – Absolute USD Growth Through 2032
- 4.3 Incremental Volume Opportunity
- 4.3.1 By Region – Incremental Volume Through 2032
- 4.3.2 Segment – Incremental Volume
- 4.4 Emerging Submarket Opportunity Deep Dive (Subject to Applicability)
- 4.5 Emerging Market Opportunity Scorecards
- 4.5.1 United States
- 4.5.2 Europe
- 4.5.3 Asia
- 4.5.4 Middle East & Africa
Note: Emerging Market Opportunity Scorecards will be included based on relevance and strategic importance. Regions listed are indicative and may vary depending on data availability and market dynamics.
Chapter 5. Container Fleet Import-Export Analysis & Trade Flows
- 5.1 Global Trade Overview
- 5.1.1 Global Export Value by Country (2024)
- 5.1.2 Global Export Volume by Country (2024)
- 5.1.3 Global Import Value by Country (2024)
- 5.1.4 Global Import Volume by Country (2024)
- 5.1.5 Net Trade Balance by Country (2024)
- 5.2 Export Analysis – Segment
- 5.2.1 Type 1 (HS Code)
- 5.2.2 Type 2 (HS Code)
- 5.2.3 Type 3 (HS Code)
- 5.2.4 Type 4 (HS Code)
- 5.2.5 Type 5 (HS Code)
- 5.3 Import Analysis – Segment
- 5.3.1 Type 1 (HS Code)
- 5.3.2 Type 2 (HS Code)
- 5.3.3 Type 3 (HS Code)
- 5.3.4 Type 4 (HS Code)
- 5.3.5 Type 5 (HS Code)
- 5.4 Average Unit Trade Prices
- 5.4.1 Average Export Price – Segment & Country
- 5.4.2 Average Import Price – Segment & Source Country
- 5.4.3 Price Trends (2024)
- 5.5 Key Trade Route Analysis
- 5.5.1 Trade Route 1
- 5.5.2 Trade Route 2
- 5.5.3 Trade Route 3
- 5.5.4 Trade Route 4
- 5.5.5 Trade Route 5
- 5.6 Trade Policy Impact Assessment
- 5.6.1 US Anti-Dumping & Section 301 Tariffs
- 5.6.2 EU Customs Union Impact
- 5.6.3 Major Free Trade Agreements
- 5.6.4 USMCA Rules of Origin
Note: Trade policy analysis will be included only where relevant to the Container Fleet market.
Chapter 6. Competitive Landscape & Company Benchmarking
- 6.1 Container Fleet Market Concentration & Structure
- 6.1.1 Herfindahl-Hirschman Index (HHI) – vs. 2024
- 6.1.2 Tier 1, Tier 2 & Tier 3 Market Structure
- 6.1.3 Global, Regional & Local Player Dynamics
- 6.2 Container Fleet Market Share Analysis – 2024
- 6.2.1 Global Revenue Share by Company
- 6.2.2 Global Volume Share by Company
- 6.2.3 Regional Revenue Share
- 6.2.4 Market Share Evolution ( vs. 2024)
- 6.2.5 OEM Segment Share by Company
- 6.2.6 Replacement Segment Share by Company
- 6.3 Production/Delivery Capacity & Facility Analysis
- 6.3.1 Global Installed Capacity
- 6.3.2 Capacity Utilization Rates
- 6.3.3 Production/Output Volume
- 6.3.4 Facility Locations & Capacity Map
- 6.3.5 Planned Capacity Additions
- 6.4 Container Fleet Competitive Benchmarking Matrix
- 6.4.1 Revenue, Volume, CAGR & Profitability Comparison
- 6.4.2 Channel Revenue Mix
- 6.4.3 Geographic Revenue Exposure
- 6.4.4 R&D Intensity
- 6.4.5 Sustainability Maturity
- 6.5 Strategic Developments in Container Fleet (Last 24 Months)
- 6.5.1 Mergers, Acquisitions & Divestments
- 6.5.2 New Container Fleet Launches
- 6.5.3 Facility Expansions
- 6.5.4 Strategic Alliances, Joint Ventures & Partnerships
- 6.5.5 Distribution Expansion & Market Entry
- 6.5.6 Sustainability & ESG Initiatives
- 6.6 Competitive Strategy Mapping
- 6.6.1 Leader, Challenger, Follower & Niche Classification
- 6.6.2 Pricing Strategy Comparison
- 6.6.3 Channel Strategy Matrix
Note: Strategic developments are included based on their materiality and the availability of reliable information.
Chapter 7. Global Container Fleet Market – By Distribution Channel
- 7.1 Segment Overview
- 7.1.1 Volume & Revenue Split by Channel (2024 & 2032)
- 7.1.2 Channel Mix Evolution (2024-2032)
Chapter 8. Regional Market Analysis – Global Overview
- 8.1 Global Regional Overview
- 8.1.1 Regional Volume Share
- 8.1.2 Regional Revenue Share
- 8.1.3 Regional Volume by Region
- 8.1.4 Regional Revenue by Region
- 8.1.5 Regional Forecast Through 2032
- 8.2 Cross-Regional Segment Analysis
- 8.2.1 By Distribution Channel
- 8.2.2 By Brand/Price Tier
Chapter 9. North America Container Fleet Market
- 9.1 United States
- 9.2 Canada
- 9.3 Mexico
Chapter 10. Europe Container Fleet Market
- 10.1 Germany
- 10.2 France
- 10.3 Italy
- 10.4 United Kingdom
- 10.5 Spain
- 10.6 Poland
- 10.7 Russia
- 10.8 Netherlands
- 10.9 Belgium
- 10.10 Sweden
- 10.11 Denmark
- 10.12 Norway
- 10.13 Rest of Europe
Chapter 11. Asia Pacific Container Fleet Market
- 11.1 China
- 11.2 India
- 11.3 Japan
- 11.4 South Korea
- 11.5 Thailand
- 11.6 Indonesia
- 11.7 Vietnam
- 11.8 Malaysia
- 11.9 Australia
- 11.10 Rest of Asia Pacific
Chapter 12. Latin America Container Fleet Market
- 12.1 Brazil
- 12.2 Argentina
- 12.3 Colombia
- 12.4 Chile
- 12.5 Rest of Latin America
Chapter 13. Middle East Container Fleet Market
- 13.1 Saudi Arabia
- 13.2 United Arab Emirates
- 13.3 Turkey
- 13.4 Israel
- 13.5 Iran
- 13.6 Rest of the Middle East
Chapter 14. Africa Container Fleet Market
- 14.1 South Africa
- 14.2 Egypt
- 14.3 Nigeria
- 14.4 Morocco
- 14.5 Rest of Africa
Chapter 15. Container Fleet Company Profiles
- 15.1 [Company 01]
- 15.1.1 Company Overview
- 15.1.2 Key Management Personnel
- 15.1.3 Products & Services Portfolio
- 15.1.4 Financial Performance
- 15.1.5 Key Market Focus & Geographic Presence
- 15.1.6 Recent Developments & Strategic Initiatives
Note: The company profile list is preliminary and may change based on research findings, market developments, data availability, and client requirements.
Chapter 16. Appendices
- Appendix A – List of Abbreviations & Acronyms
- Appendix B – Industry Classification Code Reference – Full Series
- Appendix C – Production & Capacity Data Tables
- Appendix D – End-Use & Demand Base Tables
- Appendix E – Consumption & Replacement Rate Assumptions
- Appendix F – ASP Reference Tables
- Appendix G – Manufacturing & Facility Database
- Appendix H – Import-Export Data Tables
- Appendix I – Regulatory Summary Tables
- Appendix J – Primary Research Participant List (Anonymized)
- Appendix K – Primary Research Questionnaire Framework
- Appendix L – Data Sources & Bibliography
- Appendix M – Market Size Divergence & Source Comparison
Chapter 17. Research Methodology
- 17.1 Research Framework & Philosophy
- 17.2 Secondary Research – Sources, Hierarchy & Data Extraction
- 17.3 Data Modeling – Bottom-Up & Top-Down Market Sizing
- 17.4 Primary Research – Stakeholder Framework, LOI & Sample Sizes
- 17.5 Forecast Methodology – Regression, Scenario & Sensitivity Analysis
- 17.6 Quality Control – Four-Layer Validation Framework
- 17.7 Limitations & Standard Assumptions
- 17.8 Disclaimer
