| REPORT ATTRIBUTE | DETAILS |
|---|---|
| Historical Period | 2020-2023 |
| Base Year | 2024 |
| Forecast Period | 2025-2032 |
| Electric Vehicle Connectors Market Size 2024 | USD 51.2 billion |
| Electric Vehicle Connectors Market, CAGR | 19.40% |
| Electric Vehicle Connectors Market Size 2032 | USD 211.5 billion |
Market Overview
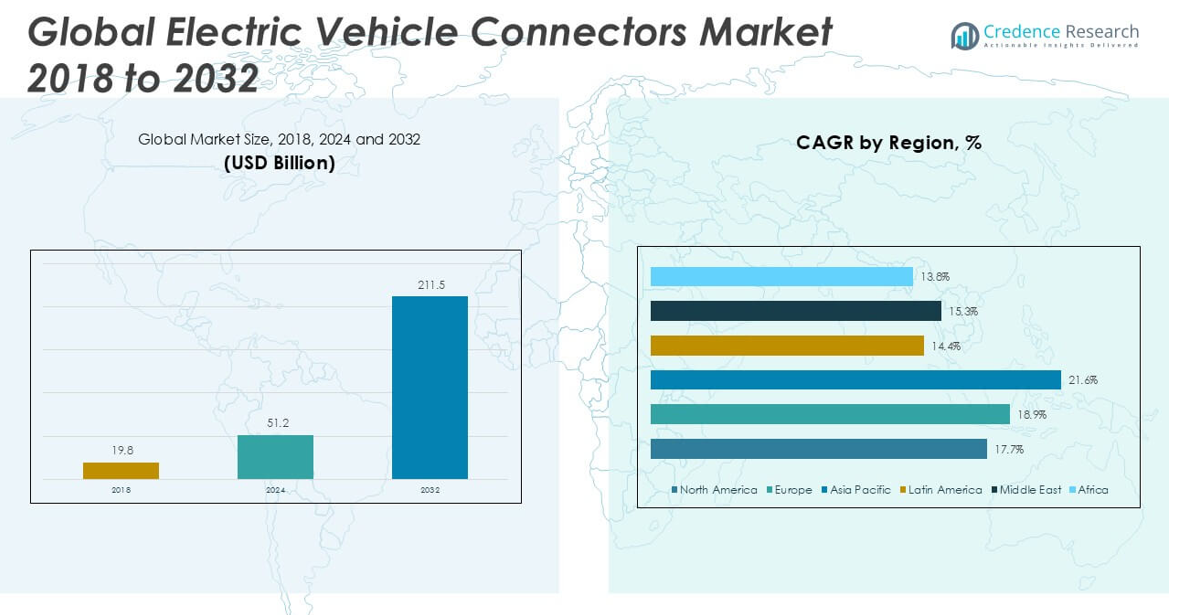
The Electric Vehicle Connectors market size was valued at USD 19.8 billion in 2018, increased to USD 51.2 billion in 2024, and is anticipated to reach USD 211.5 billion by 2032, growing at a CAGR of 19.40% during the forecast period.
The Electric Vehicle Connectors market is led by key players such as TE Connectivity, Yazaki Corporation, Sumitomo Electric Industries, Aptiv PLC, Amphenol Corporation, and ITT Inc., all of which have established strong global footprints through advanced product offerings and continuous technological innovation. These companies focus on expanding their connector portfolios to support high-speed, safe, and efficient charging solutions. Asia Pacific dominates the market, holding the largest regional share of approximately 35.6% in 2024, driven by the rapid adoption of electric vehicles in China, Japan, and South Korea, along with extensive investments in charging infrastructure. Europe and North America follow, supported by favorable policies and growing EV fleets.
Market Insights
- The Electric Vehicle Connectors market is projected to grow from USD 51.2 billion in 2024 to USD 211.5 billion by 2032, registering a CAGR of 19.4% during the forecast period.
- The market is driven by the rising global adoption of electric vehicles, supported by government incentives, emission regulations, and the growing demand for efficient, high-speed charging solutions.
- Key trends include increasing investments in fast and ultra-fast charging infrastructure, the development of smart and wireless charging connectors, and rising public-private collaborations to standardize charging networks.
- The market is highly competitive, with major players such as TE Connectivity, Yazaki Corporation, Sumitomo Electric Industries, and Aptiv PLC focusing on product innovation and global expansion; however, challenges include high installation costs and lack of universal connector standards.
- Asia Pacific leads the market with a 35.6% share in 2024, followed by Europe at 21.4% and North America at 17.8%; Level 2 connectors dominate the segment due to their widespread application.
Market Segmentation Analysis:
By Level Type:
In the Electric Vehicle Connectors market by Level Type, Level 2 connectors dominate the segment with the largest market share, primarily due to their efficient balance between charging speed and installation costs. Widely used in residential, commercial, and public charging spaces, Level 2 chargers meet the daily charging needs of most electric vehicle users. Their adoption is driven by favorable government incentives, increasing home charging infrastructure, and growing consumer preference for faster charging compared to Level 1. In contrast, Level 1 connectors hold a smaller share, mainly supported by budget-conscious consumers and those with minimal daily driving needs. Level 3 connectors are gaining traction, especially in commercial fast-charging networks, as they significantly reduce charging time, meeting the demand for quick charging among fleet operators and long-distance travelers. Meanwhile, Level 4 connectors, though currently emerging, are expected to witness accelerated growth with advancements in ultra-fast charging technologies and expanding investments in heavy-duty vehicle charging infrastructure.
- For instance, Tesla’s Supercharger V3, a Level 3 charging solution, delivers up to 250 kW per vehicle, reducing charging time to about 15 minutes for 75 miles of range.
By Charging Speed Type:
The market is segmented into Slow, Fast, and Rapid charging, with Fast charging connectors leading the segment due to their wide application in public charging stations and urban commercial centers. The Fast charging segment is driven by the increasing need for quicker charging solutions and the development of fast-charging corridors along highways. Slow chargers continue to hold a considerable share, particularly in home and workplace settings where extended charging durations are acceptable. However, this segment is expected to gradually decline in preference as consumer demand shifts toward faster alternatives. The Rapid charging segment is gaining momentum, supported by growing investments in rapid charging stations that offer substantial time savings and cater to the needs of long-distance travelers and commercial electric fleets.
- For instance, ABB’s Terra HP charger supports up to 350 kW DC charging, enabling compatible vehicles to add 200 km of range in just 8 minutes.
Market Overview
Rising Adoption of Electric Vehicles (EVs)
The increasing global shift towards electric mobility is a primary growth driver for the Electric Vehicle Connectors market. Governments worldwide are promoting EV adoption through subsidies, tax incentives, and stricter emission regulations. Consumer demand for eco-friendly transportation, coupled with advancements in EV models offering extended ranges, is significantly boosting market demand. As the electric vehicle fleet expands rapidly, the need for reliable and efficient connectors is rising proportionally, supporting the steady growth of this market across both developed and emerging economies.
- For instance, in 2023, BYD sold over 3 million electric vehicles globally, directly increasing demand for compatible charging connectors in Asia and Europe.
Expansion of Charging Infrastructure
The rapid development of charging infrastructure, especially fast and ultra-fast charging stations, is accelerating the demand for electric vehicle connectors. Governments and private entities are heavily investing in building public, residential, and highway charging stations to support seamless EV adoption. The growing preference for faster charging solutions is further driving the deployment of high-capacity connectors, supporting convenience for consumers and fleet operators. This infrastructure expansion is crucial in addressing range anxiety and encouraging more consumers to transition to electric vehicles.
- For instance, as of 2023, the IONITY network, a joint venture of major automakers, has installed over 2,800 high-power charging points across Europe supporting connectors up to 350 kW.
Technological Advancements in Connector Design
Technological innovations in electric vehicle connectors, including improved durability, enhanced safety features, and compatibility with higher charging speeds, are contributing to market growth. The development of smart connectors with thermal management, automatic locking mechanisms, and universal compatibility is increasing consumer confidence and operational efficiency. These advancements are enabling connectors to support high-power applications, reducing charging times significantly. Such technological progress is crucial in supporting next-generation EVs and accelerating the shift towards fast, reliable, and user-friendly charging experiences.
Key Trends & Opportunities
Integration of Wireless Charging Technology
A notable trend in the Electric Vehicle Connectors market is the growing research and development in wireless charging systems. Wireless charging offers enhanced convenience by eliminating physical connectors, reducing wear and improving safety. This technology is expected to complement traditional connectors, particularly in urban settings and for autonomous vehicles. As pilot projects and commercial applications for wireless charging expand, it presents a significant growth opportunity for market players to diversify their offerings and capture new customer segments.
- For instance, WiTricity’s wireless charging platform has achieved 11 kW charging capability in real-world tests, providing efficiency levels comparable to plug-in systems.
Increasing Public-Private Collaborations
Strategic partnerships between governments, automakers, and charging infrastructure providers are becoming increasingly common, creating significant opportunities for market expansion. These collaborations aim to accelerate the deployment of standardized and accessible charging networks. By jointly addressing regulatory, technical, and investment challenges, public-private partnerships can fast-track large-scale infrastructure development and promote connector standardization, further stimulating market growth. This collaborative approach is crucial in building consumer trust and ensuring charging compatibility across multiple EV brands and models.
- For instance, General Motors and EVgo announced the joint installation of more than 3,250 new fast chargers across the United States by the end of 2025 to support seamless EV charging access
Key Challenges
Lack of Standardization
One of the key challenges in the Electric Vehicle Connectors market is the lack of global standardization in connector types and charging protocols. Different regions and manufacturers often support varying connector designs, which can lead to compatibility issues for consumers, especially in cross-border travel. The absence of universal standards complicates infrastructure planning and limits seamless user experiences. Harmonizing connector standards across regions and automakers is essential to simplify the charging process and enable faster market growth.
High Installation and Equipment Costs
The substantial upfront investment required for installing advanced charging stations and high-capacity connectors is a significant barrier to market expansion. The costs associated with electrical upgrades, equipment procurement, and land acquisition for public charging stations can deter smaller businesses and municipalities. Although government incentives are partially mitigating these costs, the financial burden remains a key concern for large-scale infrastructure development, particularly in price-sensitive markets.
Limited Grid Capacity and Load Management
As EV adoption accelerates, the increasing demand for electricity presents a challenge to existing power grid capacities. Simultaneous charging of multiple EVs, especially at fast-charging stations, can lead to grid overloads and power stability issues. Without smart grid integration and effective load management solutions, the widespread deployment of electric vehicle connectors could strain local power networks. Addressing this issue requires coordinated investments in grid modernization, energy storage systems, and demand response strategies.
Regional Analysis
North America
North America accounted for a significant portion of the Electric Vehicle Connectors market, with a market size of USD 5.0 billion in 2018, reaching USD 11.0 billion in 2024, and projected to attain USD 37.6 billion by 2032. The region is growing at a CAGR of 17.7% during the forecast period and holds a market share of approximately 17.8% in 2024. Growth is driven by strong EV adoption in the United States and Canada, increasing investment in fast-charging infrastructure, and supportive government policies promoting electric vehicle penetration across both urban and highway networks.
Europe
Europe holds a considerable market position with a share of around 21.4% in 2024. The region’s market size expanded from USD 5.6 billion in 2018 to USD 13.3 billion in 2024 and is expected to reach USD 47.4 billion by 2032, growing at a CAGR of 18.9%. The market growth is supported by stringent emission regulations, aggressive EV adoption targets, and widespread development of public charging stations. Countries like Germany, France, and the UK are key contributors, with substantial investments from both governments and private players in expanding electric vehicle charging networks.
Asia Pacific
Asia Pacific dominates the Electric Vehicle Connectors market, accounting for the largest market share of approximately 35.6% in 2024. The region’s market size surged from USD 7.5 billion in 2018 to USD 22.1 billion in 2024 and is anticipated to reach USD 104.9 billion by 2032, registering the fastest CAGR of 21.6%. Rapid urbanization, growing EV sales in China, Japan, and South Korea, and extensive government subsidies are propelling market expansion. Strong manufacturing capabilities and increasing installation of fast and ultra-fast charging stations across the region further reinforce Asia Pacific’s market leadership.
Latin America
Latin America holds a modest market share of about 1.6% in 2024. The region’s Electric Vehicle Connectors market grew from USD 0.5 billion in 2018 to USD 0.9 billion in 2024 and is expected to reach USD 3.2 billion by 2032, expanding at a CAGR of 14.4%. The market is gradually growing, supported by the rising presence of electric buses and government initiatives to reduce urban emissions. Countries like Brazil and Mexico are showing early adoption trends, although limited charging infrastructure and slower EV market penetration currently restrain rapid growth.
Middle East
The Middle East Electric Vehicle Connectors market is developing steadily, with a market size of USD 0.8 billion in 2018, reaching USD 2.5 billion in 2024, and projected to grow to USD 11.6 billion by 2032. The region is witnessing growth at a CAGR of 15.3%, holding a market share of around 4.9% in 2024. Market expansion is driven by increasing smart city projects, rising EV awareness, and investments in high-capacity charging stations, particularly in the UAE and Saudi Arabia. However, broader adoption is challenged by the high dependence on conventional fuel and limited regional EV sales.
Africa
Africa represents an emerging market in the Electric Vehicle Connectors sector, with a small market share of approximately 2.1% in 2024. The market size grew from USD 0.3 billion in 2018 to USD 1.3 billion in 2024 and is forecasted to reach USD 6.8 billion by 2032, registering a CAGR of 13.8%. Growth is primarily concentrated in countries like South Africa, where there is gradual EV infrastructure development. However, limited charging networks, high EV costs, and low consumer awareness continue to challenge market acceleration across most parts of the continent.
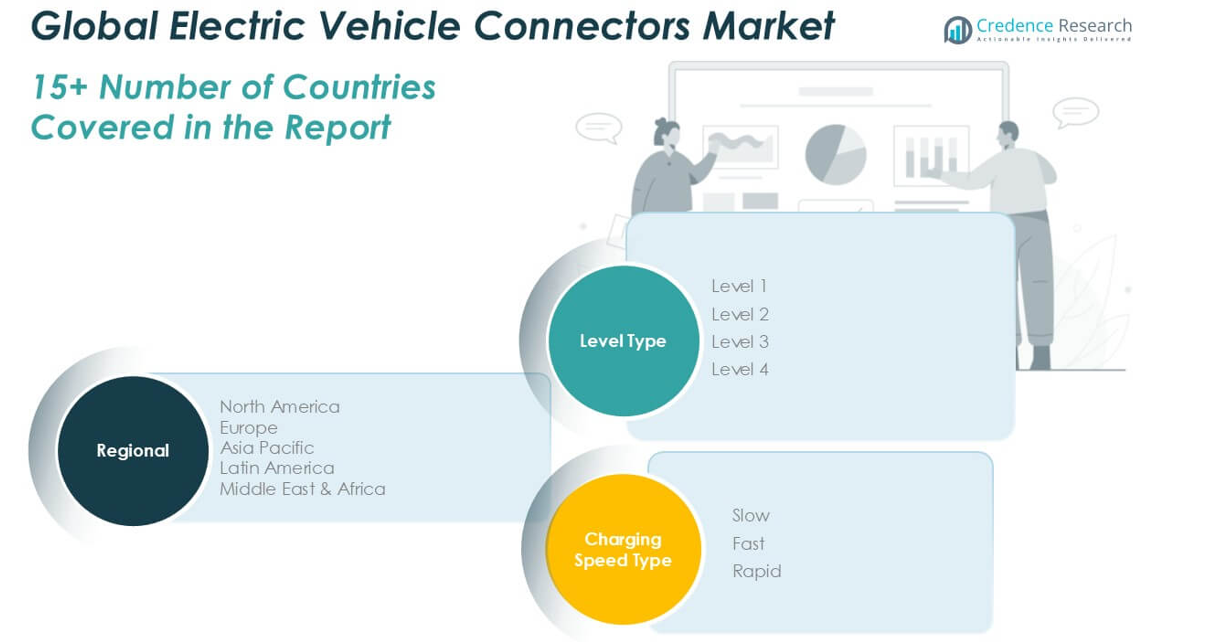
Market Segmentations:
By Level Type
- Level 1
- Level 2
- Level 3
- Level 4
By Charging Speed Type
- Slow
- Fast
- Rapid
By Geography
- North America
- U.S.
- Canada
- Mexico
- Europe
- Germany
- France
- U.K.
- Italy
- Spain
- Rest of Europe
- Asia Pacific
- China
- Japan
- India
- South Korea
- South-east Asia
- Rest of Asia Pacific
- Latin America
- Brazil
- Argentina
- Rest of Latin America
- Middle East & Africa
- GCC Countries
- South Africa
- Rest of the Middle East and Africa
Competitive Landscape
The competitive landscape of the Electric Vehicle Connectors market is characterized by the presence of several well-established global players actively investing in innovation, strategic partnerships, and capacity expansion to strengthen their market positions. Leading companies such as TE Connectivity, Yazaki Corporation, Sumitomo Electric Industries, Aptiv PLC, and Amphenol Corporation dominate the market with comprehensive product portfolios and strong R&D capabilities. These firms focus on developing advanced connector technologies that support faster charging, enhanced safety, and greater compatibility across various EV platforms. Recent strategic initiatives include mergers, acquisitions, and collaborations aimed at expanding geographical reach and integrating smart charging solutions. Additionally, emerging players and regional manufacturers are entering the market, intensifying competition and driving technological advancements. The market’s dynamic nature compels companies to continuously improve product quality, reduce costs, and adhere to evolving regulatory standards to capture a larger share of the rapidly growing electric vehicle ecosystem.
Key Player Analysis
- TE Connectivity
- Yazaki Corporation
- Sumitomo Electric Industries, Ltd.
- Aptiv PLC
- Amphenol Corporation
- ITT Inc.
- Rosenberger Hochfrequenztechnik GmbH & Co. KG
- Huber+Suhner AG
- Foxconn
- ITT Cannon
- Phoenix Contact
- BizLink Group
- China Auto Electronics Group Limited
- KUK Grou
Recent Developments
- In June 2025, Yazaki North America announced a strategic equity investment in MOTER Technologies, aiming to accelerate innovation in mobility and EV-related technologies.
- In May 2025, Phoenix Contact presented its second-generation CCS2 charging connector at Power2Drive Europe. This new connector boasts megawatt charging capabilities, offering up to 1,000 kW in Boost Mode and 800 kW continuously.
- In January 2025, Yazaki Innovations, a subsidiary of Yazaki North America, unveiled a new line of lightweight, high-efficiency busbars for electric vehicles at CES 2025. These busbars are engineered for superior corrosion resistance, simplified installation, and improved current flow, minimizing energy loss and enhancing system reliability.
Market Concentration & Characteristics
The Electric Vehicle Connectors Market shows a moderately concentrated structure with several dominant global players holding significant market positions. Leading companies, including TE Connectivity, Yazaki Corporation, Sumitomo Electric Industries, and Aptiv PLC, maintain strong control through advanced technologies, broad product portfolios, and established distribution networks. The market operates within a high-growth environment, driven by increasing electric vehicle adoption and expanding charging infrastructure. Product differentiation remains essential, with manufacturers focusing on connector durability, safety, and compatibility across diverse vehicle models. Pricing competition is notable, but the emphasis remains on performance and regulatory compliance. The market favors players that can deliver scalable, high-speed charging solutions while supporting evolving global standards. Entry barriers exist due to the need for technological expertise, strict safety certifications, and substantial capital investments. It continues to evolve rapidly, with strong demand in Asia Pacific, Europe, and North America. Continuous innovation and strategic collaborations shape the competitive dynamics and future direction of the market.
Report Coverage
The research report offers an in-depth analysis based on Level Type, Charging Speed Type, and Geography. It details leading market players, providing an overview of their business, product offerings, investments, revenue streams, and key applications. Additionally, the report includes insights into the competitive environment, SWOT analysis, current market trends, as well as the primary drivers and constraints. Furthermore, it discusses various factors that have driven market expansion in recent years. The report also explores market dynamics, regulatory scenarios, and technological advancements that are shaping the industry. It assesses the impact of external factors and global economic changes on market growth. Lastly, it provides strategic recommendations for new entrants and established companies to navigate the complexities of the market.
Future Outlook
- The demand for electric vehicle connectors will continue to grow with the increasing global shift toward electric mobility.
- Fast and ultra-fast charging connectors will see higher adoption to support reduced charging times.
- Level 2 connectors will maintain strong market presence due to their wide compatibility and cost efficiency.
- Asia Pacific will remain the leading region, driven by rapid electric vehicle adoption and expanding charging networks.
- Europe and North America will experience steady growth supported by government policies and infrastructure investments.
- Wireless charging technologies will emerge as a complementary solution to traditional connectors.
- The market will see increased standardization efforts to ensure interoperability across vehicle types and charging stations.
- Strategic partnerships among automakers, governments, and charging providers will become more common.
- Continuous product innovation will focus on safety, durability, and support for higher charging speeds.
- Companies will face pressure to reduce manufacturing costs while maintaining performance and regulatory compliance.

Request a Free Sample
Fill in your details and we'll send you a free sample report.
- Sample data tables & charts
- Research methodology
Market Dynamics
Expansion of Charging Infrastructure
Governments and private entities are investing heavily in public, residential, and highway charging stations, which increases the demand for electric vehicle connectors to support seamless EV adoption and address range anxiety.
Technological Advancements in Connector Design
Innovations such as improved durability, enhanced safety features, and compatibility with higher charging speeds are making connectors more reliable and efficient, supporting the adoption of next-generation EVs and fast-charging solutions.
Government Incentives and Emission Regulations
Subsidies, tax incentives, and stricter emission standards are encouraging both consumers and manufacturers to transition to electric vehicles, directly boosting the need for advanced connector solutions.
Standardization and Public-Private Collaborations
Efforts to harmonize connector standards and strategic partnerships between automakers, governments, and infrastructure providers are accelerating the deployment of accessible and interoperable charging networks, driving market growth.
Rising Adoption of Fast and Ultra-Fast Charging
The increasing consumer demand for reduced charging times is propelling the adoption of high-capacity connectors, especially in commercial and highway charging stations, further expanding the market.
Need a Custom Version of This Report?
Tailor the scope, geography, or segments to your exact requirements.
- Custom geography or segment scope
- Direct access to our analyst team
Frequently Asked Questions
What is the current size of the Electric Vehicle Connectors Market?
What are the key segments within the Electric Vehicle Connectors Market?
What are some challenges faced by the Electric Vehicle Connectors Market?
Who are the major players in the Electric Vehicle Connectors Market?
Table of Content
Chapter 1 Market Segmentation
- 1.1 Segmentation Framework
- 1.1.1 Product and Service Classification
- 1.1.2 Application and End-Use Classification
- 1.1.3 Technology and Solution Classification
- 1.1.4 Customer and Distribution Channel Classification
- 1.1.5 Geographic Segmentation
- 1.1.6 Market Segment Definitions and Boundaries
- 1.2 By Level Type
- 1.2.1 Level 1
- 1.2.2 Level 2
- 1.2.3 Level 3
- 1.2.4 Level 4
- 1.3 By Charging Speed Type
- 1.3.1 Slow
- 1.3.2 Fast
- 1.3.3 Rapid
Chapter 2 Introduction
- 2.1 Report Objectives and Scope
- 2.2 Product Definition and Industry Terminology
- 2.3 Market Inclusions and Exclusions
- 2.4 Research Process
- 2.4.1 Primary Research and Expert Interviews
- 2.4.2 Secondary Research and Source Review
- 2.4.3 Top-Down and Bottom-Up Estimation
- 2.4.4 Data Triangulation and Verification
- 2.5 Market Size Measurement Basis
- 2.5.1 2024: USD 51.2 billion → 2032: USD 211.5 billion
- 2.6 Historical and Forecast Reference Periods
- 2.6.1 Base Year: 2024
- 2.6.2 Forecast Period: 2024-2032
- 2.7 Research Assumptions and Limitations
Chapter 3 Executive Summary
- 3.1 Market Snapshot and Key Findings
- 3.2 Base-Year Market Size, 2024
- 3.3 Forecast Market Size, 2032
- 3.4 Revenue and Volume Growth Outlook
- 3.5 Key Demand and Supply Indicators
- 3.6 Leading Market Segments
- 3.7 Fastest-Growing Market Opportunities
- 3.8 Regional Performance Highlights
- 3.9 Technology and Industry Transformation
- 3.10 Competitive Landscape Summary
- 3.11 Analyst View and Strategic Implications
Chapter 4 Global Electric Vehicle Connectors Market Trends and Developments
- 4.1 Historical Industry Development
- 4.2 Recent Market Trends and Developments
- 4.3 Demand and Customer Behavior Trends
- 4.4 Technology and Product Innovation
- 4.5 Artificial Intelligence, Automation and Digitalization
- 4.6 Local Manufacturing and Supply Chain Realignment
- 4.7 Industry Partnerships, Mergers and Acquisitions
- 4.8 Sustainability and Circular Economy Developments
- 4.9 Government and Private Sector Investment Trends
- 4.10 Emerging Business Models and Commercialization
- 4.11 Industry Developments and Announcements
Chapter 5 Global Electric Vehicle Connectors Market Production, Supply and Demand Analysis
- 5.1 Demand Trend and Consumption Analysis
- 5.2 Demand Forecast, 2024-2032
- 5.3 Production and Output Trend
- 5.4 Production and Output Forecast, 2024-2032
- 5.5 Installed Capacity and Capacity Utilization
- 5.6 Company-Wise Production Plants and Statistics
- 5.6.1 Installed Production Capacity
- 5.6.2 Actual Production
- 5.6.3 Planned Capacity and Expansion Targets
- 5.7 Supply Chain Structure and Procurement Trends
- 5.8 Supply-Demand Gap and Bottlenecks
- 5.9 Import Dependence and Sourcing Structure
- 5.10 Contract Manufacturing and Outsourcing
- 5.11 Regional Supply and Demand Concentration
Chapter 6 Global Electric Vehicle Connectors Market Pricing Analysis
- 6.1 Pricing Structure and Measurement
- 6.2 Historical Pricing Trends
- 6.3 Pricing Outlook, 2024-2032
- 6.4 Average Selling Price and Unit Economics
- 6.5 Pricing by Product and Market Segment
- 6.6 Geographic Pricing Differences
- 6.7 Key Input, Energy, Labor and Logistics Costs
- 6.8 Contract Pricing and Purchasing Models
- 6.9 Pricing Sensitivity and Competitive Positioning
- 6.10 Price, Margin and Profitability Implications
Chapter 7 Global Electric Vehicle Connectors Market Dynamics
- 7.1 Market Growth Drivers
- 7.1.1 Demand-Side Drivers
- 7.1.2 Technology and Innovation Drivers
- 7.1.3 Infrastructure and Investment Drivers
- 7.1.4 Regulatory and Policy Drivers
- 7.2 Market Restraints
- 7.2.1 Cost and Affordability Constraints
- 7.2.2 Technology and Adoption Barriers
- 7.2.3 Supply Chain and Operational Constraints
- 7.3 Market Challenges
- 7.3.1 Competitive Pressure and Margin Erosion
- 7.3.2 Skills, Infrastructure and Implementation Gaps
- 7.4 Emerging Market Opportunities
- 7.5 Market Dynamics Impact and Time-Horizon Assessment
Chapter 8 Global Electric Vehicle Connectors Value Chain Analysis
- 8.1 Industry Value Chain Overview
- 8.2 Upstream Suppliers and Critical Inputs
- 8.3 Technology and Component Providers
- 8.4 Manufacturing or Service Delivery
- 8.5 Distribution, Channel Partners and Integrators
- 8.6 Downstream Applications and End Users
- 8.7 Value Addition and Profit Pools
- 8.8 Vertical Integration and Outsourcing
- 8.9 Supplier Concentration and Risk
- 8.10 Supply Chain Localization and Resilience
Chapter 9 Global Electric Vehicle Connectors Market Regulations and Policies
- 9.1 Relevant Laws, Standards and Compliance Frameworks
- 9.2 Product, Service, Safety and Quality Requirements
- 9.3 Government Policies, Incentives and Subsidies
- 9.4 Imports, Exports and Trade Barriers
- 9.5 Public Procurement and Local Content Requirements
- 9.6 Environmental and Sustainability Compliance
- 9.7 Upcoming Policy Changes and Market Implications
Chapter 10 Global Electric Vehicle Connectors Market Hotspots and Opportunities
- 10.1 Market Opportunity Mapping and Growth Hotspots
- 10.2 High-Growth Applications and Customer Groups
- 10.3 Underserved Markets and White-Space Opportunities
- 10.4 Emerging Technology and Product Opportunities
- 10.5 New Capacity and Investment Hotspots
- 10.6 Market Entry and Expansion Opportunities
- 10.7 Distribution and Partnership Opportunities
- 10.8 Near-Term and Long-Term Commercial Potential
- 10.9 Opportunity Attractiveness and Execution Risks
Chapter 11 Global Electric Vehicle Connectors Market Outlook, 2024-2032
- 11.1 Market Size and Analysis
- 11.1.1 Revenue (Market Measurement: 2024: USD 51.2 billion → 2032: USD 211.5 billion)
- 11.1.2 Market Volume and Quantity Sold
- 11.1.3 Historical Market Size
- 11.1.4 Base-Year Market Size, 2024
- 11.2 Market Forecast, 2024-2032
- 11.2.1 Revenue Forecast to 2032
- 11.2.2 Volume Forecast to 2032
- 11.2.3 CAGR and Year-on-Year Growth
- 11.2.4 Incremental Revenue Opportunity
- 11.3 Forecast Assumptions and Scenario Analysis
- 11.3.1 Base-Case Forecast
- 11.3.2 Optimistic and Conservative Scenarios
- 11.3.3 Technology, Pricing and Policy Sensitivities
- 11.4 Market Attractiveness and Growth Outlook
Chapter 12 Global Electric Vehicle Connectors Market Segmentation and Outlook
- 12.1 Segmentation Summary and Market Shares, 2024
- 12.2 Largest and Fastest-Growing Segments
- 12.3 By Level Type - Market Size and Forecast, 2024-2032
- 12.3.1 Segment Definition and Scope
- 12.3.2 Historical Market Size
- 12.3.3 Revenue Forecast, 2024-2032
- 12.3.4 Volume Forecast, 2024-2032
- 12.3.5 Base-Year Market Share, 2024
- 12.3.6 Segment CAGR and Growth Drivers
- 12.3.7 Subsegment Market Size and Forecast
- 12.3.7.1 Level 1
- 12.3.7.2 Level 2
- 12.3.7.3 Level 3
- 12.3.7.4 Level 4
- 12.3.8 Subsegment Pricing and Adoption Trends
- 12.3.9 Leading Suppliers and Competition
- 12.3.10 Regional Demand and Opportunities
- 12.4 By Charging Speed Type - Market Size and Forecast, 2024-2032
- 12.4.1 Segment Definition and Scope
- 12.4.2 Historical Market Size
- 12.4.3 Revenue Forecast, 2024-2032
- 12.4.4 Volume Forecast, 2024-2032
- 12.4.5 Base-Year Market Share, 2024
- 12.4.6 Segment CAGR and Growth Drivers
- 12.4.7 Subsegment Market Size and Forecast
- 12.4.7.1 Slow
- 12.4.7.2 Fast
- 12.4.7.3 Rapid
- 12.4.8 Subsegment Pricing and Adoption Trends
- 12.4.9 Leading Suppliers and Competition
- 12.4.10 Regional Demand and Opportunities
- 12.5 Segment Growth Comparison
- 12.6 Segment Attractiveness and Priority Matrix
Chapter 13 Global Electric Vehicle Connectors Geographic Market Outlook, 2024-2032
- 13.1 Regional Market Size and Share, 2024
- 13.2 Regional Market Forecast, 2024-2032
- 13.3 Regional Pricing, Production and Demand Differences
- 13.4 North America
- 13.4.1 United States
- 13.4.2 Canada
- 13.4.3 Mexico
- 13.5 Europe
- 13.5.1 Germany
- 13.5.2 France
- 13.5.3 Italy
- 13.5.4 United Kingdom
- 13.5.5 Spain
- 13.5.6 Poland
- 13.5.7 Russia
- 13.5.8 Netherlands
- 13.5.9 Belgium
- 13.5.10 Sweden
- 13.5.11 Denmark
- 13.5.12 Norway
- 13.5.13 Rest of Europe
- 13.6 Asia Pacific
- 13.6.1 China
- 13.6.2 India
- 13.6.3 Japan
- 13.6.4 South Korea
- 13.6.5 Thailand
- 13.6.6 Indonesia
- 13.6.7 Vietnam
- 13.6.8 Malaysia
- 13.6.9 Australia
- 13.6.10 Rest of Asia Pacific
- 13.7 Latin America
- 13.7.1 Brazil
- 13.7.2 Argentina
- 13.7.3 Colombia
- 13.7.4 Chile
- 13.7.5 Rest of Latin America
- 13.8 Middle East
- 13.8.1 Saudi Arabia
- 13.8.2 United Arab Emirates
- 13.8.3 Turkey
- 13.8.4 Israel
- 13.8.5 Iran
- 13.8.6 Rest of the Middle East
- 13.9 Africa
- 13.9.1 South Africa
- 13.9.2 Egypt
- 13.9.3 Nigeria
- 13.9.4 Morocco
- 13.9.5 Rest of Africa
- 13.10 Regional Investment, Policy and Supply Chain Differences
- 13.11 Regional Competitive Landscape
- 13.12 Geographic Growth Hotspots
Chapter 14 Global Electric Vehicle Connectors Technology, Innovation and Sustainability Outlook
- 14.1 Technology Landscape and Maturity
- 14.2 Product, Process and Service Innovation
- 14.3 AI, Automation and Digital Tools in the Industry
- 14.4 Technology Adoption and Performance Benchmarking
- 14.5 Innovation Pipeline and R&D Investment
- 14.6 Patent and Intellectual Property Trends
- 14.7 Energy Efficiency and Resource Management
- 14.8 Sustainability, Recycling and Circularity
- 14.9 Technology Roadmap, 2024-2032
- 14.10 Risks of Obsolescence and Technology Substitution
Chapter 15 Global Electric Vehicle Connectors Market Key Strategic Imperatives
- 15.1 Growth and Market Entry Priorities
- 15.2 High-Return Products and Segments
- 15.3 Pricing, Profitability and Cost Optimization
- 15.4 Technology Investment and Product Differentiation
- 15.5 Supply Chain Localization and Resilience
- 15.6 Distribution and Customer Acquisition
- 15.7 Partnership, Acquisition and Capacity Strategy
- 15.8 Regional Expansion Priorities
- 15.9 Short-, Medium- and Long-Term Actions
Chapter 16 Competition Outlook
- 16.1 Industry Competition Characteristics
- 16.2 Market Structure and Concentration
- 16.3 Market Share and Competitive Positioning, 2024
- 16.4 Company-Wise Revenue and Product Benchmarking
- 16.5 Production and Service Capacity Benchmarking
- 16.6 Technology, Pricing and Differentiation
- 16.7 Regional Footprint and Distribution Strength
- 16.8 Mergers, Acquisitions and Strategic Alliances
- 16.9 New Entrants and Competitive Threats
- 16.10 Porter's Five Forces and Industry Attractiveness
- 16.11 Competitive Outlook, 2024-2032
Chapter 17 Company Profiles
- 17.1 Company Coverage and Selection Criteria
- 17.2 TE Connectivity
- 17.2.1 Business Description
- 17.2.2 Company Ownership and Geographic Presence
- 17.2.3 Product and Service Portfolio
- 17.2.4 Manufacturing and Operating Footprint
- 17.2.5 Production Capacity and Expansion Plans
- 17.2.6 Financial Performance and Investment
- 17.2.7 Market Share and Competitive Position
- 17.2.8 Technology and Innovation Capabilities
- 17.2.9 Strategic Alliances or Partnerships
- 17.2.10 Recent Developments
- 17.2.11 Growth Strategy and Outlook
- 17.3 Yazaki Corporation
- 17.4 Sumitomo Electric Industries, Ltd.
- 17.5 Aptiv PLC
- 17.6 Amphenol Corporation
- 17.7 ITT Inc.
- 17.8 Rosenberger Hochfrequenztechnik GmbH & Co. KG
- 17.9 Phoenix Contact
- 17.10 BizLink Group
- 17.11 Foxconn
- 17.12 Other Relevant Market Participants
Note: Every listed company is profiled on the structure shown under the first company. The company list is preliminary and may change based on research findings, market developments, data availability and client requirements.
Chapter 18 Disclaimer
- 18.1 Research and Forecast Disclaimer
- 18.2 Data Source and Estimation Limitations
Note: The depth of individual sections depends on data availability for this market. Volume, capacity, trade and other unit-based metrics are included where applicable.