
| REPORT ATTRIBUTE | DETAILS |
|---|---|
| Historical Period | 2020-2023 |
| Base Year | 2024 |
| Forecast Period | 2025-2032 |
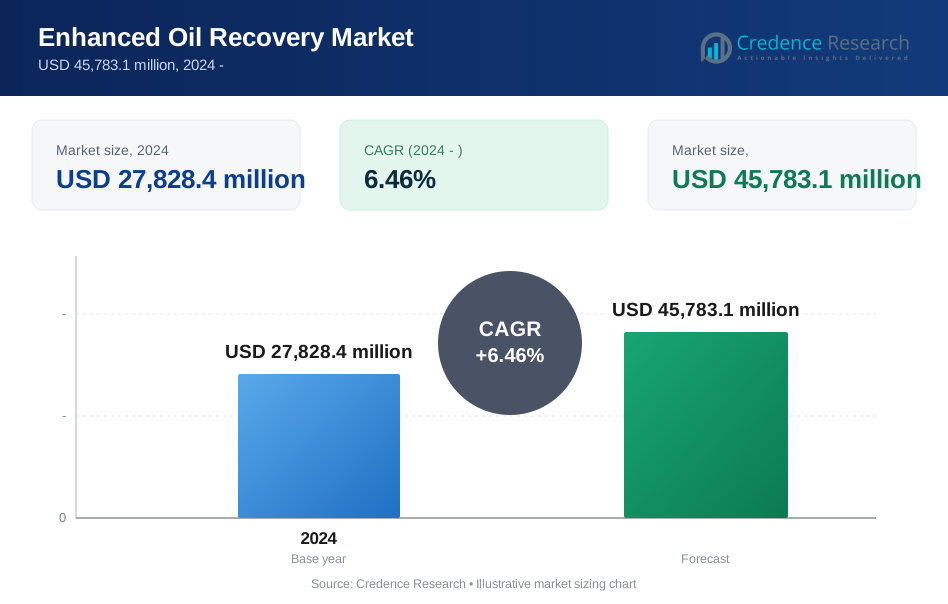
| Enhanced Oil Recovery Market Size 2024 | USD 27,828.4 million |
| Enhanced Oil Recovery Market, CAGR | 6.46% |
| Enhanced Oil Recovery Market Size 2032 | USD 45,783.1 million |
Market Overview
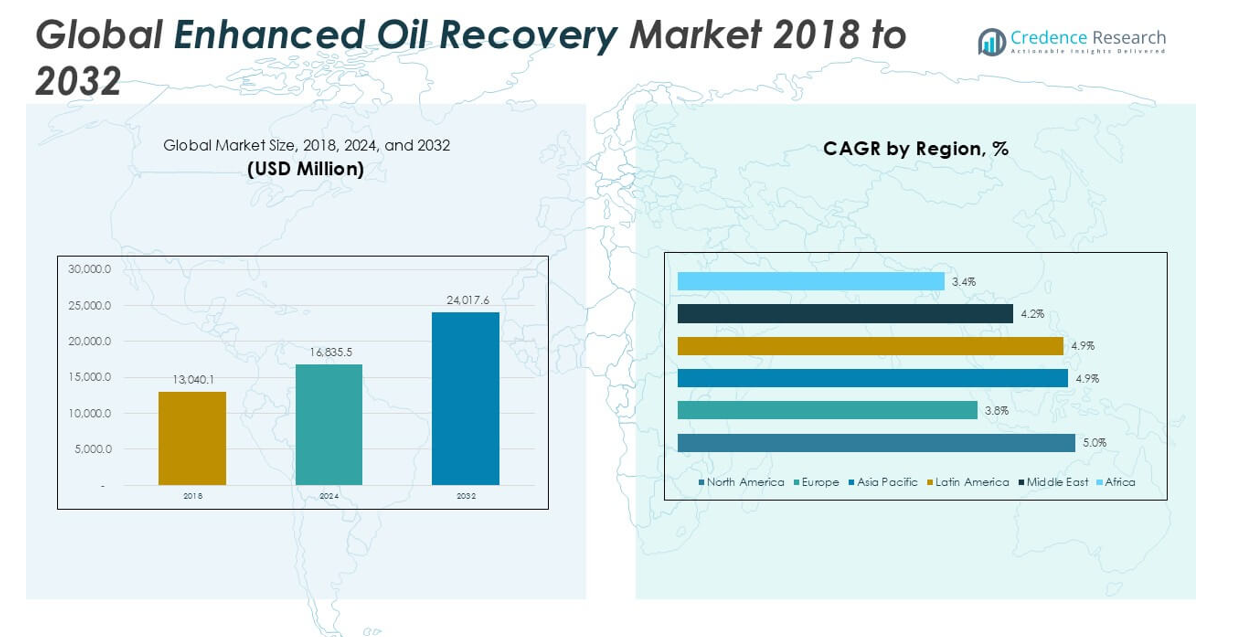
The Enhanced Oil Recovery market size was valued at USD 19,487.6 million in 2018, reached USD 27,828.4 million in 2024, and is anticipated to reach USD 45,783.1 million by 2032, at a CAGR of 6.46% during the forecast period.
The Enhanced Oil Recovery market is shaped by major players such as Petrobras, Exxon Mobil Corporation, Chevron Corporation, Royal Dutch Shell Plc, ConocoPhillips Company, Statoil ASA, BP p.l.c., Denbury Resources Inc., Suncor Energy Inc., and Lukoil, all of which maintain extensive portfolios and advanced capabilities across diverse EOR technologies. These companies drive innovation through substantial investment in research, development, and strategic collaborations, enabling them to address varying reservoir challenges globally. North America stands as the leading region, capturing 37.1% of the global market share in 2024, supported by mature oil fields, advanced infrastructure, and widespread adoption of gas and chemical injection methods. This leadership is reinforced by robust regulatory frameworks and ongoing investments in technological upgrades.
Market Insights
- The Enhanced Oil Recovery market was valued at USD 27,828.4 million in 2024 and is projected to reach USD 45,783.1 million by 2032, registering a CAGR of 6.46% during the forecast period.
- Strong demand for maximizing output from mature oil fields and increasing investments in advanced recovery technologies drive the market’s steady growth.
- Integration of carbon capture solutions and expansion into unconventional reservoirs represent key market trends, as companies seek both efficiency and environmental compliance.
- The market is highly competitive, with major players including Petrobras, Exxon Mobil Corporation, Chevron Corporation, and Royal Dutch Shell Plc, each focusing on technological innovation and broad project portfolios; high capital and operational costs act as significant restraints.
- North America leads the market with a 37.1% share in 2024, while gas injection remains the dominant segment by technology; Asia Pacific and the Middle East also show robust growth, driven by rising energy demand and increased adoption of EOR methods.
Market Segmentation Analysis:
By Technology
In the Enhanced Oil Recovery market, the gas injection segment holds the largest market share, driven by its effectiveness in improving oil extraction rates from mature reservoirs. Gas injection methods, such as CO₂ and natural gas injection, increase reservoir pressure and enhance oil displacement, making them highly efficient for large-scale operations. This segment’s dominance is supported by technological advancements and regulatory incentives for carbon capture and storage. The adoption of gas injection continues to rise due to its cost efficiency, flexibility across different reservoir types, and alignment with sustainability goals.
- For instance, ExxonMobil has implemented CO₂ injection in the Wasson San Andres Unit in Texas, injecting over 500 million cubic feet of CO₂ per day to significantly increase oil production.
By Application
Within the application segment, onshore operations dominate the Enhanced Oil Recovery market, accounting for the highest revenue share. Onshore EOR projects benefit from lower operational complexities, easier infrastructure development, and reduced capital requirements compared to offshore projects. The onshore segment’s growth is fueled by the abundance of mature oil fields and the need to maximize output from existing assets. Increased investments in technology upgrades and favorable government policies further drive the adoption of EOR methods in onshore locations, maintaining its leadership in the market.
- For instance, Chevron’s Kern River Field in California has successfully applied steam flooding to over 1,400 wells, resulting in cumulative oil production surpassing 2 billion barrels.
Market Overview
Rising Demand for Oil from Mature Fields
The Enhanced Oil Recovery market experiences significant growth due to the increasing need to extract more oil from mature and declining reservoirs. Traditional extraction methods have left substantial quantities of recoverable oil underground, prompting producers to invest in advanced EOR technologies. This approach not only extends the operational life of existing fields but also maximizes resource utilization, which is vital in regions facing dwindling new discoveries and stricter production targets.
- For instance, Petrobras has extended the productive life of the Marlim field by using EOR techniques that have enabled the extraction of over 400 million barrels of additional oil.
Technological Advancements in EOR Methods
Continuous innovations in EOR technologies such as gas injection, chemical injection, and thermal processes serve as a major growth catalyst for the market. Enhanced efficiency, reduced operational costs, and improved recovery rates attract both established oil companies and new market entrants. Breakthroughs in carbon capture, storage, and digital monitoring further enhance the effectiveness of EOR techniques, making these methods more attractive for large-scale deployment.
- For instance, BP has deployed polymer flooding technology in the Dalia field offshore Angola, increasing recovery rates by approximately 200,000 barrels of oil per day.
Supportive Government Policies and Incentives
Many governments offer tax breaks, subsidies, and research funding to support the deployment of EOR projects, especially those that contribute to carbon capture and storage initiatives. These supportive policies not only reduce the financial burden on oil producers but also encourage the adoption of sustainable extraction practices. Such incentives stimulate investments and accelerate the commercialization of innovative EOR technologies in both developed and developing regions.
Key Trends & Opportunities
Integration of Carbon Capture and Storage (CCS)
A growing trend in the Enhanced Oil Recovery market is the integration of EOR projects with carbon capture and storage solutions. This approach allows companies to inject captured CO₂ into reservoirs for oil recovery, thereby reducing greenhouse gas emissions. The dual benefit of enhanced production and environmental compliance positions CCS-integrated EOR as an attractive opportunity for producers focused on sustainability and regulatory alignment.
- For instance, Denbury Resources has captured and utilized over 7 million metric tons of CO₂ annually for EOR operations in the Gulf Coast region.
Expansion into Unconventional Reservoirs
The development and application of EOR techniques in unconventional reservoirs present significant growth opportunities. Advancements in drilling and reservoir management enable EOR adoption in challenging geological conditions, such as shale formations and deepwater fields. This trend broadens the market’s potential, encouraging investment in R&D and supporting higher oil recovery rates from previously uneconomical resources.
- For instance, Shell’s EOR project in the Vito deepwater field in the Gulf of Mexico targets unconventional reservoirs at depths exceeding 4,000 meters, demonstrating the technical feasibility and success of such methods in complex environments.
Key Challenges
High Operational and Capital Costs
The implementation of advanced EOR methods requires significant investment in technology, equipment, and skilled labor, leading to high operational and capital expenditures. These costs often act as a barrier for small and mid-sized companies, limiting broader market adoption. Fluctuations in global oil prices can further deter investment in new EOR projects due to uncertain returns.
Complexity of Reservoir Geology
EOR techniques must be tailored to the specific geological characteristics of each reservoir, which adds technical complexity and risk. Unpredictable reservoir responses, compatibility issues, and variable recovery rates complicate project planning and execution. The complexity of geology often leads to increased timeframes and costs, impacting the overall feasibility of EOR deployment.
Regulatory and Environmental Concerns
Enhanced Oil Recovery operations, especially those involving chemicals and gas injection, face strict regulatory scrutiny over potential environmental impacts. Compliance with evolving safety and environmental standards can increase operational costs and cause project delays. Addressing public concerns and adhering to environmental guidelines remain critical challenges for industry participants.
Regional Analysis
North America
North America leads the Enhanced Oil Recovery market, reaching USD 10,327.52 million in 2024 and holding the largest market share at 37.1%. The region’s value increased from USD 7,175.32 million in 2018 and is projected to hit USD 17,168.67 million by 2032 at a CAGR of 6.6%. Widespread adoption of EOR technologies in the U.S. and Canada, robust infrastructure, and ongoing innovation drive North America’s dominance, supported by the concentration of mature oil fields and favorable regulatory policies.
Europe
Europe accounts for a 17.5% share of the Enhanced Oil Recovery market in 2024, with revenue growing to USD 4,877.13 million from USD 3,486.32 million in 2018. The region is set to reach USD 7,801.44 million by 2032, advancing at a CAGR of 6.1%. Progressive investments in EOR, particularly in the UK and Norway, and proactive government incentives for carbon mitigation foster steady market expansion and reinforce Europe’s competitive global standing.
Asia Pacific
Asia Pacific captures 21.6% of the Enhanced Oil Recovery market in 2024, valued at USD 6,353.62 million, up from USD 4,310.65 million in 2018. The region’s market is anticipated to reach USD 10,887.22 million by 2032, boasting the highest CAGR at 7.0%. Rapidly rising energy demand, growing investment in mature field technologies, and supportive government initiatives in China and India position Asia Pacific as a key growth region.
Latin America
Latin America holds an 8.0% market share in 2024, with Enhanced Oil Recovery revenues reaching USD 2,231.04 million, compared to USD 1,711.01 million in 2018. Expected to achieve USD 3,204.82 million by 2032 at a 4.7% CAGR, the region’s progress is led by Brazil and Venezuela, where mature fields and ongoing technological upgrades enable steady development despite modest growth rates.
Middle East
The Middle East represents 13.1% of the global Enhanced Oil Recovery market in 2024, with a value of USD 3,650.69 million, up from USD 2,490.51 million in 2018. The market is forecasted to climb to USD 6,212.77 million by 2032, advancing at a 6.9% CAGR. Large hydrocarbon reserves, advanced EOR techniques in Saudi Arabia and Oman, and increasing investment in field modernization maintain the region’s substantial role in global EOR expansion.
Africa
Africa holds the smallest share of the Enhanced Oil Recovery market at 1.4% in 2024, valued at USD 388.41 million, rising from USD 313.75 million in 2018. The market is projected to reach USD 508.19 million by 2032, growing at a CAGR of 3.4%. Slow technology adoption and infrastructure constraints hinder rapid growth, but new EOR projects in Nigeria and Angola and increased foreign investment offer opportunities for incremental gains.
Market Segmentations:
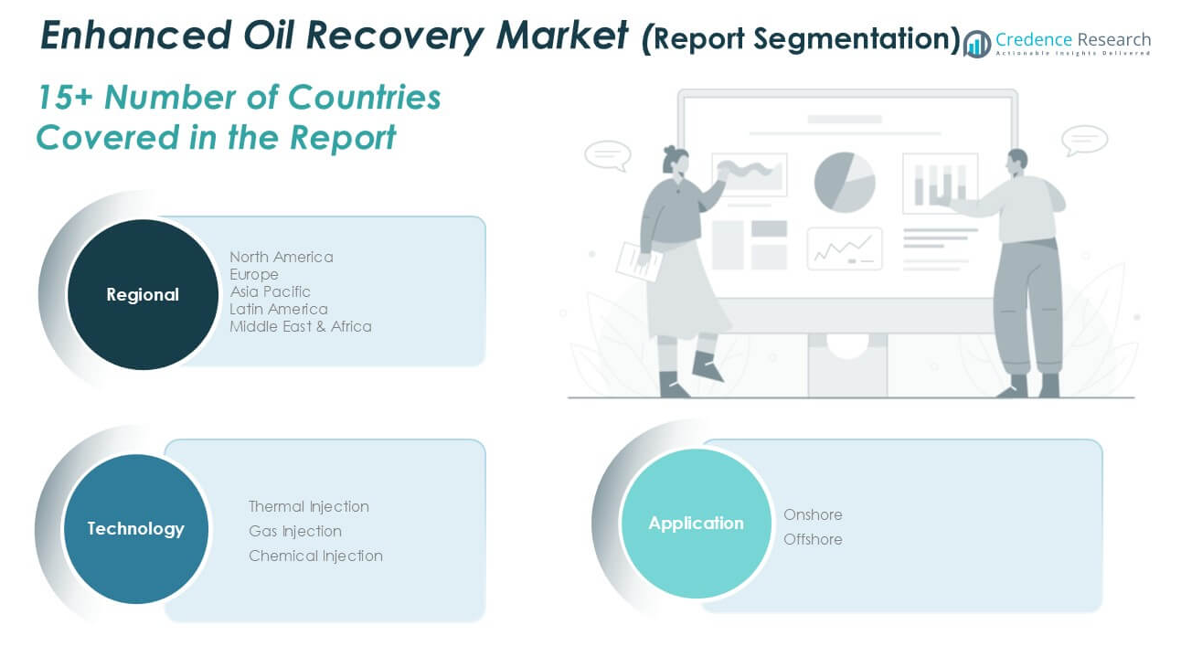
By Technology
- Thermal Injection
- Gas Injection
- Chemical Injection
By Application
- Onshore
- Offshore
By Geography:
- North America
- U.S.
- Canada
- Mexico
- Europe
- Germany
- France
- U.K.
- Italy
- Spain
- Rest of Europe
- Asia Pacific
- China
- Japan
- India
- South Korea
- South-east Asia
- Rest of Asia Pacific
- Latin America
- Brazil
- Argentina
- Rest of Latin America
- Middle East & Africa
- GCC Countries
- South Africa
- Rest of the Middle East and Africa
Competitive Landscape
The competitive landscape of the Enhanced Oil Recovery market features a mix of global energy majors and specialized service providers, each leveraging technological innovation, extensive field experience, and strategic partnerships to strengthen their market positions. Leading companies such as Petrobras, Exxon Mobil Corporation, Chevron Corporation, Royal Dutch Shell Plc, ConocoPhillips Company, Statoil ASA, BP p.l.c., Denbury Resources Inc., Suncor Energy Inc., and Lukoil maintain robust portfolios of EOR projects spanning both onshore and offshore assets. These players consistently invest in research and development to improve recovery efficiency and reduce operational costs, while also integrating advanced digital solutions and carbon management strategies. Competitive differentiation centers on the ability to deploy diverse EOR technologies such as gas, thermal, and chemical injection tailored to complex reservoir conditions. Collaborations with technology partners and sustained capital investment allow market leaders to scale operations and secure long-term growth, even in the face of fluctuating oil prices and evolving regulatory requirements.
Key Player Analysis
- Petrobras
- Exxon Mobil Corporation
- Chevron Corporation
- Royal Dutch Shell Plc
- ConocoPhillips Company
- Statoil ASA
- BP p.l.c.
- Denbury Resources Inc.
- Suncor Energy Inc.
- Lukoil
Recent Developments
- In 2025, Lukoil remains a significant player in enhanced oil recovery (EOR), particularly in Russia and surrounding regions. The company focuses on deploying EOR techniques, including chemical and gas injection, to counteract declining production in mature oil fields. Lukoil is a leading EOR operator and also among the top oil and gas companies in terms of cumulative emissions due to its extensive upstream activities, according to the IEA.
- In 2025, Suncor Energy is a key player in the Enhanced Oil Recovery (EOR) market, particularly in Canada, actively developing and utilizing advanced chemical and thermal EOR techniques to maximize oil recovery from oil sands and mature reservoirs. This aligns with the wider industry trend towards improving operational efficiency and sustainability by adopting advanced EOR technologies to increase production while minimizing environmental impact.
- In May 2025, Shell announced the start of production at the FPSO Alexandre de Gusmão in the Mero field offshore Brazil, as part of the Libra Consortium. Similar to Petrobras, this new FPSO indicates a focus on maximizing recovery from deepwater pre-salt fields.
- In January 2025, Chevron's affiliate, Tengizchevroil LLP (TCO), initiated oil production at the Future Growth Project (FGP) in the Tengiz oil field in Kazakhstan. This expansion project, which includes enhanced sour gas injection, aims to significantly increase oil output from the field. The FGP is designed to boost production by 260,000 barrels per day, representing a major step in long-term pressure maintenance and increased oil recovery through gas EOR.
Market Concentration & Characteristics
The Enhanced Oil Recovery Market exhibits moderate to high concentration, with a few multinational corporations dominating global operations through their extensive technical expertise, substantial capital resources, and diversified project portfolios. It features a competitive environment where leading players, including Petrobras, Exxon Mobil Corporation, Chevron Corporation, Royal Dutch Shell Plc, and BP p.l.c., continually invest in research and development to enhance recovery efficiencies and reduce operational costs. The market is characterized by high entry barriers due to the significant capital requirements, complex regulatory environment, and the need for advanced technological capabilities. It responds to global oil demand fluctuations, advances in EOR technologies, and evolving environmental standards. The adoption of gas, chemical, and thermal injection methods enables companies to tailor solutions to varied reservoir conditions, supporting both onshore and offshore development. Regional concentration remains strong in North America, Asia Pacific, and the Middle East, where mature oil fields and favorable regulatory frameworks sustain long-term investment and growth opportunities.
Report Coverage
The research report offers an in-depth analysis based on Technology, Application, and Geography. It details leading market players, providing an overview of their business, product offerings, investments, revenue streams, and key applications. Additionally, the report includes insights into the competitive environment, SWOT analysis, current market trends, as well as the primary drivers and constraints. Furthermore, it discusses various factors that have driven market expansion in recent years. The report also explores market dynamics, regulatory scenarios, and technological advancements that are shaping the industry. It assesses the impact of external factors and global economic changes on market growth. Lastly, it provides strategic recommendations for new entrants and established companies to navigate the complexities of the market.
Future Outlook
- EOR technologies will expand into unconventional and deepwater reservoirs to meet growing energy needs.
- Gas injection methods will gain traction due to carbon management synergy.
- Chemical EOR will advance with tailored polymers and surfactants.
- Thermal injection will advance in heavy oil regions, particularly in Asia Pacific.
- Digitalization and AI will optimize reservoir monitoring and injection control.
- Collaboration between oil majors and technology firms will accelerate innovation.
- Regulatory support for carbon capture will promote integrated EOR‑CCS projects.
- Smaller operators will adopt modular EOR solutions to extend mature field life.
- Geopolitical stability in key regions will influence future capital investment.
- Sustainability reporting will shape EOR adoption aligned with ESG mandates.
Request a Free Sample
Fill in your details and we'll send you a free sample report.
- Sample data tables & charts
- Research methodology
Need a Custom Version of This Report?
Tailor the scope, geography, or segments to your exact requirements.
- Custom geography or segment scope
- Direct access to our analyst team
Frequently Asked Questions
What is the current size of the Enhanced Oil Recovery Market?
What factors are driving the growth of the Enhanced Oil Recovery Market?
What are some challenges faced by the Enhanced Oil Recovery Market?
Who are the major players in the Enhanced Oil Recovery Market?
Table of Content
Chapter 1. Report Introduction
- 1.1 Report Description & Purpose
- 1.1.1 Report Title & Market Definition
- 1.1.2 Unique Selling Propositions (USP) & Key Differentiators
- 1.1.3 Value Proposition for Stakeholders
- 1.2 Research Objectives
- 1.2.1 Market Sizing Objectives (Volume & Revenue)
- 1.2.2 Segmentation Objectives
- 1.2.3 Competitive Intelligence Objectives
- 1.2.4 Forecast & Scenario Objectives
- 1.3 Report Scope
- 1.3.1 Enhanced Oil Recovery Scope – Types & Subtypes Covered
- 1.3.2 Geographic Scope – Regions & Countries Covered
- 1.3.3 Historical Period, Base Year & Forecast Period (2024; forecast to the forecast period)
- 1.3.4 Inclusions & Exclusions
- 1.4 HS Code & Classification Framework
- 1.5 Currency, Units & Pricing Basis
- 1.6 Target Stakeholders
- 1.7 Limitations & Assumptions
Chapter 2. Executive Summary
- 2.1 Global Enhanced Oil Recovery Market Snapshot
- 2.1.1 Market Size – Historical (2024) & Forecast (the forecast period) (2024: USD 27,828.4 million → forecast year: USD 45,783.1 million)
- 2.1.2 Volume & Revenue – Global Totals
- 2.1.3 Key Market Highlights – Top Five Facts
- 2.2 Enhanced Oil Recovery Market Segmentation Snapshot
- 2.2.1 Market Split by Region – 2024 vs.
- 2.3 Competitive Snapshot
- 2.3.1 Top 10 Players by Revenue Share – 2024
- 2.3.2 Top 10 Players by Volume Share – 2024
- 2.3.3 Recent Strategic Developments (18-Month Summary)
- 2.4 Key Investment Highlights & Strategic Conclusions
Chapter 3. Enhanced Oil Recovery Market Dynamics & Industry Analysis
- 3.1 Market Overview & Context
- 3.1.1 Enhanced Oil Recovery Market Position in the Broader Automotive Value Chain
- 3.1.2 OEM vs. Replacement Market Dynamics
- 3.1.3 Market Maturity & Development Stage by Region
- 3.2 Enhanced Oil Recovery Market Drivers
- 3.3 Enhanced Oil Recovery Market Restraints & Challenges
- 3.4 Enhanced Oil Recovery Market Opportunities
- 3.5 Porter's Five Forces Analysis
- 3.5.1 Threat of New Entrants
- 3.5.2 Bargaining Power of Suppliers
- 3.5.3 Bargaining Power of Buyers
- 3.5.4 Threat of Substitutes
- 3.5.5 Competitive Rivalry – Intensity Assessment
- 3.6 Enhanced Oil Recovery Value Chain Analysis
- 3.6.1 Upstream – Raw Material/Input Suppliers
- 3.6.1.1 Raw Material/Input 1
- 3.6.1.2 Raw Material/Input 2
- 3.6.1.3 Raw Material/Input 3
- 3.6.2 Midstream – Production/Manufacturing/Service Delivery
- 3.6.2.1 Production/Process Overview
- 3.6.2.2 Key Facility Locations & Capacity by Manufacturer
- 3.6.3 Downstream – Distribution & End Consumer
- 3.6.3.1 Primary Channel – B2B/OEM
- 3.6.3.2 Secondary Channels – Dealer, Retail, Online, Direct
- 3.6.4 Value Chain Profitability Analysis
- 3.6.1 Upstream – Raw Material/Input Suppliers
- 3.7 PESTEL Analysis
- 3.7.1 Political Factors
- 3.7.2 Economic Factors
- 3.7.3 Social Factors
- 3.7.4 Technological Factors
- 3.7.5 Environmental Factors
- 3.7.6 Legal Factors
- 3.8 Enhanced Oil Recovery Supply Chain Analysis
- 3.8.1 Raw Material/Input Supply Risk Assessment
- 3.8.2 Manufacturing Concentration Risk (Geographic Exposure)
- 3.8.3 Trade Disruption Impact Analysis
- 3.9 Regulatory & Policy Landscape
Note: The regulatory and policy landscape section covers regulations based on their applicability to the market, Enhanced Oil Recovery category, geography, and scope of the study. Only regulatory frameworks with a material impact on operations, compliance, trade, sustainability, or market access are analyzed in detail.
Chapter 4. Key Investment Pockets & Opportunity Analysis
- 4.1 Enhanced Oil Recovery Market Attractiveness Analysis
- 4.1.1 By Region – Investment Attractiveness Matrix (Volume × CAGR)
- 4.2 Absolute Revenue Growth Opportunity
- 4.2.1 By Region – Absolute USD Growth Through the forecast period
- 4.3 Incremental Volume Opportunity
- 4.3.1 By Region – Incremental Volume Through the forecast period
- 4.3.2 Segment – Incremental Volume
- 4.4 Emerging Submarket Opportunity Deep Dive (Subject to Applicability)
- 4.5 Emerging Market Opportunity Scorecards
- 4.5.1 United States
- 4.5.2 Europe
- 4.5.3 Asia
- 4.5.4 Middle East & Africa
Note: Emerging Market Opportunity Scorecards will be included based on relevance and strategic importance. Regions listed are indicative and may vary depending on data availability and market dynamics.
Chapter 5. Enhanced Oil Recovery Import-Export Analysis & Trade Flows
- 5.1 Global Trade Overview
- 5.1.1 Global Export Value by Country (2024)
- 5.1.2 Global Export Volume by Country (2024)
- 5.1.3 Global Import Value by Country (2024)
- 5.1.4 Global Import Volume by Country (2024)
- 5.1.5 Net Trade Balance by Country (2024)
- 5.2 Export Analysis – Segment
- 5.2.1 Type 1 (HS Code)
- 5.2.2 Type 2 (HS Code)
- 5.2.3 Type 3 (HS Code)
- 5.2.4 Type 4 (HS Code)
- 5.2.5 Type 5 (HS Code)
- 5.3 Import Analysis – Segment
- 5.3.1 Type 1 (HS Code)
- 5.3.2 Type 2 (HS Code)
- 5.3.3 Type 3 (HS Code)
- 5.3.4 Type 4 (HS Code)
- 5.3.5 Type 5 (HS Code)
- 5.4 Average Unit Trade Prices
- 5.4.1 Average Export Price – Segment & Country
- 5.4.2 Average Import Price – Segment & Source Country
- 5.4.3 Price Trends (2024)
- 5.5 Key Trade Route Analysis
- 5.5.1 Trade Route 1
- 5.5.2 Trade Route 2
- 5.5.3 Trade Route 3
- 5.5.4 Trade Route 4
- 5.5.5 Trade Route 5
- 5.6 Trade Policy Impact Assessment
- 5.6.1 US Anti-Dumping & Section 301 Tariffs
- 5.6.2 EU Customs Union Impact
- 5.6.3 Major Free Trade Agreements
- 5.6.4 USMCA Rules of Origin
Note: Trade policy analysis will be included only where relevant to the Enhanced Oil Recovery market.
Chapter 6. Competitive Landscape & Company Benchmarking
- 6.1 Enhanced Oil Recovery Market Concentration & Structure
- 6.1.1 Herfindahl-Hirschman Index (HHI) – vs. 2024
- 6.1.2 Tier 1, Tier 2 & Tier 3 Market Structure
- 6.1.3 Global, Regional & Local Player Dynamics
- 6.2 Enhanced Oil Recovery Market Share Analysis – 2024
- 6.2.1 Global Revenue Share by Company
- 6.2.2 Global Volume Share by Company
- 6.2.3 Regional Revenue Share
- 6.2.4 Market Share Evolution ( vs. 2024)
- 6.2.5 OEM Segment Share by Company
- 6.2.6 Replacement Segment Share by Company
- 6.3 Production/Delivery Capacity & Facility Analysis
- 6.3.1 Global Installed Capacity
- 6.3.2 Capacity Utilization Rates
- 6.3.3 Production/Output Volume
- 6.3.4 Facility Locations & Capacity Map
- 6.3.5 Planned Capacity Additions
- 6.4 Enhanced Oil Recovery Competitive Benchmarking Matrix
- 6.4.1 Revenue, Volume, CAGR & Profitability Comparison
- 6.4.2 Channel Revenue Mix
- 6.4.3 Geographic Revenue Exposure
- 6.4.4 R&D Intensity
- 6.4.5 Sustainability Maturity
- 6.5 Strategic Developments in Enhanced Oil Recovery (Last 24 Months)
- 6.5.1 Mergers, Acquisitions & Divestments
- 6.5.2 New Enhanced Oil Recovery Launches
- 6.5.3 Facility Expansions
- 6.5.4 Strategic Alliances, Joint Ventures & Partnerships
- 6.5.5 Distribution Expansion & Market Entry
- 6.5.6 Sustainability & ESG Initiatives
- 6.6 Competitive Strategy Mapping
- 6.6.1 Leader, Challenger, Follower & Niche Classification
- 6.6.2 Pricing Strategy Comparison
- 6.6.3 Channel Strategy Matrix
Note: Strategic developments are included based on their materiality and the availability of reliable information.
Chapter 7. Global Enhanced Oil Recovery Market – By Distribution Channel
- 7.1 Segment Overview
- 7.1.1 Volume & Revenue Split by Channel (2024 & )
- 7.1.2 Channel Mix Evolution (the forecast period)
Chapter 8. Regional Market Analysis – Global Overview
- 8.1 Global Regional Overview
- 8.1.1 Regional Volume Share
- 8.1.2 Regional Revenue Share
- 8.1.3 Regional Volume by Region
- 8.1.4 Regional Revenue by Region
- 8.1.5 Regional Forecast Through the forecast period
- 8.2 Cross-Regional Segment Analysis
- 8.2.1 By Distribution Channel
- 8.2.2 By Brand/Price Tier
Chapter 9. North America Enhanced Oil Recovery Market
- 9.1 United States
- 9.2 Canada
- 9.3 Mexico
Chapter 10. Europe Enhanced Oil Recovery Market
- 10.1 Germany
- 10.2 France
- 10.3 Italy
- 10.4 United Kingdom
- 10.5 Spain
- 10.6 Poland
- 10.7 Russia
- 10.8 Netherlands
- 10.9 Belgium
- 10.10 Sweden
- 10.11 Denmark
- 10.12 Norway
- 10.13 Rest of Europe
Chapter 11. Asia Pacific Enhanced Oil Recovery Market
- 11.1 China
- 11.2 India
- 11.3 Japan
- 11.4 South Korea
- 11.5 Thailand
- 11.6 Indonesia
- 11.7 Vietnam
- 11.8 Malaysia
- 11.9 Australia
- 11.10 Rest of Asia Pacific
Chapter 12. Latin America Enhanced Oil Recovery Market
- 12.1 Brazil
- 12.2 Argentina
- 12.3 Colombia
- 12.4 Chile
- 12.5 Rest of Latin America
Chapter 13. Middle East Enhanced Oil Recovery Market
- 13.1 Saudi Arabia
- 13.2 United Arab Emirates
- 13.3 Turkey
- 13.4 Israel
- 13.5 Iran
- 13.6 Rest of the Middle East
Chapter 14. Africa Enhanced Oil Recovery Market
- 14.1 South Africa
- 14.2 Egypt
- 14.3 Nigeria
- 14.4 Morocco
- 14.5 Rest of Africa
Chapter 15. Enhanced Oil Recovery Company Profiles
- 15.1 [Company 01]
- 15.1.1 Company Overview
- 15.1.2 Key Management Personnel
- 15.1.3 Products & Services Portfolio
- 15.1.4 Financial Performance
- 15.1.5 Key Market Focus & Geographic Presence
- 15.1.6 Recent Developments & Strategic Initiatives
Note: The company profile list is preliminary and may change based on research findings, market developments, data availability, and client requirements.
Chapter 16. Appendices
- Appendix A – List of Abbreviations & Acronyms
- Appendix B – Industry Classification Code Reference – Full Series
- Appendix C – Production & Capacity Data Tables
- Appendix D – End-Use & Demand Base Tables
- Appendix E – Consumption & Replacement Rate Assumptions
- Appendix F – ASP Reference Tables
- Appendix G – Manufacturing & Facility Database
- Appendix H – Import-Export Data Tables
- Appendix I – Regulatory Summary Tables
- Appendix J – Primary Research Participant List (Anonymized)
- Appendix K – Primary Research Questionnaire Framework
- Appendix L – Data Sources & Bibliography
- Appendix M – Market Size Divergence & Source Comparison
Chapter 17. Research Methodology
- 17.1 Research Framework & Philosophy
- 17.2 Secondary Research – Sources, Hierarchy & Data Extraction
- 17.3 Data Modeling – Bottom-Up & Top-Down Market Sizing
- 17.4 Primary Research – Stakeholder Framework, LOI & Sample Sizes
- 17.5 Forecast Methodology – Regression, Scenario & Sensitivity Analysis
- 17.6 Quality Control – Four-Layer Validation Framework
- 17.7 Limitations & Standard Assumptions
- 17.8 Disclaimer
