
| REPORT ATTRIBUTE | DETAILS |
|---|---|
| Historical Period | 2019-2022 |
| Base Year | 2023 |
| Forecast Period | 2024-2032 |
| Exploration & Production (E&P) Software Market Size 2024 | USD 14630 million |
| Exploration & Production (E&P) Software Market, CAGR | 11.7% |
| Exploration & Production (E&P) Software Market Size 2032 | USD 35454.36 million |
Market Overview:
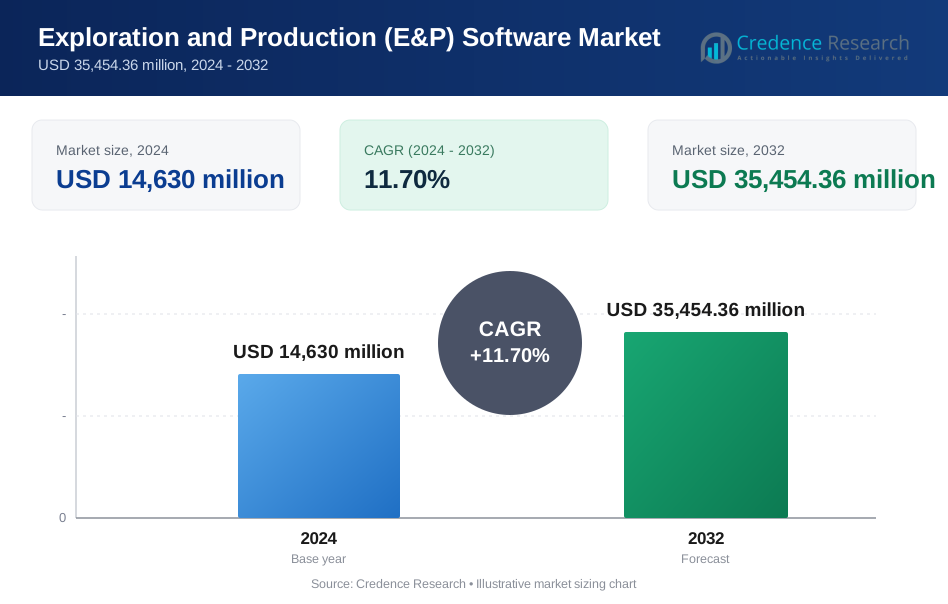
Exploration and Production (E&P) Software Market size was valued at USD 14630 million in 2024 and is anticipated to reach USD 35454.36 million by 2032, at a CAGR of 11.7% during the forecast period (2024-2032).
Key drivers of the E&P software market include the growing demand for energy and the industry's ongoing digital transformation. As oil and gas companies strive for operational excellence and enhanced decision-making capabilities, the adoption of innovative technologies such as AI, machine learning, and data analytics is on the rise. These technologies enable companies to manage complex geological data, optimize drilling operations, and enhance reservoir management, leading to reduced costs and increased production efficiency. The increased reliance on real-time data analytics also helps in predictive maintenance, preventing downtime and improving asset longevity. Additionally, the increasing focus on environmental sustainability and regulatory compliance is further driving the need for more advanced E&P software solutions to ensure efficient resource management and mitigate environmental risks, aligning with the industry's efforts to meet stricter environmental regulations.
Regionally, the North American market dominates the global E&P software landscape, driven by the presence of major oil and gas companies, particularly in the U.S. and Canada. North America’s strong infrastructure and the ongoing shift towards shale gas production further fuel this dominance. The market in the Middle East and Asia-Pacific is also witnessing substantial growth, owing to the rising exploration activities in oil-rich regions such as the Middle East and offshore oil fields in Asia. The increasing demand for energy in these regions, along with investments in offshore drilling projects, is significantly contributing to the adoption of advanced E&P software. Additionally, Europe and Latin America are expected to show steady growth as these regions focus on enhancing their oil and gas production capabilities and improving energy security, while facing the dual challenges of transitioning to renewable energy and managing traditional oil reserves.
Market Insights:
- The Exploration & Production (E&P) software market was valued at USD 14,630 million in 2024 and is expected to reach USD 35,454.36 million by 2032, driven by increasing demand for energy and technological advancements.
- Key drivers include the growing adoption of AI, machine learning, and data analytics, allowing oil and gas companies to optimize operations, manage geological data, and enhance decision-making.
- AI-driven technologies enable companies to predict equipment failures, optimize drilling schedules, and improve production efficiency, significantly reducing operational downtime and costs.
- Environmental sustainability and regulatory compliance are increasing the demand for E&P software solutions that help companies track emissions, manage resources, and meet stringent regulations.
- North America leads the global E&P software market with a 38% share, supported by major oil and gas companies, shale oil production, and rapid digital transformation.
- Europe holds a 25% market share, driven by energy security concerns, the shift toward sustainability, and the increasing adoption of AI and cloud-based solutions in the oil and gas sector.
- Asia-Pacific accounts for 22% of the market share, with rising exploration activities and offshore production in countries like China, India, and Australia fueling the demand for advanced E&P software solutions.
Market Drivers:
Growing Demand for Energy:
One of the primary drivers of the Exploration & Production (E&P) software market is the increasing global demand for energy. As the world’s energy needs rise, oil and gas companies are under constant pressure to enhance production capabilities while maintaining efficiency. E&P software solutions play a pivotal role in helping these companies optimize operations, reduce costs, and improve decision-making processes. The demand for faster and more accurate exploration and production has resulted in an increasing reliance on software tools that help improve resource management, streamline workflows, and automate data analysis. This growing demand for energy, coupled with rising global consumption, is expected to significantly drive the adoption of E&P software solutions over the forecast period.
Technological Advancements in AI and Data Analytics:
The ongoing digital transformation in the oil and gas industry is another crucial driver of market growth. Technologies such as artificial intelligence (AI), machine learning, and data analytics are increasingly being integrated into E&P software to improve operational efficiency. For instance, ExxonMobil leverages AI for predictive maintenance, safety monitoring, and reservoir management, using models to simulate reservoir behavior and achieve more efficient extraction and recovery. AI-powered solutions enable oil and gas companies to predict equipment failures, optimize production schedules, and reduce operational downtime. Additionally, machine learning algorithms help analyze complex geological data, leading to better decision-making and more efficient resource extraction. The integration of AI and data analytics allows companies to optimize drilling operations, forecast reservoir behavior, and enhance oil recovery, all of which directly contribute to cost reduction and increased production efficiency.
Focus on Environmental Sustainability and Regulatory Compliance:
As environmental concerns continue to rise, the oil and gas industry faces mounting pressure to reduce its environmental footprint. E&P software is essential for helping companies manage sustainability and comply with evolving regulatory requirements. For instance, Shell has implemented carbon capture and storage (CCS) technology, such as the Quest project in Canada, to capture and store CO2 emissions from industrial processes. These software solutions enable real-time monitoring of environmental conditions, track emissions, and ensure adherence to environmental standards. The increasing regulatory demands, particularly in terms of emissions reduction and resource management, are pushing companies to adopt advanced software solutions to improve transparency and reduce their environmental impact. As sustainability becomes a more significant focus in the oil and gas industry, the demand for E&P software that helps manage these aspects will continue to grow.
Cost Efficiency and Operational Optimization:
The need for cost-effective and optimized operations has been a major driver of the E&P software market. In a volatile market where oil prices fluctuate, oil and gas companies need to optimize production processes to maintain profitability. E&P software solutions help companies manage their assets efficiently, minimize operational costs, and maximize output. From drilling optimization to real-time monitoring, E&P software helps streamline complex processes, improve decision-making, and enhance overall operational efficiency. With the oil and gas industry constantly seeking ways to reduce costs while improving performance, the demand for E&P software that enables these goals is expected to rise significantly in the coming years.
Market Trends:
Integration of Artificial Intelligence and Machine Learning:
The Exploration & Production (E&P) software market is witnessing a significant shift towards the integration of Artificial Intelligence (AI) and Machine Learning (ML) technologies. These advancements enable oil and gas companies to process vast amounts of seismic, geological, and operational data, leading to enhanced decision-making and operational efficiency. AI-driven analytics facilitate predictive maintenance, optimizing drilling operations, and improving reservoir management. This trend aligns with the industry's broader digital transformation efforts, aiming to reduce costs and improve productivity.
Adoption of Cloud-Based Solutions:
Cloud computing is increasingly becoming the backbone of E&P software solutions. Cloud-based platforms offer scalability, flexibility, and remote accessibility, allowing teams to collaborate effectively across geographies. For instance, during the pandemic, the State of Rhode Island modernized its unemployment insurance contact center by migrating to the cloud, which enabled the state to rapidly scale from handling 75 concurrent calls to 2,000 within just 10 days, demonstrating the agility and real-time processing capabilities that cloud solutions can provide to mission-critical operations. These solutions support real-time data processing and analytics, which are crucial for timely decision-making in exploration and production activities. The shift towards cloud deployment is driven by the need for cost-effective infrastructure and the growing demand for digital tools that enhance operational agility.
Emphasis on Cybersecurity:
With the increasing reliance on digital platforms, cybersecurity has become a paramount concern in the E&P software market. The integration of advanced technologies exposes critical infrastructure to potential cyber threats. For instance, PwC's 2024 Global Digital Trust Insights survey highlights how organizations are prioritizing cybersecurity investments, with many adopting integrated cyber technology suites to safeguard sensitive data. As a result, companies are investing in robust cybersecurity measures to protect sensitive data and ensure the integrity of their operations. This focus on cybersecurity is essential to maintain trust and compliance with regulatory standards in the industry.
Focus on Sustainability and Regulatory Compliance:
Environmental sustainability and adherence to regulatory standards are increasingly influencing the E&P software market. Software solutions are being developed to monitor emissions, optimize resource usage, and ensure compliance with environmental regulations. These tools assist companies in minimizing their environmental footprint while maintaining operational efficiency. The growing emphasis on sustainability reflects the industry's commitment to responsible resource management and its response to global environmental challenges.
Market Challenges Analysis:
High Implementation Costs:
One of the key challenges faced by the Exploration & Production (E&P) software market is the high implementation costs associated with these advanced solutions. While E&P software offers significant benefits in terms of efficiency and optimization, the initial investment for deployment, integration, and training can be substantial. Small and mid-sized companies, in particular, may face budget constraints, making it difficult to adopt these technologies. Additionally, the complexity of integrating new software into existing systems and ensuring compatibility with legacy infrastructure can lead to extended implementation timelines and additional costs. For instance, the National Oilwell Varco (NOV) successfully implemented its Wellbore Technologies software in collaboration with smaller operators, showcasing how tailored training programs can mitigate integration challenges. These financial barriers can limit the adoption of E&P software, especially in emerging markets or regions with lower oil and gas revenues.
Data Management and Integration Challenges:
Another significant challenge in the E&P software market is managing and integrating vast amounts of data from various sources, including seismic data, geological reports, and operational metrics. The oil and gas industry generates enormous volumes of data, which must be accurately processed and analyzed to make informed decisions. However, data integration from multiple platforms and ensuring data consistency across different systems remains a complex task. Inaccurate data, lack of standardization, and siloed information can lead to inefficiencies and errors in decision-making. As companies embrace more advanced E&P software solutions, ensuring smooth data flow and interoperability between different software tools will be critical. Without robust data management strategies in place, companies risk underutilizing the full potential of their E&P software and may struggle to derive actionable insights.
Market Opportunities:
The Exploration & Production (E&P) software market presents significant opportunities driven by the increasing adoption of digital technologies across the oil and gas industry. As companies focus on enhancing operational efficiency and reducing costs, the demand for advanced software solutions that optimize exploration, drilling, and production processes is growing. The integration of Artificial Intelligence (AI), Machine Learning (ML), and big data analytics offers immense potential to improve decision-making and resource management. E&P software solutions equipped with predictive analytics can help companies reduce downtime, optimize production schedules, and enhance reservoir management, driving better returns on investment. Additionally, the rise of cloud-based solutions is offering increased scalability and flexibility for companies, enabling them to manage operations from any location and ensuring greater collaboration between teams across multiple regions.
Another significant opportunity lies in the growing emphasis on environmental sustainability and regulatory compliance. As global environmental standards become stricter, oil and gas companies are increasingly turning to advanced E&P software to monitor emissions, track resource usage, and comply with regulations. These solutions provide real-time insights into environmental impact and operational efficiency, helping companies to minimize their carbon footprint while maximizing productivity. The push for renewable energy sources also presents an opportunity for E&P software providers to expand their offerings, integrating solutions that support energy transition efforts. This shift not only enables companies to improve operational performance but also enhances their ability to meet sustainability goals, which is becoming a key competitive differentiator in the industry.
Market Segmentation Analysis:
By Deployment Type
The Exploration & Production (E&P) software market is segmented by deployment type into cloud-based and on-premises solutions. Cloud-based E&P software is gaining popularity due to its scalability, flexibility, and cost-effectiveness. It allows oil and gas companies to access data and collaborate remotely, improving operational efficiency. On-premises solutions, while more traditional, are preferred by organizations seeking full control over their data security and infrastructure. The increasing trend toward cloud adoption is expected to drive significant growth in this segment, as cloud solutions offer real-time data processing and enhanced collaboration.
By Functionality
E&P software is also segmented by functionality into exploration, production, reservoir management, and drilling. Exploration software helps companies identify potential oil and gas reserves by analyzing geological and seismic data. Production software focuses on optimizing the extraction process, ensuring efficient operations. Reservoir management software assists in monitoring and managing reservoir performance to maximize recovery rates. Drilling software is used to enhance drilling operations by optimizing drilling plans and reducing downtime. The demand for software that integrates multiple functionalities is rising, as it provides a holistic view of operations and improves decision-making.
By Application
The E&P software market is segmented by application into onshore and offshore. Onshore E&P software is used in land-based exploration and production activities, where companies face challenges related to land access and regulatory compliance. Offshore E&P software supports operations in ocean-based environments, where companies need advanced tools to manage the complexities of deepwater drilling and production. Both segments are witnessing growth as the demand for energy resources continues to rise globally.
Segmentations:
By Deployment Type:- Cloud-based
- On-premises
- Exploration
- Production
- Reservoir Management
- Drilling
- Onshore
- Offshore
- Oil and Gas Operators
- Independent E&P Companies
- Service Providers
- North America
- U.S.
- Canada
- Mexico
- Europe
- UK
- France
- Germany
- Italy
- Spain
- Russia
- Belgium
- Netherlands
- Austria
- Sweden
- Poland
- Denmark
- Switzerland
- Rest of Europe
- Asia Pacific
- China
- Japan
- South Korea
- India
- Australia
- Thailand
- Indonesia
- Vietnam
- Malaysia
- Philippines
- Taiwan
- Rest of Asia Pacific
- Latin America
- Brazil
- Argentina
- Peru
- Chile
- Colombia
- Rest of Latin America
- Middle East
- UAE
- KSA
- Israel
- Turkey
- Iran
- Rest of Middle East
- Africa
- Egypt
- Nigeria
- Algeria
- Morocco
- Rest of Africa
Regional Analysis:
North America
North America holds the largest market share in the global Exploration & Production (E&P) software market, accounting for 38%. This dominance is primarily driven by the presence of major oil and gas companies in the United States and Canada, which continue to invest heavily in advanced technologies to optimize exploration and production operations. The region’s extensive infrastructure, coupled with the rapid adoption of digital solutions, enables oil and gas companies to maximize operational efficiency and reduce costs. Additionally, the rise of shale oil production and the growing focus on digital transformation are key factors fueling market growth in North America. The continued development of smart, data-driven solutions further strengthens the region's leadership in the E&P software market.
Europe
Europe holds a market share of 25% in the global E&P software market. The demand for E&P software in Europe is driven by the region's emphasis on energy security and the increasing need to improve oil and gas production efficiency. European oil and gas operators are increasingly adopting cloud-based and AI-integrated E&P software solutions to enhance decision-making, reduce operational costs, and improve compliance with stringent environmental regulations. Additionally, the ongoing shift towards energy transition and sustainability goals further propels the need for innovative software solutions to monitor and optimize resource management, positioning Europe as a significant player in the E&P software market. The region’s commitment to reducing carbon emissions drives further demand for sustainable E&P software solutions.
Asia-Pacific
Asia-Pacific holds a market share of 22% in the E&P software market. The region is witnessing rapid growth due to the rising exploration activities in oil-rich regions such as the Middle East and Southeast Asia. The expanding oil and gas industry in countries like China, India, and Australia is a major driver of the demand for E&P software solutions. The increasing focus on offshore exploration and production, coupled with technological advancements in data analytics and cloud computing, supports the region’s market growth. Furthermore, as regional oil and gas companies embrace digital transformation to enhance operational performance, Asia-Pacific is expected to experience steady growth in the coming years. The drive toward efficiency and cost-effective solutions further supports the rise of E&P software adoption in this region.
Key Player Analysis:
- Halliburton
- AVEVA
- Microsoft
- Baker Hughes
- Oracle
- CGG
- IKON Science
- Aspen Technology
- IBM
- Landmark Graphics
- Society of Exploration Geophysicists
- Infosys
Competitive Analysis:
The Exploration & Production (E&P) software market is highly competitive, with several key players driving innovation and market growth. Leading companies such as Schlumberger, Halliburton, and Baker Hughes dominate the market, offering integrated software solutions that optimize drilling, exploration, and production processes. These companies leverage advanced technologies such as Artificial Intelligence (AI), machine learning, and cloud computing to enhance operational efficiency and reduce costs. New entrants and smaller players are also emerging, focusing on specialized solutions and targeting niche markets within the E&P sector. Strategic partnerships, mergers, and acquisitions are common, allowing companies to expand their product portfolios and increase market reach. Additionally, companies are investing in research and development to create cutting-edge solutions that align with the industry's increasing focus on sustainability and regulatory compliance. The competitive landscape is characterized by continuous technological advancements and a growing emphasis on digital transformation.
Recent Developments:
- In September 2024, Oracle announced major advancements at Oracle CloudWorld 2024, including expanded generative AI capabilities in SaaS apps, new AI-driven analytics, and enhanced cloud performance, scalability, and security, with a focus on AI/ML integration for data intelligence and multi-cloud support.
- In May 2024, CGG launched two new multi-client 3D seismic reimaging projects offshore Côte d’Ivoire (CDI24 Phase I and II), using advanced proprietary imaging technologies and high-performance computing to create contiguous datasets for improved exploration decision-making in the region.
- In December 2023, Ikon Science launched Curate 2024.1, integrating a generative AI chatbot for natural language data searches and major upgrades to applications like Well Viewer and Well Correlation for improved subsurface data management and collaboration.
Market Concentration & Characteristics:
The Exploration & Production (E&P) software market exhibits moderate to high concentration, with a few dominant players holding significant market share. Major companies such as Schlumberger, Halliburton, and Baker Hughes lead the market, offering comprehensive, integrated software solutions that cater to a wide range of exploration, drilling, and production needs. These players differentiate themselves through advanced technologies, including artificial intelligence, machine learning, and cloud-based platforms, which optimize operational efficiency and reduce costs. The market is characterized by rapid technological advancements, with a strong focus on digital transformation, automation, and sustainability. Smaller, specialized players are also emerging, providing niche solutions that address specific needs in the industry. The competitive environment encourages continuous innovation, with companies investing heavily in research and development to enhance product offerings and adapt to the growing demand for efficiency, regulatory compliance, and environmental sustainability in E&P operations.
Report Coverage:
The research report offers an in-depth analysis based on Deployment Type, Functionality, Application, End-User and Region. It details leading market players, providing an overview of their business, product offerings, investments, revenue streams, and key applications. Additionally, the report includes insights into the competitive environment, SWOT analysis, current market trends, as well as the primary drivers and constraints. Furthermore, it discusses various factors that have driven market expansion in recent years. The report also explores market dynamics, regulatory scenarios, and technological advancements that are shaping the industry. It assesses the impact of external factors and global economic changes on market growth. Lastly, it provides strategic recommendations for new entrants and established companies to navigate the complexities of the market.
Future Outlook:
- The E&P software market is expected to experience continued growth as oil and gas companies increasingly adopt digital solutions to enhance operational efficiency.
- AI and machine learning integration will drive further advancements in predictive maintenance, resource optimization, and decision-making capabilities.
- Cloud-based platforms will continue to dominate, offering scalability, flexibility, and cost-effective solutions for managing large volumes of data in real time.
- The focus on environmental sustainability will increase, leading to greater demand for software solutions that help companies reduce their environmental footprint and meet regulatory requirements.
- Integration of advanced data analytics and automation tools will improve subsurface exploration, drilling operations, and reservoir management, leading to better extraction and recovery rates.
- Companies will increasingly prioritize cybersecurity to protect sensitive operational and geological data, ensuring safe and uninterrupted production.
- The market will see increased investments in research and development, with companies creating more sophisticated and customized software solutions.
- The Asia-Pacific region is likely to experience strong growth, driven by expanding oil and gas exploration activities and technological adoption in key markets like China and India.
- As oil prices stabilize, companies will focus on improving cost efficiency, further driving the demand for E&P software that can optimize production and reduce operational costs.
- Strategic mergers, acquisitions, and partnerships will enhance the offerings of key players and expand their market reach.
Request a Free Sample
Fill in your details and we'll send you a free sample report.
- Sample data tables & charts
- Research methodology
Need a Custom Version of This Report?
Tailor the scope, geography, or segments to your exact requirements.
- Custom geography or segment scope
- Direct access to our analyst team
Frequently Asked Questions
What is the market size of the Exploration & Production (E&P) software market?
Who are the major players in the global Exploration & Production (E&P) Software market?
What are the major market drivers of the Exploration & Production (E&P) Software industry?
Which region dominates the E&P software market?
Table of Content
Chapter 1. Report Introduction
- 1.1 Report Description & Purpose
- 1.1.1 Report Title & Market Definition
- 1.1.2 Unique Selling Propositions (USP) & Key Differentiators
- 1.1.3 Value Proposition for Stakeholders
- 1.2 Research Objectives
- 1.2.1 Market Sizing Objectives (Volume & Revenue)
- 1.2.2 Segmentation Objectives
- 1.2.3 Competitive Intelligence Objectives
- 1.2.4 Forecast & Scenario Objectives
- 1.3 Report Scope
- 1.3.1 Exploration and Production (E&P) Software Scope – Types & Subtypes Covered
- 1.3.2 Geographic Scope – Regions & Countries Covered
- 1.3.3 Historical Period, Base Year & Forecast Period (2024; forecast to 2032)
- 1.3.4 Inclusions & Exclusions
- 1.4 HS Code & Classification Framework
- 1.5 Currency, Units & Pricing Basis
- 1.6 Target Stakeholders
- 1.7 Limitations & Assumptions
Chapter 2. Executive Summary
- 2.1 Global Exploration and Production (E&P) Software Market Snapshot
- 2.1.1 Market Size – Historical (2024) & Forecast (2024-2032) (2024: USD 14,630 million → 2032: USD 35,454.36 million)
- 2.1.2 Volume & Revenue – Global Totals
- 2.1.3 Key Market Highlights – Top Five Facts
- 2.2 Exploration and Production (E&P) Software Market Segmentation Snapshot
- 2.2.1 Market Split by Region – 2024 vs. 2032
- 2.3 Competitive Snapshot
- 2.3.1 Top 10 Players by Revenue Share – 2024
- 2.3.2 Top 10 Players by Volume Share – 2024
- 2.3.3 Recent Strategic Developments (18-Month Summary)
- 2.4 Key Investment Highlights & Strategic Conclusions
Chapter 3. Exploration and Production (E&P) Software Market Dynamics & Industry Analysis
- 3.1 Market Overview & Context
- 3.1.1 Exploration and Production (E&P) Software Market Position in the Broader Automotive Value Chain
- 3.1.2 OEM vs. Replacement Market Dynamics
- 3.1.3 Market Maturity & Development Stage by Region
- 3.2 Exploration and Production (E&P) Software Market Drivers
- 3.3 Exploration and Production (E&P) Software Market Restraints & Challenges
- 3.4 Exploration and Production (E&P) Software Market Opportunities
- 3.5 Porter's Five Forces Analysis
- 3.5.1 Threat of New Entrants
- 3.5.2 Bargaining Power of Suppliers
- 3.5.3 Bargaining Power of Buyers
- 3.5.4 Threat of Substitutes
- 3.5.5 Competitive Rivalry – Intensity Assessment
- 3.6 Exploration and Production (E&P) Software Value Chain Analysis
- 3.6.1 Upstream – Raw Material/Input Suppliers
- 3.6.1.1 Raw Material/Input 1
- 3.6.1.2 Raw Material/Input 2
- 3.6.1.3 Raw Material/Input 3
- 3.6.2 Midstream – Production/Manufacturing/Service Delivery
- 3.6.2.1 Production/Process Overview
- 3.6.2.2 Key Facility Locations & Capacity by Manufacturer
- 3.6.3 Downstream – Distribution & End Consumer
- 3.6.3.1 Primary Channel – B2B/OEM
- 3.6.3.2 Secondary Channels – Dealer, Retail, Online, Direct
- 3.6.4 Value Chain Profitability Analysis
- 3.6.1 Upstream – Raw Material/Input Suppliers
- 3.7 PESTEL Analysis
- 3.7.1 Political Factors
- 3.7.2 Economic Factors
- 3.7.3 Social Factors
- 3.7.4 Technological Factors
- 3.7.5 Environmental Factors
- 3.7.6 Legal Factors
- 3.8 Exploration and Production (E&P) Software Supply Chain Analysis
- 3.8.1 Raw Material/Input Supply Risk Assessment
- 3.8.2 Manufacturing Concentration Risk (Geographic Exposure)
- 3.8.3 Trade Disruption Impact Analysis
- 3.9 Regulatory & Policy Landscape
Note: The regulatory and policy landscape section covers regulations based on their applicability to the market, Exploration and Production (E&P) Software category, geography, and scope of the study. Only regulatory frameworks with a material impact on operations, compliance, trade, sustainability, or market access are analyzed in detail.
Chapter 4. Key Investment Pockets & Opportunity Analysis
- 4.1 Exploration and Production (E&P) Software Market Attractiveness Analysis
- 4.1.1 By Region – Investment Attractiveness Matrix (Volume × CAGR)
- 4.2 Absolute Revenue Growth Opportunity
- 4.2.1 By Region – Absolute USD Growth Through 2032
- 4.3 Incremental Volume Opportunity
- 4.3.1 By Region – Incremental Volume Through 2032
- 4.3.2 Segment – Incremental Volume
- 4.4 Emerging Submarket Opportunity Deep Dive (Subject to Applicability)
- 4.5 Emerging Market Opportunity Scorecards
- 4.5.1 United States
- 4.5.2 Europe
- 4.5.3 Asia
- 4.5.4 Middle East & Africa
Note: Emerging Market Opportunity Scorecards will be included based on relevance and strategic importance. Regions listed are indicative and may vary depending on data availability and market dynamics.
Chapter 5. Exploration and Production (E&P) Software Import-Export Analysis & Trade Flows
- 5.1 Global Trade Overview
- 5.1.1 Global Export Value by Country (2024)
- 5.1.2 Global Export Volume by Country (2024)
- 5.1.3 Global Import Value by Country (2024)
- 5.1.4 Global Import Volume by Country (2024)
- 5.1.5 Net Trade Balance by Country (2024)
- 5.2 Export Analysis – Segment
- 5.2.1 Type 1 (HS Code)
- 5.2.2 Type 2 (HS Code)
- 5.2.3 Type 3 (HS Code)
- 5.2.4 Type 4 (HS Code)
- 5.2.5 Type 5 (HS Code)
- 5.3 Import Analysis – Segment
- 5.3.1 Type 1 (HS Code)
- 5.3.2 Type 2 (HS Code)
- 5.3.3 Type 3 (HS Code)
- 5.3.4 Type 4 (HS Code)
- 5.3.5 Type 5 (HS Code)
- 5.4 Average Unit Trade Prices
- 5.4.1 Average Export Price – Segment & Country
- 5.4.2 Average Import Price – Segment & Source Country
- 5.4.3 Price Trends (2024)
- 5.5 Key Trade Route Analysis
- 5.5.1 Trade Route 1
- 5.5.2 Trade Route 2
- 5.5.3 Trade Route 3
- 5.5.4 Trade Route 4
- 5.5.5 Trade Route 5
- 5.6 Trade Policy Impact Assessment
- 5.6.1 US Anti-Dumping & Section 301 Tariffs
- 5.6.2 EU Customs Union Impact
- 5.6.3 Major Free Trade Agreements
- 5.6.4 USMCA Rules of Origin
Note: Trade policy analysis will be included only where relevant to the Exploration and Production (E&P) Software market.
Chapter 6. Competitive Landscape & Company Benchmarking
- 6.1 Exploration and Production (E&P) Software Market Concentration & Structure
- 6.1.1 Herfindahl-Hirschman Index (HHI) – vs. 2024
- 6.1.2 Tier 1, Tier 2 & Tier 3 Market Structure
- 6.1.3 Global, Regional & Local Player Dynamics
- 6.2 Exploration and Production (E&P) Software Market Share Analysis – 2024
- 6.2.1 Global Revenue Share by Company
- 6.2.2 Global Volume Share by Company
- 6.2.3 Regional Revenue Share
- 6.2.4 Market Share Evolution ( vs. 2024)
- 6.2.5 OEM Segment Share by Company
- 6.2.6 Replacement Segment Share by Company
- 6.3 Production/Delivery Capacity & Facility Analysis
- 6.3.1 Global Installed Capacity
- 6.3.2 Capacity Utilization Rates
- 6.3.3 Production/Output Volume
- 6.3.4 Facility Locations & Capacity Map
- 6.3.5 Planned Capacity Additions
- 6.4 Exploration and Production (E&P) Software Competitive Benchmarking Matrix
- 6.4.1 Revenue, Volume, CAGR & Profitability Comparison
- 6.4.2 Channel Revenue Mix
- 6.4.3 Geographic Revenue Exposure
- 6.4.4 R&D Intensity
- 6.4.5 Sustainability Maturity
- 6.5 Strategic Developments in Exploration and Production (E&P) Software (Last 24 Months)
- 6.5.1 Mergers, Acquisitions & Divestments
- 6.5.2 New Exploration and Production (E&P) Software Launches
- 6.5.3 Facility Expansions
- 6.5.4 Strategic Alliances, Joint Ventures & Partnerships
- 6.5.5 Distribution Expansion & Market Entry
- 6.5.6 Sustainability & ESG Initiatives
- 6.6 Competitive Strategy Mapping
- 6.6.1 Leader, Challenger, Follower & Niche Classification
- 6.6.2 Pricing Strategy Comparison
- 6.6.3 Channel Strategy Matrix
Note: Strategic developments are included based on their materiality and the availability of reliable information.
Chapter 7. Global Exploration and Production (E&P) Software Market – By Distribution Channel
- 7.1 Segment Overview
- 7.1.1 Volume & Revenue Split by Channel (2024 & 2032)
- 7.1.2 Channel Mix Evolution (2024-2032)
Chapter 8. Regional Market Analysis – Global Overview
- 8.1 Global Regional Overview
- 8.1.1 Regional Volume Share
- 8.1.2 Regional Revenue Share
- 8.1.3 Regional Volume by Region
- 8.1.4 Regional Revenue by Region
- 8.1.5 Regional Forecast Through 2032
- 8.2 Cross-Regional Segment Analysis
- 8.2.1 By Distribution Channel
- 8.2.2 By Brand/Price Tier
Chapter 9. North America Exploration and Production (E&P) Software Market
- 9.1 United States
- 9.2 Canada
- 9.3 Mexico
Chapter 10. Europe Exploration and Production (E&P) Software Market
- 10.1 Germany
- 10.2 France
- 10.3 Italy
- 10.4 United Kingdom
- 10.5 Spain
- 10.6 Poland
- 10.7 Russia
- 10.8 Netherlands
- 10.9 Belgium
- 10.10 Sweden
- 10.11 Denmark
- 10.12 Norway
- 10.13 Rest of Europe
Chapter 11. Asia Pacific Exploration and Production (E&P) Software Market
- 11.1 China
- 11.2 India
- 11.3 Japan
- 11.4 South Korea
- 11.5 Thailand
- 11.6 Indonesia
- 11.7 Vietnam
- 11.8 Malaysia
- 11.9 Australia
- 11.10 Rest of Asia Pacific
Chapter 12. Latin America Exploration and Production (E&P) Software Market
- 12.1 Brazil
- 12.2 Argentina
- 12.3 Colombia
- 12.4 Chile
- 12.5 Rest of Latin America
Chapter 13. Middle East Exploration and Production (E&P) Software Market
- 13.1 Saudi Arabia
- 13.2 United Arab Emirates
- 13.3 Turkey
- 13.4 Israel
- 13.5 Iran
- 13.6 Rest of the Middle East
Chapter 14. Africa Exploration and Production (E&P) Software Market
- 14.1 South Africa
- 14.2 Egypt
- 14.3 Nigeria
- 14.4 Morocco
- 14.5 Rest of Africa
Chapter 15. Exploration and Production (E&P) Software Company Profiles
- 15.1 [Company 01]
- 15.1.1 Company Overview
- 15.1.2 Key Management Personnel
- 15.1.3 Products & Services Portfolio
- 15.1.4 Financial Performance
- 15.1.5 Key Market Focus & Geographic Presence
- 15.1.6 Recent Developments & Strategic Initiatives
Note: The company profile list is preliminary and may change based on research findings, market developments, data availability, and client requirements.
Chapter 16. Appendices
- Appendix A – List of Abbreviations & Acronyms
- Appendix B – Industry Classification Code Reference – Full Series
- Appendix C – Production & Capacity Data Tables
- Appendix D – End-Use & Demand Base Tables
- Appendix E – Consumption & Replacement Rate Assumptions
- Appendix F – ASP Reference Tables
- Appendix G – Manufacturing & Facility Database
- Appendix H – Import-Export Data Tables
- Appendix I – Regulatory Summary Tables
- Appendix J – Primary Research Participant List (Anonymized)
- Appendix K – Primary Research Questionnaire Framework
- Appendix L – Data Sources & Bibliography
- Appendix M – Market Size Divergence & Source Comparison
Chapter 17. Research Methodology
- 17.1 Research Framework & Philosophy
- 17.2 Secondary Research – Sources, Hierarchy & Data Extraction
- 17.3 Data Modeling – Bottom-Up & Top-Down Market Sizing
- 17.4 Primary Research – Stakeholder Framework, LOI & Sample Sizes
- 17.5 Forecast Methodology – Regression, Scenario & Sensitivity Analysis
- 17.6 Quality Control – Four-Layer Validation Framework
- 17.7 Limitations & Standard Assumptions
- 17.8 Disclaimer
