
Market Overview
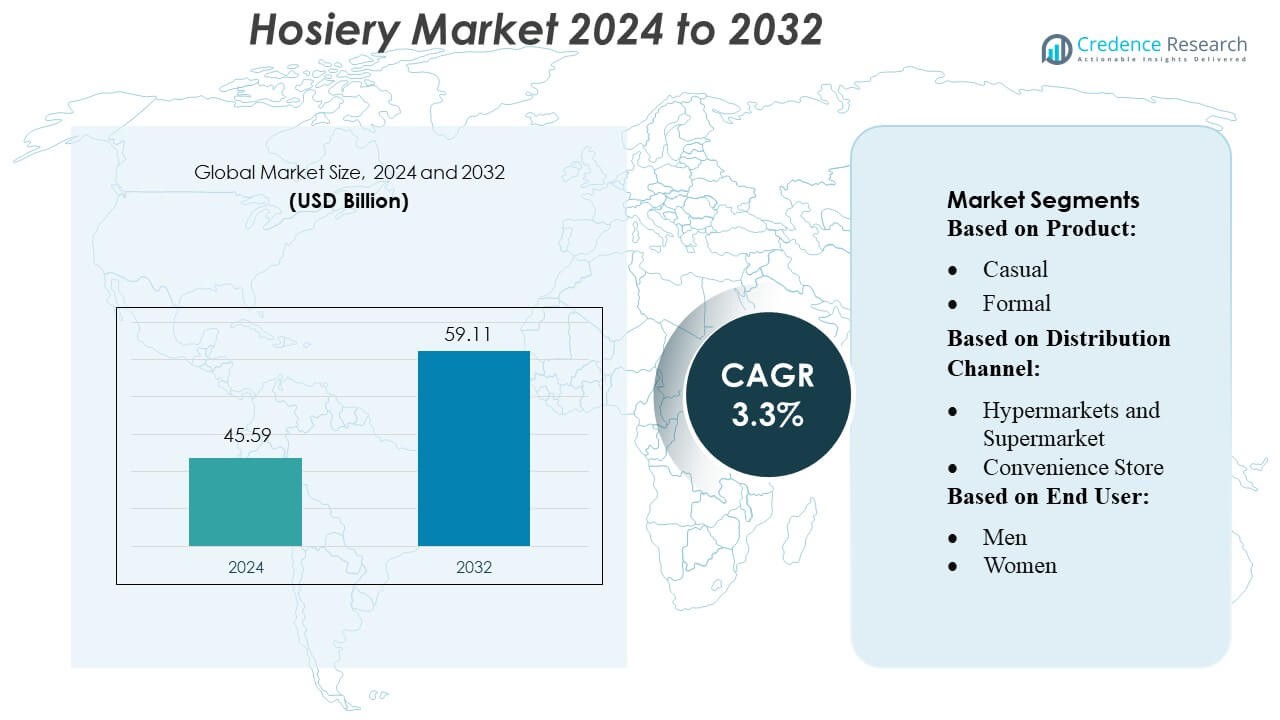
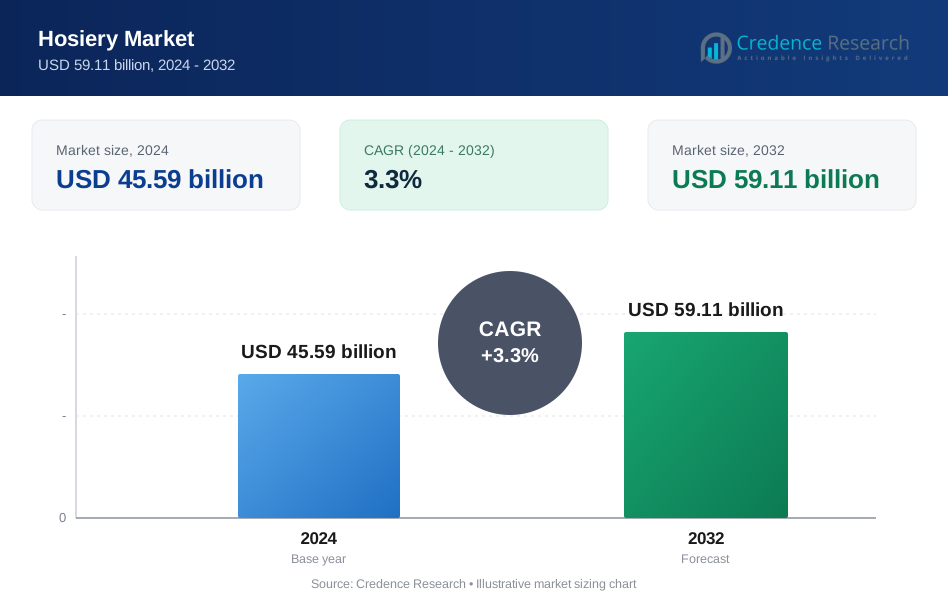
Hosiery Market size was valued USD 45.59 billion in 2024 and is anticipated to reach USD 59.11 billion by 2032, at a CAGR of 3.3% during the forecast period.
| REPORT ATTRIBUTE | DETAILS |
|---|---|
| Historical Period | 2020-2023 |
| Base Year | 2024 |
| Forecast Period | 2025-2032 |
| Hosiery Market Size 2024 | USD 45.59 Billion |
| Hosiery Market, CAGR | 3.3% |
| Hosiery Market Size 2032 | USD 59.11 Billion |
The global hosiery market is shaped by strong competition among major companies such as Nike, Adidas, Puma, Hanesbrands, Under Armour, Skechers, Jockey, and VF Corporation, all of which focus on innovation in materials, performance features, and sustainable manufacturing. These players strengthen market presence through advanced knitting technologies, diversified product portfolios, and expanding e-commerce channels. Asia Pacific emerges as the leading region, holding an estimated 40% share of the global market, driven by its large consumer base, rising fashion awareness, and robust manufacturing capabilities. This regional dominance continues to shape global supply, pricing, and product trends.
Market Insights
- The hosiery market was valued at USD 45.59 billion in 2024 and is projected to reach USD 59.11 billion by 2032, expanding at a CAGR of 3.3%, reflecting steady global demand for comfort-focused and performance-enhanced apparel.
- Growing preference for soft-touch, breathable, and athleisure-inspired hosiery drives market expansion, supported by rising adoption of advanced knitting technologies and sustainable materials.
- Key players intensify competition through product innovation, eco-friendly fibers, and strong e-commerce strategies that enhance global reach and strengthen brand positioning.
- Raw material price fluctuations and supply chain constraints remain major restraints, challenging manufacturers to control costs while maintaining product quality and consistent availability.
- Asia Pacific leads the market with 40% regional share, while casual hosiery holds the largest segment share, supported by high daily-wear consumption and expanding urban populations across emerging economies.
Market Segmentation Analysis:
By Product
Casual hosiery dominates the product segment, holding the largest market share due to its broad usage across daily wear and increased consumer preference for comfort-oriented apparel. Demand strengthens as brands expand soft-touch fabrics and moisture-control materials that appeal to varied age groups. Growth is further supported by the rising trend of athleisure-inspired everyday clothing, prompting manufacturers to introduce versatile designs suitable for both home and outdoor settings. Additionally, frequent wardrobe replacement cycles and higher product accessibility across retail channels reinforce the segment’s leadership.
- For instance, Asics increased its use of recycled polyester to over 50% of total polyester consumption in 2024. The company also reduced water consumption in apparel production by employing “solution dyeing,” cutting water usage by approximately 33% compared to conventional dyeing methods.
By Distribution Channel
Hypermarkets and supermarkets lead the distribution channel segment with the highest market share, driven by their extensive product assortments, competitive pricing, and strong consumer footfall. These outlets benefit from widespread urban penetration and the ability to showcase multiple brands, enabling convenient comparison and bulk purchasing. Retailers also enhance visibility through dedicated hosiery aisles and promotional campaigns that attract value-seeking shoppers. The segment’s dominance is further strengthened by improved supply chain efficiencies and strategic collaborations with major hosiery brands to ensure consistent product availability.
- For instance, Hanesbrands has streamlined its global supply chain so that approximately 75% of the apparel units it sells now come from plants it owns or directly controls globally, enhancing cost-efficiency and reliability.
By End-user
Women constitute the dominant end-user segment, capturing the largest market share due to higher product variety, fashion-driven demand, and frequent consumption across formal, casual, and functional wear categories. The segment expands as brands introduce trend-aligned designs, seamless constructions, and skin-friendly fabrics tailored to diverse style preferences. Increased workforce participation and the rising influence of fashion-led social media trends also accelerate adoption. Furthermore, premiumization within women’s hosiery, including shaping, compression, and performance-enhanced variants, continues to reinforce this segment’s market leadership.
Key Growth Drivers
- Rising Demand for Comfortable and Versatile Apparel The hosiery market grows steadily as consumers prioritize comfort-oriented clothing suitable for daily wear, work, and leisure. Soft-touch fabrics, seamless knitting, and breathable yarns significantly enhance product appeal, particularly among urban and working populations. The shift toward athleisure and hybrid fashion encourages brands to introduce multi-purpose designs that complement both casual and semi-formal wardrobes. This rising inclination toward comfort-driven apparel, supported by rapid lifestyle changes and higher spending on essentials, continues to reinforce strong market expansion across global regions.
- For instance, Drymax socks emerge 17 to 25 times drier than conventional wicking-fiber socks made from polyester, acrylic or wool.Their high-density cushion socks feature approximately 43,200 terry loops per square inch, offering durable cushioning while maintaining a slim profile and consistent fit inside footwear.
- Expansion of E-commerce and Omnichannel Retailing Digital transformation accelerates hosiery market growth as consumers increasingly rely on online platforms for convenience, product variety, and competitive pricing. E-commerce players enhance customer experience through size guides, detailed fabric descriptions, and fast delivery options, strengthening purchase confidence. Meanwhile, brands adopting omnichannel strategies-combining online visibility with offline fitting and fulfillment-capture broader audiences. The integration of analytics, inventory automation, and targeted digital marketing further allows manufacturers to personalize offerings, boost engagement, and drive higher conversion rates across diverse demographic groups.
- For instance, Puma S.E. reported strong performance in its direct-to-consumer channel, which includes both e-commerce and its owned retail stores. By the end of 2024, direct-to-consumer sales reached approximately €2.4 billion globally, growing 21.1% when currency-adjusted.
- Innovation in Fabrics and Performance-enhancing Technologies Material advancements such as moisture-wicking fibers, antibacterial treatments, and stretch-enhanced blends substantially fuel market demand. Manufacturers increasingly invest in high-performance hosiery designed for sports, travel, and long working hours, offering durability and enhanced comfort. Thermal regulation, compression technology, and eco-friendly yarns also gain traction as consumers seek functional yet sustainable products. These innovations improve product longevity and align with the rising preference for technologically upgraded clothing, enabling brands to differentiate offerings and command premium pricing, thereby accelerating overall market growth.
Key Trends & Opportunities
- Growing Popularity of Sustainable and Eco-friendly Hosiery Sustainability emerges as a major opportunity as consumers shift toward environmentally responsible fashion choices. Brands increasingly adopt organic cotton, recycled polyester, and biodegradable yarns to reduce environmental impact while maintaining product performance. This shift creates strong differentiation in competitive markets and encourages retailers to expand green product lines. Certifications, transparent supply chains, and carbon-neutral manufacturing enhance brand credibility. As regulatory pressure strengthens globally, companies that align early with sustainability standards gain long-term advantage and stronger consumer loyalty.
- For instance, Under Armour, Inc. incorporated recycled polyester into its apparel production in 2023, including hosiery products, reducing reliance on virgin fibers. In fiscal year 2023, the company reported that approximately 10% of the polyester used in its apparel and accessories was recycled.
- Customization and Premiumization Gaining Momentum Premium hosiery and customized designs gain traction as consumers seek personalized fit, style, and function. Advances in knitting technology enable precise shaping, adaptive compression, and seamless finishes that elevate comfort and aesthetics. Premium segments-such as fashion tights, luxury socks, and performance-enhanced variants-allow brands to target high-value customers willing to pay more for quality. Custom printed designs and limited-edition collaborations also drive engagement, especially among younger demographics. This movement toward premium, differentiated offerings opens lucrative growth avenues for established and emerging players.
- For instance, Nike sourced significant volumes of recycled polyester for use in apparel and socks as part of its sustainability efforts. In fiscal year 2024 (FY24), two-thirds (approximately 66%) of all polyester used by Nike was recycled, diverting an average of 1 billion plastic bottles annually from landfills and reducing reliance on virgin fibers.
Key Challenges
- Volatility in Raw Material Prices and Supply Chain Pressures Fluctuations in the prices of cotton, synthetic fibers, and specialty yarns create cost pressures for manufacturers, resulting in margin instability. Global disruptions in shipping, packaging, and labor continue to strain production timelines and distribution cycles. Smaller brands feel the impact most as they struggle to secure consistent material supplies at stable prices. To manage volatility, companies must invest in diversified sourcing, strategic inventory planning, and long-term supplier partnerships-yet such measures often raise operating expenses, challenging overall profitability.
- Intense Competitive Landscape and Low Product Differentiation The hosiery market faces stiff competition due to the presence of numerous local, regional, and global players offering similar product categories. Low differentiation in basic hosiery limits brand loyalty and drives price-driven competition. As consumers frequently switch brands based on discounts, retailers exert strong bargaining power, pressuring margins. To overcome this challenge, companies must continuously innovate, strengthen branding, and adopt targeted marketing strategies. However, achieving meaningful differentiation in a commoditized segment remains a persistent obstacle for many manufacturers.
Regional Analysis
North America
North America holds a strong share of the global hosiery market, accounting for around 25–30% due to high demand for premium, comfort-focused products. Consumers favor durable, performance-enhanced hosiery suitable for both casual and workwear. Well-developed retail networks and widespread e-commerce adoption further strengthen regional sales. The presence of leading brands and rising interest in sustainable fabrics also support continued growth across the U.S. and Canada.
Europe
Europe captures approximately 20–25% of the hosiery market, driven by strong fashion awareness and a long-established culture of premium hosiery consumption. Demand is high for stylish tights, stockings, and designer socks, especially in countries such as Italy, Germany, and the UK. Sustainability trends and strict quality standards encourage manufacturers to innovate, while robust retail channels maintain steady product visibility and consumer engagement.
Asia Pacific
Asia Pacific leads the global market with an estimated 35–40% share, supported by its large population, rising incomes, and strong shift toward affordable fashion. Expanding urbanization and rapid e-commerce growth in China, India, and Southeast Asia significantly accelerate hosiery consumption. Local manufacturers offer wide product variety at competitive prices, boosting accessibility and strengthening the region’s position as the industry's fastest-growing market.
Latin America
Latin America holds around 5–8% of the global hosiery market, with growth fueled by younger consumers seeking trendy yet affordable options. Urban expansion in Brazil, Mexico, and Colombia increases retail reach, while value-based brands gain strong traction. Although economic fluctuations occasionally temper demand, the region’s rising fashion interest and improving distribution networks support gradual long-term growth.
Middle East & Africa
Middle East & Africa accounts for roughly 5–7% of global hosiery demand, driven by increasing urbanization and expanding modern retail formats. Gulf countries show higher preference for premium products, while African markets remain cost-sensitive but steadily growing. E-commerce adoption and rising awareness of comfort-focused apparel contribute to market development, although fragmented distribution still poses limitations in several countries.
Market Segmentations:
By Product:
- Casual
- Formal
By Distribution Channel:
- Hypermarkets and Supermarket
- Convenience Store
By End User:
- Men
- Women
By Geography
- North America
- U.S.
- Canada
- Mexico
- Europe
- Germany
- France
- U.K.
- Italy
- Spain
- Rest of Europe
- Asia Pacific
- China
- Japan
- India
- South Korea
- South-east Asia
- Rest of Asia Pacific
- Latin America
- Brazil
- Argentina
- Rest of Latin America
- Middle East & Africa
- GCC Countries
- South Africa
- Rest of the Middle East and Africa
Competitive Landscape
The competitive landscape of the hosiery market features prominent global players such as VF Corporation, Asics Corporation, Hanesbrands Inc., Drymax Technologies Inc., Puma S.E., Under Armour, Inc., Skechers USA, Inc., Adidas A.G., Nike Inc., and Jockey International Inc. The hosiery market remains highly dynamic, shaped by constant innovation, evolving consumer preferences, and increasing emphasis on comfort and performance-driven products. Companies focus on advanced knitting technologies, seamless construction, moisture-wicking materials, and sustainable fiber development to differentiate their offerings in a crowded marketplace. E-commerce expansion continues to reshape competitive strategies, with brands prioritizing digital marketing, personalized recommendations, and faster delivery models. Many manufacturers also strengthen their presence in emerging markets through localized product development and value-driven assortments. Additionally, sustainability initiatives-such as recycled yarns, eco-certified fabrics, and transparent supply chains-are becoming key differentiators, prompting firms to integrate greener practices into their production processes.
Key Player Analysis
- VF Corporation
- Asics Corporation
- Hanesbrands Inc.
- Drymax Technologies Inc.
- Puma S.E.
- Under Armour, Inc.
- Skechers USA, Inc.
- Adidas A.G.
- Nike Inc.
- Jockey International Inc.
Recent Developments
- In August 2025, Spanx has launched two new shapewear collections, SPANXsupersculpt™ Transform and SPANXsupersmooth™ SheerSense, ahead of National Shapewear Day. SPANXsupersculpt Transform and SPANXsupersmooth SheerSense, which offer different levels of sculpting and comfort.
- In December 2024, Swedish Stockings unveiled a collaboration with influencer Camille Charrière to create a collection of fashionable, responsibly produced tights. This partnership leveraged influencer marketing to promote its core message of sustainability and stylish, long-lasting legwear.
- In June 2024, PUMA collaborated with luxury retailer Coperni and launched a collection that included fashion-forward tights and bodysuits. The line fused athletic influences with high fashion and targeted consumers looking for performance and style in their legwear.
- In June 2023, The LYCRA Company launched LYCRA Sheer Sensation technology to address static cling in hosiery, which is caused by static electricity. The technology incorporates an anti-static additive into the fiber during manufacturing, resulting in cling-free, comfortable hosiery that also allows for improved dye absorption to produce vibrant and consistent colors.
Report Coverage
The research report offers an in-depth analysis based on Product, Distribution Channel, End-User and Geography. It details leading market players, providing an overview of their business, product offerings, investments, revenue streams, and key applications. Additionally, the report includes insights into the competitive environment, SWOT analysis, current market trends, as well as the primary drivers and constraints. Furthermore, it discusses various factors that have driven market expansion in recent years. The report also explores market dynamics, regulatory scenarios, and technological advancements that are shaping the industry. It assesses the impact of external factors and global economic changes on market growth. Lastly, it provides strategic recommendations for new entrants and established companies to navigate the complexities of the market.
Future Outlook
- The market will increasingly shift toward sustainable and eco-friendly yarns as consumers prioritize responsible fashion.
- Manufacturers will adopt advanced knitting technologies to improve comfort, durability, and product performance.
- E-commerce will continue to drive sales growth through convenience, wider assortments, and personalized shopping experiences.
- Demand for athleisure-inspired hosiery will rise as consumers seek versatile, everyday comfort wear.
- Premium and functional hosiery, including compression and moisture-management products, will gain broader adoption.
- Brands will expand their presence in emerging markets supported by rising incomes and fashion awareness.
- Customization and limited-edition designs will grow as consumers seek personalized styles.
- Supply chain optimization will become a priority to manage raw material volatility and ensure faster fulfillment.
- Retailers will leverage data analytics to refine inventory planning and targeted marketing strategies.
- Collaborations between fashion labels and hosiery manufacturers will increase product visibility and trend relevance.
Request a Free Sample
Fill in your details and we'll send you a free sample report.
- Sample data tables & charts
- Research methodology
Need a Custom Version of This Report?
Tailor the scope, geography, or segments to your exact requirements.
- Custom geography or segment scope
- Direct access to our analyst team
Frequently Asked Questions
What is the current market size for the Hosiery Market, and what is its projected size in 2032?
At what Compound Annual Growth Rate is the Hosiery Market projected to grow between 2025 and 2032?
Which Hosiery Market segment held the largest share in 2024?
What are the primary factors fueling the growth of the Hosiery Market?
Who are the leading companies in the Hosiery Market?
Which region commanded the largest share of the Hosiery Market in 2024?
Table of Content
Chapter 1. Report Introduction
- 1.1 Report Description & Purpose
- 1.1.1 Report Title & Market Definition
- 1.1.2 Unique Selling Propositions (USP) & Key Differentiators
- 1.1.3 Value Proposition for Stakeholders
- 1.2 Research Objectives
- 1.2.1 Market Sizing Objectives (Volume & Revenue)
- 1.2.2 Segmentation Objectives
- 1.2.3 Competitive Intelligence Objectives
- 1.2.4 Forecast & Scenario Objectives
- 1.3 Report Scope
- 1.3.1 Hosiery Scope – Types & Subtypes Covered
- 1.3.2 Geographic Scope – Regions & Countries Covered
- 1.3.3 Historical Period, Base Year & Forecast Period (2024; forecast to 2032)
- 1.3.4 Inclusions & Exclusions
- 1.4 HS Code & Classification Framework
- 1.5 Currency, Units & Pricing Basis
- 1.6 Target Stakeholders
- 1.7 Limitations & Assumptions
Chapter 2. Executive Summary
- 2.1 Global Hosiery Market Snapshot
- 2.1.1 Market Size – Historical (2024) & Forecast (2024-2032) (2024: USD 45.59 billion → 2032: USD 59.11 billion)
- 2.1.2 Volume & Revenue – Global Totals
- 2.1.3 Key Market Highlights – Top Five Facts
- 2.2 Hosiery Market Segmentation Snapshot
- 2.2.1 Market Split by Region – 2024 vs. 2032
- 2.3 Competitive Snapshot
- 2.3.1 Top 10 Players by Revenue Share – 2024
- 2.3.2 Top 10 Players by Volume Share – 2024
- 2.3.3 Recent Strategic Developments (18-Month Summary)
- 2.4 Key Investment Highlights & Strategic Conclusions
Chapter 3. Hosiery Market Dynamics & Industry Analysis
- 3.1 Market Overview & Context
- 3.1.1 Hosiery Market Position in the Broader Automotive Value Chain
- 3.1.2 OEM vs. Replacement Market Dynamics
- 3.1.3 Market Maturity & Development Stage by Region
- 3.2 Hosiery Market Drivers
- 3.3 Hosiery Market Restraints & Challenges
- 3.4 Hosiery Market Opportunities
- 3.5 Porter's Five Forces Analysis
- 3.5.1 Threat of New Entrants
- 3.5.2 Bargaining Power of Suppliers
- 3.5.3 Bargaining Power of Buyers
- 3.5.4 Threat of Substitutes
- 3.5.5 Competitive Rivalry – Intensity Assessment
- 3.6 Hosiery Value Chain Analysis
- 3.6.1 Upstream – Raw Material/Input Suppliers
- 3.6.1.1 Raw Material/Input 1
- 3.6.1.2 Raw Material/Input 2
- 3.6.1.3 Raw Material/Input 3
- 3.6.2 Midstream – Production/Manufacturing/Service Delivery
- 3.6.2.1 Production/Process Overview
- 3.6.2.2 Key Facility Locations & Capacity by Manufacturer
- 3.6.3 Downstream – Distribution & End Consumer
- 3.6.3.1 Primary Channel – B2B/OEM
- 3.6.3.2 Secondary Channels – Dealer, Retail, Online, Direct
- 3.6.4 Value Chain Profitability Analysis
- 3.6.1 Upstream – Raw Material/Input Suppliers
- 3.7 PESTEL Analysis
- 3.7.1 Political Factors
- 3.7.2 Economic Factors
- 3.7.3 Social Factors
- 3.7.4 Technological Factors
- 3.7.5 Environmental Factors
- 3.7.6 Legal Factors
- 3.8 Hosiery Supply Chain Analysis
- 3.8.1 Raw Material/Input Supply Risk Assessment
- 3.8.2 Manufacturing Concentration Risk (Geographic Exposure)
- 3.8.3 Trade Disruption Impact Analysis
- 3.9 Regulatory & Policy Landscape
Note: The regulatory and policy landscape section covers regulations based on their applicability to the market, Hosiery category, geography, and scope of the study. Only regulatory frameworks with a material impact on operations, compliance, trade, sustainability, or market access are analyzed in detail.
Chapter 4. Key Investment Pockets & Opportunity Analysis
- 4.1 Hosiery Market Attractiveness Analysis
- 4.1.1 By Region – Investment Attractiveness Matrix (Volume × CAGR)
- 4.2 Absolute Revenue Growth Opportunity
- 4.2.1 By Region – Absolute USD Growth Through 2032
- 4.3 Incremental Volume Opportunity
- 4.3.1 By Region – Incremental Volume Through 2032
- 4.3.2 Segment – Incremental Volume
- 4.4 Emerging Submarket Opportunity Deep Dive (Subject to Applicability)
- 4.5 Emerging Market Opportunity Scorecards
- 4.5.1 United States
- 4.5.2 Europe
- 4.5.3 Asia
- 4.5.4 Middle East & Africa
Note: Emerging Market Opportunity Scorecards will be included based on relevance and strategic importance. Regions listed are indicative and may vary depending on data availability and market dynamics.
Chapter 5. Hosiery Import-Export Analysis & Trade Flows
- 5.1 Global Trade Overview
- 5.1.1 Global Export Value by Country (2024)
- 5.1.2 Global Export Volume by Country (2024)
- 5.1.3 Global Import Value by Country (2024)
- 5.1.4 Global Import Volume by Country (2024)
- 5.1.5 Net Trade Balance by Country (2024)
- 5.2 Export Analysis – Segment
- 5.2.1 Type 1 (HS Code)
- 5.2.2 Type 2 (HS Code)
- 5.2.3 Type 3 (HS Code)
- 5.2.4 Type 4 (HS Code)
- 5.2.5 Type 5 (HS Code)
- 5.3 Import Analysis – Segment
- 5.3.1 Type 1 (HS Code)
- 5.3.2 Type 2 (HS Code)
- 5.3.3 Type 3 (HS Code)
- 5.3.4 Type 4 (HS Code)
- 5.3.5 Type 5 (HS Code)
- 5.4 Average Unit Trade Prices
- 5.4.1 Average Export Price – Segment & Country
- 5.4.2 Average Import Price – Segment & Source Country
- 5.4.3 Price Trends (2024)
- 5.5 Key Trade Route Analysis
- 5.5.1 Trade Route 1
- 5.5.2 Trade Route 2
- 5.5.3 Trade Route 3
- 5.5.4 Trade Route 4
- 5.5.5 Trade Route 5
- 5.6 Trade Policy Impact Assessment
- 5.6.1 US Anti-Dumping & Section 301 Tariffs
- 5.6.2 EU Customs Union Impact
- 5.6.3 Major Free Trade Agreements
- 5.6.4 USMCA Rules of Origin
Note: Trade policy analysis will be included only where relevant to the Hosiery market.
Chapter 6. Competitive Landscape & Company Benchmarking
- 6.1 Hosiery Market Concentration & Structure
- 6.1.1 Herfindahl-Hirschman Index (HHI) – vs. 2024
- 6.1.2 Tier 1, Tier 2 & Tier 3 Market Structure
- 6.1.3 Global, Regional & Local Player Dynamics
- 6.2 Hosiery Market Share Analysis – 2024
- 6.2.1 Global Revenue Share by Company
- 6.2.2 Global Volume Share by Company
- 6.2.3 Regional Revenue Share
- 6.2.4 Market Share Evolution ( vs. 2024)
- 6.2.5 OEM Segment Share by Company
- 6.2.6 Replacement Segment Share by Company
- 6.3 Production/Delivery Capacity & Facility Analysis
- 6.3.1 Global Installed Capacity
- 6.3.2 Capacity Utilization Rates
- 6.3.3 Production/Output Volume
- 6.3.4 Facility Locations & Capacity Map
- 6.3.5 Planned Capacity Additions
- 6.4 Hosiery Competitive Benchmarking Matrix
- 6.4.1 Revenue, Volume, CAGR & Profitability Comparison
- 6.4.2 Channel Revenue Mix
- 6.4.3 Geographic Revenue Exposure
- 6.4.4 R&D Intensity
- 6.4.5 Sustainability Maturity
- 6.5 Strategic Developments in Hosiery (Last 24 Months)
- 6.5.1 Mergers, Acquisitions & Divestments
- 6.5.2 New Hosiery Launches
- 6.5.3 Facility Expansions
- 6.5.4 Strategic Alliances, Joint Ventures & Partnerships
- 6.5.5 Distribution Expansion & Market Entry
- 6.5.6 Sustainability & ESG Initiatives
- 6.6 Competitive Strategy Mapping
- 6.6.1 Leader, Challenger, Follower & Niche Classification
- 6.6.2 Pricing Strategy Comparison
- 6.6.3 Channel Strategy Matrix
Note: Strategic developments are included based on their materiality and the availability of reliable information.
Chapter 7. Global Hosiery Market – By Distribution Channel
- 7.1 Segment Overview
- 7.1.1 Volume & Revenue Split by Channel (2024 & 2032)
- 7.1.2 Channel Mix Evolution (2024-2032)
Chapter 8. Regional Market Analysis – Global Overview
- 8.1 Global Regional Overview
- 8.1.1 Regional Volume Share
- 8.1.2 Regional Revenue Share
- 8.1.3 Regional Volume by Region
- 8.1.4 Regional Revenue by Region
- 8.1.5 Regional Forecast Through 2032
- 8.2 Cross-Regional Segment Analysis
- 8.2.1 By Distribution Channel
- 8.2.2 By Brand/Price Tier
Chapter 9. North America Hosiery Market
- 9.1 United States
- 9.2 Canada
- 9.3 Mexico
Chapter 10. Europe Hosiery Market
- 10.1 Germany
- 10.2 France
- 10.3 Italy
- 10.4 United Kingdom
- 10.5 Spain
- 10.6 Poland
- 10.7 Russia
- 10.8 Netherlands
- 10.9 Belgium
- 10.10 Sweden
- 10.11 Denmark
- 10.12 Norway
- 10.13 Rest of Europe
Chapter 11. Asia Pacific Hosiery Market
- 11.1 China
- 11.2 India
- 11.3 Japan
- 11.4 South Korea
- 11.5 Thailand
- 11.6 Indonesia
- 11.7 Vietnam
- 11.8 Malaysia
- 11.9 Australia
- 11.10 Rest of Asia Pacific
Chapter 12. Latin America Hosiery Market
- 12.1 Brazil
- 12.2 Argentina
- 12.3 Colombia
- 12.4 Chile
- 12.5 Rest of Latin America
Chapter 13. Middle East Hosiery Market
- 13.1 Saudi Arabia
- 13.2 United Arab Emirates
- 13.3 Turkey
- 13.4 Israel
- 13.5 Iran
- 13.6 Rest of the Middle East
Chapter 14. Africa Hosiery Market
- 14.1 South Africa
- 14.2 Egypt
- 14.3 Nigeria
- 14.4 Morocco
- 14.5 Rest of Africa
Chapter 15. Hosiery Company Profiles
- 15.1 [Company 01]
- 15.1.1 Company Overview
- 15.1.2 Key Management Personnel
- 15.1.3 Products & Services Portfolio
- 15.1.4 Financial Performance
- 15.1.5 Key Market Focus & Geographic Presence
- 15.1.6 Recent Developments & Strategic Initiatives
Note: The company profile list is preliminary and may change based on research findings, market developments, data availability, and client requirements.
Chapter 16. Appendices
- Appendix A – List of Abbreviations & Acronyms
- Appendix B – Industry Classification Code Reference – Full Series
- Appendix C – Production & Capacity Data Tables
- Appendix D – End-Use & Demand Base Tables
- Appendix E – Consumption & Replacement Rate Assumptions
- Appendix F – ASP Reference Tables
- Appendix G – Manufacturing & Facility Database
- Appendix H – Import-Export Data Tables
- Appendix I – Regulatory Summary Tables
- Appendix J – Primary Research Participant List (Anonymized)
- Appendix K – Primary Research Questionnaire Framework
- Appendix L – Data Sources & Bibliography
- Appendix M – Market Size Divergence & Source Comparison
Chapter 17. Research Methodology
- 17.1 Research Framework & Philosophy
- 17.2 Secondary Research – Sources, Hierarchy & Data Extraction
- 17.3 Data Modeling – Bottom-Up & Top-Down Market Sizing
- 17.4 Primary Research – Stakeholder Framework, LOI & Sample Sizes
- 17.5 Forecast Methodology – Regression, Scenario & Sensitivity Analysis
- 17.6 Quality Control – Four-Layer Validation Framework
- 17.7 Limitations & Standard Assumptions
- 17.8 Disclaimer
