
Market Overview:
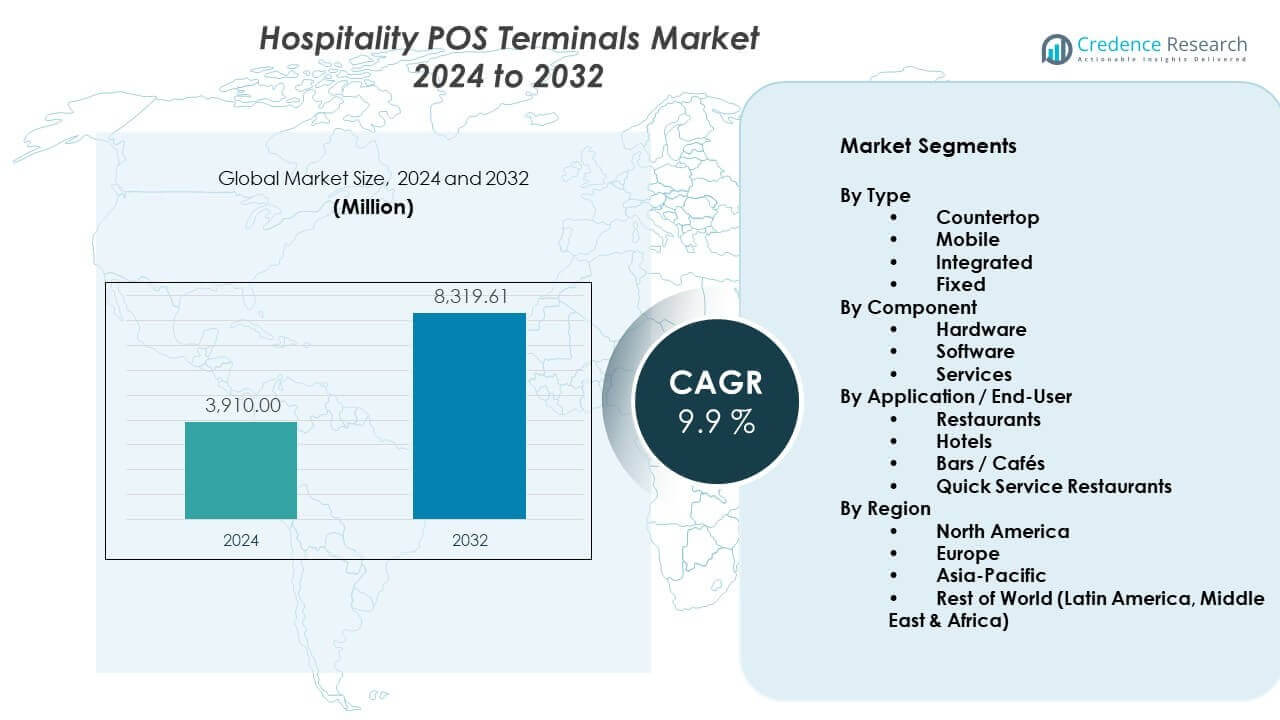
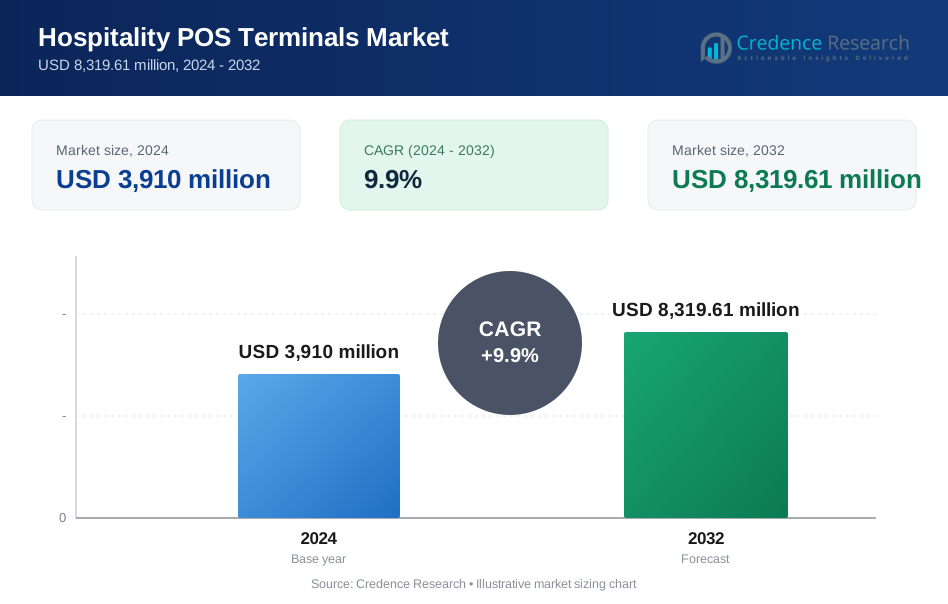
The Hospitality POS Terminals Market was valued at USD 3,910 million in 2024. The market is projected to reach USD 8,319.61 million by 2032. This growth reflects a compound annual growth rate of 9.9% during 2024 to 2032. Demand rises as hospitality venues digitize billing, payments, and operations to improve speed, accuracy, and customer experience.
| REPORT ATTRIBUTE | DETAILS |
|---|---|
| Historical Period | 2020-2023 |
| Base Year | 2024 |
| Forecast Period | 2025-2032 |
| Hospitality POS Terminals Market Size 2024 | USD 3,910 Million |
| Hospitality POS Terminals Market, CAGR | 9.9% |
| Hospitality POS Terminals Market Size 2032 | USD 8,319.61 Million |
Hospitality operators adopt POS terminals to speed service and cut errors. Restaurants need faster billing during peak hours. Cloud software improves menu control and pricing accuracy. Mobile terminals support tableside orders and payments. Contactless payments raise checkout speed and hygiene confidence. Integration with inventory tools reduces stock losses. Analytics help managers track sales patterns daily. Labor shortages push demand for automation features. Compliance needs drive secure transaction processing. Vendors deliver scalable systems for single sites and chains. Training support and uptime guarantees influence purchasing decisions strongly across varied hospitality formats.
North America leads adoption due to high card usage and mature restaurant chains. The United States drives upgrades across quick service and hotels. Europe follows with strong compliance focus and digital payments. The United Kingdom and Germany show steady replacement demand. Asia Pacific emerges fast from urban dining growth. China and India expand outlets rapidly. Southeast Asia adopts mobile-first payments. Latin America grows with franchise expansion. Middle East invests through tourism projects. Africa remains early stage but shows pilots. Local regulations and infrastructure shape rollout pace by country and city.
Market Insights:
- The market was valued at USD 131 million in 2024 and is projected to reach USD 200.47 million by 2032, growing at a CAGR of 5.44% during the period.
- North America leads with about 42% share due to strong pharma R&D, followed by Europe at 30% driven by academic research, and Asia Pacific at 20% supported by biotech expansion.
- Asia Pacific is the fastest-growing region with around 20% share, driven by rising biotech investment, CRO expansion, and government research funding.
- By type, cell-based humanized mouse models account for nearly 55% share due to flexibility in immune studies, while genetic humanized mouse models hold about 45%.
- By end-user, pharmaceutical and biotechnology companies hold close to 50% share, while contract research organizations account for about 30% due to outsourcing growth.
Market Drivers:
Rising Demand For Faster And Error-Free Transaction Processing Across Hospitality Venues
The Hospitality POS Terminals Market gains momentum from the need for faster billing accuracy. Restaurants manage heavy order volumes during peak dining hours daily. POS terminals reduce manual errors during order entry and payment. Digital receipts improve transparency and customer trust levels. Integrated billing speeds up checkout across service counters. Operators depend on stable systems to manage rush periods smoothly. Faster service improves table turnover rates consistently. Efficiency directly supports daily revenue growth for hospitality venues.
- For instance, Oracle’s MICROS Simphony POS processes over 6.3 billion transactions annually with secure payment handling.
Growing Adoption Of Cashless And Contactless Payment Methods In Foodservice Operations
Hospitality operators adapt to rising card and wallet usage globally. POS terminals support multiple digital payment options in one interface. Contactless payments improve hygiene confidence among guests. Urban consumers expect fast and flexible payment experiences. Tourism growth raises demand for global payment acceptance. POS systems handle foreign cards and currencies effectively. Secure transactions build customer confidence in digital payments. Reduced cash handling lowers operational risks for outlets.
- For instance, Oracle MICROS Tablet POS supports tap-to-pay contactless EMV transactions on mobile restaurant devices.
Need For Centralized Control And Real-Time Business Visibility For Multi-Outlet Operators
Chain restaurants seek centralized sales and operations control. POS platforms deliver real-time revenue tracking across locations. Managers monitor peak-hour performance from dashboards. Inventory visibility helps prevent stock shortages. Sales data supports better menu and pricing decisions. POS analytics highlight high-performing items quickly. Centralized systems reduce dependency on manual reports. Operational clarity improves strategic planning for expansion.
Rising Labor Costs And Staff Shortages Across Hospitality Service Models
Hospitality businesses face increasing labor expenses worldwide. POS terminals reduce reliance on manual billing staff. Self-service and mobile ordering improve service flow. Staff focus more on customer interaction and food quality. Automation reduces training time for new employees. POS workflows standardize operations across shifts. Labor efficiency supports profit stability under cost pressure. Technology investment offsets workforce constraints effectively.
Market Trends:
Expansion Of Cloud-Based POS Platforms Across Restaurants And Hotels
Cloud POS systems gain preference due to flexible deployment. Operators access sales data from any location. Updates occur without complex on-site maintenance. Cloud storage improves data security and recovery. Subscription models reduce upfront capital spending. Scalability supports seasonal demand changes easily. Remote monitoring helps multi-site management teams. Cloud adoption reshapes POS deployment strategies steadily.
- For instance, Oracle Simphony offers cloud-based operations across 180+ countries with secure remote data access.
Increasing Use Of Mobile And Handheld POS Devices For Tableside Service
Mobile POS terminals support faster tableside ordering. Servers place orders directly from dining areas. Order accuracy improves through direct kitchen transmission. Mobile payments reduce wait times for guests. Compact devices suit cafés and food trucks. Wireless connectivity supports flexible service layouts. Mobility enhances customer engagement during service. Handheld devices redefine traditional service workflows.
- For instance, Oracle MICROS Tablet POS enables staff to take orders and accept EMV payments at tables.
Integration Of POS Systems With Third-Party Delivery And Ordering Platforms
Restaurants connect POS systems with delivery apps. Unified order management prevents duplicate entries. POS integration improves order tracking accuracy. Operators manage dine-in and delivery channels together. Centralized menus reduce pricing inconsistencies. Integration supports faster order fulfillment cycles. Data synchronization improves reporting accuracy. Digital ecosystems expand POS functional scope.
Growing Focus On Data Analytics For Menu Optimization And Demand Forecasting
POS platforms provide detailed sales analytics. Operators analyze item performance by time and location. Data supports menu redesign and pricing decisions. Demand forecasting improves inventory planning accuracy. Seasonal trends become easier to identify. Analytics guide promotional campaign planning. Insights improve profit margins over time. Data-driven decisions gain importance across hospitality.
Market Challenges Analysis:
High Initial Investment And Ongoing Maintenance Costs For Advanced POS Systems
The Hospitality POS Terminals Market faces cost-related adoption barriers. Small restaurants struggle with upfront hardware expenses. Software licensing adds recurring financial commitments. Advanced features increase total ownership cost. Maintenance contracts raise long-term operating expenses. Hardware upgrades require periodic replacement cycles. Budget constraints slow adoption among independent outlets. Cost sensitivity limits penetration in price-driven markets.
Complex System Integration And Data Security Concerns Across Hospitality Networks
POS integration with existing systems poses challenges. Legacy infrastructure complicates system compatibility. Data migration risks disrupt daily operations. Cybersecurity threats raise concern among operators. Payment data protection requires strict compliance standards. Limited IT expertise affects troubleshooting speed. Downtime impacts customer service quality directly. Security concerns influence vendor selection decisions.
Market Opportunities:
Rising Hospitality Infrastructure Development Across Emerging Economies
New hotels and restaurants open across developing regions. Urbanization drives growth in organized foodservice formats. POS terminals become standard for new outlets. Government tourism initiatives boost hospitality investments. Modern infrastructure favors digital billing systems. New venues adopt POS at launch stage. Growth markets present long-term volume potential. Expansion supports steady demand for terminals.
Customization And Industry-Specific POS Solutions For Diverse Hospitality Formats
Vendors offer tailored POS systems for different venues. Hotels need room service and billing integration. Cafés prefer fast and compact interfaces. Fine dining requires detailed menu customization. Custom solutions improve operational fit. Localization supports language and tax requirements. Flexible design attracts niche hospitality segments. Customization creates competitive differentiation for vendors.
Market Segmentation Analysis:
By Type
The Hospitality POS Terminals Market shows varied demand across terminal types. Countertop terminals remain common in full-service restaurants and hotels due to stability and ease of use. Mobile terminals gain strong traction in cafés and casual dining formats. These devices support tableside ordering and faster payments. Integrated terminals appeal to multi-outlet operators that seek unified hardware and software control. Fixed terminals serve high-volume counters with structured workflows. Each type addresses distinct service speed and layout needs. Selection depends on outlet size and service style.
- For instance, stationary POS terminals like Oracle Simphony workstations provide stable front-of-house service with integrated billing and analytics.
By Component
Hardware forms the base of POS deployment across hospitality venues. Touchscreens, printers, and card readers support daily transaction needs. Software drives value through billing, analytics, and menu control. Cloud-based platforms improve data access and system updates. Services support installation, training, and system maintenance. Service quality influences long-term system performance. Operators prefer vendors with reliable support coverage. Component balance shapes total cost and operational efficiency.
- For instance, Oracle Simphony POS hardware integrates touchscreen, card reader, and peripherals for daily transactions.
By Application / End-User
Restaurants lead adoption due to high transaction volumes and peak-hour demand. Hotels rely on POS systems for dining and room service billing. Bars and cafés use compact systems that support fast turnover. Quick service restaurants depend on speed and order accuracy. Each end-user segment values different feature sets. Menu complexity and payment speed guide configuration choices. POS flexibility supports varied hospitality formats.
Segmentation:
By Type
- Countertop
- Mobile
- Integrated
- Fixed
By Component
- Hardware
- Software
- Services
By Application / End-User
- Restaurants
- Hotels
- Bars / Cafés
- Quick Service Restaurants
By Region
- North America
- The U.S.
- Canada
- Mexico
- Europe
- Germany
- France
- The U.K.
- Italy
- Spain
- Rest of Europe
- Asia Pacific
- China
- Japan
- India
- South Korea
- South-east Asia
- Rest of Asia Pacific
- Latin America
- Brazil
- Argentina
- Rest of Latin America
- Middle East & Africa
- GCC Countries
- South Africa
- Rest of Middle East and Africa
Regional Analysis:
Asia-Pacific Leads Due To Outlet Expansion And Digital Payment Scale
The Hospitality POS Terminals Market sees Asia-Pacific as the lead region with 37% share. China and India drive demand through rapid outlet growth and fast payment digitization. Japan and South Korea add steady upgrades across branded chains. Vendors win business with mobile-first terminals that suit dense urban formats. Cloud POS adoption rises as operators seek multi-site control. Strong QR and wallet usage supports frequent terminal refresh cycles. Regional growth stays broad due to new store openings and tech-led service models.
North America And Europe Hold Strong Share Through Upgrades And Compliance Needs
The Hospitality POS Terminals Market records 28% share in North America and 23% share in Europe. The United States and Canada lead due to high card usage and strict security needs. Large restaurant groups replace legacy systems to improve uptime and data visibility. Europe sees steady demand from the UK, Germany, and France. Tax rules and payment standards push modern terminal adoption. Operators prefer certified devices with stable service support. Replacement cycles keep both regions resilient despite market maturity.
Latin America And Middle East & Africa Show Emerging Adoption Patterns
The Hospitality POS Terminals Market holds 8% share in Latin America and 4% share in the Middle East & Africa. Brazil and Mexico lead Latin America through franchise growth and formal retail shift. Payment acceptance spreads across quick service outlets and cafés. Gulf countries drive MEA demand through tourism projects and hotel investments. South Africa shows gradual upgrades in major cities. Infrastructure gaps and high device costs slow wider rollout. Local partnerships help vendors scale service coverage and deployments.
Key Player Analysis:
- Ingenico
- NCR Corporation
- PAX Technology
- VeriFone
- First Data
- MICROS Systems
Competitive Analysis:
The Hospitality POS Terminals Market features strong competition among global payment and technology providers. Leading players focus on reliable hardware, secure payment processing, and scalable software platforms. Vendors compete through system stability, service coverage, and integration capabilities. Product portfolios target restaurants, hotels, and quick service formats. Companies invest in cloud readiness and mobile compatibility. Partnerships with payment networks strengthen market reach. Regional service networks influence buyer trust. Competitive intensity remains high due to frequent technology upgrades and replacement demand.
Recent Developments:
- In December 2025, Ingenico entered a strategic partnership with Talus to bring a hardware-free SoftPOS solution to the North American market. This solution enables merchants to accept secure contactless payments using only NFC-enabled mobile devices, with instant activation and compliance to PCI CPoC and Tap-to-Phone frameworks. The collaboration integrates Ingenico's payment technology with Talus' platform to deliver a modern feature-rich payment experience with inventory management and real-time insights.
- In September 2025, Ingenico announced the global rollout of Ingenico Manage 360, a next-generation cloud-based device management solution that sets a new standard for payment acceptance technology management. This device-agnostic solution enables real-time connectivity with terminal estates, offering remote diagnostics, deployment of updates, rapid service activation, and efficient inventory tracking across banks, acquirers, and merchants worldwide.
- In July 2025, VeriFone partnered with PagBrasil to launch an exclusive International Pix payment solution for Brazilian shoppers in the United States. This first-of-its-kind solution allows Brazilian consumers to pay in Brazilian Reais using Pix while shopping in the U.S., enabling real-time currency conversion without foreign exchange conversion fees. The partnership gives VeriFone sole rights to offer PagBrasil's International Pix payments in the U.S., allowing merchants to activate the capability through VeriFone's hardware and gateway-agnostic API without needing system upgrades.
- In May 2025, VeriFone announced a strategic partnership with Stripe to run Stripe services natively on VeriFone payment devices-from handheld readers to multilane systems. This partnership provides Stripe customers with greater flexibility and choice for in-person payments, enabling support for various customer interaction points including self-service checkouts, tableside ordering, and traditional point-of-sale interactions. The collaboration initially launched in the United States with plans for global expansion.
Report Coverage:
The research report offers an in-depth analysis based on type, component, application, and region. It details leading market players, providing an overview of their business, product offerings, investments, revenue streams, and key applications. Additionally, the report includes insights into the competitive environment, SWOT analysis, current market trends, as well as the primary drivers and constraints. Furthermore, it discusses various factors that have driven market expansion in recent years. The report also explores market dynamics, regulatory scenarios, and technological advancements that are shaping the industry. It assesses the impact of external factors and global economic changes on market growth. Lastly, it provides strategic recommendations for new entrants and established companies to navigate the complexities of the market.
Future Outlook:
- Immuno-oncology research will continue to drive sustained demand across drug pipelines.
- Custom humanized mouse models will gain preference for targeted disease studies.
- Contract research organizations will expand capacity to meet outsourced study needs.
- Infectious disease research will increase adoption for immune response evaluation.
- Genetic humanized mouse models will see wider use for long-term studies.
- Cell-based humanized models will support short-duration immune assessment programs.
- Asia Pacific will record faster adoption due to growing biotech investment.
- Academic collaborations will accelerate innovation and model refinement.
- Reproducibility and validation standards will influence purchasing decisions.
- Regulatory scrutiny will favor suppliers with robust data and model consistency.
Request a Free Sample
Fill in your details and we'll send you a free sample report.
- Sample data tables & charts
- Research methodology
Need a Custom Version of This Report?
Tailor the scope, geography, or segments to your exact requirements.
- Custom geography or segment scope
- Direct access to our analyst team
Frequently Asked Questions
What is the current market size for Hospitality POS Terminals Market, and what is its projected size in 2032?
At what Compound Annual Growth Rate is the Hospitality POS Terminals Market projected to grow between 2025 and 2032?
Which Hospitality POS Terminals Market segment held the largest share in 2024?
What are the primary factors fueling the growth of the Hospitality POS Terminals Market?
Who are the leading companies in the Hospitality POS Terminals Market?
Which region commanded the largest share of the Hospitality POS Terminals Market in 2024?
Table of Content
Chapter 1. Report Introduction
- 1.1 Report Description & Purpose
- 1.1.1 Report Title & Market Definition
- 1.1.2 Unique Selling Propositions (USP) & Key Differentiators
- 1.1.3 Value Proposition for Stakeholders
- 1.2 Research Objectives
- 1.2.1 Market Sizing Objectives (Volume & Revenue)
- 1.2.2 Segmentation Objectives
- 1.2.3 Competitive Intelligence Objectives
- 1.2.4 Forecast & Scenario Objectives
- 1.3 Report Scope
- 1.3.1 Hospitality POS Terminals Scope – Types & Subtypes Covered
- 1.3.2 Geographic Scope – Regions & Countries Covered
- 1.3.3 Historical Period, Base Year & Forecast Period (2024; forecast to 2032)
- 1.3.4 Inclusions & Exclusions
- 1.4 HS Code & Classification Framework
- 1.5 Currency, Units & Pricing Basis
- 1.6 Target Stakeholders
- 1.7 Limitations & Assumptions
Chapter 2. Executive Summary
- 2.1 Global Hospitality POS Terminals Market Snapshot
- 2.1.1 Market Size – Historical (2024) & Forecast (2024-2032) (2024: USD 3,910 million → 2032: USD 8,319.61 million)
- 2.1.2 Volume & Revenue – Global Totals
- 2.1.3 Key Market Highlights – Top Five Facts
- 2.2 Hospitality POS Terminals Market Segmentation Snapshot
- 2.2.1 Market Split by Region – 2024 vs. 2032
- 2.3 Competitive Snapshot
- 2.3.1 Top 10 Players by Revenue Share – 2024
- 2.3.2 Top 10 Players by Volume Share – 2024
- 2.3.3 Recent Strategic Developments (18-Month Summary)
- 2.4 Key Investment Highlights & Strategic Conclusions
Chapter 3. Hospitality POS Terminals Market Dynamics & Industry Analysis
- 3.1 Market Overview & Context
- 3.1.1 Hospitality POS Terminals Market Position in the Broader Automotive Value Chain
- 3.1.2 OEM vs. Replacement Market Dynamics
- 3.1.3 Market Maturity & Development Stage by Region
- 3.2 Hospitality POS Terminals Market Drivers
- 3.3 Hospitality POS Terminals Market Restraints & Challenges
- 3.4 Hospitality POS Terminals Market Opportunities
- 3.5 Porter's Five Forces Analysis
- 3.5.1 Threat of New Entrants
- 3.5.2 Bargaining Power of Suppliers
- 3.5.3 Bargaining Power of Buyers
- 3.5.4 Threat of Substitutes
- 3.5.5 Competitive Rivalry – Intensity Assessment
- 3.6 Hospitality POS Terminals Value Chain Analysis
- 3.6.1 Upstream – Raw Material/Input Suppliers
- 3.6.1.1 Raw Material/Input 1
- 3.6.1.2 Raw Material/Input 2
- 3.6.1.3 Raw Material/Input 3
- 3.6.2 Midstream – Production/Manufacturing/Service Delivery
- 3.6.2.1 Production/Process Overview
- 3.6.2.2 Key Facility Locations & Capacity by Manufacturer
- 3.6.3 Downstream – Distribution & End Consumer
- 3.6.3.1 Primary Channel – B2B/OEM
- 3.6.3.2 Secondary Channels – Dealer, Retail, Online, Direct
- 3.6.4 Value Chain Profitability Analysis
- 3.6.1 Upstream – Raw Material/Input Suppliers
- 3.7 PESTEL Analysis
- 3.7.1 Political Factors
- 3.7.2 Economic Factors
- 3.7.3 Social Factors
- 3.7.4 Technological Factors
- 3.7.5 Environmental Factors
- 3.7.6 Legal Factors
- 3.8 Hospitality POS Terminals Supply Chain Analysis
- 3.8.1 Raw Material/Input Supply Risk Assessment
- 3.8.2 Manufacturing Concentration Risk (Geographic Exposure)
- 3.8.3 Trade Disruption Impact Analysis
- 3.9 Regulatory & Policy Landscape
Note: The regulatory and policy landscape section covers regulations based on their applicability to the market, Hospitality POS Terminals category, geography, and scope of the study. Only regulatory frameworks with a material impact on operations, compliance, trade, sustainability, or market access are analyzed in detail.
Chapter 4. Key Investment Pockets & Opportunity Analysis
- 4.1 Hospitality POS Terminals Market Attractiveness Analysis
- 4.1.1 By Region – Investment Attractiveness Matrix (Volume × CAGR)
- 4.2 Absolute Revenue Growth Opportunity
- 4.2.1 By Region – Absolute USD Growth Through 2032
- 4.3 Incremental Volume Opportunity
- 4.3.1 By Region – Incremental Volume Through 2032
- 4.3.2 Segment – Incremental Volume
- 4.4 Emerging Submarket Opportunity Deep Dive (Subject to Applicability)
- 4.5 Emerging Market Opportunity Scorecards
- 4.5.1 United States
- 4.5.2 Europe
- 4.5.3 Asia
- 4.5.4 Middle East & Africa
Note: Emerging Market Opportunity Scorecards will be included based on relevance and strategic importance. Regions listed are indicative and may vary depending on data availability and market dynamics.
Chapter 5. Hospitality POS Terminals Import-Export Analysis & Trade Flows
- 5.1 Global Trade Overview
- 5.1.1 Global Export Value by Country (2024)
- 5.1.2 Global Export Volume by Country (2024)
- 5.1.3 Global Import Value by Country (2024)
- 5.1.4 Global Import Volume by Country (2024)
- 5.1.5 Net Trade Balance by Country (2024)
- 5.2 Export Analysis – Segment
- 5.2.1 Type 1 (HS Code)
- 5.2.2 Type 2 (HS Code)
- 5.2.3 Type 3 (HS Code)
- 5.2.4 Type 4 (HS Code)
- 5.2.5 Type 5 (HS Code)
- 5.3 Import Analysis – Segment
- 5.3.1 Type 1 (HS Code)
- 5.3.2 Type 2 (HS Code)
- 5.3.3 Type 3 (HS Code)
- 5.3.4 Type 4 (HS Code)
- 5.3.5 Type 5 (HS Code)
- 5.4 Average Unit Trade Prices
- 5.4.1 Average Export Price – Segment & Country
- 5.4.2 Average Import Price – Segment & Source Country
- 5.4.3 Price Trends (2024)
- 5.5 Key Trade Route Analysis
- 5.5.1 Trade Route 1
- 5.5.2 Trade Route 2
- 5.5.3 Trade Route 3
- 5.5.4 Trade Route 4
- 5.5.5 Trade Route 5
- 5.6 Trade Policy Impact Assessment
- 5.6.1 US Anti-Dumping & Section 301 Tariffs
- 5.6.2 EU Customs Union Impact
- 5.6.3 Major Free Trade Agreements
- 5.6.4 USMCA Rules of Origin
Note: Trade policy analysis will be included only where relevant to the Hospitality POS Terminals market.
Chapter 6. Competitive Landscape & Company Benchmarking
- 6.1 Hospitality POS Terminals Market Concentration & Structure
- 6.1.1 Herfindahl-Hirschman Index (HHI) – vs. 2024
- 6.1.2 Tier 1, Tier 2 & Tier 3 Market Structure
- 6.1.3 Global, Regional & Local Player Dynamics
- 6.2 Hospitality POS Terminals Market Share Analysis – 2024
- 6.2.1 Global Revenue Share by Company
- 6.2.2 Global Volume Share by Company
- 6.2.3 Regional Revenue Share
- 6.2.4 Market Share Evolution ( vs. 2024)
- 6.2.5 OEM Segment Share by Company
- 6.2.6 Replacement Segment Share by Company
- 6.3 Production/Delivery Capacity & Facility Analysis
- 6.3.1 Global Installed Capacity
- 6.3.2 Capacity Utilization Rates
- 6.3.3 Production/Output Volume
- 6.3.4 Facility Locations & Capacity Map
- 6.3.5 Planned Capacity Additions
- 6.4 Hospitality POS Terminals Competitive Benchmarking Matrix
- 6.4.1 Revenue, Volume, CAGR & Profitability Comparison
- 6.4.2 Channel Revenue Mix
- 6.4.3 Geographic Revenue Exposure
- 6.4.4 R&D Intensity
- 6.4.5 Sustainability Maturity
- 6.5 Strategic Developments in Hospitality POS Terminals (Last 24 Months)
- 6.5.1 Mergers, Acquisitions & Divestments
- 6.5.2 New Hospitality POS Terminals Launches
- 6.5.3 Facility Expansions
- 6.5.4 Strategic Alliances, Joint Ventures & Partnerships
- 6.5.5 Distribution Expansion & Market Entry
- 6.5.6 Sustainability & ESG Initiatives
- 6.6 Competitive Strategy Mapping
- 6.6.1 Leader, Challenger, Follower & Niche Classification
- 6.6.2 Pricing Strategy Comparison
- 6.6.3 Channel Strategy Matrix
Note: Strategic developments are included based on their materiality and the availability of reliable information.
Chapter 7. Global Hospitality POS Terminals Market – By Distribution Channel
- 7.1 Segment Overview
- 7.1.1 Volume & Revenue Split by Channel (2024 & 2032)
- 7.1.2 Channel Mix Evolution (2024-2032)
Chapter 8. Regional Market Analysis – Global Overview
- 8.1 Global Regional Overview
- 8.1.1 Regional Volume Share
- 8.1.2 Regional Revenue Share
- 8.1.3 Regional Volume by Region
- 8.1.4 Regional Revenue by Region
- 8.1.5 Regional Forecast Through 2032
- 8.2 Cross-Regional Segment Analysis
- 8.2.1 By Distribution Channel
- 8.2.2 By Brand/Price Tier
Chapter 9. North America Hospitality POS Terminals Market
- 9.1 United States
- 9.2 Canada
- 9.3 Mexico
Chapter 10. Europe Hospitality POS Terminals Market
- 10.1 Germany
- 10.2 France
- 10.3 Italy
- 10.4 United Kingdom
- 10.5 Spain
- 10.6 Poland
- 10.7 Russia
- 10.8 Netherlands
- 10.9 Belgium
- 10.10 Sweden
- 10.11 Denmark
- 10.12 Norway
- 10.13 Rest of Europe
Chapter 11. Asia Pacific Hospitality POS Terminals Market
- 11.1 China
- 11.2 India
- 11.3 Japan
- 11.4 South Korea
- 11.5 Thailand
- 11.6 Indonesia
- 11.7 Vietnam
- 11.8 Malaysia
- 11.9 Australia
- 11.10 Rest of Asia Pacific
Chapter 12. Latin America Hospitality POS Terminals Market
- 12.1 Brazil
- 12.2 Argentina
- 12.3 Colombia
- 12.4 Chile
- 12.5 Rest of Latin America
Chapter 13. Middle East Hospitality POS Terminals Market
- 13.1 Saudi Arabia
- 13.2 United Arab Emirates
- 13.3 Turkey
- 13.4 Israel
- 13.5 Iran
- 13.6 Rest of the Middle East
Chapter 14. Africa Hospitality POS Terminals Market
- 14.1 South Africa
- 14.2 Egypt
- 14.3 Nigeria
- 14.4 Morocco
- 14.5 Rest of Africa
Chapter 15. Hospitality POS Terminals Company Profiles
- 15.1 [Company 01]
- 15.1.1 Company Overview
- 15.1.2 Key Management Personnel
- 15.1.3 Products & Services Portfolio
- 15.1.4 Financial Performance
- 15.1.5 Key Market Focus & Geographic Presence
- 15.1.6 Recent Developments & Strategic Initiatives
Note: The company profile list is preliminary and may change based on research findings, market developments, data availability, and client requirements.
Chapter 16. Appendices
- Appendix A – List of Abbreviations & Acronyms
- Appendix B – Industry Classification Code Reference – Full Series
- Appendix C – Production & Capacity Data Tables
- Appendix D – End-Use & Demand Base Tables
- Appendix E – Consumption & Replacement Rate Assumptions
- Appendix F – ASP Reference Tables
- Appendix G – Manufacturing & Facility Database
- Appendix H – Import-Export Data Tables
- Appendix I – Regulatory Summary Tables
- Appendix J – Primary Research Participant List (Anonymized)
- Appendix K – Primary Research Questionnaire Framework
- Appendix L – Data Sources & Bibliography
- Appendix M – Market Size Divergence & Source Comparison
Chapter 17. Research Methodology
- 17.1 Research Framework & Philosophy
- 17.2 Secondary Research – Sources, Hierarchy & Data Extraction
- 17.3 Data Modeling – Bottom-Up & Top-Down Market Sizing
- 17.4 Primary Research – Stakeholder Framework, LOI & Sample Sizes
- 17.5 Forecast Methodology – Regression, Scenario & Sensitivity Analysis
- 17.6 Quality Control – Four-Layer Validation Framework
- 17.7 Limitations & Standard Assumptions
- 17.8 Disclaimer
