
Market Overview
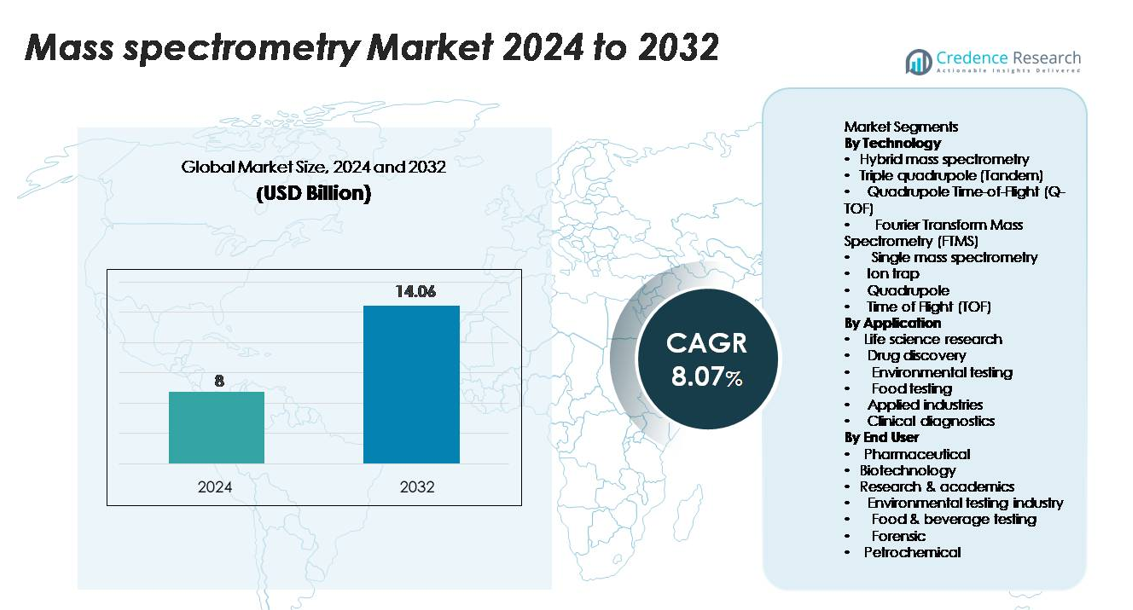
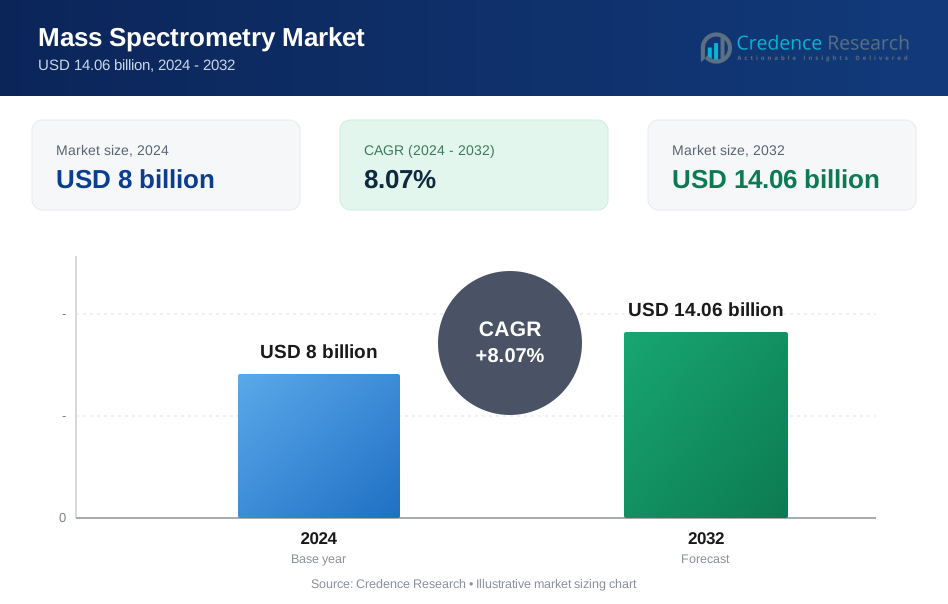
The mass spectrometry market was valued at USD 8 billion in 2024 and is projected to reach USD 14.06 billion by 2032, registering a CAGR of 8.07% over the forecast period.
| REPORT ATTRIBUTE | DETAILS |
|---|---|
| Historical Period | 2020-2023 |
| Base Year | 2024 |
| Forecast Period | 2025-2032 |
| Mass Spectrometry Market Size 2024 | USD 8 billion |
| Mass Spectrometry Market, CAGR | 8.07% |
| Mass Spectrometry Market Size 2032 | USD 14.06 billion |
Major players in the mass spectrometry market include Thermo Fisher Scientific, Agilent Technologies, Bruker Corporation, Shimadzu Corporation, Waters Corporation, and PerkinElmer, each advancing high-resolution and hybrid MS technologies for pharmaceutical, clinical, and environmental applications. Thermo Fisher and Agilent lead with strong portfolios in LC-MS/MS and hybrid systems, while Bruker and Shimadzu strengthen global adoption through innovations in FTMS and TOF platforms. Regionally, North America dominates with around 38% market share, supported by extensive biopharmaceutical research and advanced analytical infrastructure, followed by Europe with approximately 29%, driven by strict regulatory requirements in environmental and food safety testing.
Market Insights
- The mass spectrometry market was valued at USD 8 billion in 2024 and is projected to reach USD 14.06 billion by 2032, growing at a CAGR of 8.07% during the forecast period.
- Strong market growth is driven by expanding applications in proteomics, metabolomics, drug discovery, and clinical diagnostics, with hybrid mass spectrometry emerging as the largest technology segment due to its superior accuracy and sensitivity.
- Key trends include rising adoption of MS-based clinical testing, integration of AI-driven data analysis, and increased regulatory emphasis on contaminant detection in food and environmental testing.
- The competitive landscape is led by Thermo Fisher Scientific, Agilent Technologies, Bruker Corporation, Waters Corporation, and Shimadzu, each advancing high-resolution and hybrid MS platforms to strengthen global market presence.
- Regionally, North America holds around 38%, followed by Europe at 29% and Asia-Pacific at 23%, reflecting strong biotechnology investment and increasing multi-omics research adoption across key markets.
Market Segmentation Analysis:
By Technology:
Hybrid mass spectrometry dominates the technology segment, accounting for the largest market share due to its high resolution, sensitivity, and suitability for complex analyses in proteomics and metabolomics. Triple quadrupole and Q-TOF systems also show strong adoption in targeted quantification and high-speed screening, particularly in regulated industries. FTMS continues to grow in advanced research settings because of its ultra-high mass accuracy. Demand across ion trap, quadrupole, and TOF systems remains steady as laboratories balance cost, throughput needs, and analytical precision. Increasing use of hybrid instruments in biomarker discovery, biopharmaceutical characterization, and high-end analytical workflows drives segment growth.
- For instance, Thermo Fisher’s Orbitrap Eclipse Tribrid Mass Spectrometer achieves a resolving power of 1,000,000 (FWHM) at m/z 200 and delivers mass accuracy below 1 ppm, enabling high-confidence identification in large-scale proteomics.
By Application:
Life science research represents the dominant application segment, holding the highest market share as mass spectrometry becomes indispensable for proteomics, genomics, and metabolomics studies. Drug discovery follows closely, driven by expanding adoption in pharmacokinetics, impurity profiling, and structural elucidation. Environmental testing and food testing segments continue to grow, supported by stricter residue and contaminant regulations. Applied industries and clinical diagnostics gain momentum as mass spectrometry-based assays advance in speed and clinical readiness. The rising focus on precision medicine and molecular-level characterization further accelerates demand across research and clinical ecosystems.
- For instance, Thermo Fisher’s Orbitrap Ascend system enables identification of more than 8,000 human proteins in a single 24-hour run, supporting deep proteome mapping.
By End User:
Pharmaceutical companies lead the end-user segment, contributing the largest market share due to substantial investment in quality control, biologics analysis, and regulatory-driven testing. Biotechnology firms increasingly adopt advanced MS systems for complex biomolecule characterization, supporting rapid expansion of the segment. Research and academic institutions remain major contributors, driven by continuous funding for high-resolution analytical platforms. Environmental testing, food and beverage testing, forensic laboratories, and petrochemical industries show consistent uptake as mass spectrometry enables compliance with global safety, purity, and emissions standards. Growing reliance on high-precision instrumentation across regulated industries continues to strengthen demand.
Key Growth Drivers
Rising Adoption in Proteomics, Metabolomics, and Life Science Research
The increasing emphasis on molecular-level understanding in proteomics and metabolomics serves as a major growth driver for the mass spectrometry market. Advanced research laboratories and academic institutes are investing heavily in high-resolution MS systems to enable precise biomolecule identification, post-translational modification analysis, and pathway mapping. Pharmaceutical research relies on mass spectrometry to analyze protein structures, characterize biological drug candidates, and detect micro-level molecular changes that traditional analytical tools cannot capture. Additionally, the global rise in chronic and lifestyle diseases has accelerated demand for detailed biomarker research, where MS techniques play a central role. The growth of multi-omics workflows, integration of MS with chromatography and automation, and increasing funding for biomedical innovation continue to propel adoption across high-end research environments.
- For instance, Bruker’s timsTOF Pro 2 enables acquisition speeds of up to 200 Hz and routinely identifies more than 7,000 human proteins in a single LC-MS run, supporting deep-coverage proteomics workflows.
Expanding Use Across Regulated Industries Including Pharmaceuticals and Environmental Testing
Regulated industries increasingly rely on mass spectrometry for high-precision testing, purity validation, and compliance with global safety standards. In pharmaceuticals, MS supports impurity profiling, pharmacokinetics, active ingredient quantification, and biologics characterization, making it indispensable in drug development pipelines. Environmental agencies employ MS for detecting pesticides, heavy metals, volatile organic compounds, and emerging contaminants at extremely low detection limits. The food and beverage sector uses MS to validate residue-free production, ensuring compliance with international safety norms. As regulations tighten globally, industries are compelled to adopt advanced MS tools for consistent accuracy, traceability, and reproducibility. This regulatory-driven expansion remains a strong catalyst for sustained market growth.
- For instance, Waters’ Xevo TQ-XS achieves instrument detection limits below 0.1 fg for steroid impurities, enabling ultra-trace impurity profiling in pharmaceutical quality control.
Technological Advancements Enhancing Accuracy, Speed, and Workflow Integration
Continuous innovation in mass spectrometry platforms significantly contributes to market expansion. New hybrid MS systems offer enhanced mass accuracy, higher sensitivity, and improved fragmentation capabilities, catering to complex analytical workflows. Automation, AI-assisted data processing, and cloud-based integration reduce manual interpretation and accelerate throughput. Advancements in ion mobility spectrometry, real-time data acquisition, microfluidic interfaces, and compact benchtop instruments further improve accessibility and performance. Integration with advanced chromatography systems and emergence of triple quadrupole and Q-TOF instruments with superior speed enhances usability in both qualitative and quantitative applications. These technological improvements reduce operational complexity, expand application scope, and strengthen the role of MS in modern analytical laboratories.
Key Trends & Opportunities
Growing Shift Toward Clinical Diagnostics and Precision Medicine Applications
Clinical diagnostics is emerging as one of the most promising growth frontiers for the mass spectrometry market. Increasing demand for highly accurate, rapid, and quantitative testing in immunoassays, therapeutic drug monitoring, and disease biomarker detection is driving MS integration into hospital laboratories. Advances in LC-MS/MS instruments have made clinical workflows more streamlined, automated, and compliant with regulatory requirements. The rise of precision medicine-supported by genomic, proteomic, and metabolomic data-creates substantial opportunities for MS-based assays. As healthcare providers move toward individualized treatment strategies, MS instruments offer unmatched specificity and sensitivity for complex biomarker panels, enabling more effective disease management and early detection.
- For instance, SCIEX’s Topaz™ System for clinical LC-MS/MS enables fully compliant IVD workflows and achieves detection of tacrolimus at concentrations as low as 0.4 ng/mL, supporting ultra-sensitive immunosuppressant monitoring.
Expansion of MS-Based Environmental and Food Safety Monitoring
Growing concerns over chemical contamination, food adulteration, and emerging pollutants present significant opportunities for mass spectrometry adoption. Governments increasingly mandate ultra-low detection thresholds to monitor pesticides, microplastics, PFAS, and industrial residues in water, soil, and packaged foods. High-resolution MS offers unparalleled ability to detect trace-level contaminants and unknown compounds. The global movement toward sustainability and public health safety continues to push industries to adopt MS-based testing as a standard analytical approach. This trend fosters demand for portable MS devices, automated sample preparation, and workflow-optimized instruments tailored for routine environmental and food laboratories.
- For instance, Thermo Fisher’s Orbitrap Exploris 120 enables PFAS detection in drinking water down to 0.5 ng/L under EPA Method 537.1, allowing ultra-trace identification of persistent contaminants.
Increasing Integration of Automation, AI, and Cloud-Based Data Systems
A major emerging opportunity lies in the integration of AI-driven analytics, automated sample handling, and cloud-based platforms within mass spectrometry workflows. Laboratories face challenges managing large volumes of complex spectral data, prompting adoption of AI tools that improve peak identification, error detection, and predictive quality assessments. Cloud platforms enable real-time data sharing, remote instrument monitoring, and collaborative research. Automation solutions-such as robotic sample loading and integrated software pipelines-reduce manual errors and increase throughput. These innovations help laboratories optimize efficiency, improve reproducibility, and support high-volume testing demands across research and commercial environments.
Key Challenges
High Instrument Cost and Operational Complexity
One of the major challenges limiting mass spectrometry adoption is the high capital cost of advanced instruments, which often requires significant investment from laboratories, particularly in developing regions. Beyond initial acquisition, operational costs-including maintenance, consumables, calibration, and specialized training-add to the financial burden. The complexity of MS instruments demands trained personnel for operation, data interpretation, and troubleshooting, creating skill gaps in many markets. While benchtop and cost-optimized models are emerging, high-end systems required for research and regulated applications remain expensive, hindering widespread accessibility.
Data Management Challenges and Standardization Limitations
Mass spectrometry generates large volumes of highly complex data, making analysis, storage, and interpretation a significant challenge. The lack of global standardization in analytical methods, reporting formats, and workflow validation further complicates cross-laboratory comparability. In clinical and regulatory environments, inconsistent protocols and limited interoperability between instrument platforms hinder seamless adoption. Data overload, long processing times, and difficulties in identifying unknown compounds can delay decision-making and reduce efficiency. Although AI and automation offer support, the need for improved data harmonization, unified databases, and standardized quality frameworks remains a critical barrier to broader adoption.
Regional Analysis
North America
North America holds the largest share of the mass spectrometry market, accounting for around 38% due to strong investment in proteomics, biopharmaceutical research, and clinical diagnostics. The U.S. leads adoption, supported by advanced healthcare infrastructure, high R&D spending, and the presence of major instrument manufacturers. Regulatory emphasis on drug quality, environmental monitoring, and food safety further drives the demand for high-precision MS systems. Increasing funding for genomics and precision medicine programs strengthens regional growth, while academic institutions continue to expand multi-omics research initiatives, reinforcing North America’s dominant market position.
Europe
Europe represents approximately 29% of the global mass spectrometry market, driven by robust adoption in pharmaceuticals, food safety testing, and environmental surveillance. Countries such as Germany, the U.K., and France lead consumption due to strong biotechnology clusters and stringent regulatory frameworks. The region’s focus on contaminant detection, chemical safety compliance, and advanced clinical diagnostics supports consistent demand for hybrid and high-resolution MS systems. EU-funded research programs and collaborations between academic and industrial laboratories further accelerate technology adoption. Europe’s mature analytical testing ecosystem solidifies its position as a key global market contributor.
Asia-Pacific
Asia-Pacific is the fastest-growing region, holding about 23% of the market, supported by rapid expansion in pharmaceutical manufacturing, clinical diagnostics, and food quality testing. China, Japan, South Korea, and India increasingly invest in advanced analytical instrumentation to strengthen drug development capabilities and comply with international safety standards. Growing proteomics and metabolomics research, rising healthcare spending, and government-backed initiatives in biotechnology significantly fuel MS adoption. The region’s large population and burden of chronic diseases also boost demand for high-accuracy diagnostic applications, positioning Asia-Pacific as a major growth engine for the global market.
Latin America
Latin America accounts for around 6% of the mass spectrometry market, with growing adoption in pharmaceutical quality control, environmental monitoring, and food contamination testing. Brazil and Mexico lead regional demand due to expanding pharmaceutical production and the need for advanced analytical techniques in regulatory compliance. Increasing awareness of food safety standards and pollution monitoring encourages laboratories to upgrade to modern MS platforms. Although budget constraints limit large-scale adoption, government investment in public health and research infrastructure continues to strengthen market penetration, gradually improving access to high-performance MS instruments across the region.
Middle East & Africa
The Middle East & Africa region holds approximately 4% of the market, with growth driven by investments in healthcare modernization, petrochemical analysis, and environmental testing. Countries such as Saudi Arabia, the UAE, and South Africa are upgrading laboratory capabilities to meet international analytical standards. Expanding pharmaceutical manufacturing and rising demand for accurate diagnostic testing support increased MS deployment. While adoption remains slower compared to mature markets, improving funding for clinical research, water quality testing, and industrial safety is fostering steady growth. Regional focus on technological modernization continues to create opportunities for high-precision MS systems.
Market Segmentations:
By Technology
- Hybrid mass spectrometry
- Triple quadrupole (Tandem)
- Quadrupole Time-of-Flight (Q-TOF)
- Fourier Transform Mass Spectrometry (FTMS)
- Single mass spectrometry
- Ion trap
- Quadrupole
- Time of Flight (TOF)
By Application
- Life science research
- Drug discovery
- Environmental testing
- Food testing
- Applied industries
- Clinical diagnostics
By End User
- Pharmaceutical
- Biotechnology
- Research & academics
- Environmental testing industry
- Food & beverage testing
- Forensic
- Petrochemical
By Geography
- North America
- U.S.
- Canada
- Mexico
- Europe
- Germany
- France
- U.K.
- Italy
- Spain
- Rest of Europe
- Asia Pacific
- China
- Japan
- India
- South Korea
- South-east Asia
- Rest of Asia Pacific
- Latin America
- Brazil
- Argentina
- Rest of Latin America
- Middle East & Africa
- GCC Countries
- South Africa
- Rest of the Middle East and Africa
Competitive Landscape
The competitive landscape of the mass spectrometry market is characterized by strong innovation, technological differentiation, and strategic expansion by leading global manufacturers. Major players such as Thermo Fisher Scientific, Agilent Technologies, Bruker Corporation, Waters Corporation, Shimadzu Corporation, and PerkinElmer dominate the market through extensive portfolios spanning hybrid MS, LC-MS/MS, Q-TOF, FTMS, and benchtop systems. These companies invest heavily in R&D to enhance resolution, throughput, and automation while integrating AI-driven analytics and cloud connectivity to streamline workflows. Strategic partnerships with pharmaceutical companies, clinical laboratories, and academic research institutions further strengthen market penetration. Additionally, firms focus on expanding consumables, software, and service offerings to secure recurring revenue streams. Competition intensifies as emerging players introduce compact, cost-efficient systems targeting routine testing and decentralized laboratories. Overall, continuous innovation, regulatory-driven demand, and expansion into clinical diagnostics define the evolving competitive dynamics of the mass spectrometry market.
Key Player Analysis
- LECO Corporation
- JEOL Ltd.
- Agilent Technologies, Inc.
- Shimadzu Corporation
- Bruker Corporation
- PerkinElmer, Inc.
- Waters Corporation
- Thermo Fisher Scientific Inc.
- SCIEX (a division of Danaher Corporation)
- AB Sciex Pte. Ltd.
Recent Developments
- In August 2025, Shimadzu Corporation Announced the release of the LCMS-8065XE triple quadrupole mass spectrometer with enhanced sensitivity, efficiency, and sustainability features.
- In June 2024, Agilent Technologies, Inc. Introduced two new instruments at the 72nd ASMS Conference: the 7010D Triple Quadrupole GC/MS targeting food & environmental testing, and the ExD Cell paired with the 6545XT AdvanceBio LC/Q-TOF for biopharma research.
- In May 2024, LECO Corporation Announced attendance at ASMS 2024 and showcased its new BenchTop Mass Spectrometer Pegasus BTX, a next-generation GC-TOFMS instrument.
Report Coverage
The research report offers an in-depth analysis based on Technology ,Application, End-User and Geography. It details leading market players, providing an overview of their business, product offerings, investments, revenue streams, and key applications. Additionally, the report includes insights into the competitive environment, SWOT analysis, current market trends, as well as the primary drivers and constraints. Furthermore, it discusses various factors that have driven market expansion in recent years. The report also explores market dynamics, regulatory scenarios, and technological advancements that are shaping the industry. It assesses the impact of external factors and global economic changes on market growth. Lastly, it provides strategic recommendations for new entrants and established companies to navigate the complexities of the market.
Future Outlook
- The mass spectrometry market will continue advancing through higher-resolution hybrid systems that support complex multi-omics research.
- Clinical adoption of MS-based assays will accelerate as healthcare systems shift toward precision diagnostics.
- Integration of AI and machine learning will streamline data interpretation and reduce analysis time in high-volume laboratories.
- Automation and robotics will expand throughput, enabling fully integrated MS workflows in pharmaceutical and research settings.
- Portable and benchtop MS instruments will gain traction for on-site environmental, forensic, and food testing.
- Demand for MS in biologics and gene-therapy characterization will rise as advanced therapeutics expand globally.
- Regulatory requirements for contaminant monitoring will drive increased use of MS in food, water, and environmental testing.
- Cloud-connected MS systems will support remote data access, collaborative research, and centralized quality control.
- Growing investment in proteomics and metabolomics will further strengthen research-driven MS adoption.
- Emerging markets will expand rapidly as laboratory modernization and analytical capability improve across Asia and Latin America.
Request a Free Sample
Fill in your details and we'll send you a free sample report.
- Sample data tables & charts
- Research methodology
Need a Custom Version of This Report?
Tailor the scope, geography, or segments to your exact requirements.
- Custom geography or segment scope
- Direct access to our analyst team
Frequently Asked Questions
What is the current market size for the mass spectrometry market, and what is its projected size in 2032?
At what Compound Annual Growth Rate is the mass spectrometry market projected to grow between 2025 and 2032?
What are the key applications of mass spectrometry?
What are the main components of a mass spectrometer?
What are the specific forms of mass spectrometry techniques?
What are the factors driving the growth of the mass spectrometry market?
What are the challenges faced by the mass spectrometry market?
What are the important trends inside the mass spectrometry marketplace?
What are the regulatory considerations for mass spectrometry instruments?
What are the future prospects of the mass spectrometry market?
Who are the leading companies in the mass spectrometry market?
Table of Content
Chapter 1. Report Introduction
- 1.1 Report Description & Purpose
- 1.1.1 Report Title & Market Definition
- 1.1.2 Unique Selling Propositions (USP) & Key Differentiators
- 1.1.3 Value Proposition for Stakeholders
- 1.2 Research Objectives
- 1.2.1 Market Sizing Objectives (Volume & Revenue) (Volume Where Applicable)
- 1.2.2 Segmentation Objectives
- 1.2.3 Competitive Intelligence Objectives
- 1.2.4 Forecast & Scenario Objectives
- 1.3 Report Scope
- 1.3.1 Mass Spectrometry Scope – Segments & Subsegments Covered
- 1.3.2 Geographic Scope – Regions & Countries Covered
- 1.3.3 Historical Period, Base Year & Forecast Period (2024; forecast to 2032)
- 1.3.4 Inclusions & Exclusions
- 1.4 Industry Classification & Applicable Codes
- 1.5 Currency, Measurement Units & Valuation Basis
- 1.6 Target Stakeholders
- 1.7 Limitations & Assumptions
Chapter 2. Executive Summary
- 2.1 Global Mass Spectrometry Market Snapshot
- 2.1.1 Market Size – Historical (2024) & Forecast (2024-2032) (2024: USD 8 billion → 2032: USD 14.06 billion)
- 2.1.2 Volume & Revenue – Global Totals (Volume Where Applicable)
- 2.1.3 Key Market Highlights – Top Five Facts
- 2.2 Mass Spectrometry Market Segmentation Snapshot
- 2.2.1 Market Split by Region – 2024 vs. 2032
- 2.3 Competitive Snapshot
- 2.3.1 Top 10 Players by Revenue Share – 2024
- 2.3.2 Top 10 Players by Volume Share – 2024 (Volume Where Applicable)
- 2.3.3 Recent Strategic Developments (18-Month Summary)
- 2.4 Key Investment Highlights & Strategic Conclusions
Chapter 3. Mass Spectrometry Market Dynamics & Industry Analysis
- 3.1 Market Overview & Context
- 3.1.1 Mass Spectrometry Market Position in the Broader Industry Value Chain
- 3.1.2 Demand Structure & Purchasing Dynamics
- 3.1.3 Market Maturity & Development Stage by Region
- 3.2 Mass Spectrometry Market Drivers
- 3.3 Mass Spectrometry Market Restraints & Challenges
- 3.4 Mass Spectrometry Market Opportunities
- 3.5 Porter's Five Forces Analysis
- 3.5.1 Threat of New Entrants
- 3.5.2 Bargaining Power of Suppliers
- 3.5.3 Bargaining Power of Buyers
- 3.5.4 Threat of Substitutes
- 3.5.5 Competitive Rivalry – Intensity Assessment
- 3.6 Mass Spectrometry Value Chain Analysis
- 3.6.1 Upstream – Key Inputs, Resources & Suppliers
- 3.6.1.1 Key Input/Resource 1
- 3.6.1.2 Key Input/Resource 2
- 3.6.1.3 Key Input/Resource 3
- 3.6.2 Midstream – Core Operations & Value Creation
- 3.6.2.1 Operating Model & Process Overview
- 3.6.2.2 Key Operating Locations & Capabilities by Company
- 3.6.3 Downstream – Market Channels & End Users
- 3.6.3.1 Direct Sales & Customer Engagement Channels
- 3.6.3.2 Indirect Sales, Intermediaries & Partner Channels
- 3.6.4 Value Chain Profitability Analysis
- 3.6.1 Upstream – Key Inputs, Resources & Suppliers
- 3.7 PESTEL Analysis
- 3.7.1 Political Factors
- 3.7.2 Economic Factors
- 3.7.3 Social Factors
- 3.7.4 Technological Factors
- 3.7.5 Environmental Factors
- 3.7.6 Legal Factors
- 3.8 Mass Spectrometry Supply Chain Analysis
- 3.8.1 Critical Input & Resource Availability Risk Assessment
- 3.8.2 Supplier & Operational Concentration Risk (Geographic Exposure)
- 3.8.3 Supply & Service Disruption Impact Analysis
- 3.9 Regulatory & Policy Landscape
Note: The regulatory and policy landscape section covers regulations based on their applicability to the market, Mass Spectrometry category, geography, and scope of the study. Only regulatory frameworks with a material impact on operations, compliance, trade, sustainability, or market access are analyzed in detail.
Chapter 4. Key Investment Pockets & Opportunity Analysis
- 4.1 Mass Spectrometry Market Attractiveness Analysis
- 4.1.1 By Region – Investment Attractiveness Matrix (Market Size × CAGR)
- 4.2 Absolute Revenue Growth Opportunity
- 4.2.1 By Region – Absolute Revenue Growth Through 2032
- 4.3 Incremental Demand Opportunity
- 4.3.1 By Region – Incremental Demand Through 2032
- 4.3.2 Segment – Incremental Demand
- 4.4 Emerging Submarket Opportunity Deep Dive (Subject to Applicability)
- 4.5 Priority Market Opportunity Scorecards
- 4.5.1 United States
- 4.5.2 Europe
- 4.5.3 Asia
- 4.5.4 Middle East & Africa
Note: Priority market opportunity scorecards reflect the geographic scope and strategic relevance of the study. Listed markets are indicative and may be adapted to the industry.
Chapter 5. Mass Spectrometry Cross-Border Trade & Market Access Analysis
- 5.1 International Trade & Cross-Border Activity Overview
- 5.1.1 Global Export Value by Country (2024)
- 5.1.2 Global Export Volume by Country (2024) (Volume Where Applicable)
- 5.1.3 Global Import Value by Country (2024)
- 5.1.4 Global Import Volume by Country (2024) (Volume Where Applicable)
- 5.1.5 Net Trade Balance by Country (2024)
- 5.2 Export Analysis – Segment
- 5.2.1 Category 1 (Applicable Classification Code)
- 5.2.2 Category 2 (Applicable Classification Code)
- 5.2.3 Category 3 (Applicable Classification Code)
- 5.2.4 Category 4 (Applicable Classification Code)
- 5.2.5 Category 5 (Applicable Classification Code)
- 5.3 Import Analysis – Segment
- 5.3.1 Category 1 (Applicable Classification Code)
- 5.3.2 Category 2 (Applicable Classification Code)
- 5.3.3 Category 3 (Applicable Classification Code)
- 5.3.4 Category 4 (Applicable Classification Code)
- 5.3.5 Category 5 (Applicable Classification Code)
- 5.4 Cross-Border Pricing & Transaction Benchmarks
- 5.4.1 Export Pricing – Segment & Country
- 5.4.2 Import Pricing – Segment & Source Country
- 5.4.3 Price Trends (2024)
- 5.5 Key Cross-Border Trade & Delivery Routes
- 5.5.1 Cross-Border Trade/Delivery Route 1
- 5.5.2 Cross-Border Trade/Delivery Route 2
- 5.5.3 Cross-Border Trade/Delivery Route 3
- 5.5.4 Cross-Border Trade/Delivery Route 4
- 5.5.5 Cross-Border Trade/Delivery Route 5
- 5.6 Trade Policy & Market Access Impact Assessment
- 5.6.1 Tariff & Non-Tariff Barriers
- 5.6.2 Regional Trade & Economic Integration Frameworks
- 5.6.3 Bilateral & Multilateral Trade Agreements
- 5.6.4 Cross-Border Operating, Licensing & Localization Requirements
Note: This chapter applies where cross-border trade or delivery is relevant to Mass Spectrometry. Goods, services, and digital offerings are assessed using applicable classifications and transaction measures. Import-export volumes, trade balances, and route analyses are included only where meaningful to the market.
Chapter 6. Competitive Landscape & Company Benchmarking
- 6.1 Mass Spectrometry Market Concentration & Structure
- 6.1.1 Herfindahl-Hirschman Index (HHI) – vs. 2024
- 6.1.2 Leading, Mid-Sized & Emerging Player Structure
- 6.1.3 Global, Regional & Local Player Dynamics
- 6.2 Mass Spectrometry Market Share Analysis – 2024
- 6.2.1 Global Revenue Share by Company
- 6.2.2 Global Volume Share by Company (Volume Where Applicable)
- 6.2.3 Regional Revenue Share
- 6.2.4 Market Share Evolution ( vs. 2024)
- 6.2.5 Company Market Share by Key Segment
- 6.2.6 Company Market Share by Customer Group
- 6.3 Operating Scale, Capacity & Infrastructure Analysis
- 6.3.1 Global Operating Scale & Supply Capacity
- 6.3.2 Resource Utilization & Operating Efficiency
- 6.3.3 Output, Service Delivery & Activity Metrics
- 6.3.4 Operating Footprint & Infrastructure Map
- 6.3.5 Planned Operational & Capacity Expansion
- 6.4 Mass Spectrometry Competitive Benchmarking Matrix
- 6.4.1 Revenue, Growth, Profitability & Operating Metric Comparison
- 6.4.2 Channel Revenue Mix
- 6.4.3 Geographic Revenue Exposure
- 6.4.4 R&D Intensity
- 6.4.5 Sustainability Maturity
- 6.5 Strategic Developments in Mass Spectrometry (Last 24 Months)
- 6.5.1 Mergers, Acquisitions & Divestments
- 6.5.2 New Products, Services & Solutions in Mass Spectrometry
- 6.5.3 Operational & Infrastructure Expansions
- 6.5.4 Strategic Alliances, Joint Ventures & Partnerships
- 6.5.5 Distribution Expansion & Market Entry
- 6.5.6 Sustainability & ESG Initiatives
- 6.6 Competitive Strategy Mapping
- 6.6.1 Leader, Challenger, Follower & Niche Classification
- 6.6.2 Pricing Strategy Comparison
- 6.6.3 Channel Strategy Matrix
Note: Strategic developments are included based on their materiality and the availability of reliable information.
Chapter 7. Global Mass Spectrometry Market – By Sales & Delivery Channel
- 7.1 Segment Overview
- 7.1.1 Volume & Revenue Split by Channel (2024 & 2032) (Volume Where Applicable)
- 7.1.2 Channel Mix Evolution (2024-2032)
Chapter 8. Regional Market Analysis – Global Overview
- 8.1 Global Regional Overview
- 8.1.1 Regional Volume Share (Volume Where Applicable)
- 8.1.2 Regional Revenue Share
- 8.1.3 Regional Volume by Region (Volume Where Applicable)
- 8.1.4 Regional Revenue by Region
- 8.1.5 Regional Forecast Through 2032
- 8.2 Cross-Regional Segment Analysis
- 8.2.1 By Sales & Delivery Channel
- 8.2.2 By Competitive Positioning & Price Tier
Chapter 9. North America Mass Spectrometry Market
- 9.1 United States
- 9.2 Canada
- 9.3 Mexico
Chapter 10. Europe Mass Spectrometry Market
- 10.1 Germany
- 10.2 France
- 10.3 Italy
- 10.4 United Kingdom
- 10.5 Spain
- 10.6 Poland
- 10.7 Russia
- 10.8 Netherlands
- 10.9 Belgium
- 10.10 Sweden
- 10.11 Denmark
- 10.12 Norway
- 10.13 Rest of Europe
Chapter 11. Asia Pacific Mass Spectrometry Market
- 11.1 China
- 11.2 India
- 11.3 Japan
- 11.4 South Korea
- 11.5 Thailand
- 11.6 Indonesia
- 11.7 Vietnam
- 11.8 Malaysia
- 11.9 Australia
- 11.10 Rest of Asia Pacific
Chapter 12. Latin America Mass Spectrometry Market
- 12.1 Brazil
- 12.2 Argentina
- 12.3 Colombia
- 12.4 Chile
- 12.5 Rest of Latin America
Chapter 13. Middle East Mass Spectrometry Market
- 13.1 Saudi Arabia
- 13.2 United Arab Emirates
- 13.3 Turkey
- 13.4 Israel
- 13.5 Iran
- 13.6 Rest of the Middle East
Chapter 14. Africa Mass Spectrometry Market
- 14.1 South Africa
- 14.2 Egypt
- 14.3 Nigeria
- 14.4 Morocco
- 14.5 Rest of Africa
Chapter 15. Mass Spectrometry Company Profiles
- 15.1 [Company 01]
- 15.1.1 Company Overview
- 15.1.2 Key Management Personnel
- 15.1.3 Products & Services Portfolio
- 15.1.4 Financial Performance
- 15.1.5 Key Market Focus & Geographic Presence
- 15.1.6 Recent Developments & Strategic Initiatives
Note: The company profile list is preliminary and may change based on research findings, market developments, data availability, and client requirements.
Chapter 16. Appendices
- Appendix A – List of Abbreviations & Acronyms
- Appendix B – Industry Classification Code Reference – Full Series
- Appendix C – Supply, Output & Operating Capacity Data Tables
- Appendix D – End-Use & Demand Base Tables
- Appendix E – Demand, Adoption & Usage Assumptions
- Appendix F – Pricing & Revenue Metric Reference Tables
- Appendix G – Company Operations & Infrastructure Database
- Appendix H – Cross-Border Trade & Activity Data Tables (Where Applicable)
- Appendix I – Regulatory Summary Tables
- Appendix J – Primary Research Participant List (Anonymized)
- Appendix K – Primary Research Questionnaire Framework
- Appendix L – Data Sources & Bibliography
- Appendix M – Market Size Divergence & Source Comparison
Chapter 17. Research Methodology
- 17.1 Research Framework & Philosophy
- 17.2 Secondary Research – Sources, Hierarchy & Data Extraction
- 17.3 Data Modeling – Bottom-Up & Top-Down Market Sizing
- 17.4 Primary Research – Stakeholder Framework, LOI & Sample Sizes
- 17.5 Forecast Methodology – Regression, Scenario & Sensitivity Analysis
- 17.6 Quality Control – Four-Layer Validation Framework
- 17.7 Limitations & Standard Assumptions
- 17.8 Disclaimer
