
| REPORT ATTRIBUTE | DETAILS |
|---|---|
| Historical Period | 2019-2022 |
| Base Year | 2023 |
| Forecast Period | 2024-2032 |
| Metabolomics Market Size 2023 | USD 2,251.2 Million |
| Metabolomics Market, CAGR | 15.20% |
| Metabolomics Market Size 2032 | USD 8,044.2 Million |
Market Insights
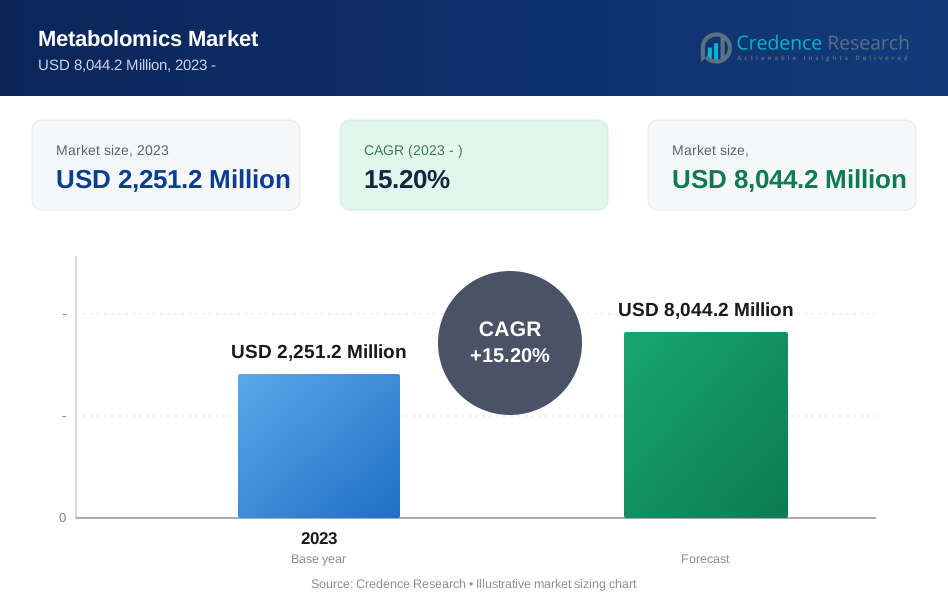
- The global demand for Metabolomics was valued at USD 2,251.2 Million in 2023 and is expected to reach USD 8,044.2 Million in 2032, growing at a CAGR of 15.20% between 2024 and 2032.
- Bioinformatics will be the dominating category by 2023, with Mass Spectrometry (MS) being the fastest-growing sector in the Metabolomics Market.
- Clinical Metabolomics has the largest market share, Pharmaceutical Research is the most in-demand segment, and Nutritional Metabolomics is the third most popular segment in the Metabolomics Market.
- In the Metabolomics Market, blood and serum are the most popular, while urine is growing at the fastest rate.
- In 2023, the academic and research institutes segment had the highest revenue share of the global market.
- North America is likely to have the largest market share in 2023, while the Asia Pacific (APAC) region is forecasted to rise at the quickest CAGR during the projection period.
- Increased prevalence of chronic diseases fuels market growth.
- Regulatory issues stymie Metabolomics Market expansion.
Executive Summary
Market Definition
Metabolomics is a cutting-edge discipline in life sciences that studies the small chemicals known as metabolites within biological systems. These metabolites, which include sugars, amino acids, lipids, and other cellular components, play important roles in a variety of biological processes. Metabolomics uses advanced analytical techniques, such as mass spectrometry and nuclear magnetic resonance spectroscopy, to detect and measure metabolites. As a result, it provides insights into an organism's metabolic status, which is useful for understanding health, disease, pharmacological reactions, and environmental impacts.
Market Overview
The global Metabolomics Market has witnessed steady growth in recent years and is expected to grow at a CAGR of 15.20% between 2024 and 2032. The market was valued at USD 2,251.2 million in 2023 and is expected to reach USD 8,044.2 million in 2032.
The global metabolomics market is expanding rapidly, owing to increased recognition of this compound's critical role in customized medicine and healthcare. In accordance with this, metabolomics is a strong tool for identifying an individual's unique metabolic profile, allowing for more precise diagnosis, therapy selection, and individualized healthcare plans, ultimately driving market growth. Furthermore, the rising frequency of chronic diseases, as well as the necessity for early disease identification and prevention, are driving up demand for metabolomics technologies, indicating a promising market expansion.
In addition, the growing usage of these technologies to detect metabolic biomarkers linked with diseases, allowing for early intervention and surveillance, is driving market expansion. Furthermore, the growth of pharmaceutical and biotechnology research, combined with the desire for drug discovery and development, is driving demand for metabolomics to understand pharmacological mechanisms, forecast medication efficacy, and assess safety.
Segmentation by Technology
- In 2023, Bioinformatics is the dominant segment because of its critical role in metabolomics data processing, interpretation, and integration. Bioinformatics technologies aid in effectively processing big datasets, detecting trends, and extracting valuable insights from complex metabolomic data.
- Mass Spectrometry (MS) is the Metabolomics Market's fastest growing segment. Mass spectrometry is the chosen technology for metabolomics research because of its high sensitivity, accuracy, and capacity to investigate a large range of metabolites.
Segmentation by Applications
- Pharmaceutical research is the most in-demand segment. Metabolomics is used extensively in pharmaceutical research to understand drug metabolism better, identify biomarkers, and optimize drug development procedures.
- Clinical Metabolomics has the highest market share in the Metabolomics Market. Clinical metabolomics is a large market segment due to its use in customized medicine, disease diagnosis, and monitoring therapy responses.
- Nutritional Metabolomics is the third-most-popular segment in the Metabolomics Market.
Segmentation by Sample Type
- Blood and Serum is the most popular part because blood and serum samples contain a large number of metabolites, making them attractive sources for metabolomics research.
- Urine has the fastest growth rate in the Metabolomics Market. Urine samples are noninvasive, easily accessible, and contain a diverse spectrum of metabolites, making them ideal for metabolomics research.
Segmentation by End User
- In 2023, the academic & research institutes segment accounted for the biggest revenue share of the global market. This expansion is due to an increase in the number of research and development activities conducted at academic and research institutes, as well as increased funding supplied by government entities to these institutes. Metabolomics is widely regarded as a valuable research tool.
- The pharmaceutical and biotechnology companies segment is predicted to increase rapidly over the forecast period as pharmaceutical companies use metabolomics for toxicity and disease pathology.
Segmentation by Region
- In 2023, North America is expected to have the biggest market share.
- The Asia Pacific (APAC) region is predicted to develop at the fastest CAGR during the projection period.
- The rest of the world, including Latin America, the Middle East, and Africa, supplies the remaining demand for Metabolomics.
North America held the largest market share. North America has a flourishing biopharmaceutical and healthcare business, with significant investments in R&D. This dynamic ecosystem drives demand for metabolomics technology in drug discovery and personalized medicine applications as pharmaceutical companies look for novel ways to speed up drug development and improve patient outcomes. Concurrently, the region's healthcare infrastructure places a high value on precision medicine, with government efforts and healthcare institutions increasingly realizing the potential of metabolomics to customize therapies and improve patient outcomes.
Moreover, the Asia-Pacific market is predicted to have the greatest CAGR over the forecast period. The constant exponential growth rate is predicted to be supported by the rising disease burden, which significantly increases the demand for therapeutic measures and reliable diagnostic tools. Thus, the regional market is expanding as these metabolomic technologies are deployed to meet demand. The Asia-Pacific area consists primarily of growing economies such as Japan, China, India, Korea, and Australia, which are continually focusing efforts and supporting research to construct sound and advanced healthcare facilities. The frequency of chronic diseases such as cancer and CVDs, among others, has skyrocketed, necessitating increased measures to manage the disease.
Key Highlights of the Report
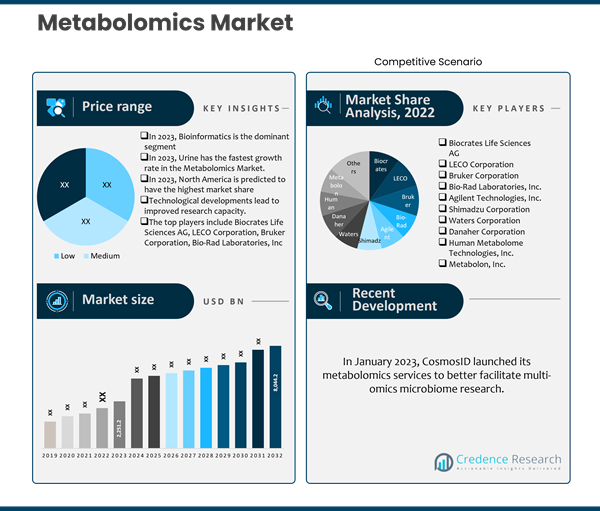
The global Metabolomics Market is segmented by Technology, Applications, Sample Types, End User, and region. In 2023, bioinformatics will be the leading segment, while pharmaceutical research will be in high demand. Furthermore, Mass Spectrometry (MS) is the Metabolomics Market's fastest-growing sector, and Clinical Metabolomics has the greatest market share. In contrast, Urine has the fastest growth rate in the Metabolomics Market, with North America leading the market growth.
The market's primary drivers are increasing demand for personalized medication and precision healthcare solutions, as well as an increased focus on early disease identification and prevention, which is boosting the adoption of metabolomics in healthcare. In addition, high costs associated with metabolomics research and technology limit market accessibility, as do ethical and regulatory concerns affecting the use of metabolomics data in therapeutic settings. The expansion of metabolomics applications in drug discovery and development, as well as rising investments in metabolomics research by pharmaceutical and biotechnology companies, are important opportunities for the market.
Nonetheless, North America has the largest market share. North America has a thriving biopharmaceutical and healthcare industry that invests much in R&D. This dynamic environment fuels demand for metabolomics technology in drug discovery and personalized medicine applications as pharmaceutical companies seek new ways to accelerate medication development and enhance patient outcomes. Furthermore, the Asia-Pacific market is expected to have the highest CAGR during the forecast period. The rising disease burden is expected to drive the constant exponential growth rate, increasing demand for therapeutic measures and effective diagnostic instruments.
What Are The Main Drivers Of The Global Metabolomics Market?
The Metabolomics Market is experiencing substantial expansion due to increased demand for personalized medicine and precision healthcare solutions. Analytical technology advancements are transforming metabolomics research, allowing for more in-depth understanding of metabolic pathways and biomarker discoveries. Furthermore, the market is benefiting from a greater emphasis on early disease identification and prevention, with metabolomics playing an important role in discovering biochemical fingerprints for a variety of medical diseases.
What Are The Major Challenges Faced By The Global Metabolomics Market?
The market has constraints such as the high prices of metabolomics research and technology, which may limit access for smaller research institutions and companies. Furthermore, challenges with data standards and interpretation impede the general adoption of metabolomics, preventing smooth integration into clinical practice. The utilization of metabolomics data in healthcare contexts raises ethical and regulatory problems, complicating market dynamics even more.
What Are The Growth Opportunities In The Global Metabolomics Market?
The Metabolomics Market offers tremendous potential for growth and innovation. The rise of metabolomics applications in drug discovery and development has enormous potential for identifying new therapeutic targets and optimizing treatment tactics. Furthermore, pharmaceutical and biotechnology businesses' increasing investments in metabolomics research point to a promising market growth trajectory.
Market Drivers
Increased frequency of chronic diseases
The growing global burden of chronic diseases such as diabetes, cardiovascular disease, and obesity is another major driver of the metabolomics market. Metabolomics is an effective method for early disease identification, risk assessment, and monitoring. Researchers and physicians can detect small changes in an individual's metabolic profile that may occur before a disease manifests clinically by studying metabolic biomarkers. This early warning system is critical for applying preventive measures, starting therapies at the onset of illness development, and tracking disease progression. Furthermore, as lifestyle variables contribute to the growth in chronic diseases, metabolomics can give insight on how food choices, physical activity, and environmental exposures affect an individual's metabolic health.
Market Restraints
The global Metabolomics Market faces some challenges that may hinder its growth. These include the following:
Regulatory challenges hinder Metabolomics Market growth
One key factor impeding the growth of the metabolomics industry is the regulatory challenge. Strict restrictions and high compliance requirements may impact the time and expense of developing and receiving product approval, hence slowing market growth by allowing novel metabolomic technologies or solutions to enter the market. Quick new product launches are frequently hampered by regulatory challenges. Hence, ironing out these regulatory impediments through more simplified processes and defining clear lines of authority will go a long way toward unlocking the true metabolomics market potential and inventing new concepts.
Opportunities
Advancements in personalized medicine
The rising importance of personalized treatment is a major driver of the metabolomics market. Healthcare is transitioning away from a one-size-fits-all strategy, and metabolomics is critical in personalizing medicines to specific patients. This trend is largely owing to the awareness that genetic differences alone cannot provide a complete picture of an individual's health. Metabolomics extends genetics by capturing dynamic changes in an individual's metabolic profile, which represent their unique response to diseases, medications, and environmental factors. As a result, metabolomics allows healthcare providers to make more exact diagnoses, choose individualized treatment options, and track therapeutic responses. For example, in cancer treatment, metabolomics can discover specific metabolic pathways that are dysregulated in a patient's tumor, allowing oncologists to select the most successful medicines.
Competitive Landscape
Key Players
The global Metabolomics Market is highly competitive, with several key players. Some of the major players in the market and their market share are as follows:
- Biocrates Life Sciences AG
- LECO Corporation
- Bruker Corporation
- Bio-Rad Laboratories, Inc.
- Agilent Technologies, Inc.
- Shimadzu Corporation
- Waters Corporation
- Danaher Corporation
- Human Metabolome Technologies, Inc.
- Metabolon, Inc.
- Others
These organizations prioritize product innovation, distribution channel expansion, and mergers and acquisitions to stay competitive.
The global Metabolomics Market's key players continually seek to stay ahead by offering new products and developments.
In June 2021, Bruker Corporation introduced the FluoroTypeSARS-CoV-2 Varied Q assay. This quantitative Liquid Array mid-plexPCR panel detects the presence of the virus and important mutations, allowing laboratories and hospitals to distinguish between major viral variants in positive samples regularly. In June 2021, Thermo Fischer Scientific introduced the Orbitrap IQ-X Tribrid mass spectrometer, the latest addition to their Next-Generation MS-Based Solutions lineup, which is specifically designed to reveal complicated chemical structures for accurate compound identification.
How are Companies Performing in the Metabolomics Market?
Recent developments and a focus on sustainability have pushed several companies, including startups, to show promising performance in the metabolomics market. Companies and startups in metabolomics are trying out new technologies and approaches that would give newer dimensions to metabolite analysis and, therefore, contribute to growth and evolution in the metabolomics market.
It has seen new analytical platforms, better data analytical tools, and company-research institution collaborations that can enable metabolomics research in different areas over recent years. Developments like this are, therefore making the sector move at higher speeds and are also opening up new avenues for companies in the market.
Another trend in the metabolomics market is an increasing focus on sustainability and carbon neutrality. Organizations across industries are increasingly shifting to green activities in their company operations, such as energy-efficient technologies, resource optimization, and green initiatives to reduce carbon footprint. So, through sustainability, companies involved in the metabolomics market are not only achieving a greener future but also contributing toward corporate social responsibility.
Summary of Key Findings
- Advancements in personalized medicine is the primary opportunity in the market.
- Market segmented by Technology, Applications, Sample Types, End User, and region.
- In the Metabolomics Market, blood and serum are the most common parts in 2023.
- Nutritional Metabolomics is the third most popular segment in the Metabolomics Market.
- North America is leading market growth; the market is highly competitive with key players including Biocrates Life Sciences AG, LECO Corporation, Bruker Corporation, Bio-Rad Laboratories, Inc and Others.
Future Outlook
- Continued increase fueled by personalized medicine trends.
- Technological developments lead to improved research capacity.
- Increased uses in drug discovery and precision healthcare.
- Increased investment in the pharmaceutical and biotechnology sectors.
- Integration with other omics technologies to provide comprehensive insights.
- Concentrate on data standardization and interpretation for broader use.
How CXOs Can Benefit from the Credence Research Metabolomics Market Report
The Credence Research Metabolomics Market Report provides CXOs with a comprehensive overview of the market, including:
- Market size and growth forecast:The report provides detailed estimates of the global Metabolomics Market size, segmented by Technology, Application, Sample Type, End User, and region. It also includes forecasts for the market through 2032 based on key trends and drivers.
- Market segmentation:The report segments the Metabolomics Market by Technology, Application, Sample Type, End User, and region. This segmentation provides CXOs with a granular understanding of the market and the opportunities in each segment.
- Competitive Landscape:The report profiles the key players in the Metabolomics Market and provides insights into their strategies, product offerings, and financial performance. This information can help CXOs to identify and assess their competition.
- Key trends and drivers:The report identifies and analyzes the key trends and drivers that are shaping the Metabolomics Market. This information can help CXOs to make informed decisions about their investments and strategies.
CXOs can use the insights from the Credence Research Metabolomics Market Report to:
- Identify growth opportunities:The report can help CXOs identify new growth opportunities in the Metabolomics Market. For example, by analyzing trends in popular segments like Pharmaceutical Research or Clinical Metabolomics, CXOs can strategize and capitalize on the high-demand areas.
- Make informed investment decisions:The report can help CXOs make informed investment decisions about Metabolomics. For example, the report may highlight the increasing adoption of Metabolomics in various industries, the projected market growth rate, key players in the market, and regulatory factors affecting the industry
- Develop competitive strategies:The report can help CXOs develop competitive strategies for their Metabolomics businesses. For example, the report may offer information on innovative use cases for metabolomics, potential partnerships or collaborations with other industry players, and strategies to differentiate products or services in the market.
- Track market developments:The report can help CXOs track market developments and stay ahead of the curve. For example, it can provide insights into regulatory changes affecting the Metabolomics industry, allowing CXOs to proactively adjust their strategies to comply with new regulations and maintain a competitive edge.
Overall, the Credence Research Metabolomics Market Report is a valuable resource for CXOs who are looking to gain a deeper understanding of the market and identify opportunities for growth.
Segmentation
-
Technology:
- Mass Spectrometry (MS)
- Nuclear Magnetic Resonance (NMR) Spectroscopy
- Metabolite Profiling
- Metabolite Identification
- Bioinformatics
-
Application:
- Clinical Metabolomics
- Pharmaceutical Research
- Nutritional Metabolomics
- Environmental Metabolomics
- Plant Metabolomics
- Microbial Metabolomics
- Toxicology and Drug Metabolism
-
Sample Type:
- Blood and Serum
- Urine
- Tissues
- Cell Culture
- Biofluids
-
End User:
- Academic and Research Institutes
- Pharmaceutical and Biotechnology Companies
- Clinical Laboratories
- Food and Beverage Industry
- Environmental Agencies
- Agrochemical Companies
- Cosmetics and Personal Care Industry
-
By Region
- North America
- US
- Canada
- Mexico
- Europe
- Germany
- France
- UK
- Italy
- Spain
- Rest of Europe
- Asia Pacific
- China
- Japan
- India
- South Korea
- South-east Asia
- Rest of Asia Pacific
- Latin America
- Brazil
- Argentina
- Rest of Latin America
- Middle East & Africa
- GCC Countries
- South Africa
- Rest of Middle East and Africa
- North America
Adjacent Markets
In the Metabolomics Market, there are several adjacent markets which have high revenue growth opportunities. The key adjacent markets for Metabolomics Market -
Adjacent Markets |
||
| Genomics Market | Microbiome Market | Precision Medicine Market |
| Proteomics Market | Pharmacogenomics Market | Bioinformatics Market |
| Transcriptomics Market | Biomarker Discovery Market | Personalized Medicine Market |
Request a Free Sample
Fill in your details and we'll send you a free sample report.
- Sample data tables & charts
- Research methodology
Need a Custom Version of This Report?
Tailor the scope, geography, or segments to your exact requirements.
- Custom geography or segment scope
- Direct access to our analyst team
Frequently Asked Questions
What is the current size of the global Metabolomics Market
What is the expected growth rate of the Metabolomics Market between 2024 and 2032?
Which segment is leading the market share in terms of End User?
Which Application segment governs the demand for Metabolomics in the world?
Which Sample Type segment is expected to post the fastest growth rate during the forecast period?
Which region is fueling the growth of the Metabolomics industry?
Who are the major players in the global Metabolomics Market?
What are the major market drivers of the Metabolomics industry?
What are the major market restraints of the Metabolomics industry?
What are the major market opportunities of the Metabolomics industry?
Table of Content
Chapter 1. Report Introduction
- 1.1 Report Description & Purpose
- 1.1.1 Report Title & Market Definition
- 1.1.2 Unique Selling Propositions (USP) & Key Differentiators
- 1.1.3 Value Proposition for Stakeholders
- 1.2 Research Objectives
- 1.2.1 Market Sizing Objectives (Volume & Revenue)
- 1.2.2 Segmentation Objectives
- 1.2.3 Competitive Intelligence Objectives
- 1.2.4 Forecast & Scenario Objectives
- 1.3 Report Scope
- 1.3.1 Metabolomics Scope – Types & Subtypes Covered
- 1.3.2 Geographic Scope – Regions & Countries Covered
- 1.3.3 Historical Period, Base Year & Forecast Period (2023; forecast to the forecast period)
- 1.3.4 Inclusions & Exclusions
- 1.4 HS Code & Classification Framework
- 1.5 Currency, Units & Pricing Basis
- 1.6 Target Stakeholders
- 1.7 Limitations & Assumptions
Chapter 2. Executive Summary
- 2.1 Global Metabolomics Market Snapshot
- 2.1.1 Market Size – Historical (2023) & Forecast (the forecast period) (2023: USD 2,251.2 Million → forecast year: USD 8,044.2 Million)
- 2.1.2 Volume & Revenue – Global Totals
- 2.1.3 Key Market Highlights – Top Five Facts
- 2.2 Metabolomics Market Segmentation Snapshot
- 2.2.1 Market Split by Region – 2023 vs.
- 2.3 Competitive Snapshot
- 2.3.1 Top 10 Players by Revenue Share – 2023
- 2.3.2 Top 10 Players by Volume Share – 2023
- 2.3.3 Recent Strategic Developments (18-Month Summary)
- 2.4 Key Investment Highlights & Strategic Conclusions
Chapter 3. Metabolomics Market Dynamics & Industry Analysis
- 3.1 Market Overview & Context
- 3.1.1 Metabolomics Market Position in the Broader Automotive Value Chain
- 3.1.2 OEM vs. Replacement Market Dynamics
- 3.1.3 Market Maturity & Development Stage by Region
- 3.2 Metabolomics Market Drivers
- 3.3 Metabolomics Market Restraints & Challenges
- 3.4 Metabolomics Market Opportunities
- 3.5 Porter's Five Forces Analysis
- 3.5.1 Threat of New Entrants
- 3.5.2 Bargaining Power of Suppliers
- 3.5.3 Bargaining Power of Buyers
- 3.5.4 Threat of Substitutes
- 3.5.5 Competitive Rivalry – Intensity Assessment
- 3.6 Metabolomics Value Chain Analysis
- 3.6.1 Upstream – Raw Material/Input Suppliers
- 3.6.1.1 Raw Material/Input 1
- 3.6.1.2 Raw Material/Input 2
- 3.6.1.3 Raw Material/Input 3
- 3.6.2 Midstream – Production/Manufacturing/Service Delivery
- 3.6.2.1 Production/Process Overview
- 3.6.2.2 Key Facility Locations & Capacity by Manufacturer
- 3.6.3 Downstream – Distribution & End Consumer
- 3.6.3.1 Primary Channel – B2B/OEM
- 3.6.3.2 Secondary Channels – Dealer, Retail, Online, Direct
- 3.6.4 Value Chain Profitability Analysis
- 3.6.1 Upstream – Raw Material/Input Suppliers
- 3.7 PESTEL Analysis
- 3.7.1 Political Factors
- 3.7.2 Economic Factors
- 3.7.3 Social Factors
- 3.7.4 Technological Factors
- 3.7.5 Environmental Factors
- 3.7.6 Legal Factors
- 3.8 Metabolomics Supply Chain Analysis
- 3.8.1 Raw Material/Input Supply Risk Assessment
- 3.8.2 Manufacturing Concentration Risk (Geographic Exposure)
- 3.8.3 Trade Disruption Impact Analysis
- 3.9 Regulatory & Policy Landscape
Note: The regulatory and policy landscape section covers regulations based on their applicability to the market, Metabolomics category, geography, and scope of the study. Only regulatory frameworks with a material impact on operations, compliance, trade, sustainability, or market access are analyzed in detail.
Chapter 4. Key Investment Pockets & Opportunity Analysis
- 4.1 Metabolomics Market Attractiveness Analysis
- 4.1.1 By Region – Investment Attractiveness Matrix (Volume × CAGR)
- 4.2 Absolute Revenue Growth Opportunity
- 4.2.1 By Region – Absolute USD Growth Through the forecast period
- 4.3 Incremental Volume Opportunity
- 4.3.1 By Region – Incremental Volume Through the forecast period
- 4.3.2 Segment – Incremental Volume
- 4.4 Emerging Submarket Opportunity Deep Dive (Subject to Applicability)
- 4.5 Emerging Market Opportunity Scorecards
- 4.5.1 United States
- 4.5.2 Europe
- 4.5.3 Asia
- 4.5.4 Middle East & Africa
Note: Emerging Market Opportunity Scorecards will be included based on relevance and strategic importance. Regions listed are indicative and may vary depending on data availability and market dynamics.
Chapter 5. Metabolomics Import-Export Analysis & Trade Flows
- 5.1 Global Trade Overview
- 5.1.1 Global Export Value by Country (2023)
- 5.1.2 Global Export Volume by Country (2023)
- 5.1.3 Global Import Value by Country (2023)
- 5.1.4 Global Import Volume by Country (2023)
- 5.1.5 Net Trade Balance by Country (2023)
- 5.2 Export Analysis – Segment
- 5.2.1 Type 1 (HS Code)
- 5.2.2 Type 2 (HS Code)
- 5.2.3 Type 3 (HS Code)
- 5.2.4 Type 4 (HS Code)
- 5.2.5 Type 5 (HS Code)
- 5.3 Import Analysis – Segment
- 5.3.1 Type 1 (HS Code)
- 5.3.2 Type 2 (HS Code)
- 5.3.3 Type 3 (HS Code)
- 5.3.4 Type 4 (HS Code)
- 5.3.5 Type 5 (HS Code)
- 5.4 Average Unit Trade Prices
- 5.4.1 Average Export Price – Segment & Country
- 5.4.2 Average Import Price – Segment & Source Country
- 5.4.3 Price Trends (2023)
- 5.5 Key Trade Route Analysis
- 5.5.1 Trade Route 1
- 5.5.2 Trade Route 2
- 5.5.3 Trade Route 3
- 5.5.4 Trade Route 4
- 5.5.5 Trade Route 5
- 5.6 Trade Policy Impact Assessment
- 5.6.1 US Anti-Dumping & Section 301 Tariffs
- 5.6.2 EU Customs Union Impact
- 5.6.3 Major Free Trade Agreements
- 5.6.4 USMCA Rules of Origin
Note: Trade policy analysis will be included only where relevant to the Metabolomics market.
Chapter 6. Competitive Landscape & Company Benchmarking
- 6.1 Metabolomics Market Concentration & Structure
- 6.1.1 Herfindahl-Hirschman Index (HHI) – vs. 2023
- 6.1.2 Tier 1, Tier 2 & Tier 3 Market Structure
- 6.1.3 Global, Regional & Local Player Dynamics
- 6.2 Metabolomics Market Share Analysis – 2023
- 6.2.1 Global Revenue Share by Company
- 6.2.2 Global Volume Share by Company
- 6.2.3 Regional Revenue Share
- 6.2.4 Market Share Evolution ( vs. 2023)
- 6.2.5 OEM Segment Share by Company
- 6.2.6 Replacement Segment Share by Company
- 6.3 Production/Delivery Capacity & Facility Analysis
- 6.3.1 Global Installed Capacity
- 6.3.2 Capacity Utilization Rates
- 6.3.3 Production/Output Volume
- 6.3.4 Facility Locations & Capacity Map
- 6.3.5 Planned Capacity Additions
- 6.4 Metabolomics Competitive Benchmarking Matrix
- 6.4.1 Revenue, Volume, CAGR & Profitability Comparison
- 6.4.2 Channel Revenue Mix
- 6.4.3 Geographic Revenue Exposure
- 6.4.4 R&D Intensity
- 6.4.5 Sustainability Maturity
- 6.5 Strategic Developments in Metabolomics (Last 24 Months)
- 6.5.1 Mergers, Acquisitions & Divestments
- 6.5.2 New Metabolomics Launches
- 6.5.3 Facility Expansions
- 6.5.4 Strategic Alliances, Joint Ventures & Partnerships
- 6.5.5 Distribution Expansion & Market Entry
- 6.5.6 Sustainability & ESG Initiatives
- 6.6 Competitive Strategy Mapping
- 6.6.1 Leader, Challenger, Follower & Niche Classification
- 6.6.2 Pricing Strategy Comparison
- 6.6.3 Channel Strategy Matrix
Note: Strategic developments are included based on their materiality and the availability of reliable information.
Chapter 7. Global Metabolomics Market – By Distribution Channel
- 7.1 Segment Overview
- 7.1.1 Volume & Revenue Split by Channel (2023 & )
- 7.1.2 Channel Mix Evolution (the forecast period)
Chapter 8. Regional Market Analysis – Global Overview
- 8.1 Global Regional Overview
- 8.1.1 Regional Volume Share
- 8.1.2 Regional Revenue Share
- 8.1.3 Regional Volume by Region
- 8.1.4 Regional Revenue by Region
- 8.1.5 Regional Forecast Through the forecast period
- 8.2 Cross-Regional Segment Analysis
- 8.2.1 By Distribution Channel
- 8.2.2 By Brand/Price Tier
Chapter 9. North America Metabolomics Market
- 9.1 United States
- 9.2 Canada
- 9.3 Mexico
Chapter 10. Europe Metabolomics Market
- 10.1 Germany
- 10.2 France
- 10.3 Italy
- 10.4 United Kingdom
- 10.5 Spain
- 10.6 Poland
- 10.7 Russia
- 10.8 Netherlands
- 10.9 Belgium
- 10.10 Sweden
- 10.11 Denmark
- 10.12 Norway
- 10.13 Rest of Europe
Chapter 11. Asia Pacific Metabolomics Market
- 11.1 China
- 11.2 India
- 11.3 Japan
- 11.4 South Korea
- 11.5 Thailand
- 11.6 Indonesia
- 11.7 Vietnam
- 11.8 Malaysia
- 11.9 Australia
- 11.10 Rest of Asia Pacific
Chapter 12. Latin America Metabolomics Market
- 12.1 Brazil
- 12.2 Argentina
- 12.3 Colombia
- 12.4 Chile
- 12.5 Rest of Latin America
Chapter 13. Middle East Metabolomics Market
- 13.1 Saudi Arabia
- 13.2 United Arab Emirates
- 13.3 Turkey
- 13.4 Israel
- 13.5 Iran
- 13.6 Rest of the Middle East
Chapter 14. Africa Metabolomics Market
- 14.1 South Africa
- 14.2 Egypt
- 14.3 Nigeria
- 14.4 Morocco
- 14.5 Rest of Africa
Chapter 15. Metabolomics Company Profiles
- 15.1 [Company 01]
- 15.1.1 Company Overview
- 15.1.2 Key Management Personnel
- 15.1.3 Products & Services Portfolio
- 15.1.4 Financial Performance
- 15.1.5 Key Market Focus & Geographic Presence
- 15.1.6 Recent Developments & Strategic Initiatives
Note: The company profile list is preliminary and may change based on research findings, market developments, data availability, and client requirements.
Chapter 16. Appendices
- Appendix A – List of Abbreviations & Acronyms
- Appendix B – Industry Classification Code Reference – Full Series
- Appendix C – Production & Capacity Data Tables
- Appendix D – End-Use & Demand Base Tables
- Appendix E – Consumption & Replacement Rate Assumptions
- Appendix F – ASP Reference Tables
- Appendix G – Manufacturing & Facility Database
- Appendix H – Import-Export Data Tables
- Appendix I – Regulatory Summary Tables
- Appendix J – Primary Research Participant List (Anonymized)
- Appendix K – Primary Research Questionnaire Framework
- Appendix L – Data Sources & Bibliography
- Appendix M – Market Size Divergence & Source Comparison
Chapter 17. Research Methodology
- 17.1 Research Framework & Philosophy
- 17.2 Secondary Research – Sources, Hierarchy & Data Extraction
- 17.3 Data Modeling – Bottom-Up & Top-Down Market Sizing
- 17.4 Primary Research – Stakeholder Framework, LOI & Sample Sizes
- 17.5 Forecast Methodology – Regression, Scenario & Sensitivity Analysis
- 17.6 Quality Control – Four-Layer Validation Framework
- 17.7 Limitations & Standard Assumptions
- 17.8 Disclaimer
