
Market Overview
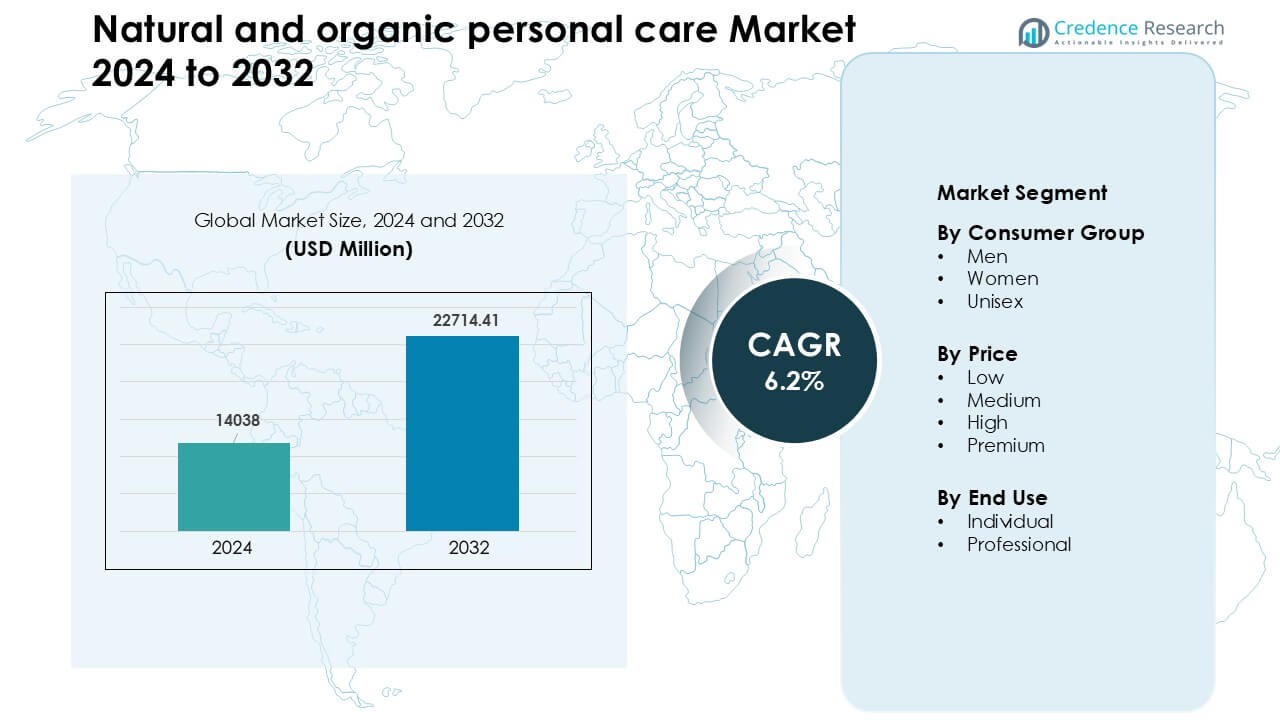
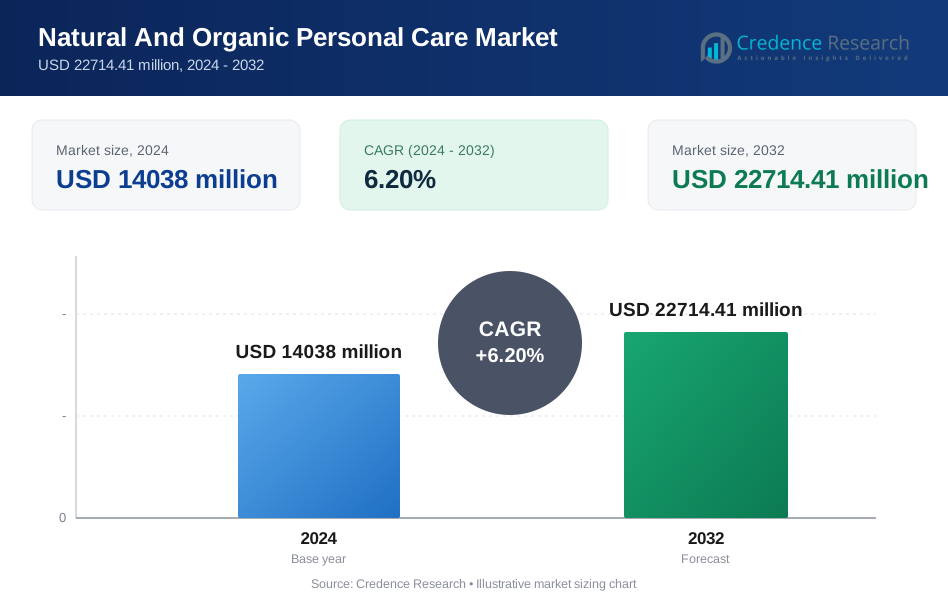
Natural and organic personal care Market was valued at USD 14038 million in 2024 and is anticipated to reach USD 22714.41 million by 2032, growing at a CAGR of 6.2% during the forecast period.
| REPORT ATTRIBUTE | DETAILS |
|---|---|
| Historical Period | 2020-2023 |
| Base Year | 2024 |
| Forecast Period | 2025-2032 |
| Natural And Organic Personal Care Market Size 2024 | USD 14038 Million |
| Natural And Organic Personal Care Market, CAGR | 6.2% |
| Natural And Organic Personal Care Market Size 2032 | USD 22714.41 Million |
The natural and organic personal care market is shaped by major players such as Herbivore Botanicals, Coty, L’Oréal, Burt’s Bees, Haus Labs, Estée Lauder, Josie Maran Cosmetics, Johnson & Johnson, Dr. Hauschka, and Beiersdorf, each expanding their clean-beauty portfolios through plant-based formulations, eco-friendly packaging, and transparent ingredient standards. These companies strengthen their reach through digital channels, retail partnerships, and product innovation across skincare, haircare, and wellness categories. North America emerged as the leading region in 2024 with about 34% share, supported by high consumer awareness, strong premium demand, and established clean-beauty retail ecosystems.
Market Insights
- The natural and organic personal care market reached USD 14038 million in 2024 and is projected to reach USD 22714.41 million by 2032, growing at a CAGR of about 6.2% during 2025–2032.
- Growth is driven by rising demand for clean-label, chemical-free products and stronger awareness of ingredient safety across skincare and haircare, with the women consumer group holding about 62% share.
- Key trends include rapid expansion of sustainable, cruelty-free, and eco-friendly formulations, along with rising adoption of premium botanical blends supported by strong e-commerce penetration.
- The competitive landscape features global leaders advancing plant-based R&D, strengthening digital channels, and expanding certified organic product lines across diverse price ranges.
- North America led the market with nearly 34% share in 2024, followed by Europe at around 28%, while Asia Pacific grew fastest; the medium-price segment held about 47% share, and individual use dominated with nearly 78% share.
Market Segmentation Analysis:
By Consumer Group
Women led this segment in 2024 with about 62% share, driven by strong demand for clean beauty, plant-based skincare, and toxin-free hair products. Female shoppers adopted natural and organic items faster due to higher awareness of ingredient safety and rising interest in eco-friendly routines. Brands expanded cruelty-free and botanical formulas that appealed to women seeking safer daily-use products. Men and unisex groups showed steady growth as targeted grooming lines, sulfate-free cleansers, and natural deodorants increased shelf presence, yet women remained ahead because of wider product ranges and higher purchase frequency.
- For instance, the Body Shop International Limited formally announced that by January 2024 its entire global portfolio had become 100% vegan covering over 1,000 products and more than 4,000 ingredients reinforcing women’s gravitation toward cruelty-free, plant-based care.
By Price
The medium price tier dominated the market in 2024 with roughly 47% share, supported by balanced affordability and quality. Consumers chose mid-range natural and organic products because these items offered clean formulations without premium markups. Retailers expanded private-label and mid-tier certified organic lines, which improved access for young adults and families. Low-price items gained traction in mass retail, while high and premium tiers grew among users seeking luxury botanical blends, but medium price held the lead due to strong distribution in supermarkets, pharmacies, and online platforms.
- For instance, the Face Shop positioned as an affordable / mid-tier K-clean beauty brand operated in over 30 countries by 2025, making mid-priced botanical skincare widely accessible across Asia, North America, and beyond.
By End Use
Individual use led this segment in 2024 with nearly 78% share, driven by rising interest in personal grooming, self-care, and daily organic skincare routines. Households preferred natural products for sensitive skin, sulfate-free cleansing, and chemical-free moisturization, boosting demand across all age groups. E-commerce played a key role by offering clean-label products with transparent ingredient lists. Professional use grew in salons, spas, and dermatology clinics as certified organic treatments gained trust, yet individual consumers stayed dominant due to higher purchase volume and frequent product replacement cycles.
Key Growth Drivers
Growing Health and Environmental Awareness
Health-conscious buyers seek products that limit toxin exposure and support long-term skin health. Rising concerns about allergies, hormonal disruptions, and irritation accelerated demand for safer, nature-derived formulations. Environmental awareness also shaped this growth, as consumers prefer biodegradable ingredients, cruelty-free practices, and eco-friendly packaging. Companies adopted sustainable sourcing programs and reduced plastic use to match these expectations. Climate awareness pushed buyers toward minimal-impact grooming routines, further driving natural product uptake. This combined focus on personal wellness and environmental responsibility improved consumer loyalty and encouraged brands to develop greener product lines that meet ethical and sustainability standards.
- For instance, O'right a haircare and skincare brand has used 100% post-consumer recycled plastic bottles and biodegradable caps for its packaging since adopting a circular-economy model, and reports that its recycling network has prevented 5 million bottles from going to landfills since 2017.
Rising Demand for Clean-Label and Chemical-Free Products
Consumers now prefer personal care products free from parabens, sulfates, phthalates, and synthetic fragrances. This shift increased demand for natural and organic formulas that offer safer daily use and reduced irritation risk. Shoppers also trust products with transparent labels and certified organic ingredients. Brands responded by reformulating legacy lines and launching plant-based ranges focused on skin-friendly botanicals. Awareness grew through social media, dermatology advice, and influencer-led discussions on ingredient safety. This preference strengthened sales across skincare, haircare, and hygiene products. Retailers also expanded clean-beauty shelves, which helped natural and organic brands gain mainstream adoption across global markets.
Expansion of E-Commerce and Direct-to-Consumer Channels
The e-commerce boom helped natural and organic personal care brands reach wider audiences. Online retailers offer large product choices, ingredient transparency, reviews, and fast delivery, which encouraged higher buying confidence. Small and mid-size brands used direct-to-consumer models to showcase sourcing practices, certifications, and clean-ingredient claims. Digital marketing, influencer engagement, and subscription boxes boosted repeat purchases. Cross-border online availability also expanded global demand, especially for niche botanical blends and organic skincare solutions. This digital shift improved accessibility in emerging markets and supported strong sales in premium and mid-range categories across all major personal care segments.
Key Trends & Opportunities
Rapid Adoption of Sustainable and Ethical Beauty
Sustainable beauty gained momentum as consumers demanded environmentally safe practices from ingredient sourcing to packaging. Brands shifted toward biodegradable formulas, renewable plant extracts, cruelty-free testing, and recyclable or refillable designs. Ethical sourcing certifications improved credibility and attracted eco-focused buyers. Many companies also invested in carbon-neutral operations, water-saving production, and renewable energy to strengthen sustainability commitments. These efforts aligned with global climate goals and shaped brand identity. As eco-friendly grooming gained cultural acceptance, the market saw strong opportunities in zero-waste packaging, farm-to-face products, and transparent supply-chain communication.
- For instance, O'right a hair- and skincare company switched in 2018 to using 100% post-consumer recycled plastic bottles and biodegradable caps for its packaging, and by 2020 it achieved carbon-neutral certification for its operations and for 77 individual products.
Growth in Premium Botanical and Functional Formulations
Consumers now seek multi-benefit natural products with clinically tested plant ingredients and functional actives. This trend opened opportunities for brands offering anti-aging botanicals, adaptogen-infused creams, microbiome-friendly skincare, and herbal scalp treatments. Demand rose for ingredients like niacinamide, hyaluronic acid, and vitamin C blended with organic extracts to deliver advanced skin results. Premium ranges attracted buyers seeking safety and performance, expanding opportunities in high-margin segments. This shift encouraged research investment in advanced plant-based formulations and supported innovation across luxury skincare, haircare, and wellness-driven personal care segments.
- For instance, a brand blending traditional herbal skincare with modern functional actives belif offers products such as its 7 Hyaluronic Frozen Serum & Multi Vitamin Mask combo, combining botanical-inspired skincare with clinically relevant actives like hyaluronic acid and vitamins.
Key Challenge
High Production Costs and Supply Constraints
Natural and organic products often rely on certified plant ingredients, sustainable farming, and traceable sourcing, which increase production costs. Variability in crop yields, climate impact, and seasonal supply disruptions affect ingredient availability and pricing. Many brands face cost pressure while maintaining clean-label standards and meeting organic certification rules. These challenges limit affordability in mass markets and slow adoption in price-sensitive regions. Smaller companies struggle more because they lack scale advantages, making product costs harder to manage. Balancing quality, certification compliance, and competitive pricing remains a major hurdle.
Regulatory Complexity and Certification Barriers
The market faces inconsistent regulations across countries, making certification and compliance difficult. Terms like “natural” and “organic” lack universal definitions, causing confusion among consumers and manufacturers. Brands must navigate varying global standards, including COSMOS, USDA Organic, and ECOCERT, each with separate rules and documentation. Meeting these requirements increases time, cost, and operational effort. Mislabeling risks also threaten brand trust and regulatory action. These hurdles create barriers for new entrants and slow product launches, especially for brands operating in multiple international markets.
Regional Analysis
North America
North America held the leading position in 2024 with nearly 34% share, supported by strong consumer awareness of clean beauty and high spending on premium natural skincare and haircare. Buyers in the U.S. and Canada preferred toxin-free, plant-based products with transparent labeling and certified organic ingredients. Retailers expanded clean-beauty aisles, while e-commerce platforms boosted access to niche botanical brands. Dermatologist recommendations and growing concern over synthetic chemicals strengthened demand. Brands focused on eco-friendly packaging and sustainable sourcing, helping natural and organic personal care products maintain steady growth across all major distribution channels.
Europe
Europe accounted for about 28% share in 2024, driven by strict ingredient regulations and high adoption of certified organic personal care products. Germany, France, and the U.K. led demand due to strong preference for sustainable formulations and cruelty-free standards. Regional buyers valued clear labeling, ethical sourcing, and biodegradable ingredients, which pushed companies to meet COSMOS and ECOCERT criteria. Specialty stores and pharmacies drove sales alongside fast-growing e-commerce channels. Rising interest in low-waste packaging and eco-friendly grooming routines further strengthened the region’s position in natural and organic personal care consumption.
Asia Pacific
Asia Pacific captured around 26% share in 2024 and emerged as the fastest-growing region, supported by rising disposable income, higher beauty consciousness, and strong influence from K-beauty and J-beauty trends. Consumers in China, Japan, South Korea, and India increased purchases of botanical, herbal, and chemical-free skincare. Younger demographics fueled demand through social media and ingredient-based product selection. Local brands expanded herbal formulations using native plant extracts, while global players increased regional penetration. Rapid e-commerce adoption and wider availability in specialty stores boosted natural and organic personal care sales across the region.
Latin America
Latin America held close to 7% share in 2024, driven by rising interest in herbal and plant-derived ingredients across Brazil, Mexico, and Argentina. Consumers preferred natural moisturizers, hair oils, and organic hygiene products that suit regional climate and skin needs. Growing awareness about harmful chemicals supported steady adoption of eco-friendly grooming routines. Local manufacturers used native botanicals like aloe, babassu, and yerba mate to broaden product lines. Although premium segments grew slower due to pricing sensitivity, e-commerce platforms improved accessibility and supported gradual expansion of natural and organic personal care products.
Middle East & Africa
The Middle East & Africa region accounted for nearly 5% share in 2024, with rising demand for natural oils, herbal skincare, and organic haircare products. Consumers in the UAE, Saudi Arabia, and South Africa showed growing interest in chemical-free grooming solutions due to rising skin-sensitivity concerns and hotter climates. Retailers increased offerings of clean-label international brands, while local producers introduced formulations based on argan, shea, and black seed oils. Despite limited awareness in some areas, higher tourism, premium retail expansion, and online channels supported the region’s steady growth in natural and organic personal care adoption.
Market Segmentations:
By Consumer Group
- Men
- Women
- Unisex
By Price
- Low
- Medium
- High
- Premium
By End Use
- Individual
- Professional
By Geography
- North America
- U.S.
- Canada
- Mexico
- Europe
- Germany
- France
- U.K.
- Italy
- Spain
- Rest of Europe
- Asia Pacific
- China
- Japan
- India
- South Korea
- South-east Asia
- Rest of Asia Pacific
- Latin America
- Brazil
- Argentina
- Rest of Latin America
- Middle East & Africa
- GCC Countries
- South Africa
- Rest of the Middle East and Africa
Competitive Landscape
The competitive landscape of the natural and organic personal care market features leading brands such as Herbivore Botanicals, Coty, L’Oréal, Burt’s Bees, Haus Labs, Estée Lauder, Josie Maran Cosmetics, Johnson & Johnson, Dr. Hauschka, and Beiersdorf, each strengthening their presence through clean formulations, sustainable sourcing, and transparent ingredient policies. Companies invest in plant-based actives, cruelty-free testing, and eco-friendly packaging to meet rising consumer expectations. Many brands expand through digital channels, influencer partnerships, and targeted product lines for skincare, haircare, and wellness. Mergers, acquisitions, and strategic collaborations help global players widen portfolios and enter niche botanical categories. Firms also focus on certification standards such as COSMOS and ECOCERT to enhance credibility. Growing demand for toxin-free, vegan, and ethically sourced products encourages companies to accelerate R&D in advanced botanical blends. Competitive intensity increases as both established beauty houses and emerging clean-beauty startups innovate to capture larger market share.
Key Player Analysis
- Herbivore Botanicals
- Coty
- L'Oréal
- Burt's Bees
- Haus Labs
- Estée Lauder
- Josie Maran Cosmetics
- Johnson & Johnson
- Hauschka
- Beiersdorf
Recent Developments
- In November 2025, L’Oréal took a minority stake in a mass-market Chinese skincare brand (Lan), indicating a strategic push in Asia a region where natural/organic and “clean beauty” demand is rising.
- In December 2024, ELC opened a new BioTech Hub near Oevel, Belgium, focused on in‑house manufacturing of bio‑based raw materials (from plants, yeast, bacteria). This supports a pivot toward more sustainable ingredient sourcing for skincare and personal‑care products, reducing reliance on traditional biomass/natural‑resource extraction.
- In March 2024, Dr. Hauschka introduced new Regenerating serums in Singapore for mature skin. All products remain NATRUE-certified, using organic, biodynamic botanicals and fair, sustainable sourcing.
Report Coverage
The research report offers an in-depth analysis based on Consumer Group, Price, End-Use and Geography. It details leading market players, providing an overview of their business, product offerings, investments, revenue streams, and key applications. Additionally, the report includes insights into the competitive environment, SWOT analysis, current market trends, as well as the primary drivers and constraints. Furthermore, it discusses various factors that have driven market expansion in recent years. The report also explores market dynamics, regulatory scenarios, and technological advancements that are shaping the industry. It assesses the impact of external factors and global economic changes on market growth. Lastly, it provides strategic recommendations for new entrants and established companies to navigate the complexities of the market.
Future Outlook
- The market will grow as consumers shift toward clean and transparent ingredient profiles.
- Demand for sustainable and ethically sourced formulations will strengthen across all age groups.
- E-commerce will drive higher global adoption through wider access and faster product discovery.
- Brands will expand premium botanical and functional skincare lines to meet rising performance expectations.
- Certifications like COSMOS and ECOCERT will become more important for credibility and differentiation.
- Eco-friendly and refillable packaging solutions will gain stronger traction in major markets.
- Herbal and plant-extract innovations will accelerate as companies invest more in R&D.
- Emerging markets will adopt natural personal care faster due to rising health awareness.
- Digital influencers and dermatology-backed content will guide consumer choices more strongly.
- Competition will intensify as global companies and clean-beauty startups expand their
Request a Free Sample
Fill in your details and we'll send you a free sample report.
- Sample data tables & charts
- Research methodology
Need a Custom Version of This Report?
Tailor the scope, geography, or segments to your exact requirements.
- Custom geography or segment scope
- Direct access to our analyst team
Frequently Asked Questions
What is the current market size for natural and organic personal care market, and what is its projected size in 2032?
At what Compound Annual Growth Rate is natural and organic personal care market projected to grow between 2024 and 2032?
Which natural and organic personal care market segment held the largest share in 2024?
What are the primary factors fueling the growth of natural and organic personal care market?
Who are the leading companies in natural and organic personal care market?
Which region commanded the largest share of natural and organic personal care market?
Table of Content
Chapter 1. Report Introduction
- 1.1 Report Description & Purpose
- 1.1.1 Report Title & Market Definition
- 1.1.2 Unique Selling Propositions (USP) & Key Differentiators
- 1.1.3 Value Proposition for Stakeholders
- 1.2 Research Objectives
- 1.2.1 Market Sizing Objectives (Volume & Revenue)
- 1.2.2 Segmentation Objectives
- 1.2.3 Competitive Intelligence Objectives
- 1.2.4 Forecast & Scenario Objectives
- 1.3 Report Scope
- 1.3.1 Natural And Organic Personal Care Scope – Types & Subtypes Covered
- 1.3.2 Geographic Scope – Regions & Countries Covered
- 1.3.3 Historical Period, Base Year & Forecast Period (2024; forecast to 2032)
- 1.3.4 Inclusions & Exclusions
- 1.4 HS Code & Classification Framework
- 1.5 Currency, Units & Pricing Basis
- 1.6 Target Stakeholders
- 1.7 Limitations & Assumptions
Chapter 2. Executive Summary
- 2.1 Global Natural And Organic Personal Care Market Snapshot
- 2.1.1 Market Size – Historical (2024) & Forecast (2024-2032) (2024: USD 14038 million → 2032: USD 22714.41 million)
- 2.1.2 Volume & Revenue – Global Totals
- 2.1.3 Key Market Highlights – Top Five Facts
- 2.2 Natural And Organic Personal Care Market Segmentation Snapshot
- 2.2.1 Market Split by Region – 2024 vs. 2032
- 2.3 Competitive Snapshot
- 2.3.1 Top 10 Players by Revenue Share – 2024
- 2.3.2 Top 10 Players by Volume Share – 2024
- 2.3.3 Recent Strategic Developments (18-Month Summary)
- 2.4 Key Investment Highlights & Strategic Conclusions
Chapter 3. Natural And Organic Personal Care Market Dynamics & Industry Analysis
- 3.1 Market Overview & Context
- 3.1.1 Natural And Organic Personal Care Market Position in the Broader Automotive Value Chain
- 3.1.2 OEM vs. Replacement Market Dynamics
- 3.1.3 Market Maturity & Development Stage by Region
- 3.2 Natural And Organic Personal Care Market Drivers
- 3.3 Natural And Organic Personal Care Market Restraints & Challenges
- 3.4 Natural And Organic Personal Care Market Opportunities
- 3.5 Porter's Five Forces Analysis
- 3.5.1 Threat of New Entrants
- 3.5.2 Bargaining Power of Suppliers
- 3.5.3 Bargaining Power of Buyers
- 3.5.4 Threat of Substitutes
- 3.5.5 Competitive Rivalry – Intensity Assessment
- 3.6 Natural And Organic Personal Care Value Chain Analysis
- 3.6.1 Upstream – Raw Material/Input Suppliers
- 3.6.1.1 Raw Material/Input 1
- 3.6.1.2 Raw Material/Input 2
- 3.6.1.3 Raw Material/Input 3
- 3.6.2 Midstream – Production/Manufacturing/Service Delivery
- 3.6.2.1 Production/Process Overview
- 3.6.2.2 Key Facility Locations & Capacity by Manufacturer
- 3.6.3 Downstream – Distribution & End Consumer
- 3.6.3.1 Primary Channel – B2B/OEM
- 3.6.3.2 Secondary Channels – Dealer, Retail, Online, Direct
- 3.6.4 Value Chain Profitability Analysis
- 3.6.1 Upstream – Raw Material/Input Suppliers
- 3.7 PESTEL Analysis
- 3.7.1 Political Factors
- 3.7.2 Economic Factors
- 3.7.3 Social Factors
- 3.7.4 Technological Factors
- 3.7.5 Environmental Factors
- 3.7.6 Legal Factors
- 3.8 Natural And Organic Personal Care Supply Chain Analysis
- 3.8.1 Raw Material/Input Supply Risk Assessment
- 3.8.2 Manufacturing Concentration Risk (Geographic Exposure)
- 3.8.3 Trade Disruption Impact Analysis
- 3.9 Regulatory & Policy Landscape
Note: The regulatory and policy landscape section covers regulations based on their applicability to the market, Natural And Organic Personal Care category, geography, and scope of the study. Only regulatory frameworks with a material impact on operations, compliance, trade, sustainability, or market access are analyzed in detail.
Chapter 4. Key Investment Pockets & Opportunity Analysis
- 4.1 Natural And Organic Personal Care Market Attractiveness Analysis
- 4.1.1 By Region – Investment Attractiveness Matrix (Volume × CAGR)
- 4.2 Absolute Revenue Growth Opportunity
- 4.2.1 By Region – Absolute USD Growth Through 2032
- 4.3 Incremental Volume Opportunity
- 4.3.1 By Region – Incremental Volume Through 2032
- 4.3.2 Segment – Incremental Volume
- 4.4 Emerging Submarket Opportunity Deep Dive (Subject to Applicability)
- 4.5 Emerging Market Opportunity Scorecards
- 4.5.1 United States
- 4.5.2 Europe
- 4.5.3 Asia
- 4.5.4 Middle East & Africa
Note: Emerging Market Opportunity Scorecards will be included based on relevance and strategic importance. Regions listed are indicative and may vary depending on data availability and market dynamics.
Chapter 5. Natural And Organic Personal Care Import-Export Analysis & Trade Flows
- 5.1 Global Trade Overview
- 5.1.1 Global Export Value by Country (2024)
- 5.1.2 Global Export Volume by Country (2024)
- 5.1.3 Global Import Value by Country (2024)
- 5.1.4 Global Import Volume by Country (2024)
- 5.1.5 Net Trade Balance by Country (2024)
- 5.2 Export Analysis – Segment
- 5.2.1 Type 1 (HS Code)
- 5.2.2 Type 2 (HS Code)
- 5.2.3 Type 3 (HS Code)
- 5.2.4 Type 4 (HS Code)
- 5.2.5 Type 5 (HS Code)
- 5.3 Import Analysis – Segment
- 5.3.1 Type 1 (HS Code)
- 5.3.2 Type 2 (HS Code)
- 5.3.3 Type 3 (HS Code)
- 5.3.4 Type 4 (HS Code)
- 5.3.5 Type 5 (HS Code)
- 5.4 Average Unit Trade Prices
- 5.4.1 Average Export Price – Segment & Country
- 5.4.2 Average Import Price – Segment & Source Country
- 5.4.3 Price Trends (2024)
- 5.5 Key Trade Route Analysis
- 5.5.1 Trade Route 1
- 5.5.2 Trade Route 2
- 5.5.3 Trade Route 3
- 5.5.4 Trade Route 4
- 5.5.5 Trade Route 5
- 5.6 Trade Policy Impact Assessment
- 5.6.1 US Anti-Dumping & Section 301 Tariffs
- 5.6.2 EU Customs Union Impact
- 5.6.3 Major Free Trade Agreements
- 5.6.4 USMCA Rules of Origin
Note: Trade policy analysis will be included only where relevant to the Natural And Organic Personal Care market.
Chapter 6. Competitive Landscape & Company Benchmarking
- 6.1 Natural And Organic Personal Care Market Concentration & Structure
- 6.1.1 Herfindahl-Hirschman Index (HHI) – vs. 2024
- 6.1.2 Tier 1, Tier 2 & Tier 3 Market Structure
- 6.1.3 Global, Regional & Local Player Dynamics
- 6.2 Natural And Organic Personal Care Market Share Analysis – 2024
- 6.2.1 Global Revenue Share by Company
- 6.2.2 Global Volume Share by Company
- 6.2.3 Regional Revenue Share
- 6.2.4 Market Share Evolution ( vs. 2024)
- 6.2.5 OEM Segment Share by Company
- 6.2.6 Replacement Segment Share by Company
- 6.3 Production/Delivery Capacity & Facility Analysis
- 6.3.1 Global Installed Capacity
- 6.3.2 Capacity Utilization Rates
- 6.3.3 Production/Output Volume
- 6.3.4 Facility Locations & Capacity Map
- 6.3.5 Planned Capacity Additions
- 6.4 Natural And Organic Personal Care Competitive Benchmarking Matrix
- 6.4.1 Revenue, Volume, CAGR & Profitability Comparison
- 6.4.2 Channel Revenue Mix
- 6.4.3 Geographic Revenue Exposure
- 6.4.4 R&D Intensity
- 6.4.5 Sustainability Maturity
- 6.5 Strategic Developments in Natural And Organic Personal Care (Last 24 Months)
- 6.5.1 Mergers, Acquisitions & Divestments
- 6.5.2 New Natural And Organic Personal Care Launches
- 6.5.3 Facility Expansions
- 6.5.4 Strategic Alliances, Joint Ventures & Partnerships
- 6.5.5 Distribution Expansion & Market Entry
- 6.5.6 Sustainability & ESG Initiatives
- 6.6 Competitive Strategy Mapping
- 6.6.1 Leader, Challenger, Follower & Niche Classification
- 6.6.2 Pricing Strategy Comparison
- 6.6.3 Channel Strategy Matrix
Note: Strategic developments are included based on their materiality and the availability of reliable information.
Chapter 7. Global Natural And Organic Personal Care Market – By Distribution Channel
- 7.1 Segment Overview
- 7.1.1 Volume & Revenue Split by Channel (2024 & 2032)
- 7.1.2 Channel Mix Evolution (2024-2032)
Chapter 8. Regional Market Analysis – Global Overview
- 8.1 Global Regional Overview
- 8.1.1 Regional Volume Share
- 8.1.2 Regional Revenue Share
- 8.1.3 Regional Volume by Region
- 8.1.4 Regional Revenue by Region
- 8.1.5 Regional Forecast Through 2032
- 8.2 Cross-Regional Segment Analysis
- 8.2.1 By Distribution Channel
- 8.2.2 By Brand/Price Tier
Chapter 9. North America Natural And Organic Personal Care Market
- 9.1 United States
- 9.2 Canada
- 9.3 Mexico
Chapter 10. Europe Natural And Organic Personal Care Market
- 10.1 Germany
- 10.2 France
- 10.3 Italy
- 10.4 United Kingdom
- 10.5 Spain
- 10.6 Poland
- 10.7 Russia
- 10.8 Netherlands
- 10.9 Belgium
- 10.10 Sweden
- 10.11 Denmark
- 10.12 Norway
- 10.13 Rest of Europe
Chapter 11. Asia Pacific Natural And Organic Personal Care Market
- 11.1 China
- 11.2 India
- 11.3 Japan
- 11.4 South Korea
- 11.5 Thailand
- 11.6 Indonesia
- 11.7 Vietnam
- 11.8 Malaysia
- 11.9 Australia
- 11.10 Rest of Asia Pacific
Chapter 12. Latin America Natural And Organic Personal Care Market
- 12.1 Brazil
- 12.2 Argentina
- 12.3 Colombia
- 12.4 Chile
- 12.5 Rest of Latin America
Chapter 13. Middle East Natural And Organic Personal Care Market
- 13.1 Saudi Arabia
- 13.2 United Arab Emirates
- 13.3 Turkey
- 13.4 Israel
- 13.5 Iran
- 13.6 Rest of the Middle East
Chapter 14. Africa Natural And Organic Personal Care Market
- 14.1 South Africa
- 14.2 Egypt
- 14.3 Nigeria
- 14.4 Morocco
- 14.5 Rest of Africa
Chapter 15. Natural And Organic Personal Care Company Profiles
- 15.1 [Company 01]
- 15.1.1 Company Overview
- 15.1.2 Key Management Personnel
- 15.1.3 Products & Services Portfolio
- 15.1.4 Financial Performance
- 15.1.5 Key Market Focus & Geographic Presence
- 15.1.6 Recent Developments & Strategic Initiatives
Note: The company profile list is preliminary and may change based on research findings, market developments, data availability, and client requirements.
Chapter 16. Appendices
- Appendix A – List of Abbreviations & Acronyms
- Appendix B – Industry Classification Code Reference – Full Series
- Appendix C – Production & Capacity Data Tables
- Appendix D – End-Use & Demand Base Tables
- Appendix E – Consumption & Replacement Rate Assumptions
- Appendix F – ASP Reference Tables
- Appendix G – Manufacturing & Facility Database
- Appendix H – Import-Export Data Tables
- Appendix I – Regulatory Summary Tables
- Appendix J – Primary Research Participant List (Anonymized)
- Appendix K – Primary Research Questionnaire Framework
- Appendix L – Data Sources & Bibliography
- Appendix M – Market Size Divergence & Source Comparison
Chapter 17. Research Methodology
- 17.1 Research Framework & Philosophy
- 17.2 Secondary Research – Sources, Hierarchy & Data Extraction
- 17.3 Data Modeling – Bottom-Up & Top-Down Market Sizing
- 17.4 Primary Research – Stakeholder Framework, LOI & Sample Sizes
- 17.5 Forecast Methodology – Regression, Scenario & Sensitivity Analysis
- 17.6 Quality Control – Four-Layer Validation Framework
- 17.7 Limitations & Standard Assumptions
- 17.8 Disclaimer
