
Optogenetics Market Overview:
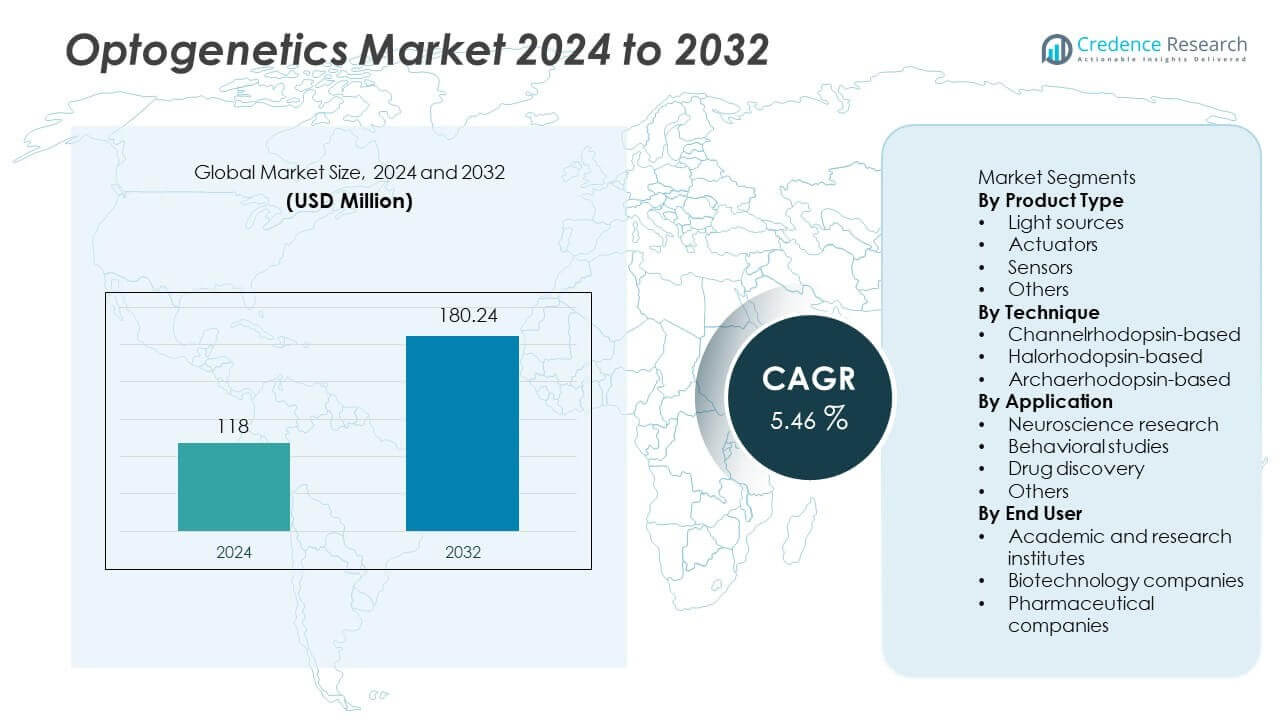
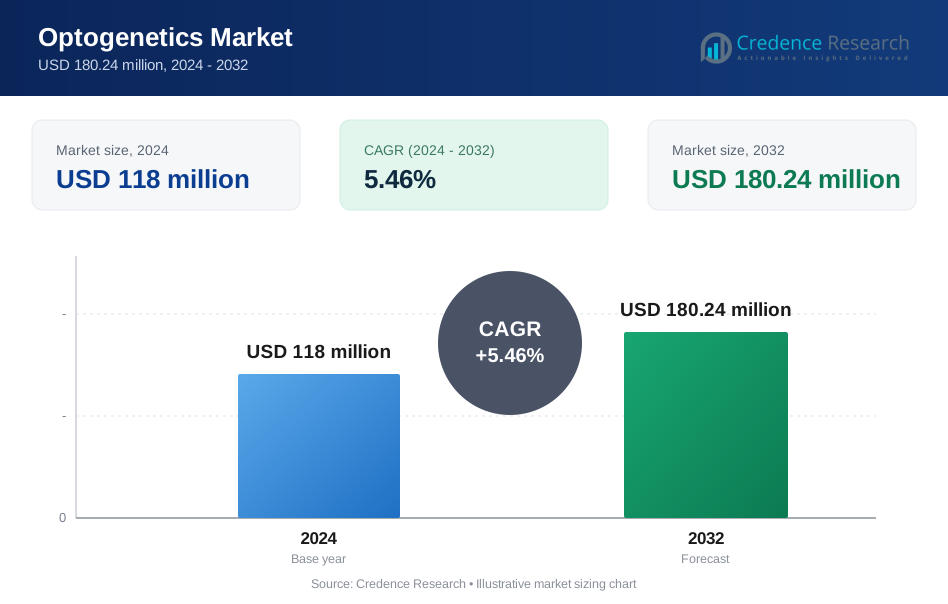
According to Credence research the Optogenetics market size was valued at USD 118 million in 2024 and is anticipated to reach USD 180.24 million by 2032, growing at a CAGR of 5.46% during the forecast period. (Credence Research)
| REPORT ATTRIBUTE | DETAILS |
|---|---|
| Historical Period | 2020-2023 |
| Base Year | 2024 |
| Forecast Period | 2025-2032 |
| Optogenetics Market Size 2024 | USD 118 million |
| Optogenetics Market, CAGR | 5.46% |
| Optogenetics Market Size 2032 | USD 180.24 million |
The Optogenetics market is driven by key players such as Thorlabs, Inc., Coherent Corp., Bruker Corporation, Inscopix, Inc., Plexon Inc., Scientifica Ltd., GenSight Biologics, Addgene, NeuroLux, Inc., and Noldus Information Technology. These companies compete through advanced optical systems, genetic tools, and integrated neuroscience platforms. Strong focus on research partnerships and technology innovation shapes competition. Product reliability and experimental precision remain key differentiators. Regionally, North America leads the Optogenetics market with a 39% market share, supported by strong neuroscience research funding, advanced laboratory infrastructure, and widespread adoption across academic and research institutes. Government-backed brain research programs and active industry–academia collaboration continue reinforcing regional leadership.
Optogenetics Market Insights
- Market growth is driven by rising investment in brain research and neurological disorder studies, with neuroscience research leading applications at a 54% market share due to high academic and public funding.
- Key trends include advancement in genetic actuators and optical systems, while competition remains innovation focused as key players strengthen research collaborations and integrated platform offerings.
- Market restraints include high equipment costs, technical complexity, and ethical limitations related to genetic manipulation, which restrict adoption beyond specialized research settings.
- Regionally, North America leads with a 39% market share, followed by Europe at 28%, Asia Pacific at 22%, Latin America at 7%, and the Middle East and Africa at 4%, reflecting differences in research funding and infrastructure.
Optogenetics Market Segmentation Analysis:
By Product Type
The by product type segment reflects the core hardware and biological tools used in optogenetics research. Actuators dominated this segment, holding a 41% market share in 2024. Researchers rely on actuators, such as light-sensitive ion channels, to precisely control neuronal activity. Strong demand comes from neuroscience laboratories conducting circuit-level studies. Continuous development of genetically encoded actuators improves signal specificity and response speed. Light sources follow due to their essential role in stimulation. Sensors support activity recording but show lower adoption. Actuators remain dominant because they directly enable functional manipulation, which is central to optogenetics research workflows.
- For instance, Addgene distributed more than 4,200 optogenetic actuator plasmids globally in a single year, supporting reproducible neuronal control experiments.
By Technique
The by technique segment highlights differences in neural activation and inhibition methods. Channelrhodopsin-based techniques led the segment with a 48% market share in 2024. These techniques allow rapid activation of neurons with high temporal precision. Widespread validation in neuroscience research supports strong adoption. Channelrhodopsins are easier to express and control compared to other opsins. Halorhodopsin-based techniques follow due to their inhibitory function. Archaerhodopsin-based methods show niche usage. Channelrhodopsin dominance is driven by versatility, reliability, and extensive use in brain mapping and functional connectivity studies.
- For instance, Thorlabs developed high-speed LED systems capable of delivering sub-1 millisecond optical pulses, enabling precise channelrhodopsin stimulation in behavioral studies.
By Application
The by application segment is driven by research focus areas and funding availability. Neuroscience research accounted for a 54% market share in 2024, making it the leading application. Optogenetics enables precise investigation of neural circuits and brain disorders. Academic and government research funding strongly supports neuroscience projects. The technique plays a key role in studying neurodegenerative and psychiatric conditions. Behavioral studies follow, supported by animal model research. Drug discovery shows emerging adoption. Neuroscience research remains dominant due to high experimental value, expanding brain research initiatives, and growing interest in targeted neural modulation technologies.
Key Growth Drivers
Growing Investment in Neuroscience Research
Rising global investment in brain research strongly drives the optogenetics market. Governments and research institutions prioritize understanding neural circuits and brain disorders. Optogenetics offers precise control of neuronal activity, supporting advanced experimentation. Funding programs support equipment upgrades and tool adoption. Academic laboratories increasingly integrate optogenetic techniques. Research on neurodegenerative and psychiatric disorders expands demand. Collaborative research initiatives further accelerate adoption. Advanced models require high-precision tools. Continuous funding availability sustains long-term market growth.
- For instance, the U.S. BRAIN Initiative funded more than 600 neuroscience projects and supported over 1,000 research laboratories with advanced neural tools, including optogenetic systems.
Advancements in Genetic Engineering and Optical Technologies
Technological progress improves optogenetic tool performance. Genetic engineering enhances actuator sensitivity and specificity. Improved light sources enable better spatial control. Miniaturized devices support complex experiments. Faster response times improve experimental accuracy. Integration with imaging technologies strengthens data quality. Researchers gain deeper insights into neural behavior. Innovation lowers experimental limitations. Technology advancements remain a core growth driver across optogenetics research applications.
- For instance, Coherent developed optically pumped semiconductor lasers delivering stable blue output, enabling precise optogenetic stimulation.
Rising Focus on Brain Disorder Research
Increasing prevalence of neurological disorders drives optogenetics adoption. Researchers study disease mechanisms at the circuit level. Optogenetics enables targeted stimulation and inhibition. This precision supports better disease modeling. Research into epilepsy, Parkinson’s disease, and depression expands. Pharmaceutical interest grows in mechanism validation. Translational research bridges lab findings and therapy development. Disease-focused studies increase tool demand. Brain health priorities support market expansion.
Key Trends & Opportunities
Expansion of Applications Beyond Basic Research
Optogenetics applications extend beyond fundamental neuroscience. Behavioral science studies gain momentum. Drug discovery programs adopt optogenetic screening tools. Vision restoration research shows growing interest. Cross-disciplinary studies expand usage scope. Industrial research partnerships increase adoption. Broader applications create new revenue streams. Emerging use cases attract investment. Application diversification presents strong growth opportunities.
- For instance, GenSight Biologics advanced its optogenetic vision therapy by delivering GS030 to patients with retinitis pigmentosa during clinical trials, enabling measurable light perception responses.
Integration with Advanced Imaging and AI Tools
Integration with imaging technologies enhances experimental insights. Combined systems allow real-time monitoring and control. AI-driven analysis improves data interpretation. Automation supports high-throughput experimentation. Multimodal platforms gain preference in labs. Enhanced integration improves research efficiency. Vendors develop bundled solutions. Technology convergence creates differentiation opportunities. This trend strengthens long-term market potential.
- For instance, Inscopix developed miniature fluorescence microscopes capable of recording activity from over 1,000 neurons simultaneously while supporting optogenetic stimulation.
Key Challenges
High Cost and Technical Complexity
Optogenetics systems require significant investment. Specialized equipment increases setup costs. Genetic modification processes add complexity. Skilled personnel remain essential for operation. Smaller laboratories face budget constraints. Training requirements limit rapid adoption. Maintenance costs add financial pressure. Cost barriers restrict widespread use. Complexity remains a key challenge.
Ethical and Translational Limitations
Ethical concerns affect experimental design. Genetic manipulation raises regulatory scrutiny. Translation from animal models to humans remains limited. Clinical application faces biological challenges. Long-term safety requires validation. Regulatory approvals remain complex. Ethical review processes slow research timelines. These limitations affect commercialization prospects. Ethical and translational barriers constrain market growth.
Regional Analysis
North America
North America led the Optogenetics market with a 39% market share in 2024, supported by strong neuroscience research funding and advanced laboratory infrastructure. The United States drives regional demand through government-backed brain research initiatives. Academic institutions widely adopt optogenetic tools for neural circuit studies. Presence of leading research universities supports innovation. High availability of skilled researchers improves technology utilization. Integration of optogenetics with imaging platforms strengthens research output. Biotechnology collaborations further boost adoption. Continuous investment in neurological disorder research sustains North America’s leadership in the optogenetics market.
Europe
Europe accounted for a 28% market share in 2024, driven by strong academic research and public funding support. Countries such as Germany, the United Kingdom, and France lead regional adoption. European research programs emphasize brain mapping and neurodegenerative disease studies. Universities actively invest in advanced optogenetic systems. Collaborative research networks enhance technology diffusion. Ethical research frameworks support controlled experimentation. Integration with translational neuroscience remains a priority. Growing focus on behavioral and cognitive studies supports steady market growth across the European optogenetics landscape.
Asia Pacific
Asia Pacific held a 22% market share in 2024, supported by expanding research infrastructure and rising neuroscience investments. China and Japan lead regional demand through government-funded brain research programs. Increasing number of academic institutions adopt optogenetic techniques. Growing emphasis on neurological disease research supports market expansion. Cost-effective research setups improve accessibility. International collaborations strengthen technical expertise. Improving availability of skilled researchers enhances adoption. Rapid growth in biomedical research positions Asia Pacific as a key emerging region in the optogenetics market.
Latin America
Latin America represented a 7% market share in 2024, driven by gradual expansion of academic research capabilities. Brazil and Mexico contribute most to regional demand. Universities increase participation in neuroscience research projects. Public funding remains limited but shows gradual improvement. International collaborations support technology transfer. Research adoption focuses mainly on basic neuroscience studies. Infrastructure development progresses in major cities. Budget constraints limit large-scale deployment. Despite challenges, growing academic interest supports steady optogenetics market growth across Latin America.
Middle East and Africa
The Middle East and Africa accounted for a 4% market share in 2024, reflecting early-stage adoption of optogenetics. Gulf countries lead regional activity through investments in research institutions. Universities focus on building neuroscience capabilities. Africa shows limited adoption due to infrastructure gaps. International partnerships support knowledge transfer. Research usage remains concentrated in academic settings. Funding constraints affect equipment procurement. Long-term investment in education and research infrastructure supports gradual market development across the region.
Optogenetics Market Segmentations:
By Product Type
- Light sources
- Actuators
- Sensors
- Others
By Technique
- Channelrhodopsin-based
- Halorhodopsin-based
- Archaerhodopsin-based
By Application
- Neuroscience research
- Behavioral studies
- Drug discovery
- Others
By End User
- Academic and research institutes
- Biotechnology companies
- Pharmaceutical companies
By Geography
- North America
- U.S.
- Canada
- Mexico
- Europe
- Germany
- France
- U.K.
- Italy
- Spain
- Rest of Europe
- Asia Pacific
- China
- Japan
- India
- South Korea
- South-east Asia
- Rest of Asia Pacific
- Latin America
- Brazil
- Argentina
- Rest of Latin America
- Middle East & Africa
- GCC Countries
- South Africa
- Rest of the Middle East and Africa
Competitive Landscape
Competitive landscape analysis highlights a niche but innovation-driven Optogenetics market led by Thorlabs, Inc., Coherent Corp., Bruker Corporation, Inscopix, Inc., Plexon Inc., Scientifica Ltd., GenSight Biologics, Addgene, NeuroLux, Inc., and Noldus Information Technology. Market participants focus on advancing light delivery systems, genetic actuators, and integrated imaging solutions. Companies compete through product precision, reliability, and compatibility with neuroscience workflows. Strategic collaborations with academic institutes support technology validation. R&D investment remains central to differentiation, especially in neural circuit mapping tools. Vendors expand modular platforms to support complex experiments. Limited but growing commercial adoption keeps competition research-centric. Entry barriers remain high due to technical complexity and regulatory oversight. Continuous innovation, research partnerships, and portfolio depth define competitive positioning across the optogenetics market.
Key Player Analysis
- Thorlabs, Inc.
- Coherent Corp.
- Bruker Corporation
- Noldus Information Technology
- Plexon Inc.
- Scientifica Ltd.
- GenSight Biologics
- Addgene
- Inscopix, Inc.
- NeuroLux, Inc.
Recent Developments
- In November 2025, Thorlabs, Inc. expanded its fiber-optic portfolio by releasing new lensed-tip fiber patch cables and bare fibers, including models based on SMF-28 Ultra and 1060XP single mode fibers.
- In 2025, Coherent Corp. continued supplying laser and photonics tools used in optogenetics research, reflecting broader market growth in light-based neuroscience tools.
- In July 2024, Bruker Corporation was listed as a key vendor in optogenetics market reports, showing strengthened involvement in neuroscience and imaging tools supporting optogenetics.
Report Coverage
The research report offers an in-depth analysis based on Product Type, Technique, Application, End User and Geography. It details leading market players, providing an overview of their business, product offerings, investments, revenue streams, and key applications. Additionally, the report includes insights into the competitive environment, SWOT analysis, current market trends, as well as the primary drivers and constraints. Furthermore, it discusses various factors that have driven market expansion in recent years. The report also explores market dynamics, regulatory scenarios, and technological advancements that are shaping the industry. It assesses the impact of external factors and global economic changes on market growth. Lastly, it provides strategic recommendations for new entrants and established companies to navigate the complexities of the market.
Future Outlook
- Neuroscience research will remain the primary demand driver.
- Investment in brain research programs will continue increasing.
- Advanced genetic actuators will improve experimental precision.
- Integration with imaging and analytics tools will expand.
- Academic institutes will remain the dominant end users.
- Cross-disciplinary research applications will grow steadily.
- Technology miniaturization will support complex experiments.
- Ethical and regulatory frameworks will guide research use.
- Emerging regions will increase participation in neuroscience studies.
- Innovation partnerships will shape long-term market development.
Request a Free Sample
Fill in your details and we'll send you a free sample report.
- Sample data tables & charts
- Research methodology
Need a Custom Version of This Report?
Tailor the scope, geography, or segments to your exact requirements.
- Custom geography or segment scope
- Direct access to our analyst team
Frequently Asked Questions
What is the current market size for Optogenetics market, and what is its projected size in 2032?
At what Compound Annual Growth Rate is the Optogenetics market projected to grow between 2024 and 2032?
Which Optogenetics market segment held the largest share in 2024?
What are the primary factors fueling the growth of the Optogenetics market?
Who are the leading companies in the Optogenetics market?
Which region commanded the largest share of the Optogenetics market in 2024?
Table of Content
Chapter 1. Report Introduction
- 1.1 Report Description & Purpose
- 1.1.1 Report Title & Market Definition
- 1.1.2 Unique Selling Propositions (USP) & Key Differentiators
- 1.1.3 Value Proposition for Stakeholders
- 1.2 Research Objectives
- 1.2.1 Market Sizing Objectives (Volume & Revenue)
- 1.2.2 Segmentation Objectives
- 1.2.3 Competitive Intelligence Objectives
- 1.2.4 Forecast & Scenario Objectives
- 1.3 Report Scope
- 1.3.1 Optogenetics Scope – Types & Subtypes Covered
- 1.3.2 Geographic Scope – Regions & Countries Covered
- 1.3.3 Historical Period, Base Year & Forecast Period (2024; forecast to 2032)
- 1.3.4 Inclusions & Exclusions
- 1.4 HS Code & Classification Framework
- 1.5 Currency, Units & Pricing Basis
- 1.6 Target Stakeholders
- 1.7 Limitations & Assumptions
Chapter 2. Executive Summary
- 2.1 Global Optogenetics Market Snapshot
- 2.1.1 Market Size – Historical (2024) & Forecast (2024-2032) (2024: USD 118 million → 2032: USD 180.24 million)
- 2.1.2 Volume & Revenue – Global Totals
- 2.1.3 Key Market Highlights – Top Five Facts
- 2.2 Optogenetics Market Segmentation Snapshot
- 2.2.1 Market Split by Region – 2024 vs. 2032
- 2.3 Competitive Snapshot
- 2.3.1 Top 10 Players by Revenue Share – 2024
- 2.3.2 Top 10 Players by Volume Share – 2024
- 2.3.3 Recent Strategic Developments (18-Month Summary)
- 2.4 Key Investment Highlights & Strategic Conclusions
Chapter 3. Optogenetics Market Dynamics & Industry Analysis
- 3.1 Market Overview & Context
- 3.1.1 Optogenetics Market Position in the Broader Automotive Value Chain
- 3.1.2 OEM vs. Replacement Market Dynamics
- 3.1.3 Market Maturity & Development Stage by Region
- 3.2 Optogenetics Market Drivers
- 3.3 Optogenetics Market Restraints & Challenges
- 3.4 Optogenetics Market Opportunities
- 3.5 Porter's Five Forces Analysis
- 3.5.1 Threat of New Entrants
- 3.5.2 Bargaining Power of Suppliers
- 3.5.3 Bargaining Power of Buyers
- 3.5.4 Threat of Substitutes
- 3.5.5 Competitive Rivalry – Intensity Assessment
- 3.6 Optogenetics Value Chain Analysis
- 3.6.1 Upstream – Raw Material/Input Suppliers
- 3.6.1.1 Raw Material/Input 1
- 3.6.1.2 Raw Material/Input 2
- 3.6.1.3 Raw Material/Input 3
- 3.6.2 Midstream – Production/Manufacturing/Service Delivery
- 3.6.2.1 Production/Process Overview
- 3.6.2.2 Key Facility Locations & Capacity by Manufacturer
- 3.6.3 Downstream – Distribution & End Consumer
- 3.6.3.1 Primary Channel – B2B/OEM
- 3.6.3.2 Secondary Channels – Dealer, Retail, Online, Direct
- 3.6.4 Value Chain Profitability Analysis
- 3.6.1 Upstream – Raw Material/Input Suppliers
- 3.7 PESTEL Analysis
- 3.7.1 Political Factors
- 3.7.2 Economic Factors
- 3.7.3 Social Factors
- 3.7.4 Technological Factors
- 3.7.5 Environmental Factors
- 3.7.6 Legal Factors
- 3.8 Optogenetics Supply Chain Analysis
- 3.8.1 Raw Material/Input Supply Risk Assessment
- 3.8.2 Manufacturing Concentration Risk (Geographic Exposure)
- 3.8.3 Trade Disruption Impact Analysis
- 3.9 Regulatory & Policy Landscape
Note: The regulatory and policy landscape section covers regulations based on their applicability to the market, Optogenetics category, geography, and scope of the study. Only regulatory frameworks with a material impact on operations, compliance, trade, sustainability, or market access are analyzed in detail.
Chapter 4. Key Investment Pockets & Opportunity Analysis
- 4.1 Optogenetics Market Attractiveness Analysis
- 4.1.1 By Region – Investment Attractiveness Matrix (Volume × CAGR)
- 4.2 Absolute Revenue Growth Opportunity
- 4.2.1 By Region – Absolute USD Growth Through 2032
- 4.3 Incremental Volume Opportunity
- 4.3.1 By Region – Incremental Volume Through 2032
- 4.3.2 Segment – Incremental Volume
- 4.4 Emerging Submarket Opportunity Deep Dive (Subject to Applicability)
- 4.5 Emerging Market Opportunity Scorecards
- 4.5.1 United States
- 4.5.2 Europe
- 4.5.3 Asia
- 4.5.4 Middle East & Africa
Note: Emerging Market Opportunity Scorecards will be included based on relevance and strategic importance. Regions listed are indicative and may vary depending on data availability and market dynamics.
Chapter 5. Optogenetics Import-Export Analysis & Trade Flows
- 5.1 Global Trade Overview
- 5.1.1 Global Export Value by Country (2024)
- 5.1.2 Global Export Volume by Country (2024)
- 5.1.3 Global Import Value by Country (2024)
- 5.1.4 Global Import Volume by Country (2024)
- 5.1.5 Net Trade Balance by Country (2024)
- 5.2 Export Analysis – Segment
- 5.2.1 Type 1 (HS Code)
- 5.2.2 Type 2 (HS Code)
- 5.2.3 Type 3 (HS Code)
- 5.2.4 Type 4 (HS Code)
- 5.2.5 Type 5 (HS Code)
- 5.3 Import Analysis – Segment
- 5.3.1 Type 1 (HS Code)
- 5.3.2 Type 2 (HS Code)
- 5.3.3 Type 3 (HS Code)
- 5.3.4 Type 4 (HS Code)
- 5.3.5 Type 5 (HS Code)
- 5.4 Average Unit Trade Prices
- 5.4.1 Average Export Price – Segment & Country
- 5.4.2 Average Import Price – Segment & Source Country
- 5.4.3 Price Trends (2024)
- 5.5 Key Trade Route Analysis
- 5.5.1 Trade Route 1
- 5.5.2 Trade Route 2
- 5.5.3 Trade Route 3
- 5.5.4 Trade Route 4
- 5.5.5 Trade Route 5
- 5.6 Trade Policy Impact Assessment
- 5.6.1 US Anti-Dumping & Section 301 Tariffs
- 5.6.2 EU Customs Union Impact
- 5.6.3 Major Free Trade Agreements
- 5.6.4 USMCA Rules of Origin
Note: Trade policy analysis will be included only where relevant to the Optogenetics market.
Chapter 6. Competitive Landscape & Company Benchmarking
- 6.1 Optogenetics Market Concentration & Structure
- 6.1.1 Herfindahl-Hirschman Index (HHI) – vs. 2024
- 6.1.2 Tier 1, Tier 2 & Tier 3 Market Structure
- 6.1.3 Global, Regional & Local Player Dynamics
- 6.2 Optogenetics Market Share Analysis – 2024
- 6.2.1 Global Revenue Share by Company
- 6.2.2 Global Volume Share by Company
- 6.2.3 Regional Revenue Share
- 6.2.4 Market Share Evolution ( vs. 2024)
- 6.2.5 OEM Segment Share by Company
- 6.2.6 Replacement Segment Share by Company
- 6.3 Production/Delivery Capacity & Facility Analysis
- 6.3.1 Global Installed Capacity
- 6.3.2 Capacity Utilization Rates
- 6.3.3 Production/Output Volume
- 6.3.4 Facility Locations & Capacity Map
- 6.3.5 Planned Capacity Additions
- 6.4 Optogenetics Competitive Benchmarking Matrix
- 6.4.1 Revenue, Volume, CAGR & Profitability Comparison
- 6.4.2 Channel Revenue Mix
- 6.4.3 Geographic Revenue Exposure
- 6.4.4 R&D Intensity
- 6.4.5 Sustainability Maturity
- 6.5 Strategic Developments in Optogenetics (Last 24 Months)
- 6.5.1 Mergers, Acquisitions & Divestments
- 6.5.2 New Optogenetics Launches
- 6.5.3 Facility Expansions
- 6.5.4 Strategic Alliances, Joint Ventures & Partnerships
- 6.5.5 Distribution Expansion & Market Entry
- 6.5.6 Sustainability & ESG Initiatives
- 6.6 Competitive Strategy Mapping
- 6.6.1 Leader, Challenger, Follower & Niche Classification
- 6.6.2 Pricing Strategy Comparison
- 6.6.3 Channel Strategy Matrix
Note: Strategic developments are included based on their materiality and the availability of reliable information.
Chapter 7. Global Optogenetics Market – By Distribution Channel
- 7.1 Segment Overview
- 7.1.1 Volume & Revenue Split by Channel (2024 & 2032)
- 7.1.2 Channel Mix Evolution (2024-2032)
Chapter 8. Regional Market Analysis – Global Overview
- 8.1 Global Regional Overview
- 8.1.1 Regional Volume Share
- 8.1.2 Regional Revenue Share
- 8.1.3 Regional Volume by Region
- 8.1.4 Regional Revenue by Region
- 8.1.5 Regional Forecast Through 2032
- 8.2 Cross-Regional Segment Analysis
- 8.2.1 By Distribution Channel
- 8.2.2 By Brand/Price Tier
Chapter 9. North America Optogenetics Market
- 9.1 United States
- 9.2 Canada
- 9.3 Mexico
Chapter 10. Europe Optogenetics Market
- 10.1 Germany
- 10.2 France
- 10.3 Italy
- 10.4 United Kingdom
- 10.5 Spain
- 10.6 Poland
- 10.7 Russia
- 10.8 Netherlands
- 10.9 Belgium
- 10.10 Sweden
- 10.11 Denmark
- 10.12 Norway
- 10.13 Rest of Europe
Chapter 11. Asia Pacific Optogenetics Market
- 11.1 China
- 11.2 India
- 11.3 Japan
- 11.4 South Korea
- 11.5 Thailand
- 11.6 Indonesia
- 11.7 Vietnam
- 11.8 Malaysia
- 11.9 Australia
- 11.10 Rest of Asia Pacific
Chapter 12. Latin America Optogenetics Market
- 12.1 Brazil
- 12.2 Argentina
- 12.3 Colombia
- 12.4 Chile
- 12.5 Rest of Latin America
Chapter 13. Middle East Optogenetics Market
- 13.1 Saudi Arabia
- 13.2 United Arab Emirates
- 13.3 Turkey
- 13.4 Israel
- 13.5 Iran
- 13.6 Rest of the Middle East
Chapter 14. Africa Optogenetics Market
- 14.1 South Africa
- 14.2 Egypt
- 14.3 Nigeria
- 14.4 Morocco
- 14.5 Rest of Africa
Chapter 15. Optogenetics Company Profiles
- 15.1 [Company 01]
- 15.1.1 Company Overview
- 15.1.2 Key Management Personnel
- 15.1.3 Products & Services Portfolio
- 15.1.4 Financial Performance
- 15.1.5 Key Market Focus & Geographic Presence
- 15.1.6 Recent Developments & Strategic Initiatives
Note: The company profile list is preliminary and may change based on research findings, market developments, data availability, and client requirements.
Chapter 16. Appendices
- Appendix A – List of Abbreviations & Acronyms
- Appendix B – Industry Classification Code Reference – Full Series
- Appendix C – Production & Capacity Data Tables
- Appendix D – End-Use & Demand Base Tables
- Appendix E – Consumption & Replacement Rate Assumptions
- Appendix F – ASP Reference Tables
- Appendix G – Manufacturing & Facility Database
- Appendix H – Import-Export Data Tables
- Appendix I – Regulatory Summary Tables
- Appendix J – Primary Research Participant List (Anonymized)
- Appendix K – Primary Research Questionnaire Framework
- Appendix L – Data Sources & Bibliography
- Appendix M – Market Size Divergence & Source Comparison
Chapter 17. Research Methodology
- 17.1 Research Framework & Philosophy
- 17.2 Secondary Research – Sources, Hierarchy & Data Extraction
- 17.3 Data Modeling – Bottom-Up & Top-Down Market Sizing
- 17.4 Primary Research – Stakeholder Framework, LOI & Sample Sizes
- 17.5 Forecast Methodology – Regression, Scenario & Sensitivity Analysis
- 17.6 Quality Control – Four-Layer Validation Framework
- 17.7 Limitations & Standard Assumptions
- 17.8 Disclaimer
