
Market Overview:
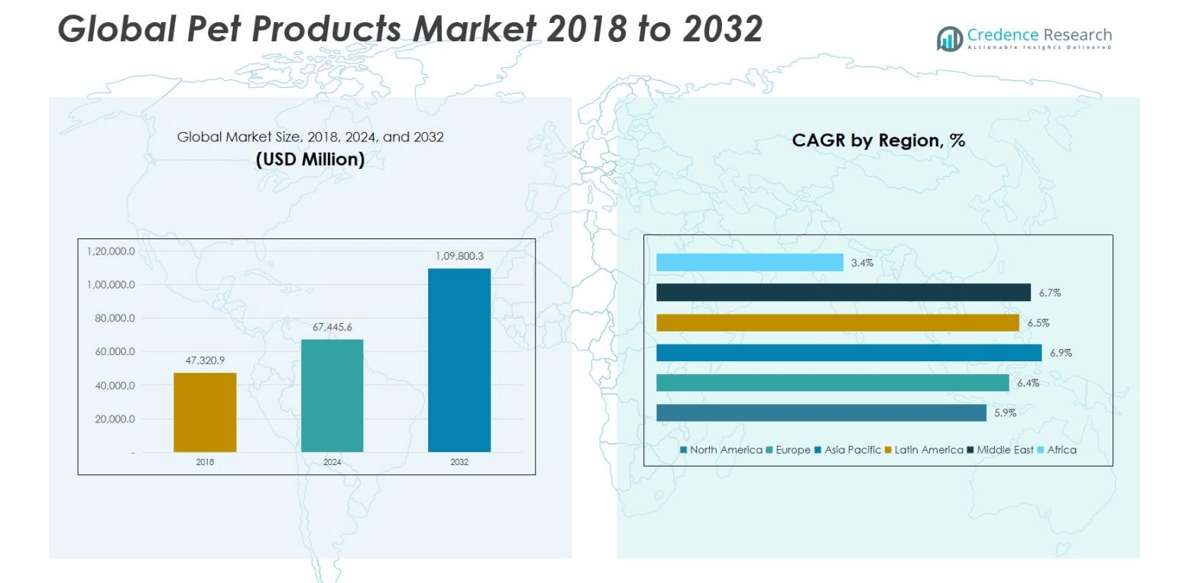
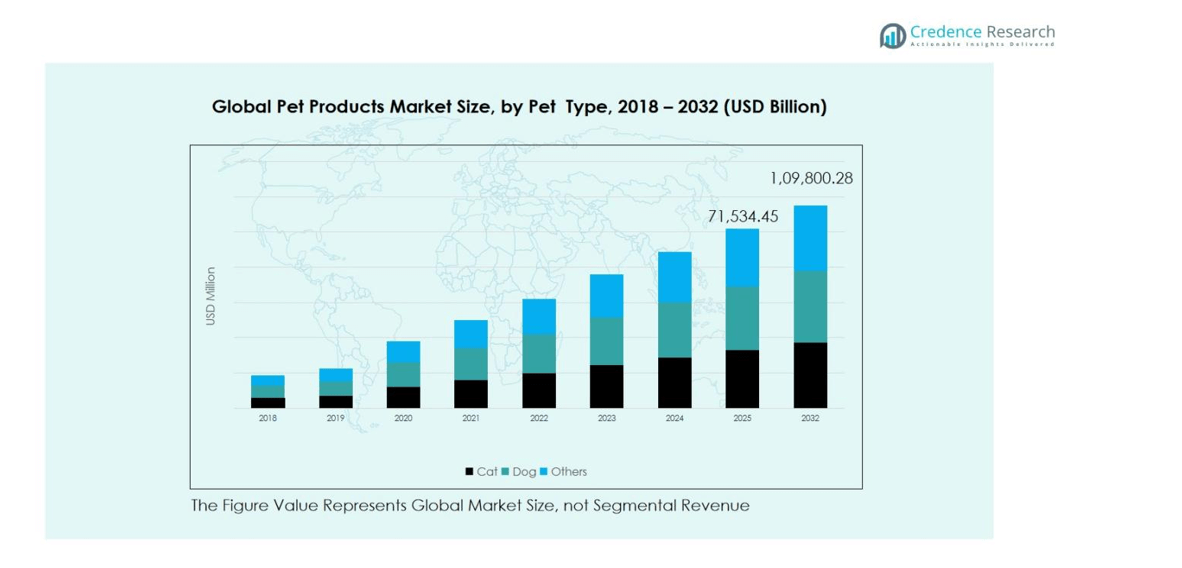
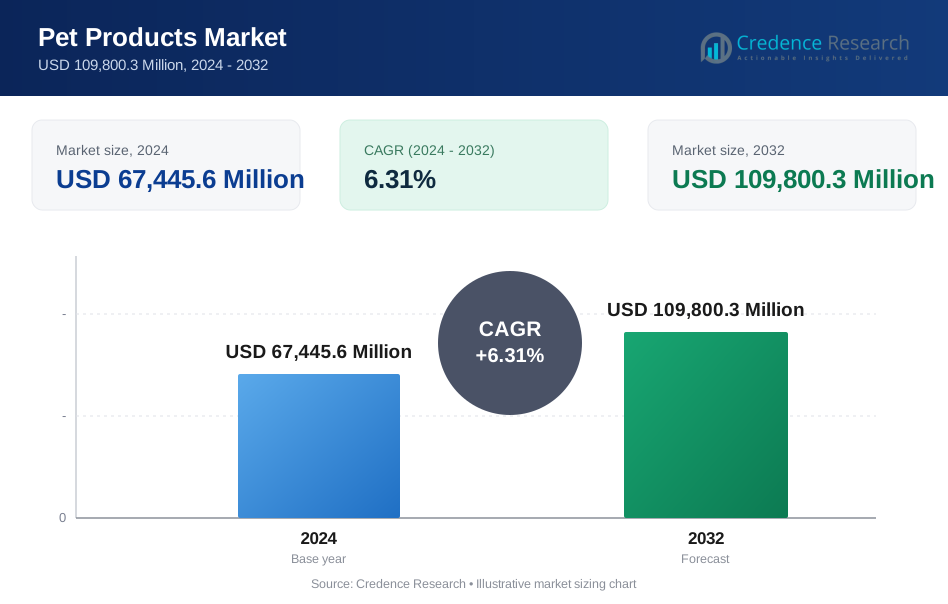
Pet Products Market size was valued at USD 47,320.9 Million in 2018, rising to USD 67,445.6 Million in 2024, and is anticipated to reach USD 109,800.3 Million by 2032, at a CAGR of 6.31% during the forecast period.
| REPORT ATTRIBUTE | DETAILS |
|---|---|
| Historical Period | 2020-2023 |
| Base Year | 2024 |
| Forecast Period | 2025-2032 |
| Pet Products MarketSize 2024 | USD 67,445.6 Million |
| Pet Products Market, CAGR | 6.31% |
| Pet Products Market Size 2032 | USD 109,800.3 Million |
The Pet Products Market is highly competitive, led by key players such as Ancol Pet Products Limited, Beaphar International, Ferplast S.p.A., Rolf C. Hagen, Inc., Rosewood Pet Products, Hartz Mountain Corporation, Larz Dog Products, Planet Dog, Inc., Bodens Group, and Foam N' More, Inc. These companies focus on product innovation, premium offerings, and strategic expansions to capture growing global demand. North America emerges as the leading region, holding a dominant market share of approximately 33%, driven by high pet ownership, rising disposable income, and advanced retail infrastructure. Europe follows with around 27% market share, supported by urban pet adoption and demand for premium products, while Asia Pacific contributes 20% through increasing pet adoption and e-commerce penetration. Together, these regions shape global market dynamics, driving sustained growth and innovation in feeding, bedding, toys, and smart pet accessories.
Market Insights
- The Pet Products Market was valued at USD 67,445.6 Million in 2024 and is projected to reach USD 109,800.3 Million by 2032, growing at a CAGR of 6.31%, with feeding products holding the largest share of 32% and dogs dominating pet type at 60%.
- Growth is driven by rising pet ownership, urban lifestyles, and pet humanization trends, which increase demand for premium feeding, bedding, and interactive products.
- Market trends include premiumization of products, technological innovations in smart feeders and wearable devices, and expansion of e-commerce channels for convenient access and personalized solutions.
- The market is highly competitive, led by players such as Ancol Pet Products Limited, Beaphar International, Ferplast S.p.A., Rolf C. Hagen, Inc., and Hartz Mountain Corporation, focusing on innovation, mergers, partnerships, and regional expansion.
- Regionally, North America leads with a 33% share, Europe follows with 27%, Asia Pacific holds 20%, Latin America 9%, the Middle East 4%, and Africa 3%, reflecting strong growth across developed and emerging markets.
Market Segmentation Analysis:
By Product Segment:
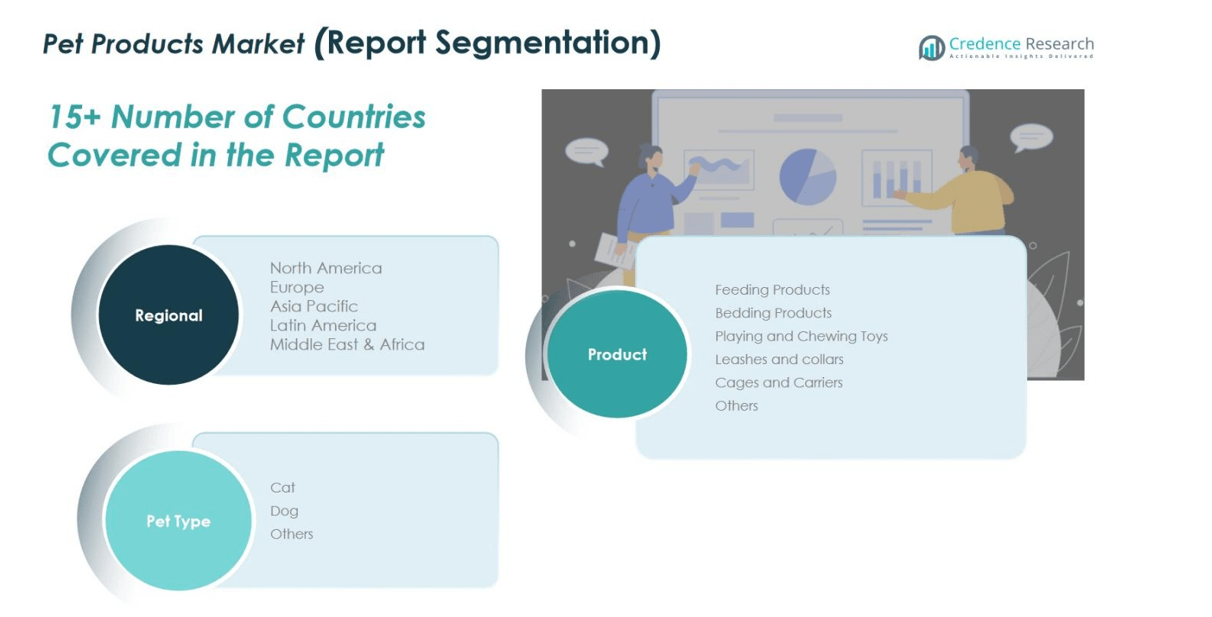
Feeding products lead the market with a 32% share, driven by rising pet ownership, nutritional awareness, and convenience-focused solutions such as automatic feeders and portion-controlled bowls. Bedding products follow with 20%, supported by demand for comfort, hygiene, and premium options like orthopedic beds. Playing and chewing toys hold an 18% share, with chew toys dominating due to their role in mental stimulation and dental health. Leashes and collars account for 12%, driven by pet safety, training, and GPS-enabled designs. Cages and carriers contribute 10%, led by pet carriers for travel and mobility needs, while grooming tools, apparel, and miscellaneous accessories occupy 8% under the ‘Others’ category, reflecting trends in pet humanization.
- For example, K&H Pet Products offers the Superior Orthopedic Indoor/Outdoor Bed, featuring high-density foam to support pets' joints, catering especially to aging pets.
By Pet Type
Dogs dominate the pet type segment with a 60% share, fueled by high adoption rates, premium feeding products, toys, and outdoor accessories. Cats follow with 28%, supported by urban adoption, indoor enrichment products, and specialized nutrition. The ‘Others’ category, including birds, fish, and small mammals, holds 12%, driven by niche feeding products, cages, and enrichment tools. Growth across all pet types is underpinned by rising awareness of pet well-being, increasing disposable income, and innovations in interactive, premium, and convenient products, making the overall market highly dynamic.
- For instance, Hill’s Science Diet reports strong sales of their small and mini dry dog food formulas tailored for different life stages, meeting owner demand for specialized nutrition.
Key Growth Drivers
Rising Pet Ownership and Humanization
The increasing number of pet owners worldwide is a primary driver of the pet products market. Urbanization, changing lifestyles, and delayed parenthood are encouraging households to treat pets as family members, boosting demand for premium and specialized products. Pet humanization fuels spending on high-quality food, bedding, toys, and accessories, creating consistent market growth. Consumers are willing to invest in products that enhance pet comfort, health, and well-being, driving innovation and expansion across product categories globally.
- For instance, PetSafe LLC, a leader in smart pet devices, offers advanced connected products such as automatic feeders and digital training collars, emphasizing safety and pet well-being.
Growing Awareness of Pet Health and Nutrition
Heightened awareness of pet health and nutrition is accelerating market growth. Owners are prioritizing balanced diets, supplements, and safe feeding products to improve longevity and overall well-being. Demand for functional foods, organic ingredients, and portion-controlled feeding solutions is rising rapidly. Simultaneously, products supporting dental care, mental stimulation, and physical activity are witnessing higher adoption. This health-conscious approach drives manufacturers to innovate and expand their portfolios, solidifying the market’s growth trajectory and attracting premium consumer segments.
- For instance, Mars Petcare emphasizes precise nutrition backed by scientific research and offers grain-free and quality ingredient products targeted at specific health needs, enhancing pet well-being.
Expansion of E-commerce and Digital Retail Channels
The rise of e-commerce and online retail platforms is a significant market driver. Consumers increasingly prefer the convenience of online shopping, home delivery, and subscription-based models for pet products. Digital platforms also allow for personalized recommendations, reviews, and targeted promotions, boosting sales. This shift expands market reach beyond urban centers and creates opportunities for smaller brands to compete with established players. The digital retail surge enhances visibility, accessibility, and variety of pet products, accelerating market adoption and revenue growth globally.
Key Trends & Opportunities
Premiumization of Pet Products
Consumers are seeking premium and customized products that enhance pet comfort and lifestyle, creating opportunities for market expansion. From designer accessories to high-quality beds and interactive toys, the trend reflects willingness to spend on non-essential yet value-added items. This premiumization drives innovation, encourages product differentiation, and strengthens brand loyalty. Companies leveraging customization and high-quality materials can capture niche segments, tapping into the growing humanization trend while boosting market revenue and margins.
- For instance, K&H Pet Products introduced a patented line of heated pet beds with energy-efficient heating systems designed for colder climates, catering to pet owners prioritizing comfort and wellness.
Technological Innovation and Smart Products
Technological advancements in smart and interactive pet products present growth opportunities. Smart feeders, wearable trackers, automated litter boxes, and interactive toys enable pet owners to monitor health, activity, and behavior efficiently. These innovations meet rising demands for convenience, safety, and engagement, particularly among tech-savvy consumers. Adoption of connected devices also encourages subscription models and repeat purchases. The integration of technology in pet care products not only drives market differentiation but also expands consumer spending across diverse product categories.
- For instance, FeTaca's Smart 4G Pet GPS Tracker provides real-time location updates with a one-year complimentary subscription plan, ensuring continuous tracking and peace of mind for pet owners.
Key Challenges
High Competition and Price Sensitivity
Despite growth, the market faces challenges due to intense competition and price-sensitive consumers. Numerous local and international players create pressure on pricing and margins, especially in standard product categories. Brands must invest in marketing, innovation, and quality differentiation to maintain competitiveness. Smaller players may struggle to sustain operations against established firms, while consumers often switch to cost-effective alternatives. Balancing affordability with premium product offerings remains a critical challenge for market participants aiming for sustained growth.
Regulatory Compliance and Safety Concerns
Stringent regulations related to pet product safety, materials, and labeling pose challenges for manufacturers. Non-compliance can result in recalls, legal penalties, and reputational damage, impacting revenue. Increasing consumer awareness about product safety and chemical-free materials heightens scrutiny. Companies must invest in testing, certification, and compliance measures, which can increase operational costs. Navigating diverse regulations across regions while ensuring product quality and safety remains a significant challenge for global expansion and sustainable growth in the pet products market.
Regional Analysis
North America
North America leads the pet products market with a market size of USD 16,879.38 million in 2018, growing to USD 23,575.11 million in 2024 and projected to reach USD 37,332.10 million by 2032, at a CAGR of 5.9%. The region holds a dominant share of approximately 33% due to high pet ownership, increasing consumer spending on premium products, and rising pet humanization trends. The U.S. drives growth with strong adoption of feeding, bedding, and interactive toys, while Canada and Mexico contribute steadily. Advanced retail infrastructure and e-commerce penetration further support the region’s expansion.
Europe
Europe accounted for USD 12,464.34 million in 2018 and is expected to reach USD 29,097.08 million by 2032, expanding at a CAGR of 6.4% with a market share of around 27%. Growth is driven by rising dog and cat adoption, increased awareness of pet health and wellness, and demand for premium products. The UK, Germany, France, and Italy dominate regional sales, focusing on high-quality feeding, grooming, and bedding solutions. Urbanization and disposable income growth, combined with strong distribution networks and e-commerce expansion, are further accelerating the European pet products market.
Asia Pacific
The Asia Pacific pet products market was valued at USD 9,516.24 million in 2018, reaching USD 14,080.71 million in 2024 and expected to grow to USD 24,046.26 million by 2032 at a CAGR of 6.9%, holding a market share of 20%. Rapid urbanization, rising disposable income, and increasing pet adoption in China, Japan, India, and South Korea are driving growth. Demand for premium feeding products, toys, and smart accessories is growing, supported by expanding e-commerce platforms and awareness of pet health and well-being. Younger consumers are key drivers of adoption in this region.
Latin America
Latin America’s pet products market was USD 5,049.14 million in 2018 and is projected to reach USD 12,078.03 million by 2032, growing at a CAGR of 6.5%, representing a 9% market share. Brazil and Argentina lead regional growth due to rising dog and cat ownership, increasing urbanization, and growing awareness of pet care. Spending on premium food, toys, and accessories is increasing, supported by expanding retail networks and online sales channels. Market expansion is also aided by the introduction of international brands and rising consumer preference for quality products.
Middle East
The Middle East market stood at USD 2,053.73 million in 2018 and is expected to reach USD 5,050.81 million by 2032, growing at a CAGR of 6.7% with a 4% market share. GCC countries, Israel, and Turkey are leading demand, driven by increasing disposable income, pet humanization, and urban lifestyles. Premium feeding products, toys, and grooming solutions are gaining traction, while awareness campaigns on pet health and well-being are encouraging higher spending. Growth is also supported by a rising number of pet-friendly residential and commercial spaces across the region.
Africa
Africa accounted for USD 1,358.11 million in 2018, projected to reach USD 2,196.01 million by 2032 at a CAGR of 3.4%, holding a market share of around 3%. South Africa and Egypt are key markets, with growth driven by increasing urban pet adoption, rising awareness of pet health, and gradual adoption of premium products. Limited retail infrastructure and lower disposable incomes constrain growth compared to other regions. However, expanding e-commerce channels and niche product offerings for dogs, cats, and small mammals are creating opportunities for market players in the region.
Market Segmentations:
By Product:
- Feeding Products
- Bedding Products
- Playing and Chewing Toys
- Leashes and Collars
- Cages and Carriers
- Others
By Pet Type:
- Cat
- Dog
- Others
By Region:
- North America
- U.S.
- Canada
- Mexico
- Europe
- Germany
- France
- U.K.
- Italy
- Spain
- Rest of Europe
- Asia Pacific
- China
- Japan
- India
- South Korea
- South-east Asia
- Rest of Asia Pacific
- Latin America
- Brazil
- Argentina
- Rest of Latin America
- Middle East & Africa
- GCC Countries
- South Africa
- Rest of the Middle East and Africa
Competitive Landscape
The competitive landscape of the pet products market features leading players such as Ancol Pet Products Limited, Beaphar International, Ferplast S.p.A., Rolf C. Hagen, Inc., Rosewood Pet Products, Hartz Mountain Corporation, Larz Dog Products, Planet Dog, Inc., Bodens Group, and Foam N' More, Inc. Companies compete through product innovation, premium offerings, and strategic expansions to capture growing pet ownership trends globally. Emphasis on research and development has led to advanced feeding products, interactive toys, and smart accessories, differentiating brands in a crowded market. Mergers, acquisitions, and partnerships are also common strategies to enhance distribution and regional presence. Additionally, companies are leveraging e-commerce platforms and digital marketing to reach tech-savvy consumers. Competitive pricing, brand loyalty, and product quality remain critical factors for market leadership, while innovation and sustainability initiatives are shaping long-term growth prospects in this highly dynamic industry.
Key Player Analysis
- Ancol Pet Products Limited
- Beaphar International
- Ferplast S.p.A.
- Rolf C. Hagen, Inc
- Rosewood Pet Products
- Hartz Mountain Corporation
- Larz Dog Products
- Planet Dog, Inc.
- Bodens Group
- Foam N' More, Inc.
Recent Developments
- On October 21, 2025, Whisker launched its next-generation automatic litter box lineup: the Litter-Robot 5 Pro, Litter-Robot 5, and Litter-Robot EVO. The launch also introduced a new smart-pet ecosystem including the “PetTag” and “Whisker+” membership.
- In October 2025, the company launched its “Love Made Fresh” line, entering the fresh (refrigerated) pet food category in the U.S., available in major retailers like Walmart, Target, Kroger, etc.
- In October 2025, Blue Buffalo Co., a General Mills brand, launched its “Love Made Fresh” product line, marking its entry into the fresh refrigerated pet food category across major U.S. retailers.
Report Coverage
The research report offers an in-depth analysis based on Product, Pet Type and Region. It details leading market players, providing an overview of their business, product offerings, investments, revenue streams, and key applications. Additionally, the report includes insights into the competitive environment, SWOT analysis, current market trends, as well as the primary drivers and constraints. Furthermore, it discusses various factors that have driven market expansion in recent years. The report also explores market dynamics, regulatory scenarios, and technological advancements that are shaping the industry. It assesses the impact of external factors and global economic changes on market growth. Lastly, it provides strategic recommendations for new entrants and established companies to navigate the complexities of the market.
Future Outlook
- The market is expected to grow steadily due to rising pet ownership globally.
- Demand for premium and customized pet products will continue to expand.
- Smart and interactive pet products will gain higher adoption among tech-savvy consumers.
- E-commerce and online retail channels will increasingly drive market sales.
- Urbanization and changing lifestyles will boost spending on pet comfort and wellness.
- Pet humanization trends will encourage innovation in toys, bedding, and feeding solutions.
- Growth in emerging regions will create new opportunities for local and international players.
- Sustainability and eco-friendly products will become important for consumer preference.
- Strategic partnerships, mergers, and acquisitions will strengthen market presence and distribution.
- Regulatory compliance and quality assurance will remain key to maintaining brand trust and expansion.
Request a Free Sample
Fill in your details and we'll send you a free sample report.
- Sample data tables & charts
- Research methodology
Need a Custom Version of This Report?
Tailor the scope, geography, or segments to your exact requirements.
- Custom geography or segment scope
- Direct access to our analyst team
Frequently Asked Questions
What is the current market size for Pet Products Market, and what is its projected size in 2032?
At what Compound Annual Growth Rate is the Pet Products Market projected to grow between 2025 and 2032?
Which Pet Products Market segment held the largest share in 2024?
What are the primary factors fueling the growth of the Pet Products Market?
Who are the leading companies in the Pet Products Market?
Table of Content
Chapter 1. Report Introduction
- 1.1 Report Description & Purpose
- 1.1.1 Report Title & Market Definition
- 1.1.2 Unique Selling Propositions (USP) & Key Differentiators
- 1.1.3 Value Proposition for Stakeholders
- 1.2 Research Objectives
- 1.2.1 Market Sizing Objectives (Volume & Revenue)
- 1.2.2 Segmentation Objectives
- 1.2.3 Competitive Intelligence Objectives
- 1.2.4 Forecast & Scenario Objectives
- 1.3 Report Scope
- 1.3.1 Pet Products Scope – Types & Subtypes Covered
- 1.3.2 Geographic Scope – Regions & Countries Covered
- 1.3.3 Historical Period, Base Year & Forecast Period (2024; forecast to 2032)
- 1.3.4 Inclusions & Exclusions
- 1.4 HS Code & Classification Framework
- 1.5 Currency, Units & Pricing Basis
- 1.6 Target Stakeholders
- 1.7 Limitations & Assumptions
Chapter 2. Executive Summary
- 2.1 Global Pet Products Market Snapshot
- 2.1.1 Market Size – Historical (2024) & Forecast (2024-2032) (2024: USD 67,445.6 Million → 2032: USD 109,800.3 Million)
- 2.1.2 Volume & Revenue – Global Totals
- 2.1.3 Key Market Highlights – Top Five Facts
- 2.2 Pet Products Market Segmentation Snapshot
- 2.2.1 Market Split by Region – 2024 vs. 2032
- 2.3 Competitive Snapshot
- 2.3.1 Top 10 Players by Revenue Share – 2024
- 2.3.2 Top 10 Players by Volume Share – 2024
- 2.3.3 Recent Strategic Developments (18-Month Summary)
- 2.4 Key Investment Highlights & Strategic Conclusions
Chapter 3. Pet Products Market Dynamics & Industry Analysis
- 3.1 Market Overview & Context
- 3.1.1 Pet Products Market Position in the Broader Automotive Value Chain
- 3.1.2 OEM vs. Replacement Market Dynamics
- 3.1.3 Market Maturity & Development Stage by Region
- 3.2 Pet Products Market Drivers
- 3.3 Pet Products Market Restraints & Challenges
- 3.4 Pet Products Market Opportunities
- 3.5 Porter's Five Forces Analysis
- 3.5.1 Threat of New Entrants
- 3.5.2 Bargaining Power of Suppliers
- 3.5.3 Bargaining Power of Buyers
- 3.5.4 Threat of Substitutes
- 3.5.5 Competitive Rivalry – Intensity Assessment
- 3.6 Pet Products Value Chain Analysis
- 3.6.1 Upstream – Raw Material/Input Suppliers
- 3.6.1.1 Raw Material/Input 1
- 3.6.1.2 Raw Material/Input 2
- 3.6.1.3 Raw Material/Input 3
- 3.6.2 Midstream – Production/Manufacturing/Service Delivery
- 3.6.2.1 Production/Process Overview
- 3.6.2.2 Key Facility Locations & Capacity by Manufacturer
- 3.6.3 Downstream – Distribution & End Consumer
- 3.6.3.1 Primary Channel – B2B/OEM
- 3.6.3.2 Secondary Channels – Dealer, Retail, Online, Direct
- 3.6.4 Value Chain Profitability Analysis
- 3.6.1 Upstream – Raw Material/Input Suppliers
- 3.7 PESTEL Analysis
- 3.7.1 Political Factors
- 3.7.2 Economic Factors
- 3.7.3 Social Factors
- 3.7.4 Technological Factors
- 3.7.5 Environmental Factors
- 3.7.6 Legal Factors
- 3.8 Pet Products Supply Chain Analysis
- 3.8.1 Raw Material/Input Supply Risk Assessment
- 3.8.2 Manufacturing Concentration Risk (Geographic Exposure)
- 3.8.3 Trade Disruption Impact Analysis
- 3.9 Regulatory & Policy Landscape
Note: The regulatory and policy landscape section covers regulations based on their applicability to the market, Pet Products category, geography, and scope of the study. Only regulatory frameworks with a material impact on operations, compliance, trade, sustainability, or market access are analyzed in detail.
Chapter 4. Key Investment Pockets & Opportunity Analysis
- 4.1 Pet Products Market Attractiveness Analysis
- 4.1.1 By Region – Investment Attractiveness Matrix (Volume × CAGR)
- 4.2 Absolute Revenue Growth Opportunity
- 4.2.1 By Region – Absolute USD Growth Through 2032
- 4.3 Incremental Volume Opportunity
- 4.3.1 By Region – Incremental Volume Through 2032
- 4.3.2 Segment – Incremental Volume
- 4.4 Emerging Submarket Opportunity Deep Dive (Subject to Applicability)
- 4.5 Emerging Market Opportunity Scorecards
- 4.5.1 United States
- 4.5.2 Europe
- 4.5.3 Asia
- 4.5.4 Middle East & Africa
Note: Emerging Market Opportunity Scorecards will be included based on relevance and strategic importance. Regions listed are indicative and may vary depending on data availability and market dynamics.
Chapter 5. Pet Products Import-Export Analysis & Trade Flows
- 5.1 Global Trade Overview
- 5.1.1 Global Export Value by Country (2024)
- 5.1.2 Global Export Volume by Country (2024)
- 5.1.3 Global Import Value by Country (2024)
- 5.1.4 Global Import Volume by Country (2024)
- 5.1.5 Net Trade Balance by Country (2024)
- 5.2 Export Analysis – Segment
- 5.2.1 Type 1 (HS Code)
- 5.2.2 Type 2 (HS Code)
- 5.2.3 Type 3 (HS Code)
- 5.2.4 Type 4 (HS Code)
- 5.2.5 Type 5 (HS Code)
- 5.3 Import Analysis – Segment
- 5.3.1 Type 1 (HS Code)
- 5.3.2 Type 2 (HS Code)
- 5.3.3 Type 3 (HS Code)
- 5.3.4 Type 4 (HS Code)
- 5.3.5 Type 5 (HS Code)
- 5.4 Average Unit Trade Prices
- 5.4.1 Average Export Price – Segment & Country
- 5.4.2 Average Import Price – Segment & Source Country
- 5.4.3 Price Trends (2024)
- 5.5 Key Trade Route Analysis
- 5.5.1 Trade Route 1
- 5.5.2 Trade Route 2
- 5.5.3 Trade Route 3
- 5.5.4 Trade Route 4
- 5.5.5 Trade Route 5
- 5.6 Trade Policy Impact Assessment
- 5.6.1 US Anti-Dumping & Section 301 Tariffs
- 5.6.2 EU Customs Union Impact
- 5.6.3 Major Free Trade Agreements
- 5.6.4 USMCA Rules of Origin
Note: Trade policy analysis will be included only where relevant to the Pet Products market.
Chapter 6. Competitive Landscape & Company Benchmarking
- 6.1 Pet Products Market Concentration & Structure
- 6.1.1 Herfindahl-Hirschman Index (HHI) – vs. 2024
- 6.1.2 Tier 1, Tier 2 & Tier 3 Market Structure
- 6.1.3 Global, Regional & Local Player Dynamics
- 6.2 Pet Products Market Share Analysis – 2024
- 6.2.1 Global Revenue Share by Company
- 6.2.2 Global Volume Share by Company
- 6.2.3 Regional Revenue Share
- 6.2.4 Market Share Evolution ( vs. 2024)
- 6.2.5 OEM Segment Share by Company
- 6.2.6 Replacement Segment Share by Company
- 6.3 Production/Delivery Capacity & Facility Analysis
- 6.3.1 Global Installed Capacity
- 6.3.2 Capacity Utilization Rates
- 6.3.3 Production/Output Volume
- 6.3.4 Facility Locations & Capacity Map
- 6.3.5 Planned Capacity Additions
- 6.4 Pet Products Competitive Benchmarking Matrix
- 6.4.1 Revenue, Volume, CAGR & Profitability Comparison
- 6.4.2 Channel Revenue Mix
- 6.4.3 Geographic Revenue Exposure
- 6.4.4 R&D Intensity
- 6.4.5 Sustainability Maturity
- 6.5 Strategic Developments in Pet Products (Last 24 Months)
- 6.5.1 Mergers, Acquisitions & Divestments
- 6.5.2 New Pet Products Launches
- 6.5.3 Facility Expansions
- 6.5.4 Strategic Alliances, Joint Ventures & Partnerships
- 6.5.5 Distribution Expansion & Market Entry
- 6.5.6 Sustainability & ESG Initiatives
- 6.6 Competitive Strategy Mapping
- 6.6.1 Leader, Challenger, Follower & Niche Classification
- 6.6.2 Pricing Strategy Comparison
- 6.6.3 Channel Strategy Matrix
Note: Strategic developments are included based on their materiality and the availability of reliable information.
Chapter 7. Global Pet Products Market – By Distribution Channel
- 7.1 Segment Overview
- 7.1.1 Volume & Revenue Split by Channel (2024 & 2032)
- 7.1.2 Channel Mix Evolution (2024-2032)
Chapter 8. Regional Market Analysis – Global Overview
- 8.1 Global Regional Overview
- 8.1.1 Regional Volume Share
- 8.1.2 Regional Revenue Share
- 8.1.3 Regional Volume by Region
- 8.1.4 Regional Revenue by Region
- 8.1.5 Regional Forecast Through 2032
- 8.2 Cross-Regional Segment Analysis
- 8.2.1 By Distribution Channel
- 8.2.2 By Brand/Price Tier
Chapter 9. North America Pet Products Market
- 9.1 United States
- 9.2 Canada
- 9.3 Mexico
Chapter 10. Europe Pet Products Market
- 10.1 Germany
- 10.2 France
- 10.3 Italy
- 10.4 United Kingdom
- 10.5 Spain
- 10.6 Poland
- 10.7 Russia
- 10.8 Netherlands
- 10.9 Belgium
- 10.10 Sweden
- 10.11 Denmark
- 10.12 Norway
- 10.13 Rest of Europe
Chapter 11. Asia Pacific Pet Products Market
- 11.1 China
- 11.2 India
- 11.3 Japan
- 11.4 South Korea
- 11.5 Thailand
- 11.6 Indonesia
- 11.7 Vietnam
- 11.8 Malaysia
- 11.9 Australia
- 11.10 Rest of Asia Pacific
Chapter 12. Latin America Pet Products Market
- 12.1 Brazil
- 12.2 Argentina
- 12.3 Colombia
- 12.4 Chile
- 12.5 Rest of Latin America
Chapter 13. Middle East Pet Products Market
- 13.1 Saudi Arabia
- 13.2 United Arab Emirates
- 13.3 Turkey
- 13.4 Israel
- 13.5 Iran
- 13.6 Rest of the Middle East
Chapter 14. Africa Pet Products Market
- 14.1 South Africa
- 14.2 Egypt
- 14.3 Nigeria
- 14.4 Morocco
- 14.5 Rest of Africa
Chapter 15. Pet Products Company Profiles
- 15.1 [Company 01]
- 15.1.1 Company Overview
- 15.1.2 Key Management Personnel
- 15.1.3 Products & Services Portfolio
- 15.1.4 Financial Performance
- 15.1.5 Key Market Focus & Geographic Presence
- 15.1.6 Recent Developments & Strategic Initiatives
Note: The company profile list is preliminary and may change based on research findings, market developments, data availability, and client requirements.
Chapter 16. Appendices
- Appendix A – List of Abbreviations & Acronyms
- Appendix B – Industry Classification Code Reference – Full Series
- Appendix C – Production & Capacity Data Tables
- Appendix D – End-Use & Demand Base Tables
- Appendix E – Consumption & Replacement Rate Assumptions
- Appendix F – ASP Reference Tables
- Appendix G – Manufacturing & Facility Database
- Appendix H – Import-Export Data Tables
- Appendix I – Regulatory Summary Tables
- Appendix J – Primary Research Participant List (Anonymized)
- Appendix K – Primary Research Questionnaire Framework
- Appendix L – Data Sources & Bibliography
- Appendix M – Market Size Divergence & Source Comparison
Chapter 17. Research Methodology
- 17.1 Research Framework & Philosophy
- 17.2 Secondary Research – Sources, Hierarchy & Data Extraction
- 17.3 Data Modeling – Bottom-Up & Top-Down Market Sizing
- 17.4 Primary Research – Stakeholder Framework, LOI & Sample Sizes
- 17.5 Forecast Methodology – Regression, Scenario & Sensitivity Analysis
- 17.6 Quality Control – Four-Layer Validation Framework
- 17.7 Limitations & Standard Assumptions
- 17.8 Disclaimer
