
Surgical robots spread beyond urology into joints and spine
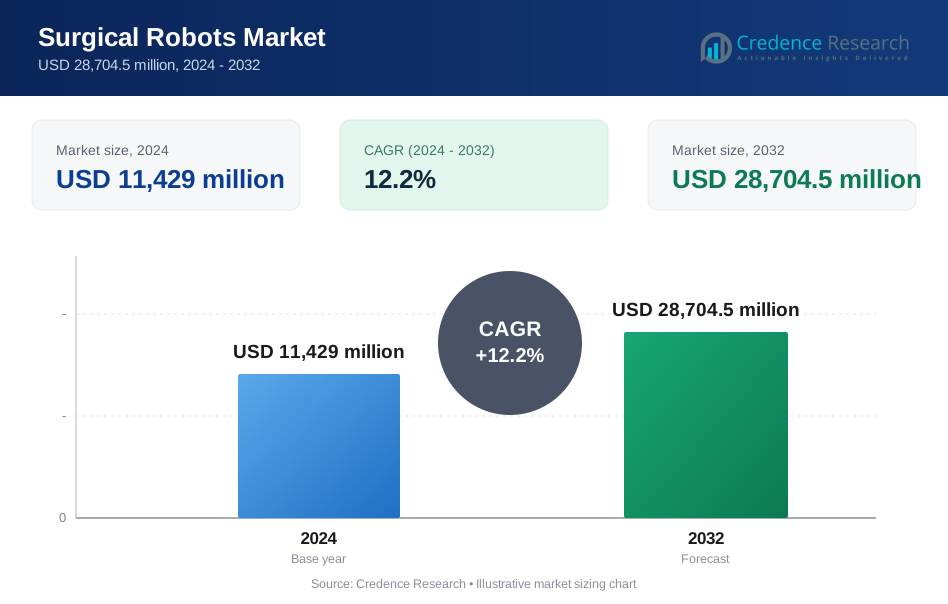
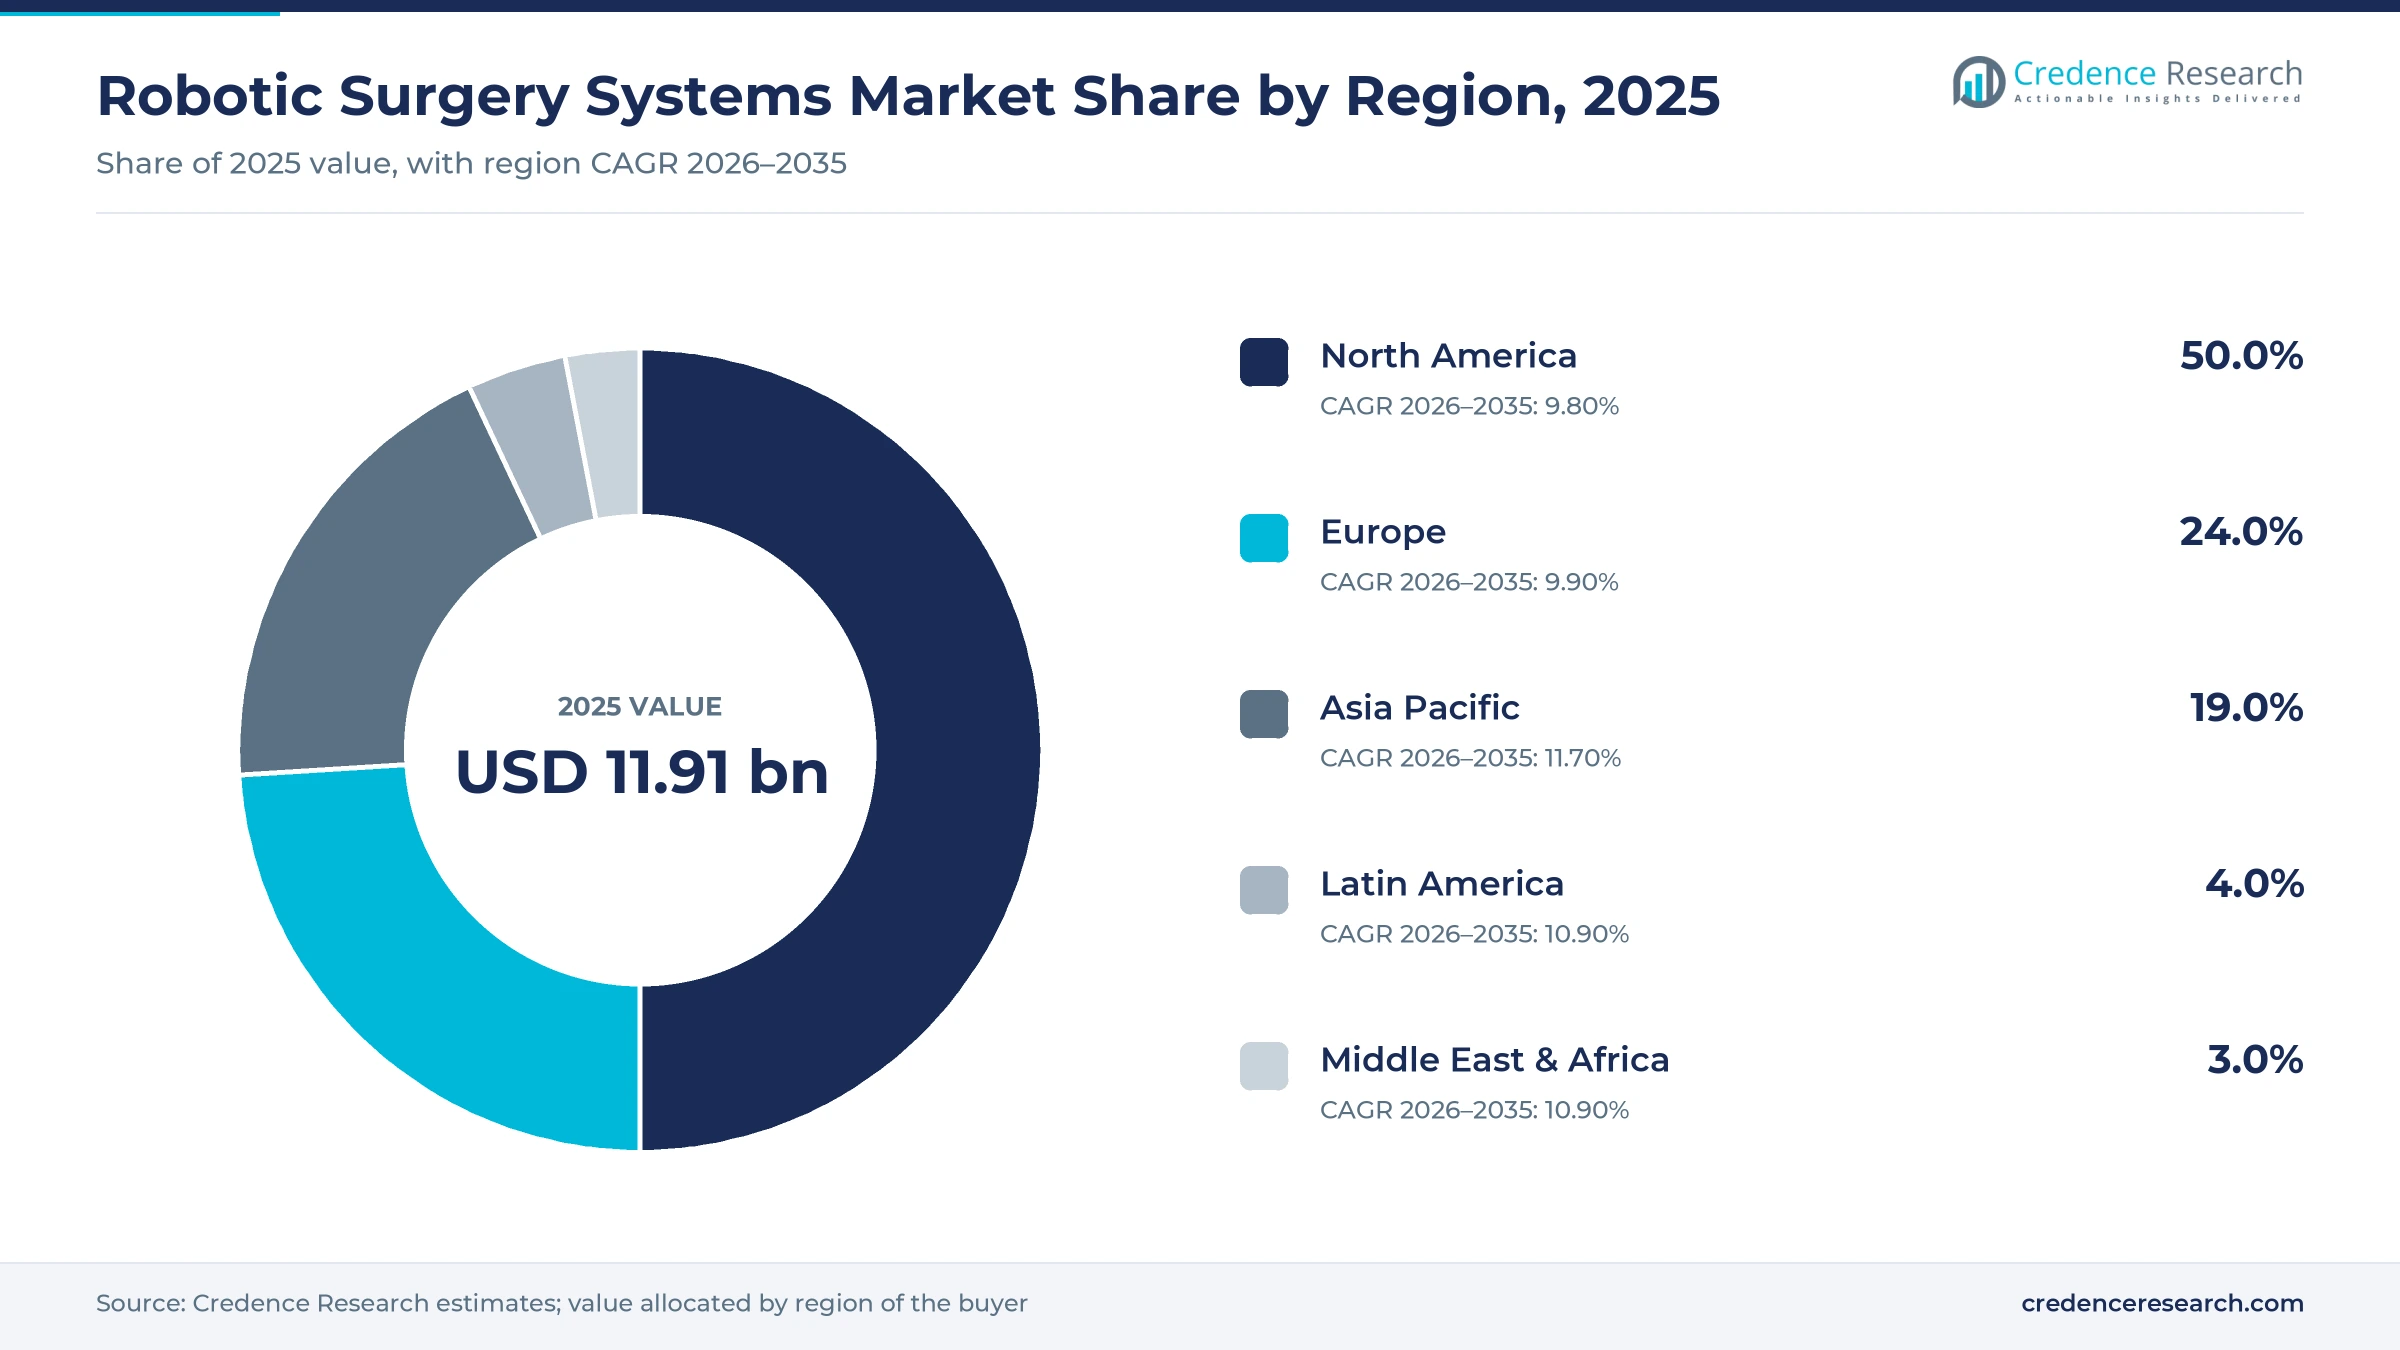
The global robotic surgery systems market was valued at USD 11.91 billion in 2025 and is projected to increase from USD 13.14 billion in 2026 to USD 31.68 billion by 2035, registering a CAGR of 10.28% during 2026–2035. Demand comes from hospitals that want minimally invasive options for prostate, kidney, hernia, colorectal, knee and hip procedures, and from surgeons trained on robotic platforms during residency. North America held the largest regional share, 50.0% in 2025, because U.S. hospitals have the widest installed base and the highest procedure volumes per system. Asia Pacific is the fastest-growing region at 11.70% a year, as China, Japan, South Korea and India add systems in large public and private hospitals. The competitive picture changed in December 2025, when a second large medical device maker gained U.S. clearance for a multi-port soft tissue robot. As a result, hospitals now have more choice on price and service terms.
Which surgical robots and supplies does this analysis cover?
The analysis counts robotic platforms for soft tissue, orthopedic and spine procedures, together with the instruments, drapes and other consumables used in each case and the accessories that support the platforms. Values are based on manufacturer selling prices, including system sales, leases and per-procedure instrument purchases.
Service contracts, training fees, standalone navigation devices and robots used only for rehabilitation or hospital logistics sit outside the scope of this analysis. The value chain runs from component and software suppliers through robot makers and distributors to hospitals, ambulatory surgical centers and specialty clinics.
Robotic Surgery Systems Market Insights
- The robotic surgery systems market grows from USD 11.91 billion in 2025 to USD 31.68 billion by 2035, a 10.28% CAGR as new platforms and wider indications reach more hospitals.
- North America held 50.0% of global surgical robot value in 2025, supported by a broad installed base and high procedure volumes.
- Consumables led product spending with 48.0% of 2025 value, while orthopedic surgery grows fastest among applications at 11.24% a year.
- In December 2025, Medtronic received FDA clearance for its Hugo system for prostatectomy, nephrectomy and cystectomy, procedures that total about 230,000 U.S. surgeries a year.
- In October 2025, Zimmer Biomet completed its acquisition of Monogram Technologies, adding a semi-autonomous knee replacement robot cleared by the FDA in March 2025.
Consumables lead as orthopedic use grows the fastest
Why do consumables lead surgical robot spending?
Based on product, the market is categorized into robotic systems, consumable and accessories. Consumable items led with a 48.0% share of 2025 value and also grow fastest at 10.66% a year, because every procedure uses new instruments, drapes and staplers. Robotic systems carry high prices per unit, yet hospitals replace them only every several years. Accessories such as camera holders and tables add steady value as each installed base grows.
Why does orthopedic surgery grow fastest among applications?
Based on application, the market is categorized into urology surgery, orthopedic surgery, general surgery and other procedures. General Surgery led with a 32.0% share of 2025 value, because hernia, colorectal and bariatric cases make up a large and growing robotic volume. Orthopedic Surgery grows fastest at 11.24% a year, as knee, hip, spine and shoulder robots reach more hospitals. Urology remains a core use for prostate and kidney cancer procedures.
Why do ambulatory surgical centers grow fastest among end users?
Based on end user, the market is categorized into hospitals, ambulatory surgical centers, specialty clinics and others. Hospitals led with a 72.0% share of 2025 value, because large operating rooms and complex cancer cases remain concentrated there. Ambulatory Surgical Centers grow fastest at 11.65% a year, as joint replacement and hernia repair move to outpatient settings. Specialty clinics add further demand for compact orthopedic and urology robots.
| Segment Group | Leading Sub-segment | Share, 2025 | Fastest-growing Sub-segment | CAGR, 2026–2035 |
|---|---|---|---|---|
| By Product | Consumable | 48.0% | Consumable | 10.66% |
| By Application | General Surgery | 32.0% | Orthopedic Surgery | 11.24% |
| By End User | Hospitals | 72.0% | Ambulatory Surgical Centers | 11.65% |
Request a Free Sample
Fill in your details and we'll send you a free sample report.
- Sample data tables & charts
- Research methodology
Aging patients and new platforms lift robot demand
How do new urology clearances widen access to soft tissue robots?
New urology clearances widen access to soft tissue robots, because hospitals gain a second major supplier for common cancer operations. On Dec. 3, 2025, Medtronic announced FDA clearance of its Hugo system for urologic procedures, including prostatectomy, nephrectomy and cystectomy. The company said those procedures account for about 230,000 surgeries each year in the United States. Medtronic also noted that Hugo had already been used in tens of thousands of procedures across more than 30 countries. In turn, robotic options for prostate cancer care become available to more U.S. hospitals, while Medtronic plans to add general and gynecologic indications that would widen use further.
Why does an aging population lift demand for orthopedic robots?
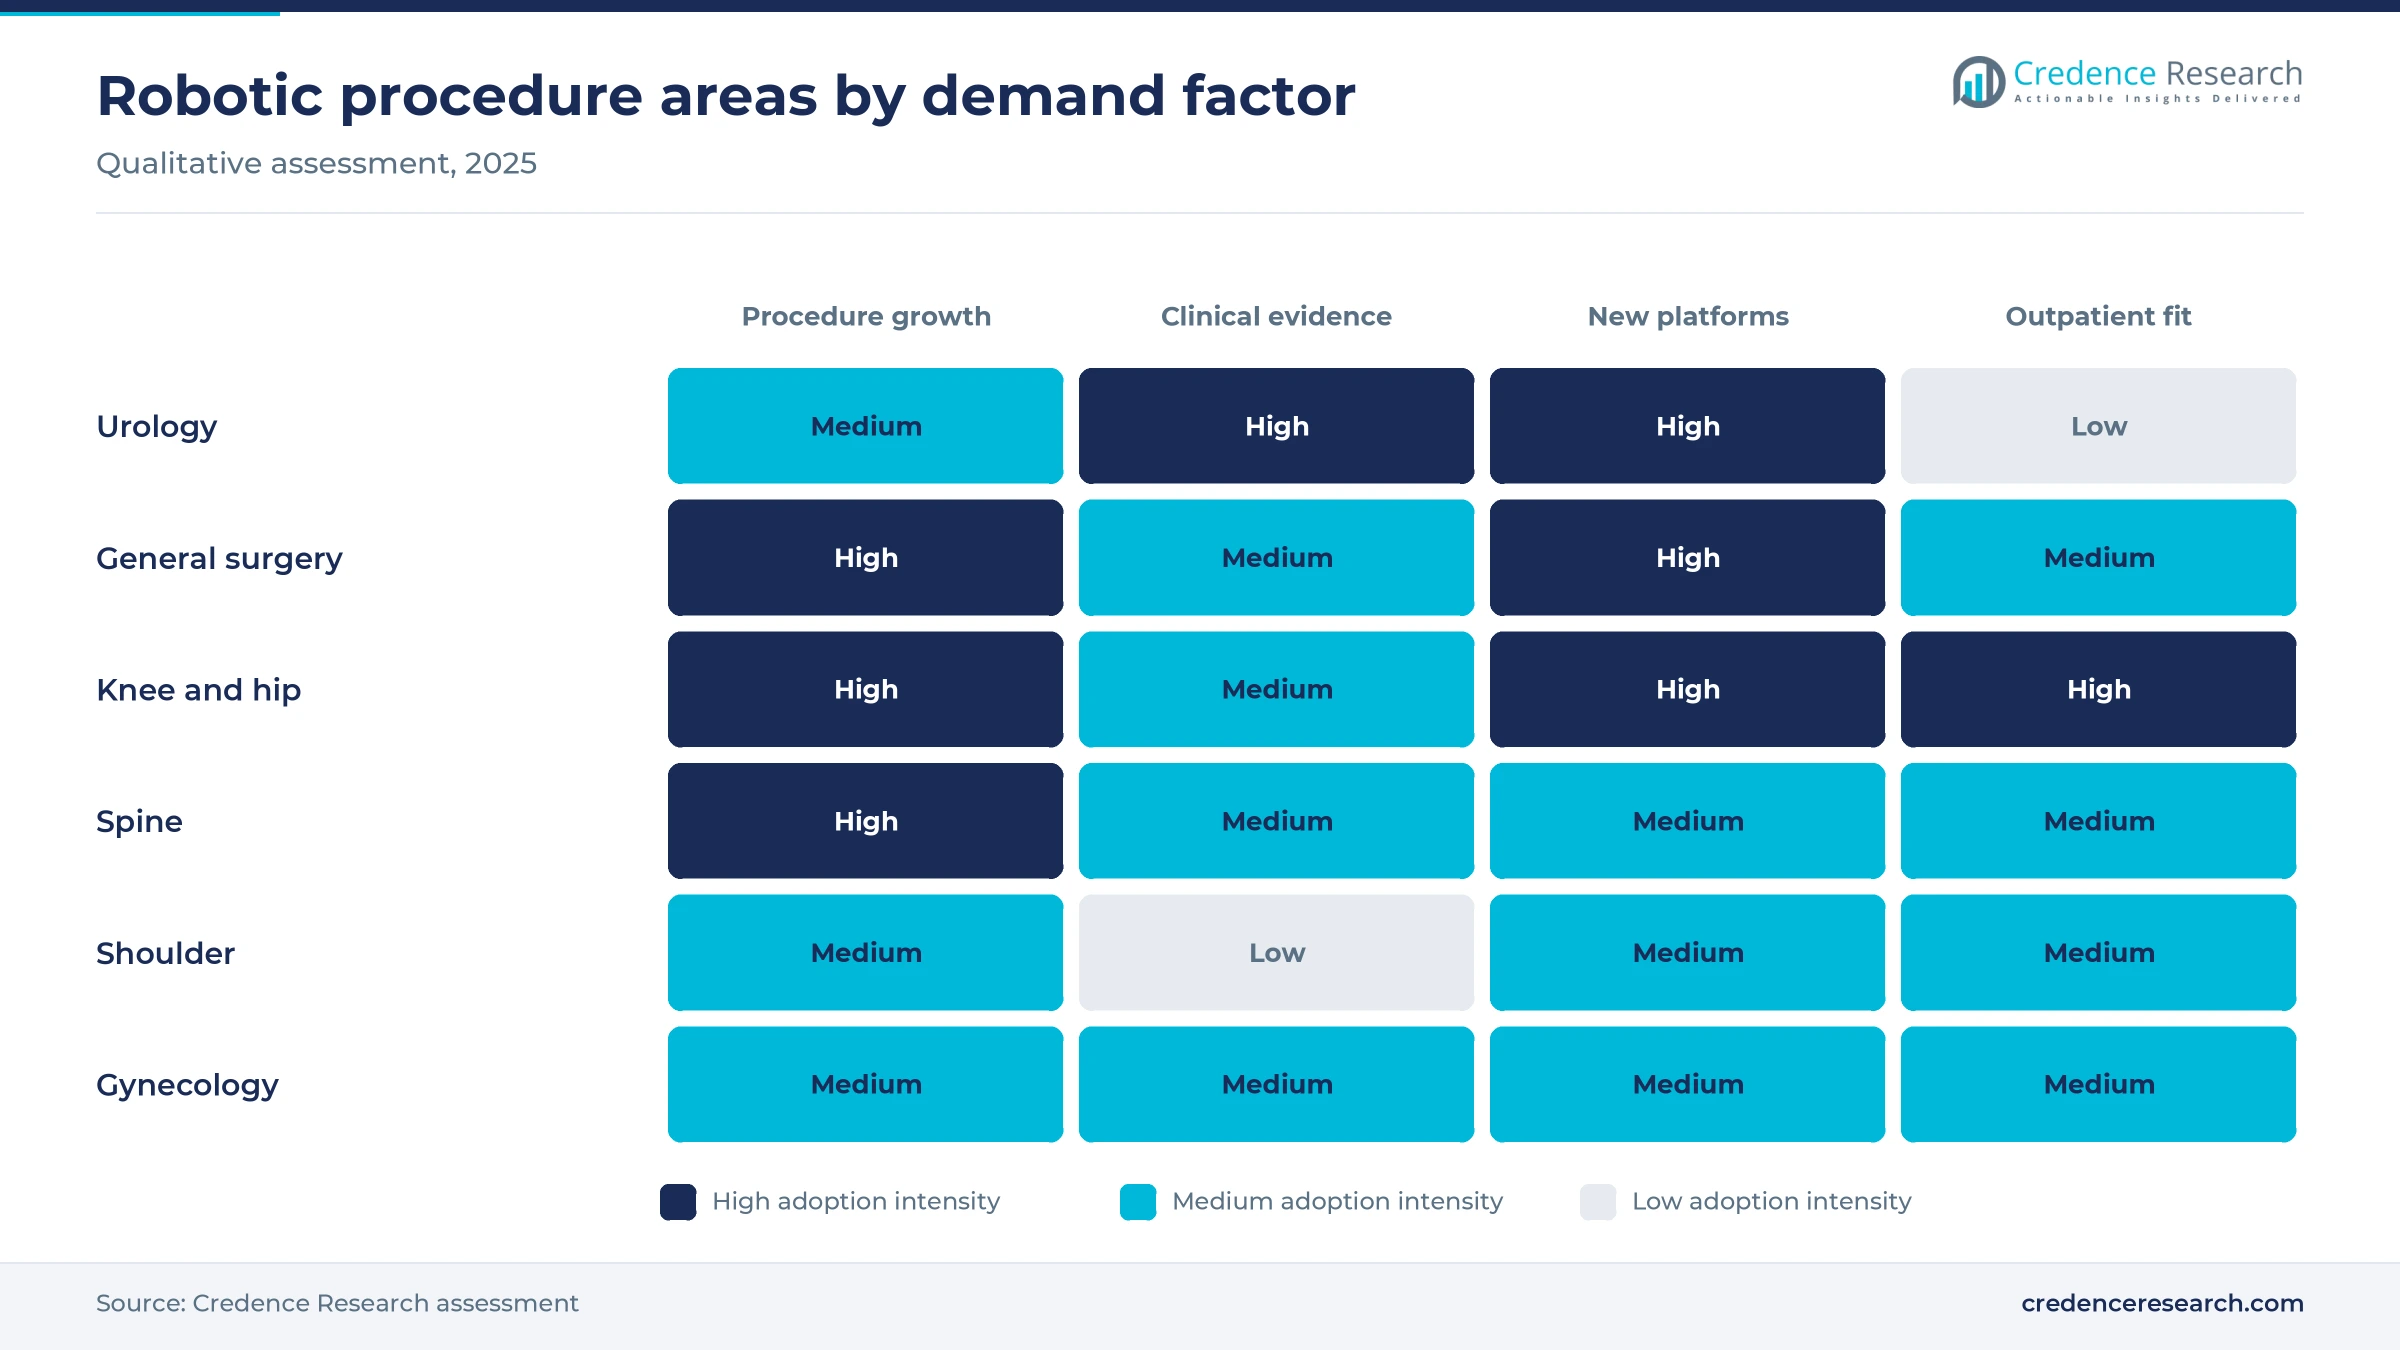
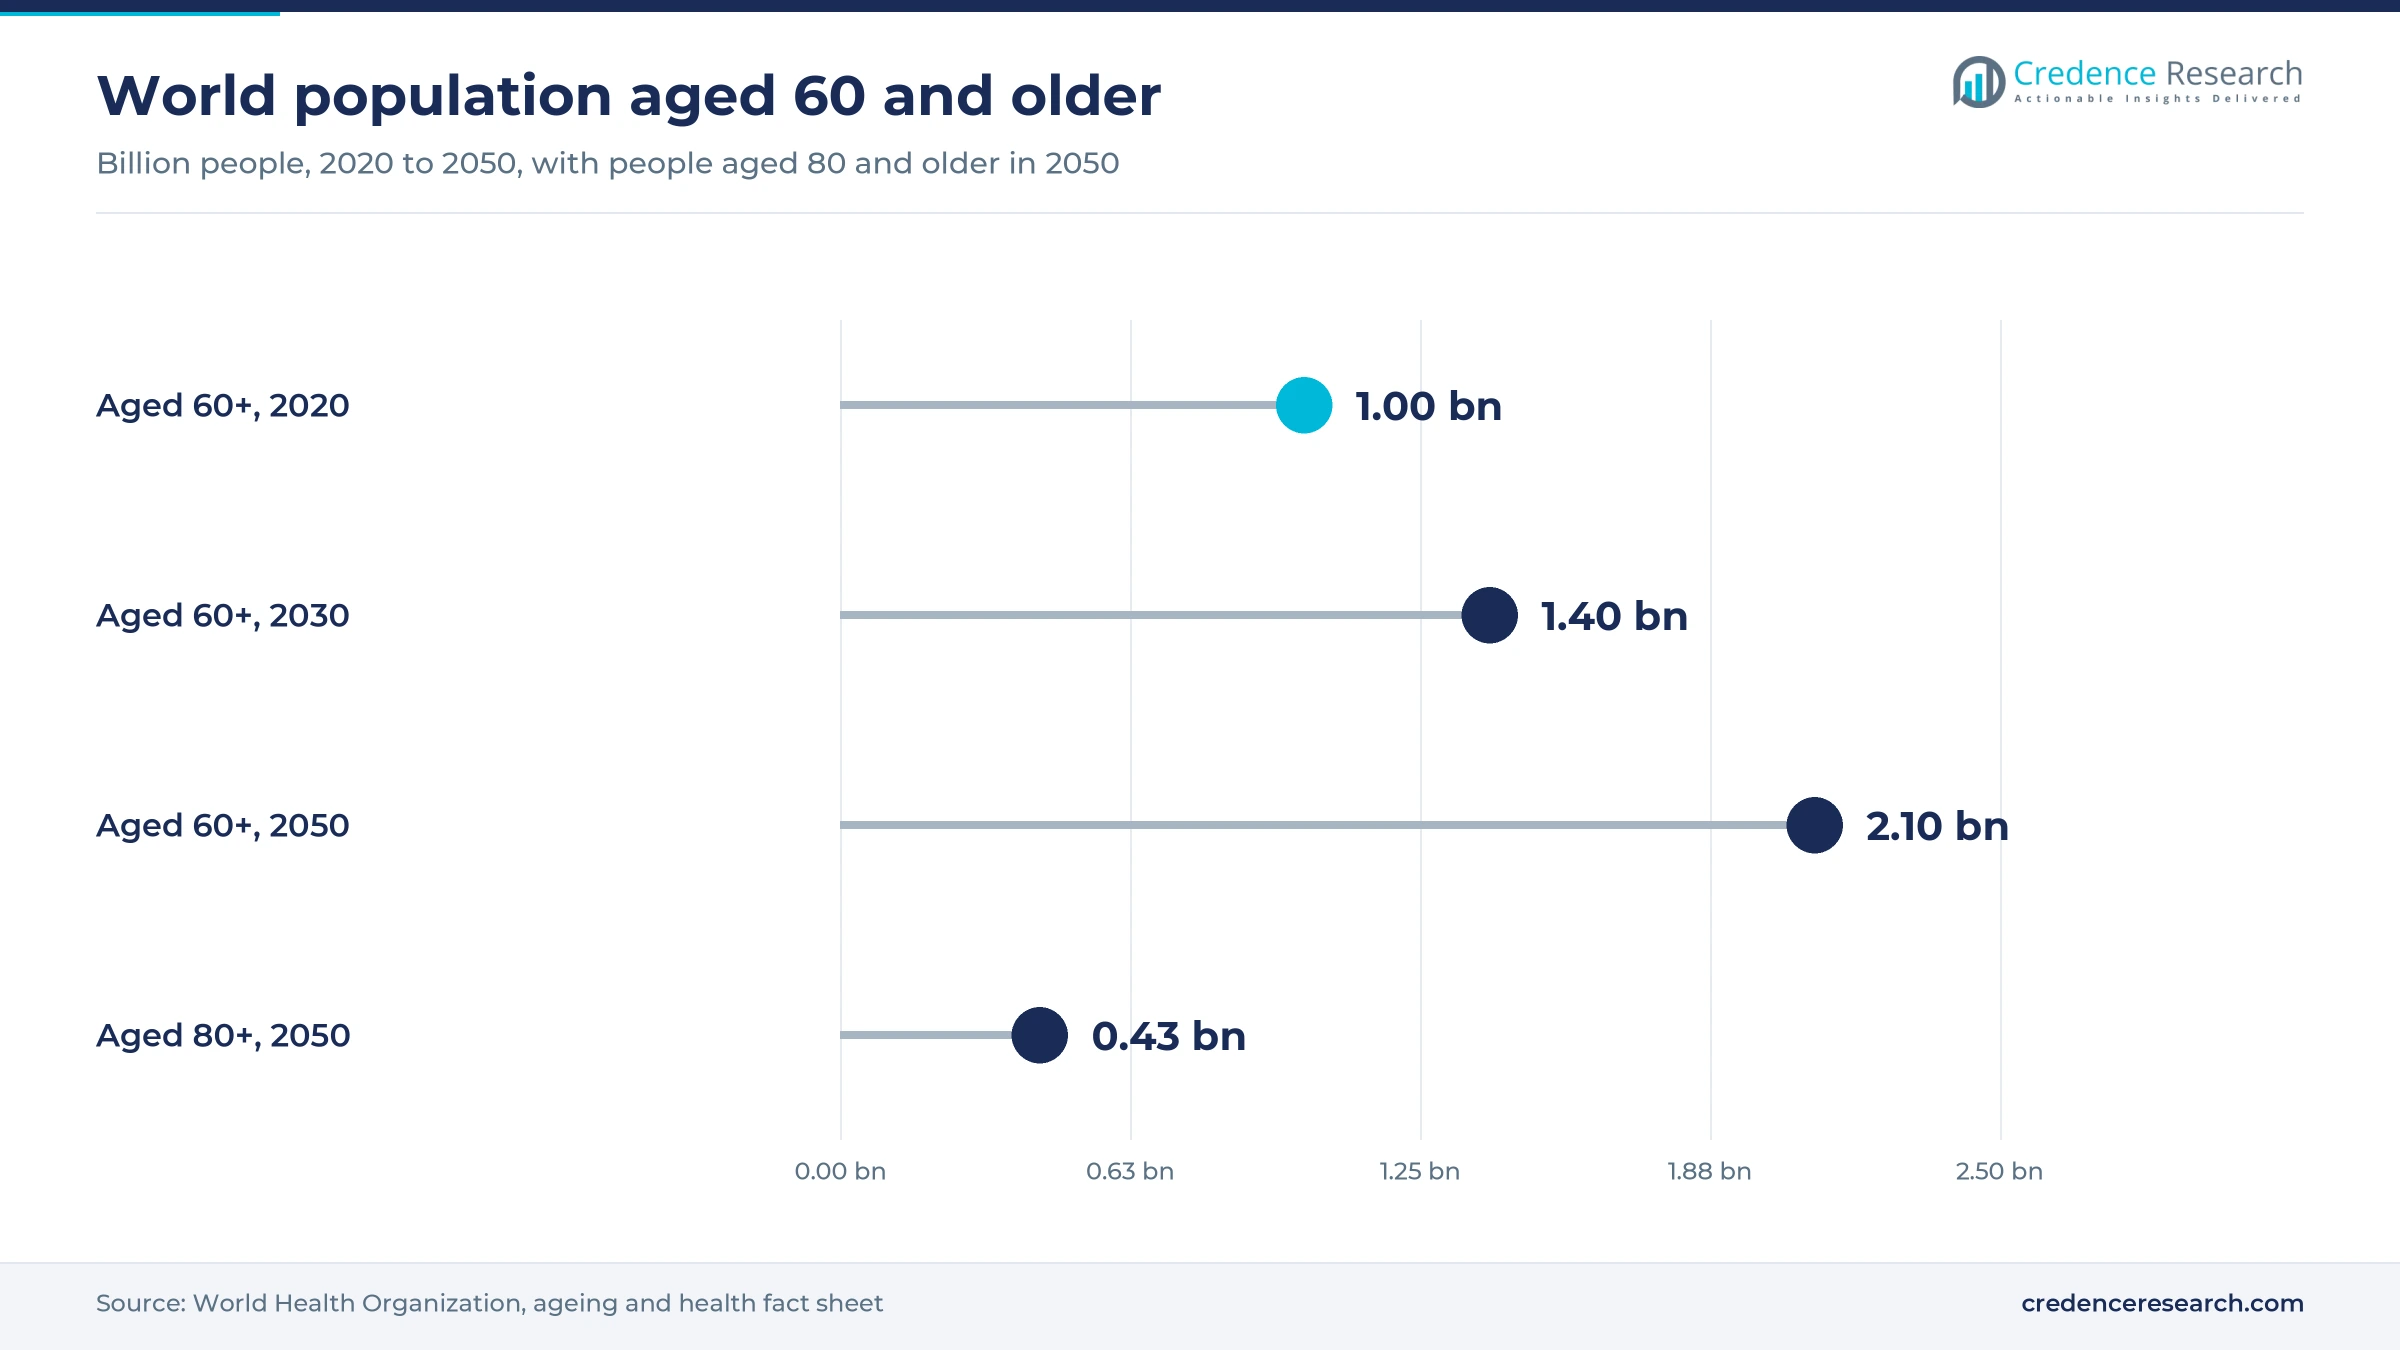
An aging population lifts demand for orthopedic robots, because joint disease and fractures rise sharply with age. The World Health Organization projects that people aged 60 and older will grow from 1 billion in 2020 to 1.4 billion by 2030 and 2.1 billion by 2050. WHO also expects the number of people aged 80 or older to triple between 2020 and 2050 to 426 million. Stryker reported more than 1.5 million Mako procedures performed across 45 countries by March 2025. As a result, orthopedic surgery grows fastest among applications at 11.24% a year, as robotic knee replacement and hip procedures expand among older adults.
How do platform upgrades raise instrument use per robot?
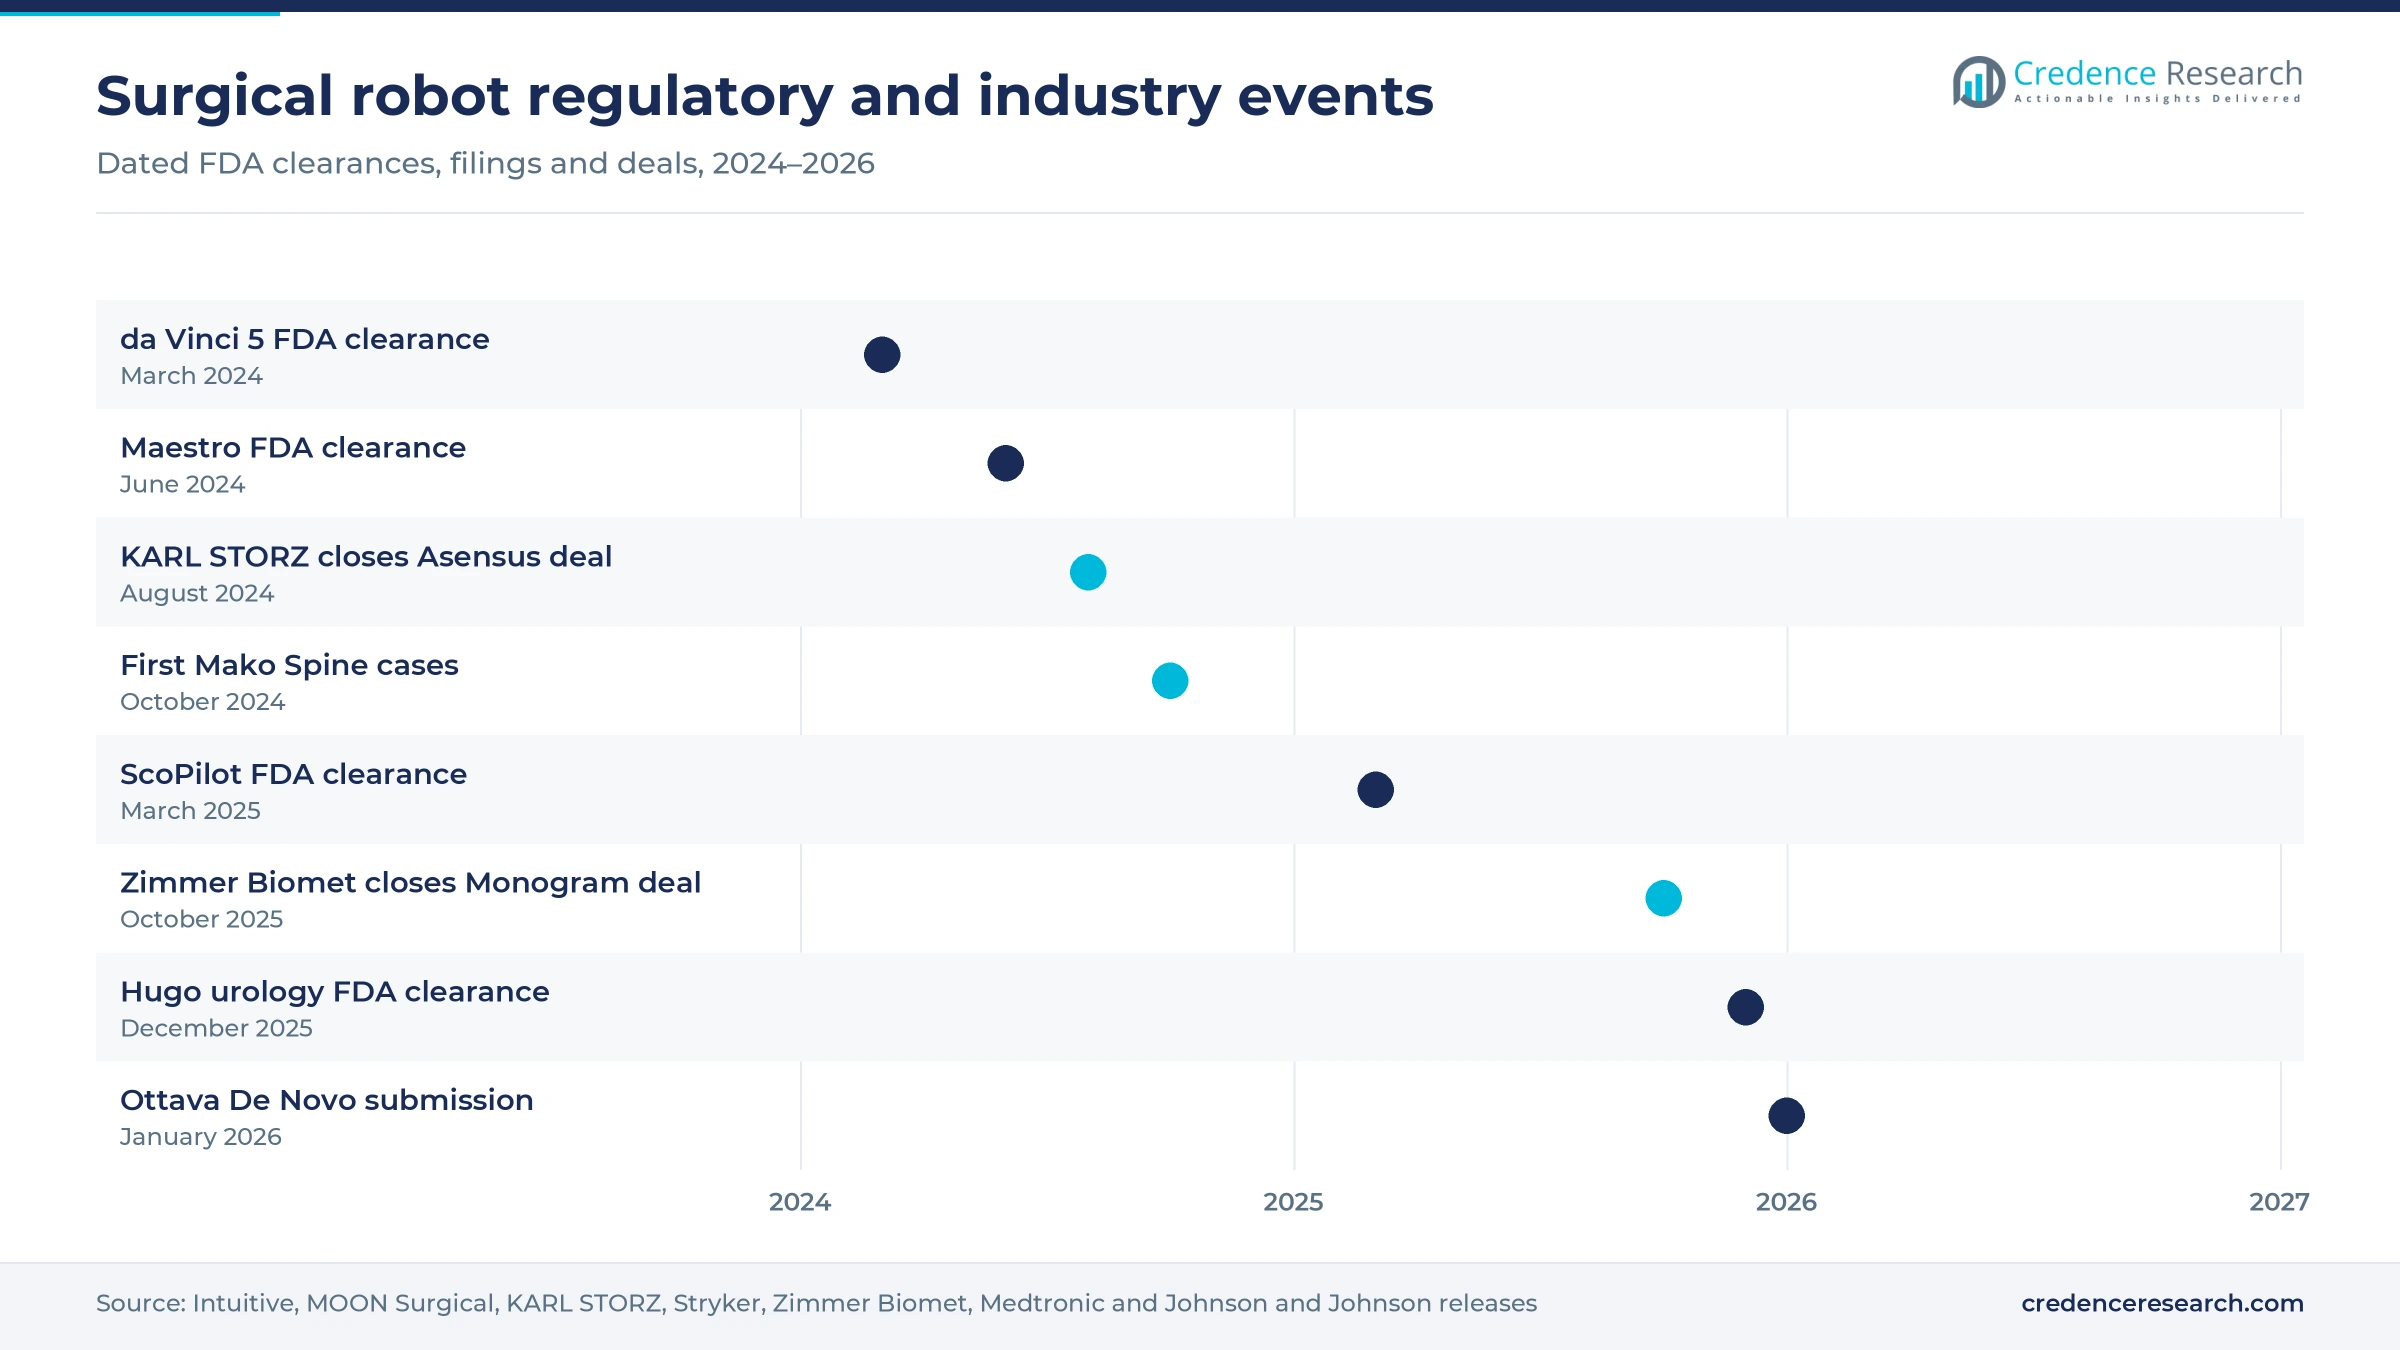
Platform upgrades raise instrument use per robot, because new systems add capabilities that bring more procedure types onto the robot. In March 2024, Intuitive announced FDA clearance of da Vinci 5, its fifth generation multiport system. The company said da Vinci 5 has more than 10,000 times the computing power of da Vinci Xi. Its force feedback showed up to 43% less force on tissue in preclinical trials. Intuitive also reported that da Vinci Xi had been used in more than 7 million procedures. In turn, consumables hold the largest product share at 48.0% of 2025 value, because each added procedure needs new instruments and drapes.
Why are new entrants widening hospital choice?
New entrants are widening hospital choice, because buyers can now compare several platforms on price, footprint and service. In August 2024, KARL STORZ completed its acquisition of Asensus Surgical, formerly TransEnterix, at USD 0.35 per share. MOON Surgical received FDA clearance for its Maestro system in June 2024, and the system had treated more than 1,100 patients by March 2025. On Jan. 7, 2026, Johnson and Johnson submitted its Ottava system to the FDA through the De Novo pathway for upper abdominal general surgery. A second Ottava study for inguinal hernia repair began in late 2025. As a result, competition on price and terms is expected to lift adoption in midsize hospitals.
AI camera control and semi-autonomous robots emerge
How is AI camera control shifting soft tissue workflow?
AI camera control is shifting soft tissue workflow, because surgeons can move the view without letting go of their instruments. In March 2025, MOON Surgical announced FDA clearance of ScoPilot on its Maestro system. ScoPilot lets the attached laparoscope follow a chosen instrument tip and runs locally on the NVIDIA Holoscan platform. Maestro supports general, bariatric, gynecologic and urologic procedures in the United States and Europe. Medtronic also connects Hugo to its Touch Surgery ecosystem for tele-proctoring and case insights after surgery. As a result, software and data tools are becoming a key point of difference, which supports general surgery in holding 32.0% of 2025 application value.
Why are semi-autonomous joint robots emerging?
Semi-autonomous joint robots are emerging, because they can carry out planned bone cuts with less manual guidance. In March 2025, Monogram Technologies received FDA 510(k) clearance for a CT-based, AI-navigated system for total knee replacement. Zimmer Biomet completed its acquisition of Monogram on Oct. 7, 2025, and expects to sell the system with its own implants by early 2027. Monogram began a clinical study of a fully autonomous version in July 2025. These steps support demand for orthopedic implants matched to robotic plans. In turn, robot makers that pair implants with planning software can lock in repeat implant and instrument sales.
Can spine and shoulder procedures open new orthopedic demand?
Robot makers have a clear opening in spine and shoulder procedures, because these joints were rarely served by earlier orthopedic robots. Stryker completed its first Mako Spine cases in October 2024 and its first Mako Shoulder cases at the end of 2024, according to its March 2025 update. The company expected a full U.S. launch of Mako Spine in the second half of 2025. Its fourth-generation Mako 4 covers total hip, total knee, partial knee and spine on one platform. Stryker also added robotic revision hip capability, which it describes as first to market. As a result, orthopedic procedures are expected to keep the fastest application growth through 2035.
Where can compact platforms add outpatient demand?
Compact platforms can add outpatient demand, because smaller centers need robots that fit tight rooms and budgets. Medtronic, which gained Hugo clearance in December 2025, designs the system with movable modular arms that fit different operating tables. In August 2024, KARL STORZ acquired Asensus for its Senhance digital laparoscopy system, which the company presents as a more accessible robotic option. MOON Surgical, cleared for Maestro in June 2024, built the system to work alongside standard laparoscopic tools. These designs suit centers moving joint, hernia and gallbladder cases out of hospitals. In turn, ambulatory surgical centers grow fastest among end users at 11.65% a year, as payers shift routine procedures to lower-cost settings.
Capital cost, training and proof of value slow uptake
Why does high capital cost slow purchases in smaller hospitals?
High capital cost slows purchases in smaller hospitals, because a soft tissue robot carries a high upfront price before instruments and service. Smaller hospitals often perform too few cases to spread that cost across enough patients. Leasing and per-procedure pricing help, yet they raise long-term spending. As a result, many rural and public hospitals delay purchases, while makers offer flexible financing, refurbished systems and shared-use programs to reach these buyers.
How do training needs limit robot use?
Training needs limit robot use, because surgeons and operating room teams must complete simulation and supervised cases before working on their own. Each platform has different controls, so teams cannot easily switch between systems from different makers. Staff turnover also forces hospitals to repeat costly training programs each year. In turn, new platforms take longer to reach full use, which slows instrument sales in the first years after installation and delays the return on each system.
Why does limited proof of value restrain some procedures?
Limited proof of value restrains some procedures, because studies for common operations such as gallbladder removal show small clinical gains over standard laparoscopy. Payers rarely pay more for robotic cases, so hospitals must absorb higher instrument costs. Health technology agencies in Europe ask for strong outcome data before funding robots. As a result, makers must produce comparative studies that show shorter stays, fewer conversions to open surgery or faster recovery.
How do regulatory and cyber requirements raise development costs?
Regulatory and cyber requirements raise development costs, because connected robots must meet strict software, safety and data protection rules. Each new indication needs clinical evidence, which can add years before launch. Cloud links for tele-proctoring and data tools also widen cyber risk for hospitals. In turn, smaller developers face long and costly paths to market, which favors established makers with large regulatory, clinical and security teams.
North America leads as Asia Pacific gains pace
| Region | Value, 2025 (USD billion) | Share, 2025 | CAGR, 2026–2035 |
|---|---|---|---|
| North America | 5.96 | 50.0% | 9.80% |
| Europe | 2.86 | 24.0% | 9.90% |
| Asia Pacific | 2.26 | 19.0% | 11.70% |
| Latin America | 0.48 | 4.0% | 10.90% |
| Middle East & Africa | 0.36 | 3.0% | 10.90% |
Why does a large installed base keep North America in the lead?
North America held 50.0% of 2025 value and grows at 9.80% a year through 2035. The United States drives this position, because most large hospitals already run at least one robot and buy instruments for every case. Recent U.S. clearances for da Vinci 5, Maestro, ScoPilot and Hugo widened choice for hospital buyers. Intuitive Surgical, Stryker Corporation, Zimmer Biomet and THINK Surgical, Inc. are based in the country, and Johnson and Johnson filed Ottava with the FDA in January 2026.
How does Europe balance strong surgical training with budget limits?
Europe held 24.0% of 2025 value and grows at 9.90% a year through 2035. Germany, the United Kingdom, France and Italy lead regional spending, and Renishaw plc and Smith and Nephew are based in the United Kingdom. MOON Surgical has treated patients in Europe as well as the United States. However, public hospital budgets and outcome reviews slow purchases of high-cost robots, so many centers share one system across several specialties.
Why do China and India drive Asia Pacific growth?
Asia Pacific held 19.0% of 2025 value and is the fastest-growing region at 11.70% a year. China and India are adding robots in large public and private hospitals, while Japan and South Korea already have strong robotic urology programs. Local makers in the region also offer lower-cost platforms to public and private hospital buyers, which widens access beyond major cities. Aging populations across Japan, China and South Korea also support steady joint replacement demand.
Why are private hospitals central in Latin America?
Latin America held 4.0% of 2025 value and grows at 10.90% a year through 2035. Brazil and Mexico lead regional spending, where private hospital groups buy robots to attract surgeons and insured patients. Currency swings and import costs limit purchases by public hospitals.
Why does access remain uneven across the Middle East and Africa?
The Middle East and Africa held 3.0% of 2025 value and grows at 10.90% a year through 2035. Gulf states fund robotic programs in flagship hospitals, while most of Africa has very few systems. This gap keeps robotic procedures concentrated in a small number of major cities.
FDA clearances and deals in surgical robots since 2024
| Development | Status and market relevance |
|---|---|
| In March 2024, Intuitive received FDA 510(k) clearance for da Vinci 5, its fifth-generation multiport system. | Cleared; adds force feedback and more than 10,000 times the computing power of da Vinci Xi |
| In August 2024, KARL STORZ completed its acquisition of Asensus Surgical, formerly TransEnterix. | Completed; adds the Senhance digital laparoscopy system |
| In March 2025, MOON Surgical announced FDA clearance of its AI-based ScoPilot feature on the Maestro system. | Cleared; laparoscope follows a chosen instrument tip |
| In October 2025, Zimmer Biomet completed its acquisition of Monogram Technologies. | Completed; semi-autonomous knee robot expected with Zimmer Biomet implants by early 2027 |
| In December 2025, Medtronic received FDA clearance for the Hugo system for urologic procedures. | Cleared; covers prostatectomy, nephrectomy and cystectomy |
Force feedback, AI guidance and modular arms advance
- Force feedback lets surgeons feel pressure on tissue through the controls, which can reduce tissue damage.
- AI camera control moves the laparoscope to follow instruments, which frees the surgeon from manual camera adjustment.
- Modular robotic arms can be placed around the table on separate carts, which suits different rooms and procedures.
- CT-based planning builds a three-dimensional model of each joint, which guides bone cuts and implant placement.
- Tele-proctoring tools let expert surgeons watch and guide cases from a distance, which speeds training on new platforms.
Need a Custom Version of This Report?
Tailor the scope, geography, or segments to your exact requirements.
- Custom geography or segment scope
- Direct access to our analyst team
Robot makers compete on platforms and instruments
Competition is led by Intuitive Surgical in soft tissue procedures and by Stryker Corporation, Zimmer Biomet and Smith and Nephew in orthopedic robots. Medtronic entered the U.S. soft tissue field with its Hugo clearance in December 2025, and Johnson and Johnson submitted its Ottava system to the FDA in January 2026. MOON Surgical, THINK Surgical, Inc., Renishaw plc and Medrobots Corporation serve narrower uses such as camera control, joint replacement, neurosurgery and flexible access. Transenterix, now part of KARL STORZ as Asensus Surgical, offers the Senhance digital laparoscopy system. Orthopedic makers link robots to their own implants, while soft tissue makers rely on instrument sales per case. As a result, companies compete on installed base, instrument pricing, indications, training support and data tools, and each new clearance tests how far hospitals will move away from the leading platform.
Companies profiled and their roles in this market
| Company | Type | Role in the market |
|---|---|---|
| Intuitive Surgical | Platform leader | da Vinci 5 and da Vinci Xi multiport systems |
| Medrobots Corporation | Specialist | Flexible robotic access systems |
| Medtronic | Diversified | Hugo modular soft tissue system |
| Renishaw plc | Specialist | Neurosurgical robotic platforms |
| Smith and Nephew | Orthopedic | Handheld robotics for knee procedures |
| Stryker Corporation | Orthopedic | Mako 4 for hip, knee and spine |
| THINK Surgical, Inc. | Specialist | Robotic knee replacement systems |
| Transenterix | Specialist | Senhance system, now under KARL STORZ |
| Zimmer Biomet | Orthopedic | ROSA platform and Monogram knee robot |
| MOON Surgical | Specialist | Maestro system with ScoPilot |
Orthopedic and outpatient use set the pace
Credence Research's view is that orthopedic and outpatient use will set the pace of growth through 2035, because joint, spine and hernia procedures are moving onto robots in large numbers. The overall market grows at 10.28% a year, supported by aging populations, new platforms and wider indications. Consumables keep the largest share, as each new procedure needs new instruments. Companies that combine compact robots, implant planning and strong training support will win the most new hospital and outpatient accounts.
How Credence Research sized surgical robot spending
The report uses 2025 as the base year and 2026 to 2035 as the forecast period. Market values come from the Credence Research model, which builds spending by product, application, end user and region. Regional and segment splits are Credence Research estimates informed by World Health Organization statistics, FDA clearances and company press releases and regulatory filings. No primary interviews or surveys were used in preparing this edition of the report.
Surgical robot outlook to 2035
By 2035, the robotic surgery systems market is projected to reach USD 31.68 billion, with growth led by orthopedic procedures, outpatient centers and new soft tissue platforms. Consumables will remain the largest product group, as procedure volume rises on each installed robot. North America keeps the largest installed base, while Asia Pacific adds the most new systems. Semi-autonomous joint robots and AI camera tools will reach routine use. As a result, advantage will depend on price, indications and training support.
Frequently Asked Questions
How big is the global robotic surgery systems market?
Which product leads the robotic surgery systems market?
Which region leads spending on surgical robots?
Which application grows fastest in robotic surgery?
Which new surgical robots gained FDA clearance since 2024?
Why are ambulatory surgical centers adopting robots?
Who are the leading robotic surgery systems companies?
What restrains growth in robotic surgery?
Table of Content
Chapter 1 Market Segmentation
- 1.1 Segmentation Framework
- 1.1.1 Product and Service Classification
- 1.1.2 Application and End-Use Classification
- 1.1.3 Technology and Solution Classification
- 1.1.4 Customer and Distribution Channel Classification
- 1.1.5 Geographic Segmentation
- 1.1.6 Market Segment Definitions and Boundaries
- 1.2 By Product
- 1.2.1 Consumable
- 1.2.2 Robotic Systems
- 1.2.3 Accessories
- 1.3 By Application
- 1.3.1 General Surgery
- 1.3.2 Urology Surgery
- 1.3.3 Orthopedic Surgery
- 1.3.4 Others
- 1.4 By End User
- 1.4.1 Hospitals
- 1.4.2 Ambulatory Surgical Centers
- 1.4.3 Specialty Clinics
- 1.4.4 Others
Chapter 2 Introduction
- 2.1 Report Objectives and Scope
- 2.2 Product Definition and Industry Terminology
- 2.3 Market Inclusions and Exclusions
- 2.4 Research Process
- 2.4.1 Primary Research and Expert Interviews
- 2.4.2 Secondary Research and Source Review
- 2.4.3 Top-Down and Bottom-Up Estimation
- 2.4.4 Data Triangulation and Verification
- 2.5 Market Size Measurement Basis
- 2.5.1 2025: USD 11.91 billion → 2035: USD 31.68 billion
- 2.6 Historical and Forecast Reference Periods
- 2.6.1 Historical Period: 2018-2025
- 2.6.2 Base Year: 2025
- 2.6.3 Forecast Period: 2025-2035
- 2.7 Research Assumptions and Limitations
Chapter 3 Executive Summary
- 3.1 Market Snapshot and Key Findings
- 3.2 Base-Year Market Size, 2025
- 3.3 Forecast Market Size, 2035
- 3.4 Revenue and Volume Growth Outlook
- 3.5 Key Demand and Supply Indicators
- 3.6 Leading Market Segments
- 3.7 Fastest-Growing Market Opportunities
- 3.8 Regional Performance Highlights
- 3.9 Technology and Industry Transformation
- 3.10 Competitive Landscape Summary
- 3.11 Analyst View and Strategic Implications
Chapter 4 Global Robotic Surgery Systems Market Trends and Developments
- 4.1 Historical Industry Development, 2018-2025
- 4.2 Recent Market Trends and Developments
- 4.3 Demand and Customer Behavior Trends
- 4.4 Technology and Product Innovation
- 4.5 Artificial Intelligence, Automation and Digitalization
- 4.6 Local Manufacturing and Supply Chain Realignment
- 4.7 Industry Partnerships, Mergers and Acquisitions
- 4.8 Sustainability and Circular Economy Developments
- 4.9 Government and Private Sector Investment Trends
- 4.10 Emerging Business Models and Commercialization
- 4.11 Industry Developments and Announcements
Chapter 5 Global Robotic Surgery Systems Market Production, Supply and Demand Analysis
- 5.1 Demand Trend and Consumption Analysis, 2018-2025
- 5.2 Demand Forecast, 2025-2035
- 5.3 Production and Output Trend, 2018-2025
- 5.4 Production and Output Forecast, 2025-2035
- 5.5 Installed Capacity and Capacity Utilization
- 5.6 Company-Wise Production Plants and Statistics
- 5.6.1 Installed Production Capacity
- 5.6.2 Actual Production
- 5.6.3 Planned Capacity and Expansion Targets
- 5.7 Supply Chain Structure and Procurement Trends
- 5.8 Supply-Demand Gap and Bottlenecks
- 5.9 Import Dependence and Sourcing Structure
- 5.10 Contract Manufacturing and Outsourcing
- 5.11 Regional Supply and Demand Concentration
Chapter 6 Global Robotic Surgery Systems Market Pricing Analysis
- 6.1 Pricing Structure and Measurement
- 6.2 Historical Pricing Trends, 2018-2025
- 6.3 Pricing Outlook, 2025-2035
- 6.4 Average Selling Price and Unit Economics
- 6.5 Pricing by Product and Market Segment
- 6.6 Geographic Pricing Differences
- 6.7 Key Input, Energy, Labor and Logistics Costs
- 6.8 Contract Pricing and Purchasing Models
- 6.9 Pricing Sensitivity and Competitive Positioning
- 6.10 Price, Margin and Profitability Implications
Chapter 7 Global Robotic Surgery Systems Market Dynamics
- 7.1 Market Growth Drivers
- 7.1.1 Demand-Side Drivers
- 7.1.2 Technology and Innovation Drivers
- 7.1.3 Infrastructure and Investment Drivers
- 7.1.4 Regulatory and Policy Drivers
- 7.2 Market Restraints
- 7.2.1 Cost and Affordability Constraints
- 7.2.2 Technology and Adoption Barriers
- 7.2.3 Supply Chain and Operational Constraints
- 7.3 Market Challenges
- 7.3.1 Competitive Pressure and Margin Erosion
- 7.3.2 Skills, Infrastructure and Implementation Gaps
- 7.4 Emerging Market Opportunities
- 7.5 Market Dynamics Impact and Time-Horizon Assessment
Chapter 8 Global Robotic Surgery Systems Value Chain Analysis
- 8.1 Industry Value Chain Overview
- 8.2 Upstream Suppliers and Critical Inputs
- 8.3 Technology and Component Providers
- 8.4 Manufacturing or Service Delivery
- 8.5 Distribution, Channel Partners and Integrators
- 8.6 Downstream Applications and End Users
- 8.7 Value Addition and Profit Pools
- 8.8 Vertical Integration and Outsourcing
- 8.9 Supplier Concentration and Risk
- 8.10 Supply Chain Localization and Resilience
Chapter 9 Global Robotic Surgery Systems Market Regulations and Policies
- 9.1 Relevant Laws, Standards and Compliance Frameworks
- 9.2 Product, Service, Safety and Quality Requirements
- 9.3 Government Policies, Incentives and Subsidies
- 9.4 Imports, Exports and Trade Barriers
- 9.5 Public Procurement and Local Content Requirements
- 9.6 Environmental and Sustainability Compliance
- 9.7 Upcoming Policy Changes and Market Implications
Chapter 10 Global Robotic Surgery Systems Market Hotspots and Opportunities
- 10.1 Market Opportunity Mapping and Growth Hotspots
- 10.2 High-Growth Applications and Customer Groups
- 10.3 Underserved Markets and White-Space Opportunities
- 10.4 Emerging Technology and Product Opportunities
- 10.5 New Capacity and Investment Hotspots
- 10.6 Market Entry and Expansion Opportunities
- 10.7 Distribution and Partnership Opportunities
- 10.8 Near-Term and Long-Term Commercial Potential
- 10.9 Opportunity Attractiveness and Execution Risks
Chapter 11 Global Robotic Surgery Systems Market Outlook, 2025-2035
- 11.1 Market Size and Analysis
- 11.1.1 Revenue (Market Measurement: 2025: USD 11.91 billion → 2035: USD 31.68 billion)
- 11.1.2 Market Volume and Quantity Sold
- 11.1.3 Historical Market Size, 2018-2025
- 11.1.4 Base-Year Market Size, 2025
- 11.2 Market Forecast, 2025-2035
- 11.2.1 Revenue Forecast to 2035
- 11.2.2 Volume Forecast to 2035
- 11.2.3 CAGR and Year-on-Year Growth
- 11.2.4 Incremental Revenue Opportunity
- 11.3 Forecast Assumptions and Scenario Analysis
- 11.3.1 Base-Case Forecast
- 11.3.2 Optimistic and Conservative Scenarios
- 11.3.3 Technology, Pricing and Policy Sensitivities
- 11.4 Market Attractiveness and Growth Outlook
Chapter 12 Global Robotic Surgery Systems Market Segmentation and Outlook
- 12.1 Segmentation Summary and Market Shares, 2025
- 12.2 Largest and Fastest-Growing Segments
- 12.3 By Product - Market Size and Forecast, 2025-2035
- 12.3.1 Segment Definition and Scope
- 12.3.2 Historical Market Size, 2018-2025
- 12.3.3 Revenue Forecast, 2025-2035
- 12.3.4 Volume Forecast, 2025-2035
- 12.3.5 Base-Year Market Share, 2025
- 12.3.6 Segment CAGR and Growth Drivers
- 12.3.7 Subsegment Market Size and Forecast
- 12.3.7.1 Consumable
- 12.3.7.2 Robotic Systems
- 12.3.7.3 Accessories
- 12.3.8 Subsegment Pricing and Adoption Trends
- 12.3.9 Leading Suppliers and Competition
- 12.3.10 Regional Demand and Opportunities
- 12.4 By Application - Market Size and Forecast, 2025-2035
- 12.4.1 Segment Definition and Scope
- 12.4.2 Historical Market Size, 2018-2025
- 12.4.3 Revenue Forecast, 2025-2035
- 12.4.4 Volume Forecast, 2025-2035
- 12.4.5 Base-Year Market Share, 2025
- 12.4.6 Segment CAGR and Growth Drivers
- 12.4.7 Subsegment Market Size and Forecast
- 12.4.7.1 General Surgery
- 12.4.7.2 Urology Surgery
- 12.4.7.3 Orthopedic Surgery
- 12.4.7.4 Others
- 12.4.8 Subsegment Pricing and Adoption Trends
- 12.4.9 Leading Suppliers and Competition
- 12.4.10 Regional Demand and Opportunities
- 12.5 By End User - Market Size and Forecast, 2025-2035
- 12.5.1 Segment Definition and Scope
- 12.5.2 Historical Market Size, 2018-2025
- 12.5.3 Revenue Forecast, 2025-2035
- 12.5.4 Volume Forecast, 2025-2035
- 12.5.5 Base-Year Market Share, 2025
- 12.5.6 Segment CAGR and Growth Drivers
- 12.5.7 Subsegment Market Size and Forecast
- 12.5.7.1 Hospitals
- 12.5.7.2 Ambulatory Surgical Centers
- 12.5.7.3 Specialty Clinics
- 12.5.7.4 Others
- 12.5.8 Subsegment Pricing and Adoption Trends
- 12.5.9 Leading Suppliers and Competition
- 12.5.10 Regional Demand and Opportunities
- 12.6 Segment Growth Comparison
- 12.7 Segment Attractiveness and Priority Matrix
Chapter 13 Global Robotic Surgery Systems End-Use and Application Market Outlook
- 13.1 End-Use Industry and Customer Demand Structure
- 13.2 Leading Applications and Customer Groups
- 13.3 End-Use Market Size, Share and Forecast
- 13.4 Major End-Use Industry Deep Dives
- 13.4.1 Customer Requirements and Use Cases
- 13.4.2 Demand and Replacement Cycles
- 13.4.3 Technical and Regulatory Considerations
- 13.4.4 Purchasing and Procurement Models
- 13.4.5 Leading Vendors and Distribution Channels
- 13.4.6 Forecast and Commercial Opportunities
- 13.5 Emerging Applications and Cross-Segment Demand
- 13.6 End-Use Industry Investment Priorities
Chapter 14 Global Robotic Surgery Systems Geographic Market Outlook, 2025-2035
- 14.1 Regional Market Size and Share, 2025
- 14.2 Regional Market Forecast, 2025-2035
- 14.3 Regional Pricing, Production and Demand Differences
- 14.4 North America
- 14.4.1 United States
- 14.4.2 Canada
- 14.4.3 Mexico
- 14.5 Europe
- 14.5.1 Germany
- 14.5.2 France
- 14.5.3 Italy
- 14.5.4 United Kingdom
- 14.5.5 Spain
- 14.5.6 Poland
- 14.5.7 Russia
- 14.5.8 Netherlands
- 14.5.9 Belgium
- 14.5.10 Sweden
- 14.5.11 Denmark
- 14.5.12 Norway
- 14.5.13 Rest of Europe
- 14.6 Asia Pacific
- 14.6.1 China
- 14.6.2 India
- 14.6.3 Japan
- 14.6.4 South Korea
- 14.6.5 Thailand
- 14.6.6 Indonesia
- 14.6.7 Vietnam
- 14.6.8 Malaysia
- 14.6.9 Australia
- 14.6.10 Rest of Asia Pacific
- 14.7 Latin America
- 14.7.1 Brazil
- 14.7.2 Argentina
- 14.7.3 Colombia
- 14.7.4 Chile
- 14.7.5 Rest of Latin America
- 14.8 Middle East
- 14.8.1 Saudi Arabia
- 14.8.2 United Arab Emirates
- 14.8.3 Turkey
- 14.8.4 Israel
- 14.8.5 Iran
- 14.8.6 Rest of the Middle East
- 14.9 Africa
- 14.9.1 South Africa
- 14.9.2 Egypt
- 14.9.3 Nigeria
- 14.9.4 Morocco
- 14.9.5 Rest of Africa
- 14.10 Regional Investment, Policy and Supply Chain Differences
- 14.11 Regional Competitive Landscape
- 14.12 Geographic Growth Hotspots
Chapter 15 Global Robotic Surgery Systems Technology, Innovation and Sustainability Outlook
- 15.1 Technology Landscape and Maturity
- 15.2 Product, Process and Service Innovation
- 15.3 AI, Automation and Digital Tools in the Industry
- 15.4 Technology Adoption and Performance Benchmarking
- 15.5 Innovation Pipeline and R&D Investment
- 15.6 Patent and Intellectual Property Trends
- 15.7 Energy Efficiency and Resource Management
- 15.8 Sustainability, Recycling and Circularity
- 15.9 Technology Roadmap, 2025-2035
- 15.10 Risks of Obsolescence and Technology Substitution
Chapter 16 Global Robotic Surgery Systems Market Key Strategic Imperatives
- 16.1 Growth and Market Entry Priorities
- 16.2 High-Return Products and Segments
- 16.3 Pricing, Profitability and Cost Optimization
- 16.4 Technology Investment and Product Differentiation
- 16.5 Supply Chain Localization and Resilience
- 16.6 Distribution and Customer Acquisition
- 16.7 Partnership, Acquisition and Capacity Strategy
- 16.8 Regional Expansion Priorities
- 16.9 Short-, Medium- and Long-Term Actions
Chapter 17 Competition Outlook
- 17.1 Industry Competition Characteristics
- 17.2 Market Structure and Concentration
- 17.3 Market Share and Competitive Positioning, 2025
- 17.4 Company-Wise Revenue and Product Benchmarking
- 17.5 Production and Service Capacity Benchmarking
- 17.6 Technology, Pricing and Differentiation
- 17.7 Regional Footprint and Distribution Strength
- 17.8 Mergers, Acquisitions and Strategic Alliances
- 17.9 New Entrants and Competitive Threats
- 17.10 Porter's Five Forces and Industry Attractiveness
- 17.11 Competitive Outlook, 2025-2035
Chapter 18 Company Profiles
- 18.1 Company Coverage and Selection Criteria
- 18.2 Intuitive Surgical
- 18.2.1 Business Description
- 18.2.2 Company Ownership and Geographic Presence
- 18.2.3 Product and Service Portfolio
- 18.2.4 Manufacturing and Operating Footprint
- 18.2.5 Production Capacity and Expansion Plans
- 18.2.6 Financial Performance and Investment
- 18.2.7 Market Share and Competitive Position
- 18.2.8 Technology and Innovation Capabilities
- 18.2.9 Strategic Alliances or Partnerships
- 18.2.10 Recent Developments
- 18.2.11 Growth Strategy and Outlook
- 18.3 Medrobots Corporation
- 18.4 Medtronic
- 18.5 Renishaw plc
- 18.6 Smith and Nephew
- 18.7 Stryker Corporation
- 18.8 THINK Surgical, Inc.
- 18.9 Transenterix
- 18.10 Zimmer Biomet
- 18.11 MOON Surgical
- 18.12 Other Relevant Market Participants
Note: Every listed company is profiled on the structure shown under the first company. The company list is preliminary and may change based on research findings, market developments, data availability and client requirements.
Chapter 19 Disclaimer
- 19.1 Research and Forecast Disclaimer
- 19.2 Data Source and Estimation Limitations
Note: The depth of individual sections depends on data availability for this market. Volume, capacity, trade and other unit-based metrics are included where applicable.

