
| REPORT ATTRIBUTE | DETAILS |
|---|---|
| Historical Period | 2020-2023 |
| Base Year | 2024 |
| Forecast Period | 2025-2032 |
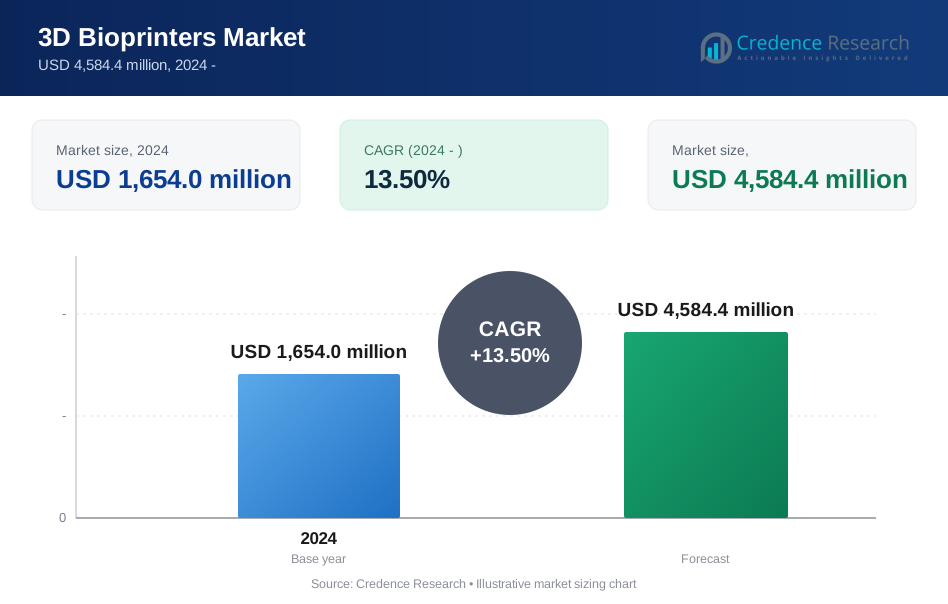
| 3D Bioprinters Market Size 2024 | USD 1,654.0 million |
| 3D Bioprinters Market, CAGR | 13.50% |
| 3D Bioprinters Market Size 2032 | USD 4,584.4 million |
Market Overview
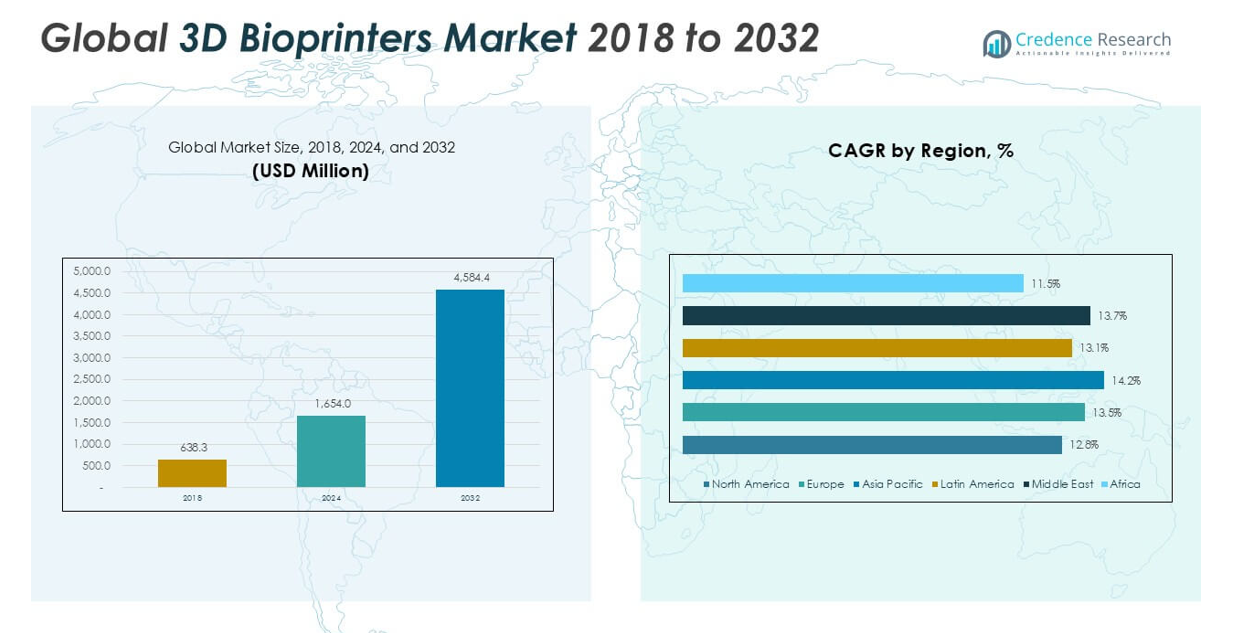
The 3D Bioprinters market size was valued at USD 638.3 million in 2018 and reached USD 1,654.0 million in 2024. It is anticipated to reach USD 4,584.4 million by 2032, reflecting a compound annual growth rate (CAGR) of 13.50% during the forecast period.
The 3D Bioprinters market is dominated by key players such as BICO Group AB, 3D Systems Inc., Merck KGaA, Stratasys Ltd., Collplant Biotechnologies Ltd., and Organovo Holdings, Inc., each recognized for their advanced bioprinting solutions and robust product portfolios. These companies leverage continuous innovation and strategic collaborations to maintain a competitive edge and drive market growth across biomedical and pharmaceutical applications. Asia Pacific leads the market with a commanding 33.0% share, propelled by rapid technological adoption, significant healthcare investments, and expanding research infrastructure. North America and Europe also contribute substantial shares, benefitting from strong research ecosystems and supportive regulatory frameworks.
Market Insights
- The 3D Bioprinters market reached USD 1,654.0 million in 2024 and is projected to grow to USD 4,584.4 million by 2032, registering a CAGR of 13.50%.
- Growth is fueled by advances in bioprinting hardware, rising demand for personalized medicine, and increasing adoption in tissue engineering and regenerative medicine.
- Microextrusion bioprinting leads the technology segment with over 40% market share, driven by its compatibility with a wide range of bioinks and ability to produce complex tissue structures.
- Key players such as BICO Group AB, 3D Systems Inc., Merck KGaA, and Stratasys Ltd. compete through continuous innovation and strategic collaborations, while high costs and regulatory challenges restrain broader market adoption.
- Asia Pacific holds the largest regional share at 33.0%, followed by North America and Europe, supported by strong research infrastructure and rising investments in healthcare innovation.
Market Segmentation Analysis:
By Product:
The hardware segment holds the dominant share in the 3D Bioprinters market, accounting for over 60% of total revenue. High demand for advanced bioprinting machines, increased adoption in research and clinical labs, and rapid technological upgrades drive this leadership. Hardware innovation supports greater precision and scalability in tissue engineering and regenerative medicine. The components segment, though growing, remains secondary due to the critical role hardware systems play in enabling complex bioprinting processes and their essentiality for end-to-end workflow integration.
- For instance, BICO Group AB’s BIO X6 bioprinter allows simultaneous use of 6 different printheads and supports printing up to 6 bioinks in one run, streamlining multi-material tissue fabrication in laboratory environments.
By Technology:
Micro extrusion bioprinting stands out as the leading technology, capturing more than 40% market share. Its dominance results from its suitability for fabricating large and complex tissue structures, as well as its compatibility with a wide range of bioinks. High accuracy, cost efficiency, and adaptability to diverse biomedical applications reinforce its position. Other technologies like inkjet and laser-assisted bioprinting contribute significantly, but micro extrusion’s versatility and proven performance in clinical research and commercial tissue engineering drive its sustained adoption.
- For instance, CELLINK’s BIO X system achieves print resolution as fine as 100 micrometers and supports printing structures up to 50 millimeters in height, allowing creation of physiologically relevant 3D tissues.
By Application:
Tissue engineering represents the dominant application segment in the 3D Bioprinters market, holding approximately 35% market share. Growth in regenerative medicine research, rising need for organ and tissue fabrication, and investments in personalized healthcare solutions fuel this segment’s expansion. The ability of bioprinters to create scaffolds and tissues for transplantation and disease modeling underpins their use in tissue engineering. Other applications such as drug discovery, cosmetic testing, and cancer research gain traction, yet tissue engineering leads due to its transformative impact on modern medicine.
Market Overview
Advances in Bioprinting Technology
Rapid innovation in bioprinting hardware and bioink formulations drives the market forward. Enhanced precision, multi-material printing capabilities, and faster production speeds enable researchers and clinicians to create complex tissue constructs. These technological breakthroughs expand application possibilities, especially in regenerative medicine and personalized healthcare, fostering market expansion as stakeholders invest in R&D to address previously unmet medical needs.
- For instance, 3D Systems’ Print to Perfusion platform produced a full-scale human lung scaffold with a surface area of 70 square meters and seeded with over 4.2 billion human cells for organ research.
Growing Demand for Personalized Medicine
The shift towards personalized medicine has accelerated the adoption of 3D bioprinters, as these devices facilitate patient-specific tissue models and implants. Healthcare providers leverage bioprinting to create customized grafts, organoids, and therapeutic solutions tailored to individual patient profiles. This trend supports more effective treatments, improved patient outcomes, and fuels market growth, especially in organ transplantation, wound healing, and reconstructive surgery.
- For instance, Organovo Holdings, Inc. successfully bioprinted human liver tissue constructs with dimensions of 4 mm × 4 mm × 0.5 mm, which are now used for drug toxicity testing in preclinical studies.
Expansion of Pharmaceutical and Cosmetic Testing
The pharmaceutical and cosmetic industries increasingly use 3D bioprinted tissues to test drugs and products in vitro, reducing reliance on animal testing. Bioprinted models provide more accurate representations of human biology, leading to better safety and efficacy predictions. Regulatory encouragement for alternatives to animal testing and growing industry awareness further accelerate market adoption, supporting both ethical standards and R&D efficiency.
Key Trends & Opportunities
Emergence of 4D Bioprinting and Smart Materials
4D bioprinting, which incorporates time-dependent shape and functionality changes, represents a significant advancement in the field. The integration of smart, stimuli-responsive materials opens new avenues for creating dynamic tissue constructs and adaptive implants. This trend promises to revolutionize tissue engineering, offering opportunities for the development of advanced therapeutic solutions that respond to physiological conditions in real time.
- For instance, a team at Aspect Biosystems developed 4D printed airway tissues that exhibit controlled shape change with a 2.5-fold expansion in diameter when exposed to specific humidity, providing programmable functionality for engineered tissues.
Collaborations and Partnerships Across Sectors
Strategic collaborations between biotech firms, academic institutions, and healthcare providers are on the rise. These partnerships facilitate knowledge sharing, funding, and accelerated commercialization of bioprinting technologies. Joint ventures drive innovation, standardization, and expand the reach of 3D bioprinting into new research and clinical settings, thus creating significant opportunities for market players to broaden their portfolios and global presence.
- For instance, Merck KGaA and Advanced Solutions Life Sciences jointly developed tissue constructs with thicknesses of up to 5 millimeters and produced more than 1,200 tissue models during their first collaborative research phase.
Key Challenges
High Cost and Limited Accessibility
The high cost of advanced 3D bioprinting hardware, consumables, and maintenance limits adoption, particularly among small and mid-sized institutions. Limited accessibility and lack of reimbursement policies in many regions further constrain widespread usage. These financial barriers slow down market penetration and restrict the benefits of bioprinting technologies to a smaller group of well-funded organizations.
Regulatory and Standardization Hurdles
The evolving regulatory landscape for bioprinted tissues and organs presents a significant challenge. Unclear guidelines and the absence of standardized protocols complicate product approval and commercialization. Navigating regulatory requirements delays innovation cycles and market entry, especially for clinical applications, and creates uncertainty for developers and investors.
Complexity in Replicating Functional Tissues
Replicating the complexity of human tissues with vascularization, innervation, and precise cellular architecture remains a significant scientific and technical challenge. Achieving functional integration post-implantation and long-term viability of bioprinted tissues is difficult. This limitation restricts clinical applications and requires ongoing investment in basic and applied research to overcome current technological barriers.
Regional Analysis
North America
North America accounted for approximately 22.8% of the 3D Bioprinters market in 2018, with a market size of USD 145.40 million. The region’s market expanded to USD 362.75 million in 2024 and is projected to reach USD 953.56 million by 2032, reflecting a CAGR of 12.8%. Strong research infrastructure, high healthcare spending, and rapid adoption of innovative technologies drive regional growth. The U.S. leads in academic and clinical bioprinting applications, supported by well-established biotech firms and government funding, positioning North America as a key innovator in the global market.
Europe
Europe captured about 28.1% of the global 3D Bioprinters market in 2018, valued at USD 179.35 million. By 2024, the regional market reached USD 465.56 million and is set to grow to USD 1,293.26 million by 2032, registering a CAGR of 13.5%. The region benefits from strong government initiatives supporting bioprinting research and a robust pharmaceutical industry. Countries such as Germany, the UK, and France serve as hubs for medical innovation, while the adoption of advanced bioprinting for drug testing and regenerative medicine supports market leadership across Europe.
Asia Pacific
Asia Pacific held the largest share at 33.0% in 2018, with the market size standing at USD 210.75 million. The region advanced to USD 566.36 million in 2024 and is expected to reach USD 1,644.43 million by 2032, achieving the highest CAGR of 14.2%. Growth is fueled by expanding investments in biotechnology, rising demand for personalized healthcare, and supportive government policies in countries like China, Japan, and South Korea. The region’s growing healthcare infrastructure and increasing research activities strengthen its dominance in the global 3D Bioprinters market.
Latin America
Latin America comprised 5.0% of the global 3D Bioprinters market in 2018, valued at USD 31.91 million. The market rose to USD 81.00 million in 2024 and is forecast to reach USD 218.22 million by 2032, with a CAGR of 13.1%. Brazil and Mexico lead regional adoption, supported by increasing investments in medical technology and academic collaborations. Ongoing efforts to enhance local research capacities and diversify healthcare solutions are expected to drive further market growth in Latin America over the forecast period.
Middle East
The Middle East represented 6.8% of the global 3D Bioprinters market in 2018, at a value of USD 43.40 million. Market size grew to USD 113.68 million in 2024 and will likely reach USD 319.53 million by 2032, reflecting a CAGR of 13.7%. Expanding healthcare infrastructure, strategic government investments in advanced medical technologies, and rising awareness of bioprinting applications underpin regional growth. The UAE and Saudi Arabia are notable markets driving adoption, with increased focus on innovation and healthcare modernization.
Africa
Africa accounted for 4.3% of the 3D Bioprinters market in 2018, valued at USD 27.45 million. The market expanded to USD 64.67 million in 2024 and is projected to reach USD 155.41 million by 2032, with a CAGR of 11.5%. Limited infrastructure and slower technology adoption have resulted in modest market share. However, gradual improvements in healthcare investment, growing collaborations with international research organizations, and increasing interest in personalized medicine are poised to contribute to steady growth across the African market.
Market Segmentations:
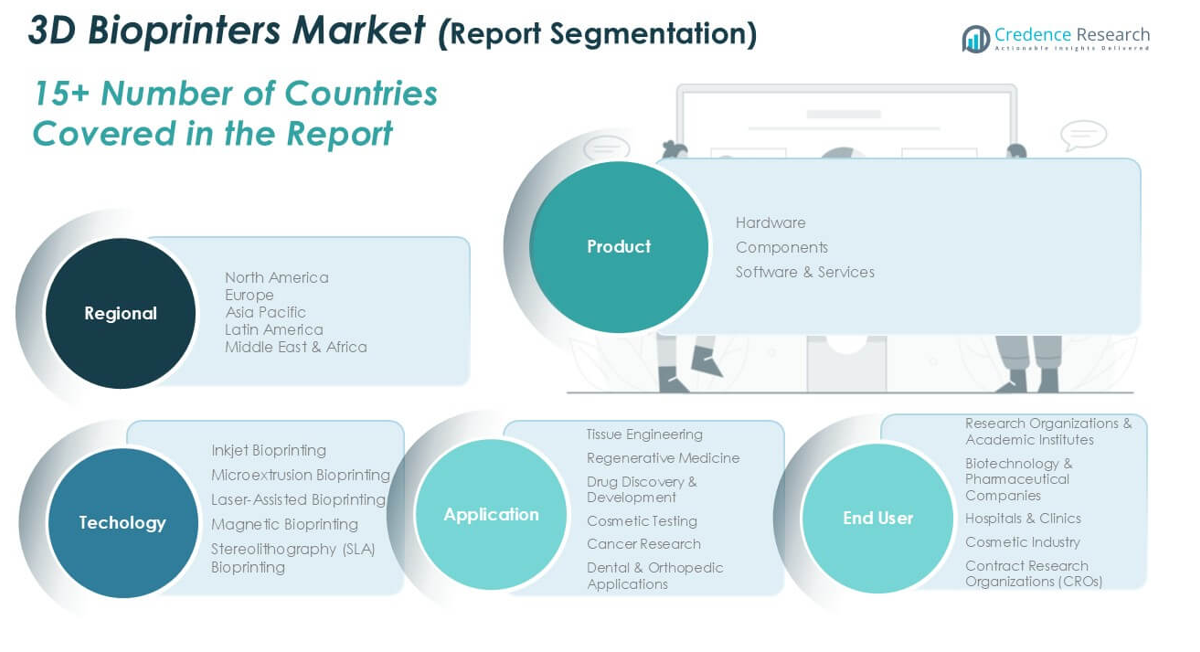
By Product
- Hardware
- Components
By Technology
- Inkjet Bioprinting
- Microextrusion Bioprinting
- Laser-Assisted Bioprinting
- Magnetic Bioprinting
- Stereolithography (SLA) Bioprinting
By Application
- Tissue Engineering
- Regenerative Medicine
- Drug Discovery & Development
- Cosmetic Testing
- Cancer Research
- Dental & Orthopedic Applications
By End User
- Research Organizations & Academic Institutes
- Biotechnology & Pharmaceutical Companies
- Hospitals & Clinics
- Cosmetic Industry
- Contract Research Organizations (CROs)
By Geography
- North America
- U.S.
- Canada
- Mexico
- Europe
- Germany
- France
- U.K.
- Italy
- Spain
- Rest of Europe
- Asia Pacific
- China
- Japan
- India
- South Korea
- South-east Asia
- Rest of Asia Pacific
- Latin America
- Brazil
- Argentina
- Rest of Latin America
- Middle East & Africa
- GCC Countries
- South Africa
- Rest of the Middle East and Africa
Competitive Landscape
The competitive landscape of the 3D Bioprinters market features a dynamic mix of established technology firms, specialized biotech companies, and innovative startups, each vying to strengthen their position through technological advancements and strategic partnerships. Leading players such as BICO Group AB, 3D Systems Inc., Merck KGaA, and Stratasys Ltd. offer comprehensive portfolios that span bioprinting hardware, bioinks, and supporting software solutions. Companies like Collplant Biotechnologies Ltd., Advanced Solution Life Sciences, and Organovo Holdings, Inc. focus on expanding application areas in tissue engineering and regenerative medicine through R&D initiatives and collaboration with academic and clinical institutions. The competitive environment is shaped by continuous innovation, product launches, mergers, and joint ventures, as organizations seek to differentiate their offerings and address evolving customer needs in biomedical research and healthcare.
Key Player Analysis
- BICO Group AB
- 3D Systems Inc.
- Merck KGaA
- Collplant Biotechnologies Ltd.
- Advanced Solution Life Sciences, LLC
- TeVido BioDevices, LLC
- Rokit, Inc.
- Aspect Biosystems Ltd.
- Cyfuse Biomedical K.K.
- Organovo Holdings, Inc.
- Stratasys Ltd.
- Snup Biotech
- Prodways
- Medprin
- Tissuelabs
Recent Developments
- In 2025, Cyfuse initiated a pilot program utilizing their advanced 3D bioprinting technology to create nerve repair grafts, utilizing a scaffold-free approach where cellular spheroids are precisely assembled into complex 3D structures, significantly advancing regenerative medicine applications, especially in the fields of orthopedics and neurology.
- In May 2025, Merck KGaA announced a strategic partnership with imec to develop a disruptive microphysiological systems (MPS) platform. This collaboration aims to make drug discovery and development more efficient by creating next-generation preclinical models with higher predictive validity, progressively reducing reliance on animal testing. This directly relates to the application of 3D bioprinting in creating advanced tissue models.
- In May 2025, CollPlant Biotechnologies reported receiving a $2 million milestone payment from AbbVie in February 2025. This payment was related to their ongoing collaboration on dermal and soft tissue filler products, specifically those utilizing CollPlant's recombinant human collagen (rhCollagen) technology. The dermal filler product is currently in clinical trials, which were initiated in 2023.
Market Concentration & Characteristics
The 3D BIOPRINTERS Market demonstrates a moderate to high level of market concentration, with a core group of established players such as BICO Group AB, 3D Systems Inc., Merck KGaA, Stratasys Ltd., and Organovo Holdings, Inc. shaping competitive dynamics. It is characterized by rapid technological advancements, a strong emphasis on research and development, and continuous product innovation focused on expanding bioprinting capabilities. The market attracts significant investments from both public and private sectors, supporting growth in biomedical, pharmaceutical, and academic applications. Companies seek to differentiate themselves through advancements in hardware, proprietary bioink formulations, and specialized software, often leveraging collaborations and strategic partnerships to expand their global reach. The market’s growth potential is supported by rising demand for personalized healthcare solutions, a shift toward alternative testing methods in drug discovery and cosmetics, and increasing adoption of regenerative medicine. Entry barriers exist due to high capital requirements, stringent regulatory environments, and the technical complexity of bioprinting technologies.
Report Coverage
The research report offers an in-depth analysis based on Product, Technology, Application, End User and Geography. It details leading market players, providing an overview of their business, product offerings, investments, revenue streams, and key applications. Additionally, the report includes insights into the competitive environment, SWOT analysis, current market trends, as well as the primary drivers and constraints. Furthermore, it discusses various factors that have driven market expansion in recent years. The report also explores market dynamics, regulatory scenarios, and technological advancements that are shaping the industry. It assesses the impact of external factors and global economic changes on market growth. Lastly, it provides strategic recommendations for new entrants and established companies to navigate the complexities of the market.
Future Outlook
- The demand for 3D bioprinters is expected to rise due to growing applications in tissue engineering and regenerative medicine.
- Increasing investments in research and development are driving innovation and technological advancements in bioprinting systems.
- Rising prevalence of chronic diseases and the shortage of organ donors are encouraging the adoption of bioprinted tissues and organs.
- The pharmaceutical industry is increasingly using 3D bioprinters for drug discovery and personalized medicine testing.
- Expansion of collaborations between academic institutions, biotechnology firms, and healthcare companies is accelerating market growth.
- Advancements in bio-inks and printing materials are enhancing the precision and functionality of printed biological structures.
- Regulatory developments supporting the clinical use of bioprinted tissues are creating new growth opportunities.
- Growing interest in cosmetic and dental applications is expanding the commercial scope of bioprinting technologies.
- Increased government funding for bioengineering research is expected to fuel market expansion across developed economies.
- Adoption of artificial intelligence and automation is streamlining bioprinting processes, improving efficiency and scalability.
Request a Free Sample
Fill in your details and we'll send you a free sample report.
- Sample data tables & charts
- Research methodology
Need a Custom Version of This Report?
Tailor the scope, geography, or segments to your exact requirements.
- Custom geography or segment scope
- Direct access to our analyst team
Frequently Asked Questions
What is the current size of the 3D Bioprinters Market?
What factors are driving the growth of the 3D Bioprinters Market?
What are some challenges faced by the 3D Bioprinters Market?
Who are the major players in the 3D Bioprinters Market?
Who are the major players in this market?
Table of Content
Chapter 1. Report Introduction
- 1.1 Report Description & Purpose
- 1.1.1 Report Title & Market Definition
- 1.1.2 Unique Selling Propositions (USP) & Key Differentiators
- 1.1.3 Value Proposition for Stakeholders
- 1.2 Research Objectives
- 1.2.1 Market Sizing Objectives (Volume & Revenue)
- 1.2.2 Segmentation Objectives
- 1.2.3 Competitive Intelligence Objectives
- 1.2.4 Forecast & Scenario Objectives
- 1.3 Report Scope
- 1.3.1 3D Bioprinters Scope – Types & Subtypes Covered
- 1.3.2 Geographic Scope – Regions & Countries Covered
- 1.3.3 Historical Period, Base Year & Forecast Period (2024; forecast to the forecast period)
- 1.3.4 Inclusions & Exclusions
- 1.4 HS Code & Classification Framework
- 1.5 Currency, Units & Pricing Basis
- 1.6 Target Stakeholders
- 1.7 Limitations & Assumptions
Chapter 2. Executive Summary
- 2.1 Global 3D Bioprinters Market Snapshot
- 2.1.1 Market Size – Historical (2024) & Forecast (the forecast period) (2024: USD 1,654.0 million → forecast year: USD 4,584.4 million)
- 2.1.2 Volume & Revenue – Global Totals
- 2.1.3 Key Market Highlights – Top Five Facts
- 2.2 3D Bioprinters Market Segmentation Snapshot
- 2.2.1 Market Split by Region – 2024 vs.
- 2.3 Competitive Snapshot
- 2.3.1 Top 10 Players by Revenue Share – 2024
- 2.3.2 Top 10 Players by Volume Share – 2024
- 2.3.3 Recent Strategic Developments (18-Month Summary)
- 2.4 Key Investment Highlights & Strategic Conclusions
Chapter 3. 3D Bioprinters Market Dynamics & Industry Analysis
- 3.1 Market Overview & Context
- 3.1.1 3D Bioprinters Market Position in the Broader Automotive Value Chain
- 3.1.2 OEM vs. Replacement Market Dynamics
- 3.1.3 Market Maturity & Development Stage by Region
- 3.2 3D Bioprinters Market Drivers
- 3.3 3D Bioprinters Market Restraints & Challenges
- 3.4 3D Bioprinters Market Opportunities
- 3.5 Porter's Five Forces Analysis
- 3.5.1 Threat of New Entrants
- 3.5.2 Bargaining Power of Suppliers
- 3.5.3 Bargaining Power of Buyers
- 3.5.4 Threat of Substitutes
- 3.5.5 Competitive Rivalry – Intensity Assessment
- 3.6 3D Bioprinters Value Chain Analysis
- 3.6.1 Upstream – Raw Material/Input Suppliers
- 3.6.1.1 Raw Material/Input 1
- 3.6.1.2 Raw Material/Input 2
- 3.6.1.3 Raw Material/Input 3
- 3.6.2 Midstream – Production/Manufacturing/Service Delivery
- 3.6.2.1 Production/Process Overview
- 3.6.2.2 Key Facility Locations & Capacity by Manufacturer
- 3.6.3 Downstream – Distribution & End Consumer
- 3.6.3.1 Primary Channel – B2B/OEM
- 3.6.3.2 Secondary Channels – Dealer, Retail, Online, Direct
- 3.6.4 Value Chain Profitability Analysis
- 3.6.1 Upstream – Raw Material/Input Suppliers
- 3.7 PESTEL Analysis
- 3.7.1 Political Factors
- 3.7.2 Economic Factors
- 3.7.3 Social Factors
- 3.7.4 Technological Factors
- 3.7.5 Environmental Factors
- 3.7.6 Legal Factors
- 3.8 3D Bioprinters Supply Chain Analysis
- 3.8.1 Raw Material/Input Supply Risk Assessment
- 3.8.2 Manufacturing Concentration Risk (Geographic Exposure)
- 3.8.3 Trade Disruption Impact Analysis
- 3.9 Regulatory & Policy Landscape
Note: The regulatory and policy landscape section covers regulations based on their applicability to the market, 3D Bioprinters category, geography, and scope of the study. Only regulatory frameworks with a material impact on operations, compliance, trade, sustainability, or market access are analyzed in detail.
Chapter 4. Key Investment Pockets & Opportunity Analysis
- 4.1 3D Bioprinters Market Attractiveness Analysis
- 4.1.1 By Region – Investment Attractiveness Matrix (Volume × CAGR)
- 4.2 Absolute Revenue Growth Opportunity
- 4.2.1 By Region – Absolute USD Growth Through the forecast period
- 4.3 Incremental Volume Opportunity
- 4.3.1 By Region – Incremental Volume Through the forecast period
- 4.3.2 Segment – Incremental Volume
- 4.4 Emerging Submarket Opportunity Deep Dive (Subject to Applicability)
- 4.5 Emerging Market Opportunity Scorecards
- 4.5.1 United States
- 4.5.2 Europe
- 4.5.3 Asia
- 4.5.4 Middle East & Africa
Note: Emerging Market Opportunity Scorecards will be included based on relevance and strategic importance. Regions listed are indicative and may vary depending on data availability and market dynamics.
Chapter 5. 3D Bioprinters Import-Export Analysis & Trade Flows
- 5.1 Global Trade Overview
- 5.1.1 Global Export Value by Country (2024)
- 5.1.2 Global Export Volume by Country (2024)
- 5.1.3 Global Import Value by Country (2024)
- 5.1.4 Global Import Volume by Country (2024)
- 5.1.5 Net Trade Balance by Country (2024)
- 5.2 Export Analysis – Segment
- 5.2.1 Type 1 (HS Code)
- 5.2.2 Type 2 (HS Code)
- 5.2.3 Type 3 (HS Code)
- 5.2.4 Type 4 (HS Code)
- 5.2.5 Type 5 (HS Code)
- 5.3 Import Analysis – Segment
- 5.3.1 Type 1 (HS Code)
- 5.3.2 Type 2 (HS Code)
- 5.3.3 Type 3 (HS Code)
- 5.3.4 Type 4 (HS Code)
- 5.3.5 Type 5 (HS Code)
- 5.4 Average Unit Trade Prices
- 5.4.1 Average Export Price – Segment & Country
- 5.4.2 Average Import Price – Segment & Source Country
- 5.4.3 Price Trends (2024)
- 5.5 Key Trade Route Analysis
- 5.5.1 Trade Route 1
- 5.5.2 Trade Route 2
- 5.5.3 Trade Route 3
- 5.5.4 Trade Route 4
- 5.5.5 Trade Route 5
- 5.6 Trade Policy Impact Assessment
- 5.6.1 US Anti-Dumping & Section 301 Tariffs
- 5.6.2 EU Customs Union Impact
- 5.6.3 Major Free Trade Agreements
- 5.6.4 USMCA Rules of Origin
Note: Trade policy analysis will be included only where relevant to the 3D Bioprinters market.
Chapter 6. Competitive Landscape & Company Benchmarking
- 6.1 3D Bioprinters Market Concentration & Structure
- 6.1.1 Herfindahl-Hirschman Index (HHI) – vs. 2024
- 6.1.2 Tier 1, Tier 2 & Tier 3 Market Structure
- 6.1.3 Global, Regional & Local Player Dynamics
- 6.2 3D Bioprinters Market Share Analysis – 2024
- 6.2.1 Global Revenue Share by Company
- 6.2.2 Global Volume Share by Company
- 6.2.3 Regional Revenue Share
- 6.2.4 Market Share Evolution ( vs. 2024)
- 6.2.5 OEM Segment Share by Company
- 6.2.6 Replacement Segment Share by Company
- 6.3 Production/Delivery Capacity & Facility Analysis
- 6.3.1 Global Installed Capacity
- 6.3.2 Capacity Utilization Rates
- 6.3.3 Production/Output Volume
- 6.3.4 Facility Locations & Capacity Map
- 6.3.5 Planned Capacity Additions
- 6.4 3D Bioprinters Competitive Benchmarking Matrix
- 6.4.1 Revenue, Volume, CAGR & Profitability Comparison
- 6.4.2 Channel Revenue Mix
- 6.4.3 Geographic Revenue Exposure
- 6.4.4 R&D Intensity
- 6.4.5 Sustainability Maturity
- 6.5 Strategic Developments in 3D Bioprinters (Last 24 Months)
- 6.5.1 Mergers, Acquisitions & Divestments
- 6.5.2 New 3D Bioprinters Launches
- 6.5.3 Facility Expansions
- 6.5.4 Strategic Alliances, Joint Ventures & Partnerships
- 6.5.5 Distribution Expansion & Market Entry
- 6.5.6 Sustainability & ESG Initiatives
- 6.6 Competitive Strategy Mapping
- 6.6.1 Leader, Challenger, Follower & Niche Classification
- 6.6.2 Pricing Strategy Comparison
- 6.6.3 Channel Strategy Matrix
Note: Strategic developments are included based on their materiality and the availability of reliable information.
Chapter 7. Global 3D Bioprinters Market – By Distribution Channel
- 7.1 Segment Overview
- 7.1.1 Volume & Revenue Split by Channel (2024 & )
- 7.1.2 Channel Mix Evolution (the forecast period)
Chapter 8. Regional Market Analysis – Global Overview
- 8.1 Global Regional Overview
- 8.1.1 Regional Volume Share
- 8.1.2 Regional Revenue Share
- 8.1.3 Regional Volume by Region
- 8.1.4 Regional Revenue by Region
- 8.1.5 Regional Forecast Through the forecast period
- 8.2 Cross-Regional Segment Analysis
- 8.2.1 By Distribution Channel
- 8.2.2 By Brand/Price Tier
Chapter 9. North America 3D Bioprinters Market
- 9.1 United States
- 9.2 Canada
- 9.3 Mexico
Chapter 10. Europe 3D Bioprinters Market
- 10.1 Germany
- 10.2 France
- 10.3 Italy
- 10.4 United Kingdom
- 10.5 Spain
- 10.6 Poland
- 10.7 Russia
- 10.8 Netherlands
- 10.9 Belgium
- 10.10 Sweden
- 10.11 Denmark
- 10.12 Norway
- 10.13 Rest of Europe
Chapter 11. Asia Pacific 3D Bioprinters Market
- 11.1 China
- 11.2 India
- 11.3 Japan
- 11.4 South Korea
- 11.5 Thailand
- 11.6 Indonesia
- 11.7 Vietnam
- 11.8 Malaysia
- 11.9 Australia
- 11.10 Rest of Asia Pacific
Chapter 12. Latin America 3D Bioprinters Market
- 12.1 Brazil
- 12.2 Argentina
- 12.3 Colombia
- 12.4 Chile
- 12.5 Rest of Latin America
Chapter 13. Middle East 3D Bioprinters Market
- 13.1 Saudi Arabia
- 13.2 United Arab Emirates
- 13.3 Turkey
- 13.4 Israel
- 13.5 Iran
- 13.6 Rest of the Middle East
Chapter 14. Africa 3D Bioprinters Market
- 14.1 South Africa
- 14.2 Egypt
- 14.3 Nigeria
- 14.4 Morocco
- 14.5 Rest of Africa
Chapter 15. 3D Bioprinters Company Profiles
- 15.1 [Company 01]
- 15.1.1 Company Overview
- 15.1.2 Key Management Personnel
- 15.1.3 Products & Services Portfolio
- 15.1.4 Financial Performance
- 15.1.5 Key Market Focus & Geographic Presence
- 15.1.6 Recent Developments & Strategic Initiatives
Note: The company profile list is preliminary and may change based on research findings, market developments, data availability, and client requirements.
Chapter 16. Appendices
- Appendix A – List of Abbreviations & Acronyms
- Appendix B – Industry Classification Code Reference – Full Series
- Appendix C – Production & Capacity Data Tables
- Appendix D – End-Use & Demand Base Tables
- Appendix E – Consumption & Replacement Rate Assumptions
- Appendix F – ASP Reference Tables
- Appendix G – Manufacturing & Facility Database
- Appendix H – Import-Export Data Tables
- Appendix I – Regulatory Summary Tables
- Appendix J – Primary Research Participant List (Anonymized)
- Appendix K – Primary Research Questionnaire Framework
- Appendix L – Data Sources & Bibliography
- Appendix M – Market Size Divergence & Source Comparison
Chapter 17. Research Methodology
- 17.1 Research Framework & Philosophy
- 17.2 Secondary Research – Sources, Hierarchy & Data Extraction
- 17.3 Data Modeling – Bottom-Up & Top-Down Market Sizing
- 17.4 Primary Research – Stakeholder Framework, LOI & Sample Sizes
- 17.5 Forecast Methodology – Regression, Scenario & Sensitivity Analysis
- 17.6 Quality Control – Four-Layer Validation Framework
- 17.7 Limitations & Standard Assumptions
- 17.8 Disclaimer
