
China New Energy Vehicle (NEV) Taxi Market Overview:
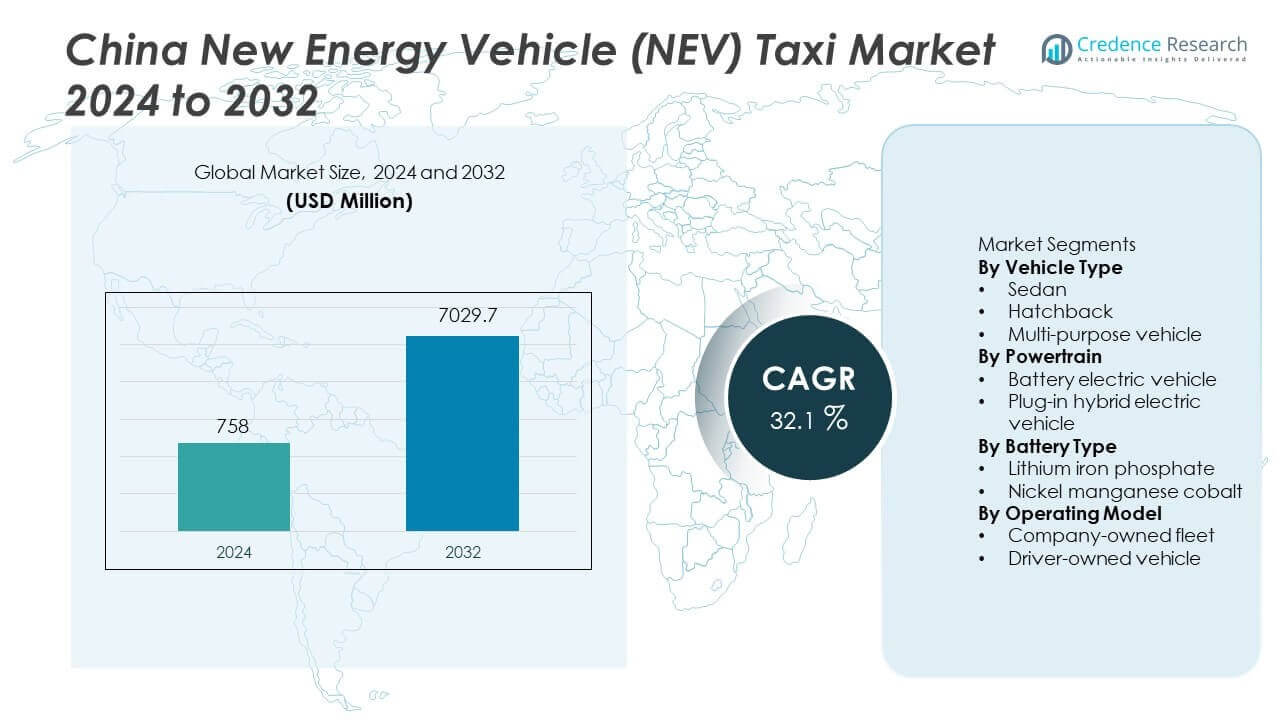
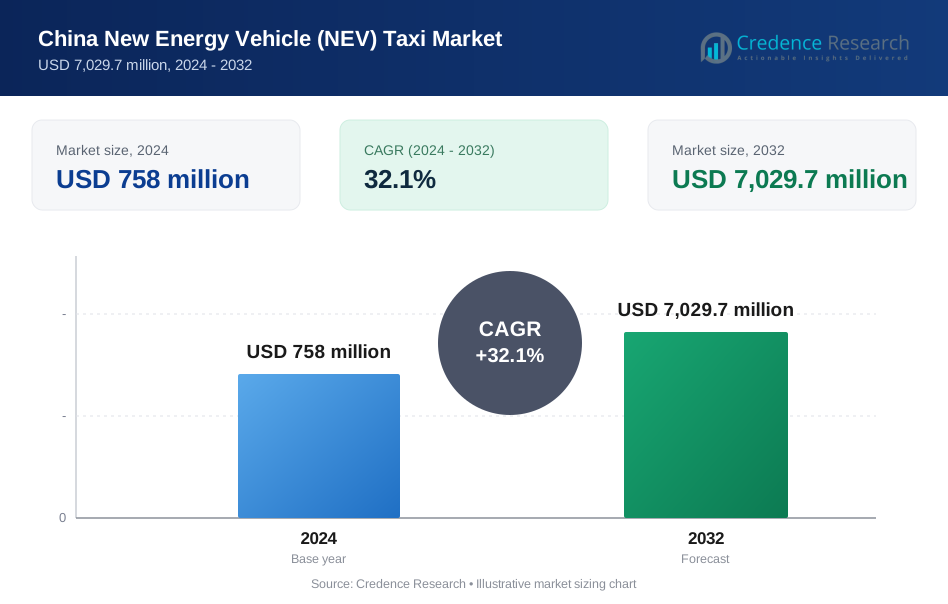
The China new energy vehicle (NEV) taxi market was valued at USD 758 million in 2024 and is anticipated to reach USD 7,029.7 million by 2032, growing at a CAGR of 32.1% during the forecast period.
| REPORT ATTRIBUTE | DETAILS |
|---|---|
| Historical Period | 2020-2023 |
| Base Year | 2024 |
| Forecast Period | 2025-2032 |
| China New Energy Vehicle (NEV) Taxi Market Size 2024 | USD 758 million |
| China New Energy Vehicle (NEV) Taxi Market, CAGR | 32.1% |
| China New Energy Vehicle (NEV) Taxi Market Size 2032 | USD 7,029.7 million |
China New Energy Vehicle (NEV) Taxi Market Insights
- Strong government electrification mandates and subsidy programs act as key drivers, with battery electric vehicles leading the powertrain segment with a 78% market share due to zero-emission benefits and low operating costs.
- Fleet electrification and platform-owned taxi models represent a major trend, while sedans dominate the vehicle type segment with a 62% market share, supported by cost efficiency and suitability for urban taxi operations.
- Competition remains intense as domestic OEMs focus on battery safety, fast-charging capability, and large-scale fleet supply, while high upfront investment and charging downtime act as key restraints for smaller operators.
- East China leads the market with a 34% share, followed by South China at 27% and North China at 16%, driven by dense urban demand, advanced charging infrastructure, and strict regional emission policies.
China New Energy Vehicle (NEV) Taxi Market Segmentation Analysis:
By Vehicle Type
The vehicle type segment is dominated by sedans, which hold a 62% market share in the China NEV taxi market. Taxi operators prefer sedans due to balanced range, passenger comfort, and lower acquisition costs. Sedans suit high-frequency urban operations and offer efficient energy consumption. Strong availability of locally manufactured electric sedans supports fleet expansion. Hatchbacks account for a smaller share, mainly in short-distance urban routes. Multi-purpose vehicles serve airport and premium taxi services but remain limited due to higher costs. However, large-scale procurement programs and urban taxi replacement policies continue to favor sedans as the dominant vehicle type.
- For instance, BYD supplies the Qin Plus EV taxi with a 57.6 kWh Blade Battery and a 510 km CLTC range.
By Powertrain
The powertrain segment is led by battery electric vehicles, capturing a 78% market share due to zero-emission operation and lower running costs. BEVs align closely with China’s clean transport targets and urban emission regulations. Fast-expanding charging infrastructure supports daily taxi operations. Fleet operators benefit from lower maintenance expenses and energy savings. Plug-in hybrid electric vehicles hold a smaller share, mainly in cities with longer operating ranges or limited charging access. However, strong government incentives, priority licensing, and operational cost advantages ensure BEVs remain the preferred powertrain for NEV taxi fleets.
- For instance, BYD’s Blade Battery used in taxi fleets exceeds many full charge cycles in commercial duty. A major national grid operator maintains a very large number of public charging points nationwide, enabling full taxi shifts with fast charging in a relatively short amount of time.
By Battery Type
The battery type segment is dominated by lithium iron phosphate batteries, accounting for a 66% market share due to high safety and long cycle life. Taxi fleets favor LFP batteries for durability under intensive usage. Lower thermal risk improves operational safety in dense urban environments. Cost efficiency also supports large-scale fleet deployment. Nickel manganese cobalt batteries offer higher energy density and longer range, appealing to premium services. However, higher costs and safety considerations limit adoption. Strong domestic supply chains and policy support for LFP technology continue to drive its dominance in the NEV taxi market.
Key Growth Drivers
Strong Government Policies and Electrification Mandates
Government policies strongly drive the China NEV taxi market. National and municipal authorities mandate taxi electrification to reduce urban emissions. Subsidies, tax exemptions, and license incentives support rapid fleet replacement. Many cities restrict new ICE taxi registrations, favoring NEVs. Local governments also support bulk procurement programs for taxi operators. Preferential access to charging infrastructure further accelerates adoption. These measures reduce upfront and operating costs for operators. Policy-backed timelines for full electrification sustain long-term demand. Regulatory certainty remains a key catalyst for market expansion.
- For instance, Shenzhen replaced more than 21,000 taxis with electric models under city mandates. Beijing issues NEV taxi licenses within 5 working days through priority approval channels.
Rapid Expansion of Charging Infrastructure
China continues to expand public and fleet-focused charging infrastructure. Urban areas deploy fast chargers tailored for taxi operations. Dedicated charging hubs reduce downtime and improve fleet utilization. State-owned utilities and private players invest heavily in charging networks. Improved charging availability supports high daily mileage requirements. Battery swapping pilots further enhance operational efficiency. Infrastructure growth reduces range anxiety among drivers. Reliable charging access enables large-scale BEV taxi deployment. This driver directly supports accelerated market penetration.
- For instance, various operators, run a large number of public charging points across China, a network that supports commercial fleets and other electric vehicles. Market leaders like Teld, Star Charge, and Cloud Quick Charge, along with others including State Grid, control the majority of the public charging infrastructure.
Rising Urban Mobility and Ride-Hailing Demand
Urbanization increases demand for taxi and ride-hailing services. NEV taxis meet growing mobility needs while aligning with emission goals. High passenger volumes support frequent vehicle utilization. Operators benefit from lower energy and maintenance costs. Ride-hailing platforms increasingly mandate electric vehicles for partners. Fleet electrification improves brand sustainability image. Growing intercity and airport taxi demand also supports expansion. Continuous urban population growth sustains long-term market demand.
Key Trends and Opportunities
Shift Toward Fleet-Based and Platform-Owned Models
Taxi operations increasingly shift toward fleet-based ownership. Ride-hailing platforms invest in company-owned NEV fleets. Centralized fleet management improves cost control and maintenance. Bulk vehicle procurement lowers acquisition costs. Data-driven operations enhance route and charging optimization. This trend creates opportunities for OEM-fleet partnerships. Manufacturers offer customized NEV taxi models. Long-term service contracts strengthen revenue visibility. Fleet consolidation supports faster electrification.
- For instance, Didi operates vast NEV fleets using sophisticated centralized dispatch systems that process immense quantities of route data daily to optimize mobility services across numerous cities.
Advancements in Battery Technology and Cost Reduction
Battery technology continues to improve rapidly in China. LFP batteries gain higher energy density and longer lifespan. Declining battery costs improve vehicle affordability. Faster charging capabilities reduce operational downtime. Improved thermal management enhances safety. These advancements increase taxi fleet confidence. Technology progress supports longer daily operations. Battery innovation creates opportunities for premium and high-utilization taxi segments.
- For instance, NIO battery packs used in high-utilization fleets support longer daily taxi operations and higher fleet reliability. These improvements, enhanced by the company's battery-as-a-service model, increase battery durability by managing charging cycles consistently and eliminate concerns about battery wear.
Key Challenges
High Initial Vehicle and Infrastructure Investment
Despite incentives, initial NEV taxi costs remain high. Fleet operators face upfront vehicle procurement expenses. Charging infrastructure setup requires capital investment. Smaller operators struggle with financing access. Battery replacement costs affect long-term planning. Profitability depends on high utilization rates. Cost sensitivity remains a challenge in smaller cities. Financial risk slows adoption for independent drivers.
Operational Constraints and Charging Downtime
Charging time impacts taxi availability and earnings. Peak-hour charging congestion affects operations. Uneven charger distribution limits route flexibility. Battery degradation affects range over time. Cold weather impacts battery performance in northern regions. Managing charging schedules requires operational discipline. Infrastructure gaps persist outside major cities. These constraints challenge consistent service efficiency.
Regional Analysis
East China
East China leads the China NEV taxi market with a 34% market share, driven by dense urban populations and advanced transport infrastructure. Cities such as Shanghai, Hangzhou, and Nanjing actively promote electric taxi adoption through strict emission policies. Strong charging network availability supports high fleet utilization. Ride-hailing platforms deploy large NEV taxi fleets to meet urban mobility demand. Local governments provide procurement incentives and operational subsidies. High passenger volumes ensure better return on investment for operators. Mature automotive supply chains and strong OEM presence further strengthen East China’s dominance in the NEV taxi ecosystem.
South China
South China holds a 27% market share, supported by rapid electrification in cities like Shenzhen and Guangzhou. Shenzhen’s early transition to fully electric taxi fleets sets a strong benchmark. Favorable climate conditions improve battery performance and range stability. High penetration of ride-hailing services increases demand for NEV taxis. Strong local battery and EV manufacturing capabilities reduce procurement costs. Extensive fast-charging infrastructure enables continuous operations. Policy support for green mobility and smart transport projects sustains growth. South China remains a key innovation hub for NEV taxi deployment.
North China
North China accounts for a 16% market share, driven by government-led electrification initiatives in cities such as Beijing and Tianjin. Air quality concerns strongly influence NEV taxi adoption. Authorities impose strict limits on internal combustion engine taxis. Public sector involvement accelerates fleet replacement programs. Charging infrastructure expansion supports urban taxi operations, though cold weather impacts battery efficiency. Despite climate challenges, policy enforcement and high commuter demand sustain growth. Increasing integration with ride-hailing platforms further supports market expansion across major northern urban centers.
Central China
Central China captures a 13% market share, supported by growing urbanization and improving transport infrastructure. Cities such as Wuhan and Changsha expand NEV taxi fleets to meet rising mobility needs. Government incentives encourage taxi operators to switch to electric models. Charging networks continue to expand, improving operational feasibility. Lower vehicle and labor costs support fleet expansion. Ride-hailing penetration increases steadily across mid-sized cities. Central China benefits from logistics connectivity and manufacturing proximity, positioning the region for sustained NEV taxi market growth.
West China
West China holds a 10% market share, reflecting gradual adoption across cities such as Chengdu and Chongqing. Government initiatives promote NEV taxis to reduce emissions in expanding urban centers. Infrastructure development remains uneven but improves steadily. Lower population density limits fleet scale compared to eastern regions. However, urban expansion and tourism-related transport demand support adoption. Incentive programs help offset higher upfront costs for operators. Growing focus on sustainable urban mobility creates long-term growth potential for NEV taxis across western provinces.
China New Energy Vehicle (NEV) Taxi Market Segmentations:
By Vehicle Type
- Sedan
- Hatchback
- Multi-purpose vehicle
By Powertrain
- Battery electric vehicle
- Plug-in hybrid electric vehicle
By Battery Type
- Lithium iron phosphate
- Nickel manganese cobalt
By Operating Model
- Company-owned fleet
- Driver-owned vehicle
By Geography
- East China
- South China
- North China
- Central China
- West China
Competitive Landscape
Competitive landscape analysis of the China New Energy Vehicle (NEV) taxi market highlights strong competition among leading players including BYD Auto Co., Ltd., SAIC Motor Corporation Limited, Geely Automobile Holdings Limited, BAIC Group, Changan Automobile, GAC Group, Dongfeng Motor Corporation, NIO Inc., XPeng Motors, and FAW Group. These companies compete through vehicle affordability, battery technology, and large-scale fleet supply capabilities. Manufacturers focus on models optimized for high daily mileage, fast charging, and low operating costs. Strategic partnerships with ride-hailing platforms and municipal taxi operators strengthen market penetration. Local production and strong aftersales networks support fleet reliability. Continuous improvements in battery lifespan and safety enhance competitiveness. Pricing strategies, government-aligned procurement programs, and rapid charging compatibility remain key factors shaping competition in this fast-growing market.
Key Player Analysis
- BYD Auto Co., Ltd.
- SAIC Motor Corporation Limited
- Geely Automobile Holdings Limited
- BAIC Group
- Changan Automobile
- GAC Group
- Dongfeng Motor Corporation
- NIO Inc.
- XPeng Motors
- FAW Group
Recent Developments
- In May 2025, BYD Auto Co., Ltd. launched the BYD e7 electric sedan aimed at taxi and ride-hailing markets in China. The model was unveiled in April 2025 and began production in May 2025.
- In 2025, SAIC Motor Corporation Limited, through its subsidiaries IM Motors and SAIC AI Lab, was actively engaged in the large-scale commercialization of L4 autonomous driving technology, which had been in development for several years.
- In March 2024, JAC announced a joint capital increase with Volkswagen China in their joint venture, Volkswagen Anhui, which focuses on NEVs.
Report Coverage
The research report offers an in-depth analysis based on Vehicle Type, Powertrain, Battery Type, Operating Model and Geography. It details leading market players, providing an overview of their business, product offerings, investments, revenue streams, and key applications. Additionally, the report includes insights into the competitive environment, SWOT analysis, current market trends, as well as the primary drivers and constraints. Furthermore, it discusses various factors that have driven market expansion in recent years. The report also explores market dynamics, regulatory scenarios, and technological advancements that are shaping the industry. It assesses the impact of external factors and global economic changes on market growth. Lastly, it provides strategic recommendations for new entrants and established companies to navigate the complexities of the market.
Future Outlook
- NEV taxi adoption will accelerate across major Chinese cities.
- Government electrification mandates will continue to drive fleet replacement.
- Battery electric vehicles will remain the dominant powertrain choice.
- Charging infrastructure expansion will improve fleet utilization rates.
- Fleet-based and platform-owned taxi models will gain wider adoption.
- Battery technology improvements will extend vehicle lifespan and safety.
- Operating costs will decline with scale and technology maturity.
- Ride-hailing demand will support sustained vehicle deployment.
- Adoption will increase in central and western regions over time.
- Continuous policy support will sustain long-term market growth.
Request a Free Sample
Fill in your details and we'll send you a free sample report.
- Sample data tables & charts
- Research methodology
Need a Custom Version of This Report?
Tailor the scope, geography, or segments to your exact requirements.
- Custom geography or segment scope
- Direct access to our analyst team
Frequently Asked Questions
What is the current market size for the China New Energy Vehicle (NEV) Taxi market, and what is its projected size in 2032?
At what Compound Annual Growth Rate is the China New Energy Vehicle (NEV) Taxi market projected to grow between 2024 and 2032?
Which China New Energy Vehicle (NEV) Taxi market segment held the largest share in 2024?
What are the primary factors fueling the growth of the China New Energy Vehicle (NEV) Taxi market?
Who are the leading companies in the China New Energy Vehicle (NEV) Taxi market?
Which region commanded the largest share of the China New Energy Vehicle (NEV) Taxi market in 2024?
Table of Content
Chapter 1. Report Introduction
- 1.1 Report Description & Purpose
- 1.1.1 Report Title & Market Definition
- 1.1.2 Unique Selling Propositions (USP) & Key Differentiators
- 1.1.3 Value Proposition for Stakeholders
- 1.2 Research Objectives
- 1.2.1 Market Sizing Objectives (Volume & Revenue)
- 1.2.2 Segmentation Objectives
- 1.2.3 Competitive Intelligence Objectives
- 1.2.4 Forecast & Scenario Objectives
- 1.3 Report Scope
- 1.3.1 China New Energy Vehicle (NEV) Taxi Scope – Types & Subtypes Covered
- 1.3.2 Geographic Scope – Regions & Countries Covered
- 1.3.3 Historical Period, Base Year & Forecast Period (2024; forecast to 2032)
- 1.3.4 Inclusions & Exclusions
- 1.4 HS Code & Classification Framework
- 1.5 Currency, Units & Pricing Basis
- 1.6 Target Stakeholders
- 1.7 Limitations & Assumptions
Chapter 2. Executive Summary
- 2.1 Global China New Energy Vehicle (NEV) Taxi Market Snapshot
- 2.1.1 Market Size – Historical (2024) & Forecast (2024-2032) (2024: USD 758 million → 2032: USD 7,029.7 million)
- 2.1.2 Volume & Revenue – Global Totals
- 2.1.3 Key Market Highlights – Top Five Facts
- 2.2 China New Energy Vehicle (NEV) Taxi Market Segmentation Snapshot
- 2.2.1 Market Split by Region – 2024 vs. 2032
- 2.3 Competitive Snapshot
- 2.3.1 Top 10 Players by Revenue Share – 2024
- 2.3.2 Top 10 Players by Volume Share – 2024
- 2.3.3 Recent Strategic Developments (18-Month Summary)
- 2.4 Key Investment Highlights & Strategic Conclusions
Chapter 3. China New Energy Vehicle (NEV) Taxi Market Dynamics & Industry Analysis
- 3.1 Market Overview & Context
- 3.1.1 China New Energy Vehicle (NEV) Taxi Market Position in the Broader Automotive Value Chain
- 3.1.2 OEM vs. Replacement Market Dynamics
- 3.1.3 Market Maturity & Development Stage by Region
- 3.2 China New Energy Vehicle (NEV) Taxi Market Drivers
- 3.3 China New Energy Vehicle (NEV) Taxi Market Restraints & Challenges
- 3.4 China New Energy Vehicle (NEV) Taxi Market Opportunities
- 3.5 Porter's Five Forces Analysis
- 3.5.1 Threat of New Entrants
- 3.5.2 Bargaining Power of Suppliers
- 3.5.3 Bargaining Power of Buyers
- 3.5.4 Threat of Substitutes
- 3.5.5 Competitive Rivalry – Intensity Assessment
- 3.6 China New Energy Vehicle (NEV) Taxi Value Chain Analysis
- 3.6.1 Upstream – Raw Material/Input Suppliers
- 3.6.1.1 Raw Material/Input 1
- 3.6.1.2 Raw Material/Input 2
- 3.6.1.3 Raw Material/Input 3
- 3.6.2 Midstream – Production/Manufacturing/Service Delivery
- 3.6.2.1 Production/Process Overview
- 3.6.2.2 Key Facility Locations & Capacity by Manufacturer
- 3.6.3 Downstream – Distribution & End Consumer
- 3.6.3.1 Primary Channel – B2B/OEM
- 3.6.3.2 Secondary Channels – Dealer, Retail, Online, Direct
- 3.6.4 Value Chain Profitability Analysis
- 3.6.1 Upstream – Raw Material/Input Suppliers
- 3.7 PESTEL Analysis
- 3.7.1 Political Factors
- 3.7.2 Economic Factors
- 3.7.3 Social Factors
- 3.7.4 Technological Factors
- 3.7.5 Environmental Factors
- 3.7.6 Legal Factors
- 3.8 China New Energy Vehicle (NEV) Taxi Supply Chain Analysis
- 3.8.1 Raw Material/Input Supply Risk Assessment
- 3.8.2 Manufacturing Concentration Risk (Geographic Exposure)
- 3.8.3 Trade Disruption Impact Analysis
- 3.9 Regulatory & Policy Landscape
Note: The regulatory and policy landscape section covers regulations based on their applicability to the market, China New Energy Vehicle (NEV) Taxi category, geography, and scope of the study. Only regulatory frameworks with a material impact on operations, compliance, trade, sustainability, or market access are analyzed in detail.
Chapter 4. Key Investment Pockets & Opportunity Analysis
- 4.1 China New Energy Vehicle (NEV) Taxi Market Attractiveness Analysis
- 4.1.1 By Region – Investment Attractiveness Matrix (Volume × CAGR)
- 4.2 Absolute Revenue Growth Opportunity
- 4.2.1 By Region – Absolute USD Growth Through 2032
- 4.3 Incremental Volume Opportunity
- 4.3.1 By Region – Incremental Volume Through 2032
- 4.3.2 Segment – Incremental Volume
- 4.4 Emerging Submarket Opportunity Deep Dive (Subject to Applicability)
- 4.5 Emerging Market Opportunity Scorecards
- 4.5.1 United States
- 4.5.2 Europe
- 4.5.3 Asia
- 4.5.4 Middle East & Africa
Note: Emerging Market Opportunity Scorecards will be included based on relevance and strategic importance. Regions listed are indicative and may vary depending on data availability and market dynamics.
Chapter 5. China New Energy Vehicle (NEV) Taxi Import-Export Analysis & Trade Flows
- 5.1 Global Trade Overview
- 5.1.1 Global Export Value by Country (2024)
- 5.1.2 Global Export Volume by Country (2024)
- 5.1.3 Global Import Value by Country (2024)
- 5.1.4 Global Import Volume by Country (2024)
- 5.1.5 Net Trade Balance by Country (2024)
- 5.2 Export Analysis – Segment
- 5.2.1 Type 1 (HS Code)
- 5.2.2 Type 2 (HS Code)
- 5.2.3 Type 3 (HS Code)
- 5.2.4 Type 4 (HS Code)
- 5.2.5 Type 5 (HS Code)
- 5.3 Import Analysis – Segment
- 5.3.1 Type 1 (HS Code)
- 5.3.2 Type 2 (HS Code)
- 5.3.3 Type 3 (HS Code)
- 5.3.4 Type 4 (HS Code)
- 5.3.5 Type 5 (HS Code)
- 5.4 Average Unit Trade Prices
- 5.4.1 Average Export Price – Segment & Country
- 5.4.2 Average Import Price – Segment & Source Country
- 5.4.3 Price Trends (2024)
- 5.5 Key Trade Route Analysis
- 5.5.1 Trade Route 1
- 5.5.2 Trade Route 2
- 5.5.3 Trade Route 3
- 5.5.4 Trade Route 4
- 5.5.5 Trade Route 5
- 5.6 Trade Policy Impact Assessment
- 5.6.1 US Anti-Dumping & Section 301 Tariffs
- 5.6.2 EU Customs Union Impact
- 5.6.3 Major Free Trade Agreements
- 5.6.4 USMCA Rules of Origin
Note: Trade policy analysis will be included only where relevant to the China New Energy Vehicle (NEV) Taxi market.
Chapter 6. Competitive Landscape & Company Benchmarking
- 6.1 China New Energy Vehicle (NEV) Taxi Market Concentration & Structure
- 6.1.1 Herfindahl-Hirschman Index (HHI) – vs. 2024
- 6.1.2 Tier 1, Tier 2 & Tier 3 Market Structure
- 6.1.3 Global, Regional & Local Player Dynamics
- 6.2 China New Energy Vehicle (NEV) Taxi Market Share Analysis – 2024
- 6.2.1 Global Revenue Share by Company
- 6.2.2 Global Volume Share by Company
- 6.2.3 Regional Revenue Share
- 6.2.4 Market Share Evolution ( vs. 2024)
- 6.2.5 OEM Segment Share by Company
- 6.2.6 Replacement Segment Share by Company
- 6.3 Production/Delivery Capacity & Facility Analysis
- 6.3.1 Global Installed Capacity
- 6.3.2 Capacity Utilization Rates
- 6.3.3 Production/Output Volume
- 6.3.4 Facility Locations & Capacity Map
- 6.3.5 Planned Capacity Additions
- 6.4 China New Energy Vehicle (NEV) Taxi Competitive Benchmarking Matrix
- 6.4.1 Revenue, Volume, CAGR & Profitability Comparison
- 6.4.2 Channel Revenue Mix
- 6.4.3 Geographic Revenue Exposure
- 6.4.4 R&D Intensity
- 6.4.5 Sustainability Maturity
- 6.5 Strategic Developments in China New Energy Vehicle (NEV) Taxi (Last 24 Months)
- 6.5.1 Mergers, Acquisitions & Divestments
- 6.5.2 New China New Energy Vehicle (NEV) Taxi Launches
- 6.5.3 Facility Expansions
- 6.5.4 Strategic Alliances, Joint Ventures & Partnerships
- 6.5.5 Distribution Expansion & Market Entry
- 6.5.6 Sustainability & ESG Initiatives
- 6.6 Competitive Strategy Mapping
- 6.6.1 Leader, Challenger, Follower & Niche Classification
- 6.6.2 Pricing Strategy Comparison
- 6.6.3 Channel Strategy Matrix
Note: Strategic developments are included based on their materiality and the availability of reliable information.
Chapter 7. Global China New Energy Vehicle (NEV) Taxi Market – By Distribution Channel
- 7.1 Segment Overview
- 7.1.1 Volume & Revenue Split by Channel (2024 & 2032)
- 7.1.2 Channel Mix Evolution (2024-2032)
Chapter 8. Regional Market Analysis – Global Overview
- 8.1 Global Regional Overview
- 8.1.1 Regional Volume Share
- 8.1.2 Regional Revenue Share
- 8.1.3 Regional Volume by Region
- 8.1.4 Regional Revenue by Region
- 8.1.5 Regional Forecast Through 2032
- 8.2 Cross-Regional Segment Analysis
- 8.2.1 By Distribution Channel
- 8.2.2 By Brand/Price Tier
Chapter 9. North America China New Energy Vehicle (NEV) Taxi Market
- 9.1 United States
- 9.2 Canada
- 9.3 Mexico
Chapter 10. Europe China New Energy Vehicle (NEV) Taxi Market
- 10.1 Germany
- 10.2 France
- 10.3 Italy
- 10.4 United Kingdom
- 10.5 Spain
- 10.6 Poland
- 10.7 Russia
- 10.8 Netherlands
- 10.9 Belgium
- 10.10 Sweden
- 10.11 Denmark
- 10.12 Norway
- 10.13 Rest of Europe
Chapter 11. Asia Pacific China New Energy Vehicle (NEV) Taxi Market
- 11.1 China
- 11.2 India
- 11.3 Japan
- 11.4 South Korea
- 11.5 Thailand
- 11.6 Indonesia
- 11.7 Vietnam
- 11.8 Malaysia
- 11.9 Australia
- 11.10 Rest of Asia Pacific
Chapter 12. Latin America China New Energy Vehicle (NEV) Taxi Market
- 12.1 Brazil
- 12.2 Argentina
- 12.3 Colombia
- 12.4 Chile
- 12.5 Rest of Latin America
Chapter 13. Middle East China New Energy Vehicle (NEV) Taxi Market
- 13.1 Saudi Arabia
- 13.2 United Arab Emirates
- 13.3 Turkey
- 13.4 Israel
- 13.5 Iran
- 13.6 Rest of the Middle East
Chapter 14. Africa China New Energy Vehicle (NEV) Taxi Market
- 14.1 South Africa
- 14.2 Egypt
- 14.3 Nigeria
- 14.4 Morocco
- 14.5 Rest of Africa
Chapter 15. China New Energy Vehicle (NEV) Taxi Company Profiles
- 15.1 [Company 01]
- 15.1.1 Company Overview
- 15.1.2 Key Management Personnel
- 15.1.3 Products & Services Portfolio
- 15.1.4 Financial Performance
- 15.1.5 Key Market Focus & Geographic Presence
- 15.1.6 Recent Developments & Strategic Initiatives
Note: The company profile list is preliminary and may change based on research findings, market developments, data availability, and client requirements.
Chapter 16. Appendices
- Appendix A – List of Abbreviations & Acronyms
- Appendix B – Industry Classification Code Reference – Full Series
- Appendix C – Production & Capacity Data Tables
- Appendix D – End-Use & Demand Base Tables
- Appendix E – Consumption & Replacement Rate Assumptions
- Appendix F – ASP Reference Tables
- Appendix G – Manufacturing & Facility Database
- Appendix H – Import-Export Data Tables
- Appendix I – Regulatory Summary Tables
- Appendix J – Primary Research Participant List (Anonymized)
- Appendix K – Primary Research Questionnaire Framework
- Appendix L – Data Sources & Bibliography
- Appendix M – Market Size Divergence & Source Comparison
Chapter 17. Research Methodology
- 17.1 Research Framework & Philosophy
- 17.2 Secondary Research – Sources, Hierarchy & Data Extraction
- 17.3 Data Modeling – Bottom-Up & Top-Down Market Sizing
- 17.4 Primary Research – Stakeholder Framework, LOI & Sample Sizes
- 17.5 Forecast Methodology – Regression, Scenario & Sensitivity Analysis
- 17.6 Quality Control – Four-Layer Validation Framework
- 17.7 Limitations & Standard Assumptions
- 17.8 Disclaimer
