
Market Overview
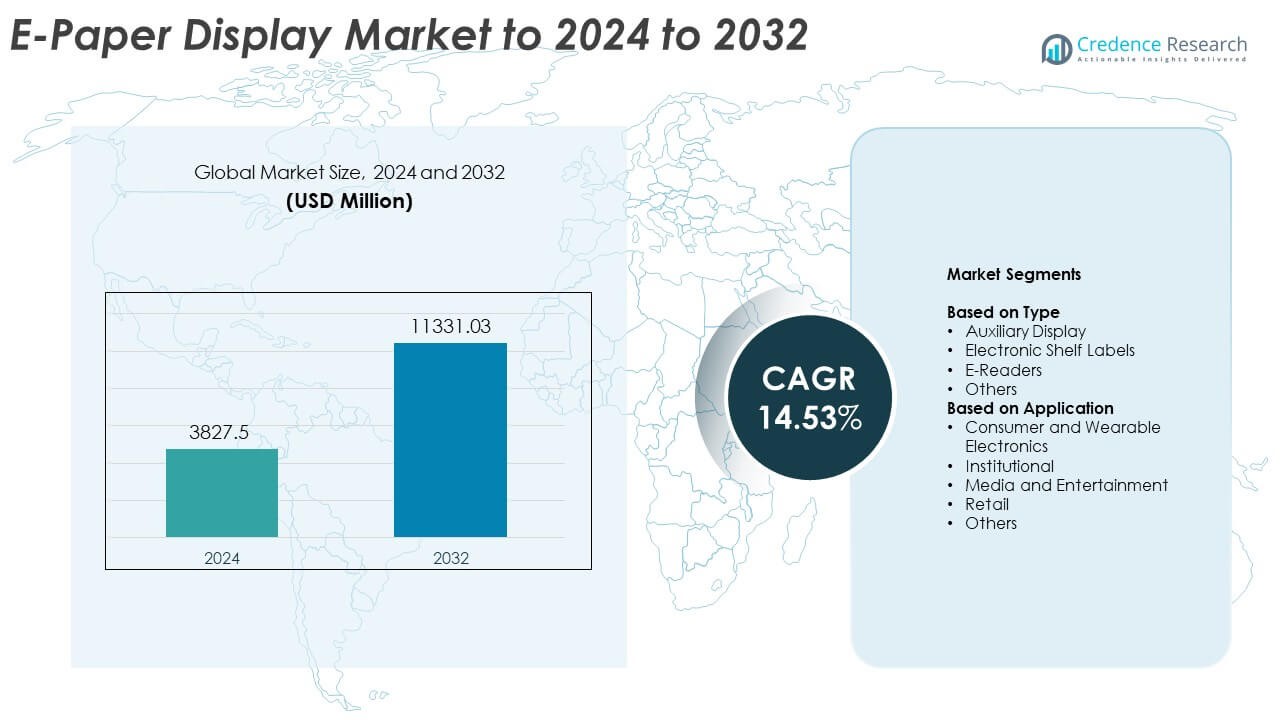
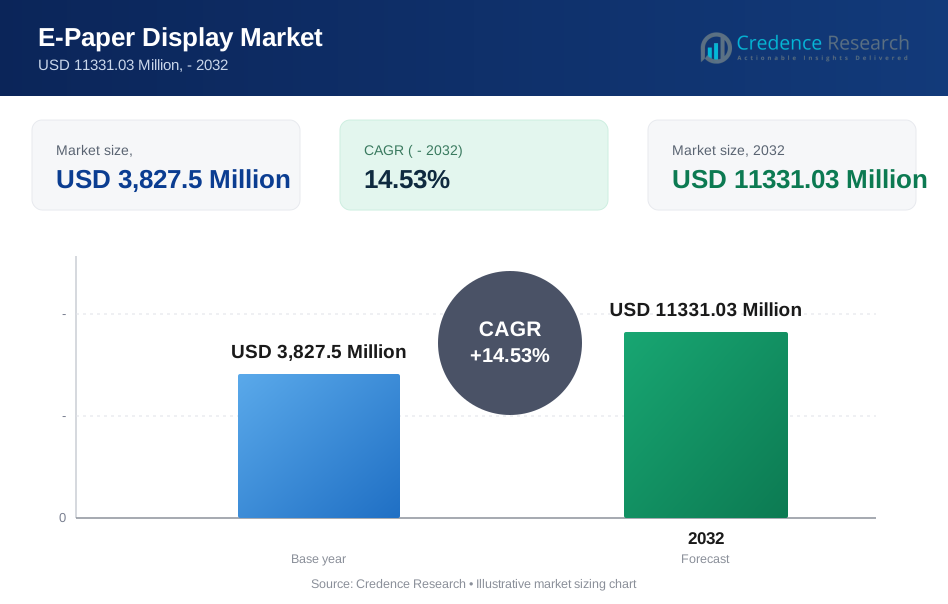
E-Paper Display Market size was valued at USD 3827.5 Million in 2024 and is anticipated to reach USD 11331.03 Million by 2032, at a CAGR of 14.53% during the forecast period.
| REPORT ATTRIBUTE | DETAILS |
|---|---|
| Historical Period | 2020-2023 |
| Base Year | 2024 |
| Forecast Period | 2025-2032 |
| E-Paper Display Market Size 2024 | USD 3827.5 Million |
| E-Paper Display Market , CAGR | 14.53% |
| E-Paper Display Market Size 2032 | USD 11331.03 Million |
The E-Paper Display Market is shaped by leading companies such as E Ink Holdings, Sony Corporation, LG Display, Plastic Logic, CLEARink Displays, Visionect, OED Technologies, Tianma Microelectronics, Hanvon Technology, Pervasive Displays, and Samsung. These players drive innovation through advancements in low-power displays, flexible panels, and high-visibility screens that support retail automation, e-readers, wearables, and smart signage. North America leads the market with about 34% share in 2024 due to strong adoption of electronic shelf labels and digital signage, followed by Europe with nearly 29% driven by sustainability initiatives, while Asia Pacific holds around 27% supported by large electronics manufacturing and expanding retail digitalization.
Market Insights
- The E-Paper Display Market was valued at USD 3827.5 Million in 2024 and is expected to reach USD 11331.03 Million by 2032, growing at a CAGR of 14.53%. • Market growth is driven by rising adoption of electronic shelf labels, which hold about 46% share, supported by demand for real-time pricing and low-power retail automation. • Key trends include expanding use of E-paper in wearables, IoT devices, and digital learning tools, along with growing opportunities in flexible and color display technologies. • The competitive landscape features strong innovation in energy-efficient designs and advanced display modules as companies compete through R&D, product upgrades, and partnerships. • North America leads with around 34% share, followed by Europe at 29% and Asia Pacific at 27%, supported by retail digitalization, sustainability goals, and large-scale electronics manufacturing.
Market Segmentation Analysis:
By Type
Electronic Shelf Labels lead this segment with about 46% share in 2024. Retail chains adopt these labels to cut labor costs, support dynamic price updates, and improve in-store accuracy. Supermarkets and hypermarkets expand deployments as E-paper screens offer low power use and clear readability. E-readers hold steady demand due to rising digital book adoption, while auxiliary displays grow with smart devices. Other types expand in niche uses, including logistics and signage, supported by energy-efficient display upgrades.
- For instance, Pricer, a global leader in digital shelf-edge solutions, has sold more than 350 million electronic shelf labels (ESLs) globally. These solutions are deployed in over 28,000 stores across more than 70 countries.
By Application Retail dominates this segment with nearly 48% share in 2024. Stores shift to digital shelf systems to support real-time pricing, reduce errors, and enhance customer engagement. Brands rely on E-paper due to long battery life and strong visibility under bright lighting. Consumer and wearable electronics gain traction as smartwatches and note-taking tablets adopt E-ink panels. Institutional and media sectors show steady growth with uses in signage, information boards, and low-energy display systems.
- For instance, Walmart announced plans to deploy about 60 million digital shelf labels across 500 stores within 18 months, showing how large retailers use E-paper systems for real-time pricing and operations.
Key Growth Drivers
Rising Adoption of Electronic Shelf Labels
Retailers boost demand as digital shelf labels replace paper tags and support real-time price updates. Large retail chains favor E-paper because it cuts labor effort and improves pricing accuracy across thousands of shelves. Growing focus on automation pushes adoption in supermarkets, convenience stores, and pharmacies. Energy-efficient E-paper modules help retailers manage long operating hours with minimal maintenance. Expanding retail networks and rising interest in smart store ecosystems further accelerate upgrades to E-paper-based display systems.
- For instance, Co-op plans to install smart electronic shelf labels in around 1,500 shops by the end of 2025 and extend them to nearly 2,400 stores by 2026, underlining rapid adoption in food retail.
Expansion of E-Readers and Digital Learning Devices
Schools, universities, and consumers increase use of E-readers due to clear visibility, light weight, and eye-friendly viewing. The rise of digital books and note-taking devices supports wider integration of E-paper displays in education and professional environments. Long battery life benefits readers who consume high content volumes daily. Device makers enhance screen resolution and writing functionality, encouraging broader adoption. Growth in digital education programs strengthens demand for reliable, low-power E-paper solutions.
- For instance, Kobo states that the Aura HD e-reader offers up to 2 months of battery life on typical use and includes 4 GB of onboard storage for digital books.
Energy Efficiency and Sustainability Preference
Businesses prefer E-paper because it consumes very low power and reduces the need for frequent charging. Enterprises and public institutions adopt these displays to support green building goals and lower energy spending. Sustainability policies push replacement of printed materials with reusable digital alternatives. E-paper’s paper-like appearance supports signage, labels, and information boards that run for months on a single charge. Growing environmental awareness strengthens preference for durable, recyclable E-paper modules across industries.
Key Trends and Opportunities
Growing Use in Wearable and IoT Devices
Wearable makers integrate E-paper to deliver high readability under sunlight and extended battery performance. Smartwatches, fitness trackers, and outdoor gear use these displays for always-on information without heavy power drain. IoT devices also adopt E-paper for sensor dashboards and low-energy notifications. The shift toward ultra-low-power electronics expands future opportunities for flexible and rugged E-paper formats. This trend also aligns with rising consumer demand for durable and lightweight interfaces.
- For instance, Fossil’s Gen 6 Hybrid Wellness Edition smartwatch uses an E-ink-style display and is advertised with battery life of more than 2 weeks on a single charge, supporting always-on wearable use.
Expansion of Color and Flexible E-Paper Technologies
Manufacturers develop advanced color E-paper and flexible panels to widen adoption in signage, retail media, and consumer devices. Improved refresh rates and vibrant color capability open new use cases in advertising displays and packaging. Flexible E-paper supports curved surfaces and foldable designs, enabling creative product layouts. These innovations drive interest from automotive, fashion, and smart home applications seeking versatile display solutions. The shift to next-generation E-paper formats unlocks fresh commercial opportunities.
- For instance, Fujitsu’s FLEPia color e-paper terminal is specified to display up to 260,000 colors on an 8-inch screen and can operate for about 40 hours on battery power under standard test conditions.
Growing Demand for Smart Retail and Automation Solutions
Retailers expand digital transformation programs that rely on E-paper displays for automation and improved shopper engagement. E-paper labels help large stores reduce pricing errors, manage promotions, and optimize workforce tasks. Integration with inventory systems boosts efficiency and supports real-time updates. As retail chains adopt omnichannel strategies, dynamic labeling enables consistent pricing across online and offline platforms. This creates strong opportunities for E-paper makers to scale deployments.
Key Challenges
Limited Refresh Speed and Multimedia Capabilities
E-paper struggles with fast motion, color richness, and high refresh rates required for video or advanced interfaces. This technical limitation restricts adoption in devices that need dynamic content. Competing display types offer richer multimedia performance, reducing E-paper’s appeal in entertainment or gaming uses. Buyers often select E-paper only for static or slow-changing content. Improving refresh technology remains a major need for broader market penetration.
Higher Initial Cost Compared to Traditional Labels
E-paper displays cost more upfront than printed labels or basic LCD alternatives, slowing adoption among small retailers and low-budget deployments. While long-term savings exist, initial investment creates hesitation for businesses with limited digital infrastructure. Replacement and scaled installation also increase cost pressure. Competing low-cost solutions cause buyers to delay upgrades. Price sensitivity in emerging markets continues to challenge E-paper vendors aiming for wider deployment.
Regional Analysis
North America
North America holds about 34% share in the E-Paper Display Market in 2024, supported by strong retail digitalization and early adoption of electronic shelf labels across large supermarket chains. Technology integration in smart wearables and e-readers also boosts regional demand. Corporations and public institutions deploy E-paper signage to cut energy use and enhance information visibility. High investment in automation and stable consumer electronics spending further strengthen sales. Growing use of E-paper in logistics and transportation displays also expands the regional footprint.
Europe
Europe accounts for nearly 29% share in 2024, driven by strict sustainability goals and rapid adoption of energy-efficient digital labeling across retail and industrial environments. Large grocery chains deploy E-paper solutions to support frequent price updates and reduce waste from paper tags. Demand increases in public transport systems using E-paper timetables and low-power signage. Wearable device adoption and digital education programs add momentum. Strong governmental support for green technologies ensures ongoing upgrades to low-power display infrastructure across major European economies.
Asia Pacific
Asia Pacific holds about 27% share in 2024 and shows the fastest expansion due to large-scale retail growth and strong electronics manufacturing capabilities. High production of e-readers, smart devices, and IoT products pushes wider use of E-paper modules. Retailers in China, Japan, and South Korea adopt electronic shelf labels to manage dynamic pricing across expanding store networks. Educational institutions deploy digital reading devices, supporting sustained demand. Growing investment in smart city projects further accelerates usage of E-paper information boards and low-energy public displays.
Latin America
Latin America captures roughly 6% share in the E-Paper Display Market in 2024, supported by rising adoption of digital shelf labeling in supermarkets and pharmacies. Retailers upgrade pricing systems to improve accuracy and reduce manual work. E-paper gains traction in logistics tracking, warehouse labeling, and low-power signage. Growth remains moderate due to budget constraints and slower digital transformation, but demand strengthens in countries modernizing retail infrastructure. Expanding e-commerce networks also encourage wider use of E-paper for inventory and parcel management displays.
Middle East and Africa
Middle East and Africa hold about 4% share in 2024, with demand led by retail modernization and adoption of energy-saving display systems. Large retailers in Gulf countries invest in electronic shelf labels to support real-time pricing and improve store operations. Smart city initiatives create opportunities for E-paper in public information boards and outdoor signage. Institutional adoption grows as universities and hospitals deploy low-power displays. Market growth remains gradual in developing regions due to higher upfront costs but improves as digital retail formats expand.
Market Segmentations:
By Type
- Auxiliary Display
- Electronic Shelf Labels
- E-Readers
- Others
By Application
- Consumer and Wearable Electronics
- Institutional
- Media and Entertainment
- Retail
- Others
By Geography
- North America
- U.S.
- Canada
- Mexico
- Europe
- Germany
- France
- U.K.
- Italy
- Spain
- Rest of Europe
- Asia Pacific
- China
- Japan
- India
- South Korea
- South-east Asia
- Rest of Asia Pacific
- Latin America
- Brazil
- Argentina
- Rest of Latin America
- Middle East & Africa
- GCC Countries
- South Africa
- Rest of the Middle East and Africa
Competitive Landscape
The competitive landscape of the E-Paper Display Market includes OED Technologies, Visionect, Sony Corporation, Tianma Microelectronics, CLEARink Displays, LG Display, Samsung, Plastic Logic, Hanvon Technology, Pervasive Displays, and E Ink Holdings. Companies focus on advancing display clarity, power efficiency, and durability to strengthen product value across retail, consumer electronics, and industrial applications. Many manufacturers invest in color E-paper innovations and flexible substrates to expand into signage, wearables, and smart devices. Strategic partnerships with retailers, device makers, and automation firms help broaden market reach. Firms also work on improving refresh speeds and visibility under varied lighting conditions to enhance user experience. Cost optimization and scalable manufacturing remain priority areas as vendors aim to increase adoption in emerging markets. Companies continue expanding production capacity and enhancing R&D capabilities to support long-term growth in low-power display technologies.
Key Player Analysis
- OED Technologies
- Visionect
- Sony Corporation
- Tianma Microelectronics
- CLEARink Displays
- LG Display
- Samsung
- Plastic Logic
- Hanvon Technology
- Pervasive Displays
- E Ink Holdings
Recent Developments
- In 2025, Samsung started mass-producing a 32-inch Color E-Paper display (model EM32DX), a digital signage solution developed in collaboration with E Ink, which renders nearly 2.5 million colors while maintaining ultra-low power consumption.
- In 2025, Hanvon unveiled the world's first dual-mode EMC-touch chip HW0888 at CES 2025, supporting both passive electromagnetic pens and capacitive touch.
- In 2024, E Ink Holdings launched a new generation of enhanced color e-paper displays with improved color accuracy and higher resolution.
Report Coverage
The research report offers an in-depth analysis based on Type, Application and Geography. It details leading market players, providing an overview of their business, product offerings, investments, revenue streams, and key applications. Additionally, the report includes insights into the competitive environment, SWOT analysis, current market trends, as well as the primary drivers and constraints. Furthermore, it discusses various factors that have driven market expansion in recent years. The report also explores market dynamics, regulatory scenarios, and technological advancements that are shaping the industry. It assesses the impact of external factors and global economic changes on market growth. Lastly, it provides strategic recommendations for new entrants and established companies to navigate the complexities of the market.
Future Outlook
- The market will grow as retailers expand digital shelf labeling across global store networks.
- E-readers and digital note-taking devices will gain wider use in education and professional settings.
- Wearables and IoT devices will adopt more E-paper modules to extend battery life.
- Color E-paper and flexible display technologies will unlock new commercial applications.
- Smart city projects will increase demand for low-power public signage and transport displays.
- Manufacturers will improve refresh speeds to broaden use in dynamic content environments.
- Sustainability goals will drive institutions to replace printed materials with reusable E-paper displays.
- Integration with automation platforms will strengthen adoption in logistics and warehousing.
- Advertising and retail media networks will explore E-paper for lightweight, energy-saving displays.
- Falling production costs will make E-paper solutions more accessible across emerging markets.
Request a Free Sample
Fill in your details and we'll send you a free sample report.
- Sample data tables & charts
- Research methodology
Need a Custom Version of This Report?
Tailor the scope, geography, or segments to your exact requirements.
- Custom geography or segment scope
- Direct access to our analyst team
Frequently Asked Questions
What is the current market size for E-Paper Display Market, and what is its projected size in 2032?
At what Compound Annual Growth Rate is the E-Paper Display Market projected to grow between 2025 and 2032?
Which E-Paper Display Market segment held the largest share in 2024?
What are the primary factors fueling the growth of the E-Paper Display Market?
Who are the leading companies in the E-Paper Display Market?
Which region commanded the largest share of the E-Paper Display Market in 2024?
Table of Content
Chapter 1. Report Introduction
- 1.1 Report Description & Purpose
- 1.1.1 Report Title & Market Definition
- 1.1.2 Unique Selling Propositions (USP) & Key Differentiators
- 1.1.3 Value Proposition for Stakeholders
- 1.2 Research Objectives
- 1.2.1 Market Sizing Objectives (Volume & Revenue)
- 1.2.2 Segmentation Objectives
- 1.2.3 Competitive Intelligence Objectives
- 1.2.4 Forecast & Scenario Objectives
- 1.3 Report Scope
- 1.3.1 E-Paper Display Scope – Types & Subtypes Covered
- 1.3.2 Geographic Scope – Regions & Countries Covered
- 1.3.3 Historical Period, Base Year & Forecast Period (the historical period; forecast to 2032)
- 1.3.4 Inclusions & Exclusions
- 1.4 HS Code & Classification Framework
- 1.5 Currency, Units & Pricing Basis
- 1.6 Target Stakeholders
- 1.7 Limitations & Assumptions
Chapter 2. Executive Summary
- 2.1 Global E-Paper Display Market Snapshot
- 2.1.1 Market Size – Historical (the historical period) & Forecast (2032) (base year: USD 3,827.5 Million → 2032: USD 11331.03 Million)
- 2.1.2 Volume & Revenue – Global Totals
- 2.1.3 Key Market Highlights – Top Five Facts
- 2.2 E-Paper Display Market Segmentation Snapshot
- 2.2.1 Market Split by Region – vs. 2032
- 2.3 Competitive Snapshot
- 2.3.1 Top 10 Players by Revenue Share –
- 2.3.2 Top 10 Players by Volume Share –
- 2.3.3 Recent Strategic Developments (18-Month Summary)
- 2.4 Key Investment Highlights & Strategic Conclusions
Chapter 3. E-Paper Display Market Dynamics & Industry Analysis
- 3.1 Market Overview & Context
- 3.1.1 E-Paper Display Market Position in the Broader Automotive Value Chain
- 3.1.2 OEM vs. Replacement Market Dynamics
- 3.1.3 Market Maturity & Development Stage by Region
- 3.2 E-Paper Display Market Drivers
- 3.3 E-Paper Display Market Restraints & Challenges
- 3.4 E-Paper Display Market Opportunities
- 3.5 Porter's Five Forces Analysis
- 3.5.1 Threat of New Entrants
- 3.5.2 Bargaining Power of Suppliers
- 3.5.3 Bargaining Power of Buyers
- 3.5.4 Threat of Substitutes
- 3.5.5 Competitive Rivalry – Intensity Assessment
- 3.6 E-Paper Display Value Chain Analysis
- 3.6.1 Upstream – Raw Material/Input Suppliers
- 3.6.1.1 Raw Material/Input 1
- 3.6.1.2 Raw Material/Input 2
- 3.6.1.3 Raw Material/Input 3
- 3.6.2 Midstream – Production/Manufacturing/Service Delivery
- 3.6.2.1 Production/Process Overview
- 3.6.2.2 Key Facility Locations & Capacity by Manufacturer
- 3.6.3 Downstream – Distribution & End Consumer
- 3.6.3.1 Primary Channel – B2B/OEM
- 3.6.3.2 Secondary Channels – Dealer, Retail, Online, Direct
- 3.6.4 Value Chain Profitability Analysis
- 3.6.1 Upstream – Raw Material/Input Suppliers
- 3.7 PESTEL Analysis
- 3.7.1 Political Factors
- 3.7.2 Economic Factors
- 3.7.3 Social Factors
- 3.7.4 Technological Factors
- 3.7.5 Environmental Factors
- 3.7.6 Legal Factors
- 3.8 E-Paper Display Supply Chain Analysis
- 3.8.1 Raw Material/Input Supply Risk Assessment
- 3.8.2 Manufacturing Concentration Risk (Geographic Exposure)
- 3.8.3 Trade Disruption Impact Analysis
- 3.9 Regulatory & Policy Landscape
Note: The regulatory and policy landscape section covers regulations based on their applicability to the market, E-Paper Display category, geography, and scope of the study. Only regulatory frameworks with a material impact on operations, compliance, trade, sustainability, or market access are analyzed in detail.
Chapter 4. Key Investment Pockets & Opportunity Analysis
- 4.1 E-Paper Display Market Attractiveness Analysis
- 4.1.1 By Region – Investment Attractiveness Matrix (Volume × CAGR)
- 4.2 Absolute Revenue Growth Opportunity
- 4.2.1 By Region – Absolute USD Growth Through 2032
- 4.3 Incremental Volume Opportunity
- 4.3.1 By Region – Incremental Volume Through 2032
- 4.3.2 Segment – Incremental Volume
- 4.4 Emerging Submarket Opportunity Deep Dive (Subject to Applicability)
- 4.5 Emerging Market Opportunity Scorecards
- 4.5.1 United States
- 4.5.2 Europe
- 4.5.3 Asia
- 4.5.4 Middle East & Africa
Note: Emerging Market Opportunity Scorecards will be included based on relevance and strategic importance. Regions listed are indicative and may vary depending on data availability and market dynamics.
Chapter 5. E-Paper Display Import-Export Analysis & Trade Flows
- 5.1 Global Trade Overview
- 5.1.1 Global Export Value by Country (the historical period)
- 5.1.2 Global Export Volume by Country (the historical period)
- 5.1.3 Global Import Value by Country (the historical period)
- 5.1.4 Global Import Volume by Country (the historical period)
- 5.1.5 Net Trade Balance by Country (the historical period)
- 5.2 Export Analysis – Segment
- 5.2.1 Type 1 (HS Code)
- 5.2.2 Type 2 (HS Code)
- 5.2.3 Type 3 (HS Code)
- 5.2.4 Type 4 (HS Code)
- 5.2.5 Type 5 (HS Code)
- 5.3 Import Analysis – Segment
- 5.3.1 Type 1 (HS Code)
- 5.3.2 Type 2 (HS Code)
- 5.3.3 Type 3 (HS Code)
- 5.3.4 Type 4 (HS Code)
- 5.3.5 Type 5 (HS Code)
- 5.4 Average Unit Trade Prices
- 5.4.1 Average Export Price – Segment & Country
- 5.4.2 Average Import Price – Segment & Source Country
- 5.4.3 Price Trends (the historical period)
- 5.5 Key Trade Route Analysis
- 5.5.1 Trade Route 1
- 5.5.2 Trade Route 2
- 5.5.3 Trade Route 3
- 5.5.4 Trade Route 4
- 5.5.5 Trade Route 5
- 5.6 Trade Policy Impact Assessment
- 5.6.1 US Anti-Dumping & Section 301 Tariffs
- 5.6.2 EU Customs Union Impact
- 5.6.3 Major Free Trade Agreements
- 5.6.4 USMCA Rules of Origin
Note: Trade policy analysis will be included only where relevant to the E-Paper Display market.
Chapter 6. Competitive Landscape & Company Benchmarking
- 6.1 E-Paper Display Market Concentration & Structure
- 6.1.1 Herfindahl-Hirschman Index (HHI) – vs.
- 6.1.2 Tier 1, Tier 2 & Tier 3 Market Structure
- 6.1.3 Global, Regional & Local Player Dynamics
- 6.2 E-Paper Display Market Share Analysis –
- 6.2.1 Global Revenue Share by Company
- 6.2.2 Global Volume Share by Company
- 6.2.3 Regional Revenue Share
- 6.2.4 Market Share Evolution ( vs. )
- 6.2.5 OEM Segment Share by Company
- 6.2.6 Replacement Segment Share by Company
- 6.3 Production/Delivery Capacity & Facility Analysis
- 6.3.1 Global Installed Capacity
- 6.3.2 Capacity Utilization Rates
- 6.3.3 Production/Output Volume
- 6.3.4 Facility Locations & Capacity Map
- 6.3.5 Planned Capacity Additions
- 6.4 E-Paper Display Competitive Benchmarking Matrix
- 6.4.1 Revenue, Volume, CAGR & Profitability Comparison
- 6.4.2 Channel Revenue Mix
- 6.4.3 Geographic Revenue Exposure
- 6.4.4 R&D Intensity
- 6.4.5 Sustainability Maturity
- 6.5 Strategic Developments in E-Paper Display (Last 24 Months)
- 6.5.1 Mergers, Acquisitions & Divestments
- 6.5.2 New E-Paper Display Launches
- 6.5.3 Facility Expansions
- 6.5.4 Strategic Alliances, Joint Ventures & Partnerships
- 6.5.5 Distribution Expansion & Market Entry
- 6.5.6 Sustainability & ESG Initiatives
- 6.6 Competitive Strategy Mapping
- 6.6.1 Leader, Challenger, Follower & Niche Classification
- 6.6.2 Pricing Strategy Comparison
- 6.6.3 Channel Strategy Matrix
Note: Strategic developments are included based on their materiality and the availability of reliable information.
Chapter 7. Global E-Paper Display Market – By Distribution Channel
- 7.1 Segment Overview
- 7.1.1 Volume & Revenue Split by Channel ( & 2032)
- 7.1.2 Channel Mix Evolution (2032)
Chapter 8. Regional Market Analysis – Global Overview
- 8.1 Global Regional Overview
- 8.1.1 Regional Volume Share
- 8.1.2 Regional Revenue Share
- 8.1.3 Regional Volume by Region
- 8.1.4 Regional Revenue by Region
- 8.1.5 Regional Forecast Through 2032
- 8.2 Cross-Regional Segment Analysis
- 8.2.1 By Distribution Channel
- 8.2.2 By Brand/Price Tier
Chapter 9. North America E-Paper Display Market
- 9.1 United States
- 9.2 Canada
- 9.3 Mexico
Chapter 10. Europe E-Paper Display Market
- 10.1 Germany
- 10.2 France
- 10.3 Italy
- 10.4 United Kingdom
- 10.5 Spain
- 10.6 Poland
- 10.7 Russia
- 10.8 Netherlands
- 10.9 Belgium
- 10.10 Sweden
- 10.11 Denmark
- 10.12 Norway
- 10.13 Rest of Europe
Chapter 11. Asia Pacific E-Paper Display Market
- 11.1 China
- 11.2 India
- 11.3 Japan
- 11.4 South Korea
- 11.5 Thailand
- 11.6 Indonesia
- 11.7 Vietnam
- 11.8 Malaysia
- 11.9 Australia
- 11.10 Rest of Asia Pacific
Chapter 12. Latin America E-Paper Display Market
- 12.1 Brazil
- 12.2 Argentina
- 12.3 Colombia
- 12.4 Chile
- 12.5 Rest of Latin America
Chapter 13. Middle East E-Paper Display Market
- 13.1 Saudi Arabia
- 13.2 United Arab Emirates
- 13.3 Turkey
- 13.4 Israel
- 13.5 Iran
- 13.6 Rest of the Middle East
Chapter 14. Africa E-Paper Display Market
- 14.1 South Africa
- 14.2 Egypt
- 14.3 Nigeria
- 14.4 Morocco
- 14.5 Rest of Africa
Chapter 15. E-Paper Display Company Profiles
- 15.1 [Company 01]
- 15.1.1 Company Overview
- 15.1.2 Key Management Personnel
- 15.1.3 Products & Services Portfolio
- 15.1.4 Financial Performance
- 15.1.5 Key Market Focus & Geographic Presence
- 15.1.6 Recent Developments & Strategic Initiatives
Note: The company profile list is preliminary and may change based on research findings, market developments, data availability, and client requirements.
Chapter 16. Appendices
- Appendix A – List of Abbreviations & Acronyms
- Appendix B – Industry Classification Code Reference – Full Series
- Appendix C – Production & Capacity Data Tables
- Appendix D – End-Use & Demand Base Tables
- Appendix E – Consumption & Replacement Rate Assumptions
- Appendix F – ASP Reference Tables
- Appendix G – Manufacturing & Facility Database
- Appendix H – Import-Export Data Tables
- Appendix I – Regulatory Summary Tables
- Appendix J – Primary Research Participant List (Anonymized)
- Appendix K – Primary Research Questionnaire Framework
- Appendix L – Data Sources & Bibliography
- Appendix M – Market Size Divergence & Source Comparison
Chapter 17. Research Methodology
- 17.1 Research Framework & Philosophy
- 17.2 Secondary Research – Sources, Hierarchy & Data Extraction
- 17.3 Data Modeling – Bottom-Up & Top-Down Market Sizing
- 17.4 Primary Research – Stakeholder Framework, LOI & Sample Sizes
- 17.5 Forecast Methodology – Regression, Scenario & Sensitivity Analysis
- 17.6 Quality Control – Four-Layer Validation Framework
- 17.7 Limitations & Standard Assumptions
- 17.8 Disclaimer
