
Market Overview:
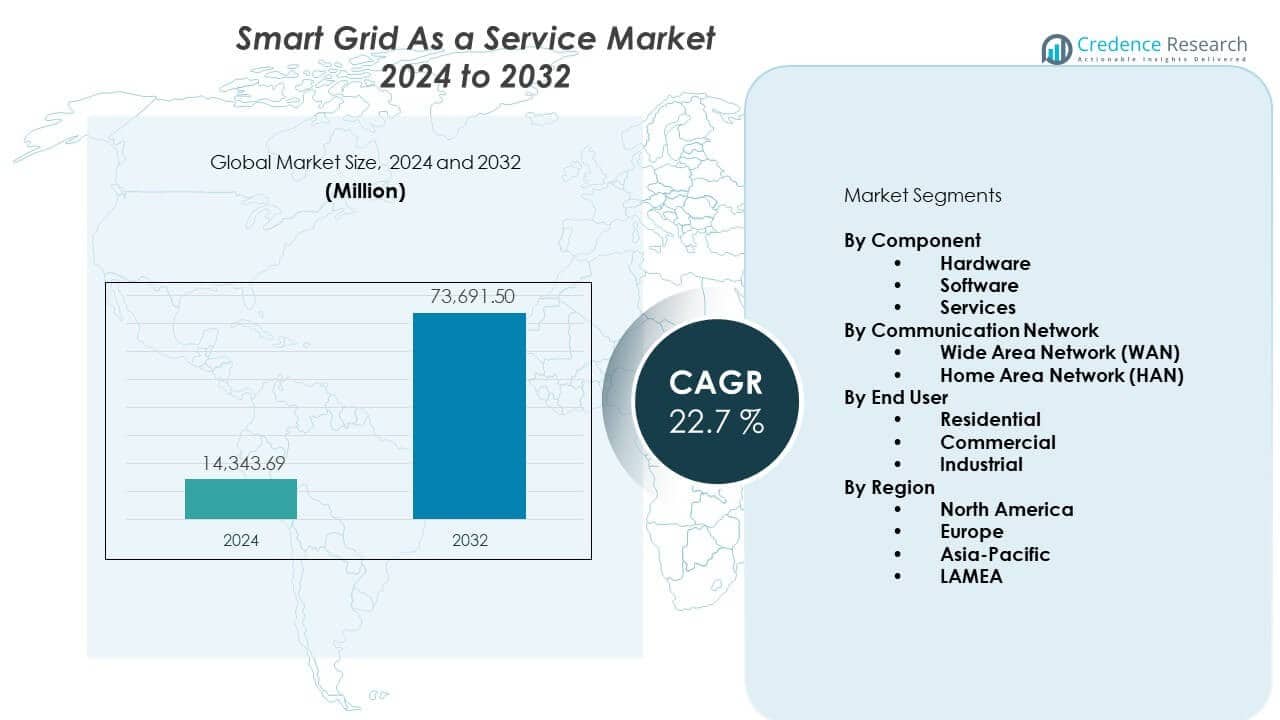
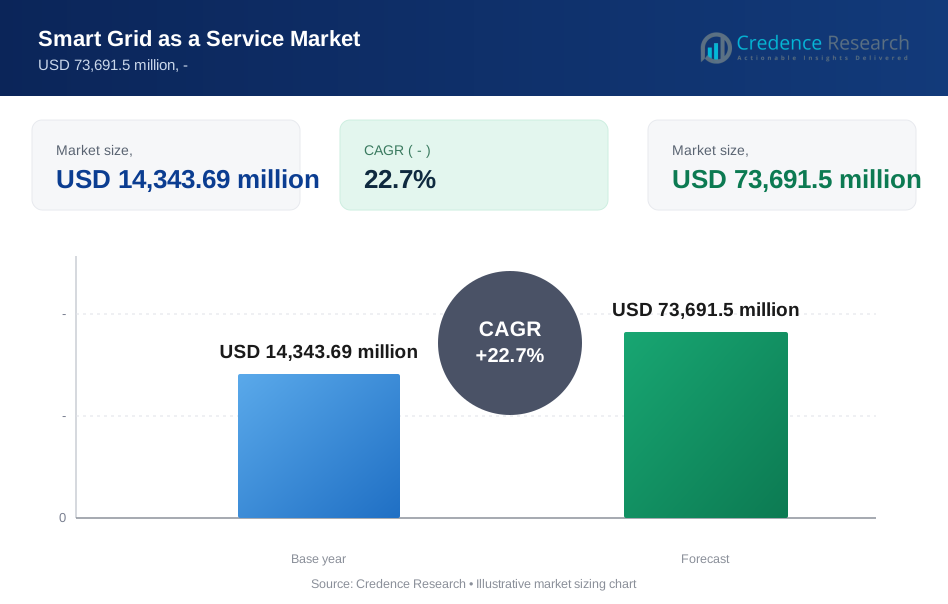
The Smart Grid as a Service Market is projected to grow from USD 14,343.69 million in 2024 to an estimated USD 73,691.5 million by 2032, with a CAGR of 22.7% from 2024 to 2032. This expansion reflects rising adoption of digital grid platforms and cloud-based management services across utilities. Strong focus on reliability and grid modernization supports steady demand across both mature and developing economies.
| REPORT ATTRIBUTE | DETAILS |
|---|---|
| Historical Period | 2020-2023 |
| Base Year | 2024 |
| Forecast Period | 2025-2032 |
| Smart Grid as a Service Market Size 2024 | USD 14,343.69 Million |
| Smart Grid as a Service Market, CAGR | 22.7% |
| Smart Grid as a Service Market Size 2032 | USD 73,691.5 Million |
Growing need for real-time monitoring, load balancing, and predictive maintenance drives adoption across utilities. Companies embrace smart grid services to improve outage response and enhance energy visibility across networks. Cloud-enabled platforms help operators reduce infrastructure costs and deploy updates faster. Strong regulatory support for clean energy integration also strengthens demand for flexible grid systems. Rising use of distributed energy resources pushes utilities to adopt smarter control systems. The shift toward digital billing and automated metering adds further momentum. High focus on energy efficiency across commercial and residential sectors expands the customer base for advanced grid services.
North America leads due to strong investment in grid digitalization and advanced utility infrastructure. Europe follows with high adoption supported by sustainability targets and renewable integration goals. Asia Pacific emerges as the fastest-growing region driven by rapid urban expansion, rising electricity needs, and smart city programs. Countries such as China, India, and South Korea invest heavily in digital grid upgrades to support renewable energy growth. Latin America gains pace with modernization efforts and government-backed smart metering rollouts. The Middle East and Africa show rising demand due to grid reliability challenges and new infrastructure projects.
Market Insights:
- The Smart grid as a service market was valued at USD 14,343.69 million in 2024 and is projected to reach USD 73,691.5 million by 2032, expanding at a CAGR of 22.7%.
- North America leads with about 35% share due to strong digital grid investments; Europe follows with nearly 28% driven by renewable integration; Asia-Pacific holds about 30% supported by large-scale modernization programs.
- Asia-Pacific stands as the fastest-growing region with around 30% share, driven by urban expansion, rising electricity demand, and rapid renewable deployment.
- Software dominates the component segmentation with the highest share due to its critical role in analytics and automation.
- WAN leads the communication network segmentation with the largest share, supported by its ability to manage high-volume grid communication across large utility networks.
Market Drivers:
Rising Need for Grid Modernization
The Smart Grid as a Service market grows due to strong demand for modern grid infrastructure across utilities. Governments push operators to upgrade legacy systems that limit network stability and energy insights. Digital platforms help teams monitor loads, detect outages, and coordinate assets with higher precision. It enables distributed energy resources to integrate smoothly and avoid power quality issues. Adoption grows as utilities seek to reduce downtime and improve compliance with energy rules. Cloud-enabled services cut hardware costs and reduce the need for on-site upgrades. Utilities prefer scalable systems that adapt to rising demand peaks. Strong focus on real-time decision support strengthens interest in advanced service-based grid models.
- For instance, Siemens Energy expanded manufacturing and service operations in Charlotte, North Carolina for large-power transformers, creating about 600 direct jobs and 300 construction roles. Digital platforms help teams monitor loads, detect outages, and coordinate assets with higher precision.
Growth in Advanced Metering and Automation
Advanced metering systems raise the appeal of smart grid service models that improve visibility and billing accuracy. Operators use smart meters to understand consumption patterns and manage network stress points. Automation tools help utilities reduce manual intervention and complete field operations faster. It supports seamless device coordination across wide distribution zones. Energy theft reduction improves revenue assurance and grid stability. Real-time usage alerts support better load control and peak demand management. Utilities adopt predictive tools to avoid equipment strain during high-load hours. Wider deployment of smart metering accelerates service adoption across urban and semi-urban regions.
- For instance, Schneider Electric SE’s manufacturing plant in India has a capacity of 17 million meters per annum and has supplied over 70 million electricity meters including smart meters. Automation tools help utilities reduce manual intervention and complete field operations faster.
Shift Toward Renewable Energy Integration
Increasing renewable energy deployment expands the need for digital coordination and flexible grid management. Operators depend on cloud-based tools to balance intermittent sources like wind and solar. It supports smoother dispatching and helps maintain frequency stability across varied demand zones. Utilities use forecasting tools to predict renewable output and reduce imbalance penalties. Distributed generation growth pushes demand for dynamic connection and monitoring frameworks. Service-based platforms help operators integrate storage units to stabilize voltage and reduce curtailment. Clean energy policies push utilities to upgrade management layers that handle diverse energy portfolios. Rising sustainability goals drive stronger investment in service-driven grid operations.
Growing Demand for Cost-Efficient Utility Operations
The Smart Grid as a Service market benefits from rising need to cut capital expenses across utilities. Cloud models reduce hardware loads and speed deployment cycles. It allows smaller operators to access advanced tools without large upfront investment. Predictive analytics helps reduce equipment failure rates and maintenance expenses. Workforce efficiency improves with automated workflows and remote diagnostics. Utilities adopt scalable subscription models to match operational budgets. Service platforms support long-term modernization plans without large infrastructure shifts. Rising electricity demand pushes operators to rely on flexible and cost-efficient digital systems.
Market Trends:
Expansion of AI-Driven Grid Intelligence
AI-enabled platforms transform decision-making across the Smart Grid as a Service market by enhancing predictive accuracy and operational speed. Utilities use AI engines to detect anomalies before failures occur. It improves outage prevention and helps lower restoration time across critical areas. Machine learning models optimize load curves and supply distribution under varied conditions. Operators use AI for fraud detection and improved meter validation. AI-powered forecasting boosts renewable energy coordination and storage dispatching. Advanced optimization apps guide utilities toward more efficient scheduling. The trend strengthens as operators seek stronger automation layers.
- For instance, IBM Corporation found that 94 % of utility executives expect AI to contribute significantly to revenue growth in the next three years; many report a 10 % improvement in service reliability, grid uptime, and energy efficiency. Machine-learning models optimize load curves and supply distribution under varied conditions.
Rise of Edge Computing for Real-Time Control
Edge computing adoption accelerates due to the need for quick decision cycles at distribution and substation levels. Local data processing helps reduce latency and supports mission-critical load coordination. It improves voltage optimization and accelerates device response across field networks. Utilities use edge nodes to reduce bandwidth pressure on cloud layers. Enhanced cybersecurity features add protection for distributed systems. Edge tools improve service availability during network disruptions. Operators integrate edge units to support high-speed DER orchestration. The trend expands with increasing grid digitalization across high-density regions.
- For instance, Siemens Energy reported that adding sensors and analytics on a 400 kV line enabled about 15 % more capacity without major equipment upgrades. It improves voltage optimization and accelerates device response across field networks. Utilities u
Growing Focus on Cybersecurity and Zero-Trust Architecture
Security modernization becomes central as digital grid layers expand and cyber threats increase. Operators shift toward zero-trust models to safeguard critical assets. It helps verify identities, control access, and protect communication channels. Utilities strengthen encryption to secure device operations across connected networks. Real-time threat monitoring reduces breach risks and protects sensitive user data. Companies adopt secure cloud hosting to comply with energy-sector standards. Security audits and automated patching gain traction across service platforms. Rising attack sophistication pushes utilities toward continuous risk mitigation.
Integration of EV Infrastructure with Digital Grid Services
Electric vehicle growth raises demand for digital grid services that manage charging loads. Operators rely on smart tools to avoid peak stress on local transformers. It helps balance EV charging with residential and commercial usage patterns. Utilities use digital platforms to map demand hotspots and plan station placement. Service models support dynamic pricing and load shifting for EV fleets. Advanced analytics guide operators in planning future charging corridors. Integration improves grid resilience and energy service reliability. EV expansion strengthens the long-term value of digital grid service systems.
Market Challenges Analysis:
High Integration Complexity for Legacy Systems
The Smart Grid as a Service market faces challenges due to complex legacy system integration across utilities. Many operators rely on outdated equipment that lacks digital interfaces. It increases deployment time and raises configuration costs during upgrades. Fragmented infrastructure makes device coordination difficult across distribution zones. Utilities struggle to align old communication layers with modern applications. Data migration requires high accuracy to avoid operational errors. Workforce skill gaps delay integration and reduce efficiency. Slow modernization cycles limit rapid adoption in several developing regions.
Rising Cybersecurity Threats and Compliance Pressure
Cybersecurity risks create major hurdles for utilities shifting to digital platforms. Threat actors target grid systems due to their critical importance. It forces operators to adopt multi-layer protection and strict access control models. Compliance rules demand continuous monitoring and verified audit trails. Utilities manage high costs linked to identity management, encryption, and threat analytics. Attack surface expansion increases as more IoT devices connect to the grid. Service interruptions caused by cyber threats affect user trust. The challenge grows as utilities expand digital layers to support growing energy demand.
Market Opportunities:
Expansion of Distributed Energy Resource Management
The Smart Grid as a Service market creates strong opportunities with rising distributed energy resources across developed and emerging nations. It helps utilities manage rooftop solar, microgrids, and storage units with higher efficiency. Real-time orchestration strengthens grid flexibility during peak shifts. Operators use advanced dispatching tools to lower curtailment and improve system stability. DER participation in energy markets opens new revenue streams for utilities. Scalable service platforms support new regulatory models for localized trading. Faster urban expansion pushes demand for modular grid control services.
Growth in Smart City and Digital Utility Programs
Smart city plans create wide opportunities due to increased focus on digital infrastructure. It supports deployment of smart meters, automated substations, and sensor networks. Utilities partner with technology firms to expand connected-grid ecosystems. Government-backed modernization programs speed adoption across high-growth regions. Real-time data analytics help cities improve energy planning and disaster response. Service-based architectures reduce capital strain for municipal utilities. Rising population density drives interest in stable and intelligent energy systems.
Market Segmentation Analysis:
By Component
The Smart grid as a service market shows strong adoption across hardware, software, and services as utilities shift toward digital operating models. Hardware demand grows due to the need for advanced meters, sensors, and communication devices that support real-time monitoring. Software remains the leading segment because operators rely on analytics, automation, and grid optimization tools. It enables scalable deployment and remote control functions that improve system reliability. Service offerings expand with subscription-based models that reduce capital strain. Managed services gain traction among utilities with limited in-house technical capacity. The combined growth across all components strengthens long-term modernization plans.
- For instance, GE’s analytics and Predix-based services helped utilities scale remote monitoring and diagnostics across plants and grid assets. It enables scalable deployment and remote control functions that improve system reliability. Service offerings expand with subscription-based models that reduce capital strain.
By Communication Network
Wide Area Network (WAN) leads due to its ability to support large-scale data transfers across transmission and distribution assets. Utilities depend on WAN systems for outage management, load balancing, and predictive monitoring. It enables secure communication across diverse nodes in complex grid structures. Home Area Network (HAN) grows steadily with rising smart meter use and increased residential energy automation. HAN supports consumer participation in demand response programs and distributed resource coordination. Integration between WAN and HAN enhances visibility across all endpoints. Utilities favor hybrid communication models for higher operational flexibility.
- For instance, Schneider Electric’s smart-meter platform includes HAN device asset management and field‐service logistics for large-scale deployments. HAN supports consumer participation in demand-response programs and distributed resource coordination.
By End User
Residential demand rises due to growing interest in smart metering, energy automation, and consumption insights. Commercial users adopt digital grid tools to reduce energy waste and maintain operational continuity. Industrial facilities rely on service platforms to manage peak loads, reduce downtime, and protect critical infrastructure. It supports fast decision cycles and precise energy control across high-load sites. Utilities tailor service tiers to meet distinct end-user needs. The expanding user base reinforces strong market scalability.
Segmentation:
By Component
- Hardware
- Software
- Services
By Communication Network
- Wide Area Network (WAN)
- Home Area Network (HAN)
By End User
- Residential
- Commercial
- Industrial
By Region
- North America
- U.S.
- Canada
- Mexico
- Europe
- Germany
- France
- U.K.
- Italy
- Spain
- Rest of Europe
- Asia Pacific
- China
- Japan
- India
- South Korea
- South-east Asia
- Rest of Asia Pacific
- Latin America
- Brazil
- Argentina
- Rest of Latin America
- Middle East & Africa
- GCC Countries
- South Africa
- Rest of the Middle East and Africa
Regional Analysis:
North America
North America leads the Smart grid as a service market with around 35% share supported by strong investments in grid digitalization. The region benefits from early adoption of advanced metering and large-scale automation programs. It leverages strong utility spending on predictive analytics and cloud-based coordination tools. High penetration of distributed energy resources drives the need for flexible service platforms. It supports real-time monitoring and faster outage response across diverse grid networks. Regulatory pressure for resilience upgrades strengthens demand for digital services. The presence of major technology vendors accelerates new deployment cycles.
Europe
Europe holds roughly 28% share driven by ambitious renewable energy targets and grid modernization mandates. The market grows as utilities upgrade communication layers to support real-time coordination with distributed power assets. It benefits from strong investments in smart metering programs across both Western and Northern Europe. Cross-border energy trade increases the need for advanced data management systems. Operators adopt service models to reduce capital load and improve regulatory compliance. Cybersecurity upgrades gain priority as digital layers expand. Europe advances its long-term sustainability goals with wider use of cloud-based monitoring systems.
Asia-Pacific and LAMEA
Asia-Pacific captures nearly 30% share, while LAMEA accounts for about 7% of the Smart grid as a service market. APAC grows rapidly as countries expand urban infrastructure and deploy large renewable energy fleets. It uses digital tools to manage rising electricity demand and grid congestion. Governments support modernization to improve reliability in fast-growing economies. LAMEA shows steady progress with targeted investments in smart metering and substation automation. It focuses on improving transparency and reducing system losses. Both regions strengthen long-term digital transformation with scalable service-based grid platforms.
Key Player Analysis:
- Siemens AG
- Schneider Electric SE
- General Electric (GE)
- IBM Corporation
- Honeywell International Inc.
- Cisco Systems, Inc.
- Itron Inc.
- Oracle Corporation
- Eaton Corporation
- Landis+Gyr AG
- S&C Electric Company
- Wipro Limited
- ABB Group
Competitive Analysis:
The Smart grid as a service market features strong competition among global industrial, IT, and metering vendors. Large players such as Siemens, Schneider Electric, ABB, GE, Cisco, Oracle, and IBM compete on software depth, analytics, and integration strength. It also includes specialist firms such as Landis+Gyr, Itron, S&C Electric, Eaton, Honeywell, and Wipro that focus on metering, grid edge, and managed services. Vendors differentiate through SaaS delivery models, cybersecure platforms, and AI-enabled grid optimization. Partnerships with utilities and cloud providers strengthen long-term contracts and recurring revenue streams. Many players expand portfolios with DER management, demand response, and advanced metering services to lock in multi-year agreements. Regional strength varies, with European and North American firms leading high-value projects, while Asia-Pacific vendors target fast-growth deployments.
Recent Developments:
- In November 2025, Siemens AG announced a strategic partnership with IFS to deliver integrated AI-driven solutions for energy, utilities, and infrastructure operators. This collaboration aims to revolutionize grid planning, asset management, and field service optimization by combining Siemens' grid expertise with IFS's Industrial AI platform, enabling smarter investment decisions and autonomous grid operations (November 12, 2025).
- In another update, Siemens AG launched the Gridscale X Flexibility Manager software in November 2025 to help distribution system operators (DSOs) unlock existing grid capacity, forecast congestion, and advance autonomous grid management. This tool supports energy transition and grid reliability improvements (November 21, 2025).
- Siemens Energy plans to invest €2 billion (approximately $2.3 billion) by 2028 in expanding and upgrading its global network of transformer and switchgear manufacturing facilities, strengthening the power grid infrastructure worldwide (November 20, 2025).
Report Coverage:
The research report offers an in-depth analysis based on Component, Communication Network, End User, and Region segments. It details leading market players, providing an overview of their business, product offerings, investments, revenue streams, and key applications. Additionally, the report includes insights into the competitive environment, SWOT analysis, current market trends, as well as the primary drivers and constraints. Furthermore, it discusses various factors that have driven market expansion in recent years. The report also explores market dynamics, regulatory scenarios, and technological advancements that are shaping the industry. It assesses the impact of external factors and global economic changes on market growth. Lastly, it provides strategic recommendations for new entrants and established companies to navigate the complexities of the market.
Future Outlook:
- Utilities will expand SaaS adoption to reduce capital expenditure and improve scalability.
- AI and analytics will play a larger role in outage prevention and load optimization.
- Distributed energy resources will drive demand for flexible, interoperable service platforms.
- Edge intelligence will support faster local decision making at substations and feeders.
- Cybersecurity requirements will tighten and favor vendors with zero-trust architectures.
- Integration with electric vehicle infrastructure will create new revenue models for providers.
- Smart city initiatives will accelerate deployment of metering and grid automation services.
- Cloud-native architectures will replace legacy on-premise management systems for many utilities.
- Partnerships between utilities, OEMs, and cloud hyperscalers will deepen across regions.
- Regulatory focus on resilience and decarbonization will support long-term service contracts.
Request a Free Sample
Fill in your details and we'll send you a free sample report.
- Sample data tables & charts
- Research methodology
Need a Custom Version of This Report?
Tailor the scope, geography, or segments to your exact requirements.
- Custom geography or segment scope
- Direct access to our analyst team
Frequently Asked Questions
What is the current market size for Smart grid as a service market, and what is its projected size in 2032?
At what Compound Annual Growth Rate is the Smart grid as a service market projected to grow between 2024 and 2032?
Which Smart grid as a service market segment held the largest share in 2024?
What are the primary factors fueling the growth of the Smart grid as a service market?
Who are the leading companies in the Smart grid as a service market?
Which region commanded the largest share of the Smart grid as a service market in 2024?
Table of Content
Chapter 1. Report Introduction
- 1.1 Report Description & Purpose
- 1.1.1 Report Title & Market Definition
- 1.1.2 Unique Selling Propositions (USP) & Key Differentiators
- 1.1.3 Value Proposition for Stakeholders
- 1.2 Research Objectives
- 1.2.1 Market Sizing Objectives (Volume & Revenue) (Volume Where Applicable)
- 1.2.2 Segmentation Objectives
- 1.2.3 Competitive Intelligence Objectives
- 1.2.4 Forecast & Scenario Objectives
- 1.3 Report Scope
- 1.3.1 Smart Grid as a Service Scope – Segments & Subsegments Covered
- 1.3.2 Geographic Scope – Regions & Countries Covered
- 1.3.3 Historical Period, Base Year & Forecast Period (the historical period; forecast to the forecast period)
- 1.3.4 Inclusions & Exclusions
- 1.4 Industry Classification & Applicable Codes
- 1.5 Currency, Measurement Units & Valuation Basis
- 1.6 Target Stakeholders
- 1.7 Limitations & Assumptions
Chapter 2. Executive Summary
- 2.1 Global Smart Grid as a Service Market Snapshot
- 2.1.1 Market Size – Historical (the historical period) & Forecast (the forecast period) (base year: USD 14,343.69 million → forecast year: USD 73,691.5 million)
- 2.1.2 Volume & Revenue – Global Totals (Volume Where Applicable)
- 2.1.3 Key Market Highlights – Top Five Facts
- 2.2 Smart Grid as a Service Market Segmentation Snapshot
- 2.2.1 Market Split by Region – vs.
- 2.3 Competitive Snapshot
- 2.3.1 Top 10 Players by Revenue Share –
- 2.3.2 Top 10 Players by Volume Share – (Volume Where Applicable)
- 2.3.3 Recent Strategic Developments (18-Month Summary)
- 2.4 Key Investment Highlights & Strategic Conclusions
Chapter 3. Smart Grid as a Service Market Dynamics & Industry Analysis
- 3.1 Market Overview & Context
- 3.1.1 Smart Grid as a Service Market Position in the Broader Industry Value Chain
- 3.1.2 Demand Structure & Purchasing Dynamics
- 3.1.3 Market Maturity & Development Stage by Region
- 3.2 Smart Grid as a Service Market Drivers
- 3.3 Smart Grid as a Service Market Restraints & Challenges
- 3.4 Smart Grid as a Service Market Opportunities
- 3.5 Porter's Five Forces Analysis
- 3.5.1 Threat of New Entrants
- 3.5.2 Bargaining Power of Suppliers
- 3.5.3 Bargaining Power of Buyers
- 3.5.4 Threat of Substitutes
- 3.5.5 Competitive Rivalry – Intensity Assessment
- 3.6 Smart Grid as a Service Value Chain Analysis
- 3.6.1 Upstream – Key Inputs, Resources & Suppliers
- 3.6.1.1 Key Input/Resource 1
- 3.6.1.2 Key Input/Resource 2
- 3.6.1.3 Key Input/Resource 3
- 3.6.2 Midstream – Core Operations & Value Creation
- 3.6.2.1 Operating Model & Process Overview
- 3.6.2.2 Key Operating Locations & Capabilities by Company
- 3.6.3 Downstream – Market Channels & End Users
- 3.6.3.1 Direct Sales & Customer Engagement Channels
- 3.6.3.2 Indirect Sales, Intermediaries & Partner Channels
- 3.6.4 Value Chain Profitability Analysis
- 3.6.1 Upstream – Key Inputs, Resources & Suppliers
- 3.7 PESTEL Analysis
- 3.7.1 Political Factors
- 3.7.2 Economic Factors
- 3.7.3 Social Factors
- 3.7.4 Technological Factors
- 3.7.5 Environmental Factors
- 3.7.6 Legal Factors
- 3.8 Smart Grid as a Service Supply Chain Analysis
- 3.8.1 Critical Input & Resource Availability Risk Assessment
- 3.8.2 Supplier & Operational Concentration Risk (Geographic Exposure)
- 3.8.3 Supply & Service Disruption Impact Analysis
- 3.9 Regulatory & Policy Landscape
Note: The regulatory and policy landscape section covers regulations based on their applicability to the market, Smart Grid as a Service category, geography, and scope of the study. Only regulatory frameworks with a material impact on operations, compliance, trade, sustainability, or market access are analyzed in detail.
Chapter 4. Key Investment Pockets & Opportunity Analysis
- 4.1 Smart Grid as a Service Market Attractiveness Analysis
- 4.1.1 By Region – Investment Attractiveness Matrix (Market Size × CAGR)
- 4.2 Absolute Revenue Growth Opportunity
- 4.2.1 By Region – Absolute Revenue Growth Through the forecast period
- 4.3 Incremental Demand Opportunity
- 4.3.1 By Region – Incremental Demand Through the forecast period
- 4.3.2 Segment – Incremental Demand
- 4.4 Emerging Submarket Opportunity Deep Dive (Subject to Applicability)
- 4.5 Priority Market Opportunity Scorecards
- 4.5.1 United States
- 4.5.2 Europe
- 4.5.3 Asia
- 4.5.4 Middle East & Africa
Note: Priority market opportunity scorecards reflect the geographic scope and strategic relevance of the study. Listed markets are indicative and may be adapted to the industry.
Chapter 5. Smart Grid as a Service Cross-Border Trade & Market Access Analysis
- 5.1 International Trade & Cross-Border Activity Overview
- 5.1.1 Global Export Value by Country (the historical period)
- 5.1.2 Global Export Volume by Country (the historical period) (Volume Where Applicable)
- 5.1.3 Global Import Value by Country (the historical period)
- 5.1.4 Global Import Volume by Country (the historical period) (Volume Where Applicable)
- 5.1.5 Net Trade Balance by Country (the historical period)
- 5.2 Export Analysis – Segment
- 5.2.1 Category 1 (Applicable Classification Code)
- 5.2.2 Category 2 (Applicable Classification Code)
- 5.2.3 Category 3 (Applicable Classification Code)
- 5.2.4 Category 4 (Applicable Classification Code)
- 5.2.5 Category 5 (Applicable Classification Code)
- 5.3 Import Analysis – Segment
- 5.3.1 Category 1 (Applicable Classification Code)
- 5.3.2 Category 2 (Applicable Classification Code)
- 5.3.3 Category 3 (Applicable Classification Code)
- 5.3.4 Category 4 (Applicable Classification Code)
- 5.3.5 Category 5 (Applicable Classification Code)
- 5.4 Cross-Border Pricing & Transaction Benchmarks
- 5.4.1 Export Pricing – Segment & Country
- 5.4.2 Import Pricing – Segment & Source Country
- 5.4.3 Price Trends (the historical period)
- 5.5 Key Cross-Border Trade & Delivery Routes
- 5.5.1 Cross-Border Trade/Delivery Route 1
- 5.5.2 Cross-Border Trade/Delivery Route 2
- 5.5.3 Cross-Border Trade/Delivery Route 3
- 5.5.4 Cross-Border Trade/Delivery Route 4
- 5.5.5 Cross-Border Trade/Delivery Route 5
- 5.6 Trade Policy & Market Access Impact Assessment
- 5.6.1 Tariff & Non-Tariff Barriers
- 5.6.2 Regional Trade & Economic Integration Frameworks
- 5.6.3 Bilateral & Multilateral Trade Agreements
- 5.6.4 Cross-Border Operating, Licensing & Localization Requirements
Note: This chapter applies where cross-border trade or delivery is relevant to Smart Grid as a Service. Goods, services, and digital offerings are assessed using applicable classifications and transaction measures. Import-export volumes, trade balances, and route analyses are included only where meaningful to the market.
Chapter 6. Competitive Landscape & Company Benchmarking
- 6.1 Smart Grid as a Service Market Concentration & Structure
- 6.1.1 Herfindahl-Hirschman Index (HHI) – vs.
- 6.1.2 Leading, Mid-Sized & Emerging Player Structure
- 6.1.3 Global, Regional & Local Player Dynamics
- 6.2 Smart Grid as a Service Market Share Analysis –
- 6.2.1 Global Revenue Share by Company
- 6.2.2 Global Volume Share by Company (Volume Where Applicable)
- 6.2.3 Regional Revenue Share
- 6.2.4 Market Share Evolution ( vs. )
- 6.2.5 Company Market Share by Key Segment
- 6.2.6 Company Market Share by Customer Group
- 6.3 Operating Scale, Capacity & Infrastructure Analysis
- 6.3.1 Global Operating Scale & Supply Capacity
- 6.3.2 Resource Utilization & Operating Efficiency
- 6.3.3 Output, Service Delivery & Activity Metrics
- 6.3.4 Operating Footprint & Infrastructure Map
- 6.3.5 Planned Operational & Capacity Expansion
- 6.4 Smart Grid as a Service Competitive Benchmarking Matrix
- 6.4.1 Revenue, Growth, Profitability & Operating Metric Comparison
- 6.4.2 Channel Revenue Mix
- 6.4.3 Geographic Revenue Exposure
- 6.4.4 R&D Intensity
- 6.4.5 Sustainability Maturity
- 6.5 Strategic Developments in Smart Grid as a Service (Last 24 Months)
- 6.5.1 Mergers, Acquisitions & Divestments
- 6.5.2 New Products, Services & Solutions in Smart Grid as a Service
- 6.5.3 Operational & Infrastructure Expansions
- 6.5.4 Strategic Alliances, Joint Ventures & Partnerships
- 6.5.5 Distribution Expansion & Market Entry
- 6.5.6 Sustainability & ESG Initiatives
- 6.6 Competitive Strategy Mapping
- 6.6.1 Leader, Challenger, Follower & Niche Classification
- 6.6.2 Pricing Strategy Comparison
- 6.6.3 Channel Strategy Matrix
Note: Strategic developments are included based on their materiality and the availability of reliable information.
Chapter 7. Global Smart Grid as a Service Market – By Sales & Delivery Channel
- 7.1 Segment Overview
- 7.1.1 Volume & Revenue Split by Channel ( & ) (Volume Where Applicable)
- 7.1.2 Channel Mix Evolution (the forecast period)
Chapter 8. Regional Market Analysis – Global Overview
- 8.1 Global Regional Overview
- 8.1.1 Regional Volume Share (Volume Where Applicable)
- 8.1.2 Regional Revenue Share
- 8.1.3 Regional Volume by Region (Volume Where Applicable)
- 8.1.4 Regional Revenue by Region
- 8.1.5 Regional Forecast Through the forecast period
- 8.2 Cross-Regional Segment Analysis
- 8.2.1 By Sales & Delivery Channel
- 8.2.2 By Competitive Positioning & Price Tier
Chapter 9. North America Smart Grid as a Service Market
- 9.1 United States
- 9.2 Canada
- 9.3 Mexico
Chapter 10. Europe Smart Grid as a Service Market
- 10.1 Germany
- 10.2 France
- 10.3 Italy
- 10.4 United Kingdom
- 10.5 Spain
- 10.6 Poland
- 10.7 Russia
- 10.8 Netherlands
- 10.9 Belgium
- 10.10 Sweden
- 10.11 Denmark
- 10.12 Norway
- 10.13 Rest of Europe
Chapter 11. Asia Pacific Smart Grid as a Service Market
- 11.1 China
- 11.2 India
- 11.3 Japan
- 11.4 South Korea
- 11.5 Thailand
- 11.6 Indonesia
- 11.7 Vietnam
- 11.8 Malaysia
- 11.9 Australia
- 11.10 Rest of Asia Pacific
Chapter 12. Latin America Smart Grid as a Service Market
- 12.1 Brazil
- 12.2 Argentina
- 12.3 Colombia
- 12.4 Chile
- 12.5 Rest of Latin America
Chapter 13. Middle East Smart Grid as a Service Market
- 13.1 Saudi Arabia
- 13.2 United Arab Emirates
- 13.3 Turkey
- 13.4 Israel
- 13.5 Iran
- 13.6 Rest of the Middle East
Chapter 14. Africa Smart Grid as a Service Market
- 14.1 South Africa
- 14.2 Egypt
- 14.3 Nigeria
- 14.4 Morocco
- 14.5 Rest of Africa
Chapter 15. Smart Grid as a Service Company Profiles
- 15.1 [Company 01]
- 15.1.1 Company Overview
- 15.1.2 Key Management Personnel
- 15.1.3 Products & Services Portfolio
- 15.1.4 Financial Performance
- 15.1.5 Key Market Focus & Geographic Presence
- 15.1.6 Recent Developments & Strategic Initiatives
Note: The company profile list is preliminary and may change based on research findings, market developments, data availability, and client requirements.
Chapter 16. Appendices
- Appendix A – List of Abbreviations & Acronyms
- Appendix B – Industry Classification Code Reference – Full Series
- Appendix C – Supply, Output & Operating Capacity Data Tables
- Appendix D – End-Use & Demand Base Tables
- Appendix E – Demand, Adoption & Usage Assumptions
- Appendix F – Pricing & Revenue Metric Reference Tables
- Appendix G – Company Operations & Infrastructure Database
- Appendix H – Cross-Border Trade & Activity Data Tables (Where Applicable)
- Appendix I – Regulatory Summary Tables
- Appendix J – Primary Research Participant List (Anonymized)
- Appendix K – Primary Research Questionnaire Framework
- Appendix L – Data Sources & Bibliography
- Appendix M – Market Size Divergence & Source Comparison
Chapter 17. Research Methodology
- 17.1 Research Framework & Philosophy
- 17.2 Secondary Research – Sources, Hierarchy & Data Extraction
- 17.3 Data Modeling – Bottom-Up & Top-Down Market Sizing
- 17.4 Primary Research – Stakeholder Framework, LOI & Sample Sizes
- 17.5 Forecast Methodology – Regression, Scenario & Sensitivity Analysis
- 17.6 Quality Control – Four-Layer Validation Framework
- 17.7 Limitations & Standard Assumptions
- 17.8 Disclaimer
