
| REPORT ATTRIBUTE | DETAILS |
|---|---|
| Historical Period | 2020-2023 |
| Base Year | 2024 |
| Forecast Period | 2025-2032 |
| Wheelchair Accessible Vehicle Converters Market Size 2024 | USD 6,379.3 million |
| Wheelchair Accessible Vehicle Converters Market, CAGR | 6.16% |
| Wheelchair Accessible Vehicle Converters Market Size 2032 | USD 10,260.6 million |
Market Overview
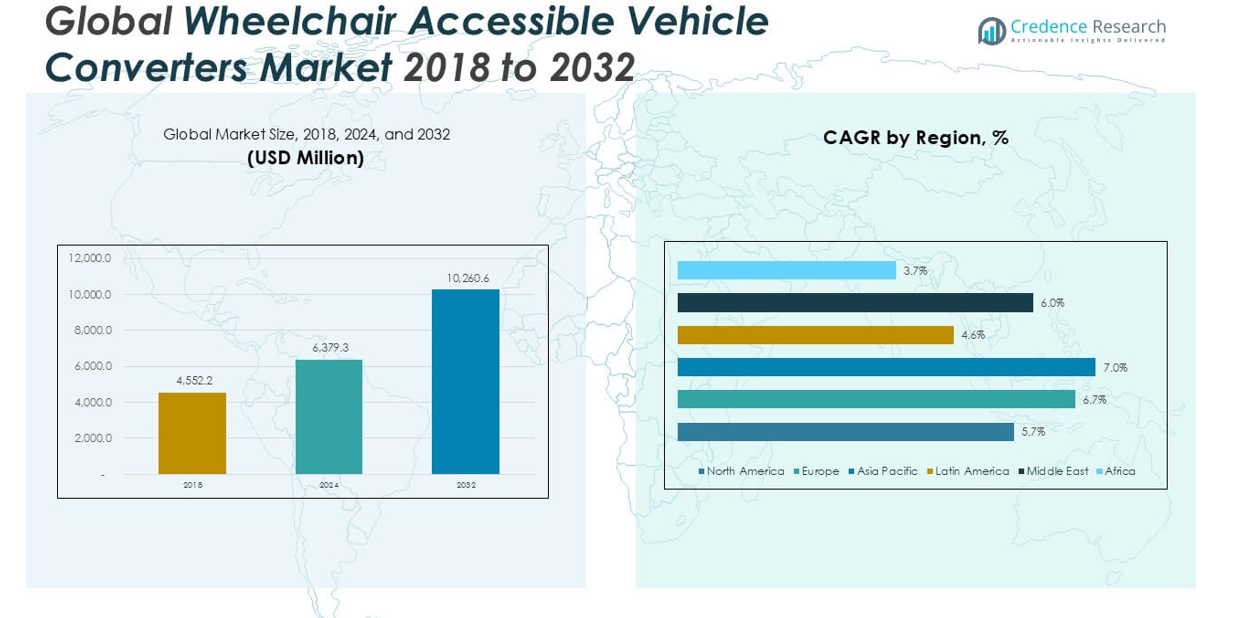
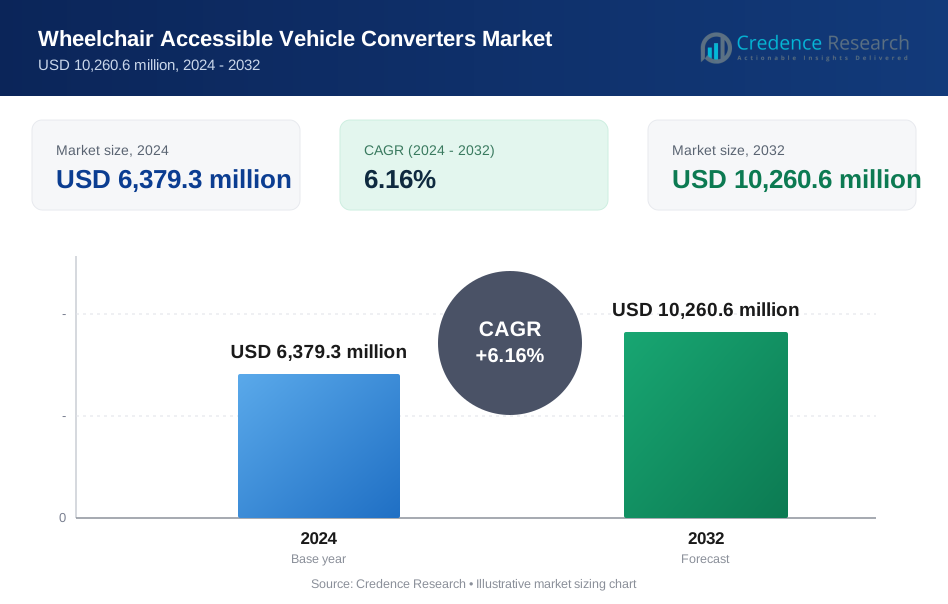
The Wheelchair Accessible Vehicle Converters market size was valued at USD 4,552.2 million in 2018, increased to USD 6,379.3 million in 2024, and is anticipated to reach USD 10,260.6 million by 2032, at a CAGR of 6.16% during the forecast period.
The wheelchair accessible vehicle converters market is led by key players such as Rolex Vans, Kirchoff Mobility, AMS Vans, Vantage Mobility International, and Sirus Automotive Ltd. These companies focus on expanding their product portfolios, incorporating advanced ramp and lift technologies, and strengthening distribution networks to cater to growing demand across both personal and commercial sectors. North America emerged as the dominant region in 2024, accounting for 31.7% of the global market share, driven by strong regulatory frameworks, rising elderly population, and widespread adoption of accessibility standards. Europe and Asia Pacific followed, supported by aging demographics and increasing healthcare infrastructure investment. The competitive landscape remains dynamic, with both global and regional players emphasizing innovation, strategic partnerships, and compliance with evolving mobility regulations to maintain market leadership.
Market Insights
- The wheelchair accessible vehicle converters market was valued at USD 6,379.3 million in 2024 and is expected to reach USD 10,260.6 million by 2032, growing at a CAGR of 6.16% during the forecast period.
- Market growth is primarily driven by an aging global population, increased mobility needs for people with disabilities, and supportive government policies encouraging accessible transportation solutions.
- A key trend shaping the market is the growing demand for electric and hybrid wheelchair accessible vehicles, along with the rising adoption of advanced ramp and lift systems for improved ease of use and safety.
- Leading players such as Rolex Vans, AMS Vans, and Vantage Mobility International focus on innovation, expanded product lines, and strategic partnerships, while regional specialists offer customized solutions with faster turnaround times.
- North America leads the market with a 31.7% share, followed by Europe at 26.9%; among product segments, SUVs dominate due to their larger space and ease of conversion.
Market Segmentation Analysis:
By Product
In 2024, the SUVs segment dominated the wheelchair accessible vehicle converters market, accounting for over 40% of the market share. This dominance is attributed to the increasing demand for personal mobility solutions that offer comfort, style, and off-road capabilities. SUVs provide greater interior space, easier customization, and better handling, making them ideal for conversion. Additionally, technological advancements in vehicle platforms and the rising preference for luxury and mid-range SUVs among differently-abled users have further accelerated segment growth. Manufacturers are increasingly prioritizing SUV-based conversions to meet consumer expectations for performance and accessibility.
- For instance, Vantage Mobility International (VMI) reported converting 9,482 Toyota Sienna Hybrid SUVs in 2023, representing a 33% year-over-year increase compared to 7,124 units in 2022.
By Entry Point
The side entry segment held the largest market share in 2024, capturing around 55% of the overall market. Side entry conversions are preferred due to their compatibility with both drivers and passengers, offering more flexibility and direct access to the front seats. These systems typically allow users to drive from their wheelchairs or transfer with ease, enhancing independence. This configuration is particularly popular in personal vehicles, especially among those who prioritize front-seat access. Enhanced ramp technology and increased availability across vehicle models further support the dominance of this segment.
For instance, BraunAbility integrated its side-entry Power Infloor ramp system into 16,783 converted vehicles globally in 2023, accounting for 87% of its total conversions for the year.
By Mode of Entry
Ramp-based entry systems emerged as the leading mode, commanding approximately 60% of the market share in 2024. Ramps are widely adopted due to their cost-effectiveness, mechanical simplicity, and minimal maintenance requirements. They are especially suitable for minivans and SUVs, making them a preferred choice in personal and family-oriented conversions. The increasing adoption of in-floor and fold-out ramp systems, which offer unobstructed access and improved safety, has strengthened this segment's position. Moreover, regulatory standards encouraging low-floor vehicle designs have facilitated the integration of ramp-based entry systems across diverse vehicle types.
Market Overview
Rising Demand for Mobility Solutions Among Aging Population
The growing elderly population worldwide is driving demand for wheelchair accessible vehicles (WAVs). As mobility limitations increase with age, there is a greater need for transportation solutions that enable independent or assisted travel. Governments and healthcare providers are recognizing this shift, leading to supportive policies and funding for accessible transport. For example, in countries like Japan and Germany, more than 20% of the population is over 65, amplifying market needs. This demographic trend continues to be a primary force propelling the growth of WAV converters globally.
- For instance, AMS Vans reported that in 2023, 6,394 WAVs were sold to individuals aged 65 and above, up from 5,123 units in 2022, reflecting a 24.8% increase in elderly customer adoption.
Favorable Government Regulations and Incentives
Government initiatives aimed at improving transportation accessibility are significantly supporting market growth. Programs offering tax credits, grants, and vehicle modification subsidies make WAVs more affordable for individuals and institutions. In the U.S., the Americans with Disabilities Act (ADA) and similar legislation globally mandate equal access in public and commercial transport, boosting converter demand. These regulatory frameworks not only ensure compliance but also stimulate innovation and adoption by encouraging manufacturers and service providers to expand their offerings.
- For instance, under the UK Motability Scheme, a total of 29,662 wheelchair accessible vehicles were funded between 2018 and 2023, with more than 4,950 units supplied in 2023 alone, predominantly through converters like Brotherwood Automobility and GM Coachwork.
Technological Advancements in Vehicle Conversion Solutions
Technological innovation has enhanced the safety, efficiency, and convenience of vehicle conversion processes. Advanced lift systems, lightweight ramp materials, and automation in boarding controls are increasing user-friendliness and vehicle reliability. For instance, developments in electric in-floor ramps and hydraulic lifts offer smoother operation and reduced effort for users. These innovations are also helping expand the range of vehicles that can be converted, including electric and hybrid models, allowing manufacturers to address a broader customer base.
Key Trends & Opportunities
Shift Toward Electrified Accessible Vehicles
The global move toward sustainable transport is creating opportunities in electric wheelchair accessible vehicle (eWAV) conversions. As OEMs and upfitters explore ways to integrate accessibility into EV platforms, converters are investing in lightweight materials and energy-efficient ramp/lift systems compatible with battery-powered drivetrains. Companies are also collaborating with EV manufacturers to ensure proper space optimization and power management. This trend is opening new revenue streams and aligning the WAV market with global emission reduction goals.
- For instance, in 2023, Sirus Automotive, in collaboration with Stellantis, launched its electric Fiat E-Scudo WAV and successfully delivered 764 converted units in the UK market within 12 months of launch.
Growth of On-Demand Accessible Mobility Services
The rise of ride-hailing and mobility-as-a-service (MaaS) platforms is creating a demand for fleet-based WAV conversions. Companies like Uber and Lyft have launched wheelchair-accessible vehicle services in major cities, prompting fleet operators to invest in reliable and cost-effective conversions. This trend is particularly prominent in urban centers, where demand for accessible, shared transportation is high. It presents a significant opportunity for converters to partner with public and private transport services looking to meet accessibility mandates.
- For instance, in 2023, VMI delivered 1,284 Chrysler Pacifica side-entry WAVs to ride-hailing partners in New York City as part of the Accessible Dispatch Program, a 17.2% increase compared to 1,095 units in 2022.
Key Challenges
High Cost of Conversion and Limited Affordability
Despite rising demand, the high cost associated with vehicle conversion remains a major barrier. Conversion costs can range from USD 10,000 to USD 30,000, depending on the type and complexity, making WAVs unaffordable for many individuals without external financial assistance. Limited insurance coverage or inconsistent government funding in some regions further exacerbates the issue. This affordability gap restricts market penetration, especially in emerging economies where disposable income is lower.
Engineering Constraints Across Diverse Vehicle Platforms
Not all vehicle models are structurally suited for conversion, especially newer electric and compact vehicles with integrated chassis designs. This presents technical challenges for converters in modifying such platforms without compromising safety or warranty terms. Additionally, adapting systems like battery packs, suspension, and floor layouts requires significant R&D investment. These engineering limitations slow the pace of innovation and limit the scalability of WAV solutions across diverse automobile categories.
Regional Analysis
North America
North America held the largest share of the wheelchair accessible vehicle converters market in 2024, accounting for approximately 31.7% of the global market with a value of USD 2,023.89 million, up from USD 1,484.01 million in 2018. The region is anticipated to reach USD 3,135.64 million by 2032, growing at a CAGR of 5.7%. This growth is driven by strong regulatory enforcement, widespread adoption of accessibility norms, and high consumer awareness. The presence of well-established mobility solution providers and increasing healthcare infrastructure investment continue to support market expansion across both personal and commercial transportation sectors.
Europe
Europe captured a market share of 26.9% in 2024, with the wheelchair accessible vehicle converters market rising from USD 1,188.57 million in 2018 to USD 1,717.31 million in 2024. The region is projected to reach USD 2,872.97 million by 2032, growing at a robust CAGR of 6.7%. Demand is fueled by aging demographics, government support programs, and progressive legislation mandating accessible transport. Countries such as Germany, the U.K., and France are witnessing steady conversion adoption across both private and public vehicle fleets. Increased R&D in low-floor designs and side-entry configurations further enhances market opportunities.
Asia Pacific
Asia Pacific accounted for 24.9% of the global market in 2024, with a market value of USD 1,552.91 million, rising from USD 1,051.55 million in 2018. The region is expected to reach USD 2,667.76 million by 2032, registering the highest CAGR of 7.0% among all regions. Growing healthcare investment, expanding geriatric population, and increasing vehicle ownership are key drivers. Government initiatives promoting disability inclusion and improved access to public transport are supporting market penetration in countries like China, Japan, and India. Additionally, the growth of domestic vehicle converters and strategic partnerships with global OEMs are reinforcing regional momentum.
Latin America
In 2024, Latin America represented approximately 9.6% of the global wheelchair accessible vehicle converters market, valued at USD 614.97 million, up from USD 474.34 million in 2018. The market is projected to reach USD 882.41 million by 2032, growing at a CAGR of 4.6%. Brazil and Mexico are leading contributors, supported by improvements in medical mobility solutions and growing awareness of inclusive transport systems. While cost remains a barrier for widespread personal adoption, government programs and NGOs are driving the integration of WAVs into commercial and healthcare transport fleets, creating moderate but steady growth.
Middle East
The Middle East accounted for a market share of 4.6% in 2024, with a market value of USD 294.91 million, rising from USD 212.59 million in 2018. The market is estimated to reach USD 467.88 million by 2032, advancing at a CAGR of 6.0%. Regional governments are increasingly prioritizing healthcare infrastructure and accessible urban transport, particularly in the UAE and Saudi Arabia. Enhanced funding for inclusive mobility and partnerships with international vehicle converters are driving adoption. Demand is particularly strong in commercial sectors such as medical transport services and accessible taxi fleets, offering a supportive environment for future growth.
Africa
Africa represented the smallest share of the market in 2024, holding 2.7% of global revenue with a value of USD 175.34 million, increasing from USD 141.12 million in 2018. The market is expected to reach USD 233.94 million by 2032, growing at a modest CAGR of 3.7%. Growth is constrained by economic limitations, lack of regulatory enforcement, and limited public infrastructure for accessibility. However, rising advocacy for disability rights and international support programs are slowly encouraging the adoption of wheelchair accessible vehicles, particularly in South Africa and parts of North Africa, where urban mobility initiatives are gaining traction.
Market Segmentations:
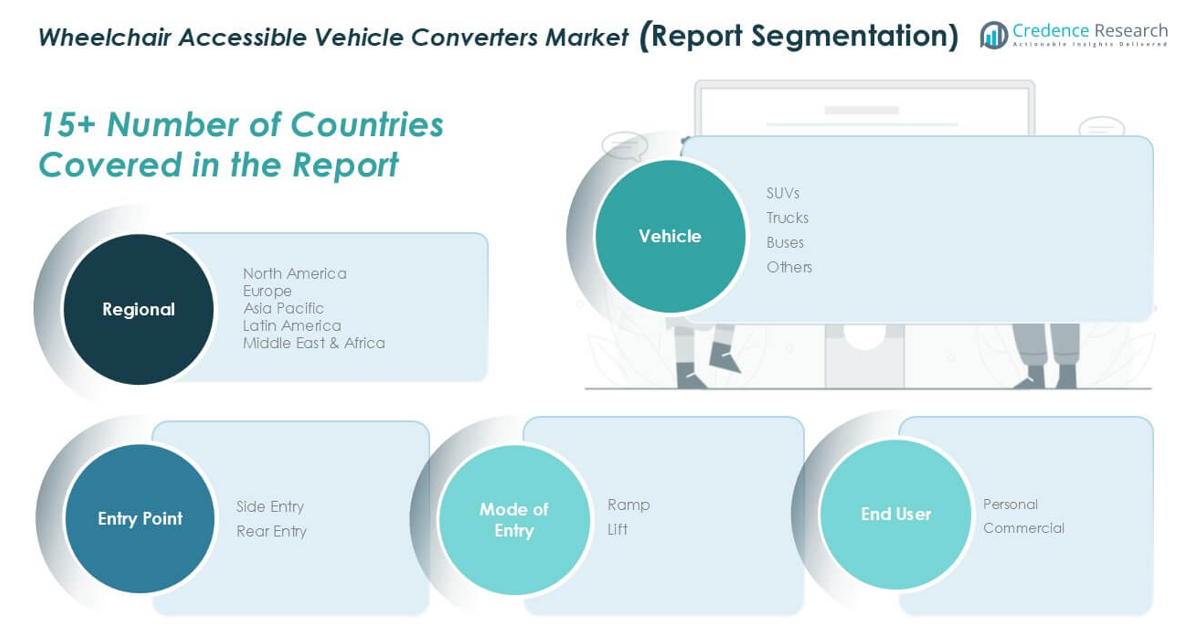
By Product
- SUVs
- Trucks
- Buses
- Others
By Entry Point
- Side Entry
- Rear Entry
By Mode of Entry
- Ramp
- Lift
By End User
- Personal
- Commercial
By Geography:
- North America
- U.S.
- Canada
- Mexico
- Europe
- Germany
- France
- U.K.
- Italy
- Spain
- Rest of Europe
- Asia Pacific
- China
- Japan
- India
- South Korea
- South-east Asia
- Rest of Asia Pacific
- Latin America
- Brazil
- Argentina
- Rest of Latin America
- Middle East & Africa
- GCC Countries
- South Africa
- Rest of the Middle East and Africa
Competitive Landscape
The competitive landscape of the wheelchair accessible vehicle converters market is characterized by the presence of a mix of global manufacturers and regional specialists focused on customization and innovation. Key players such as Rolex Vans, Kirchoff Mobility, AMS Vans, and Vantage Mobility International dominate the market through robust product portfolios, strong distribution networks, and continuous technological enhancements. These companies invest heavily in R&D to develop advanced lift systems, lightweight ramp solutions, and electric-compatible conversions to meet evolving accessibility standards and consumer preferences. Strategic collaborations with OEMs, expansion into emerging markets, and tailored mobility solutions for personal and commercial use are common growth strategies. Regional players like Brotherwood Automobility, Sirus Automotive, and GM Coachwork enhance competitiveness by offering specialized services and faster lead times. The market also sees increasing emphasis on sustainability and compliance with disability access regulations, compelling players to adopt flexible manufacturing approaches and customer-centric innovation to maintain their competitive edge.
Key Player Analysis
- Rolex Vans
- Kirchoff Mobility
- AMS Vans
- Vantage Mobility International
- Brotherwood Automobility Limited
- Sidewinder Conversions & Mobility Ltd
- Taxi & Bus Conversion Ltd.
- Parfit Ltd.
- Sirus Automotive Ltd
- GM Coachwork
Recent Developments
- In 2024, AMS Vans continued its strong presence as a leading wheelchair accessible vehicle(WAV) converter. They are known for expanding their product line and focusing on user-centric design and customization options to meet the diverse needs of their customers.
- In 2023 and 2024, Vantage Mobility International (VMI) has been heavily focused on technological innovation, particularly in advanced securement systems and automated accessibility features. The company is also actively pursuing strategic partnerships and research and development to enhance safety, comfort, and regulatory compliance. Looking ahead to 2025, VMI is expected to further integrate automation and IoT technologies into their products and services.
Market Concentration & Characteristics
The Wheelchair Accessible Vehicle Converters Market demonstrates moderate concentration with a mix of established global manufacturers and agile regional converters. Leading companies such as Rolex Vans, Kirchoff Mobility, and Vantage Mobility International hold significant market positions due to their broad product portfolios and advanced conversion technologies. It features high entry barriers due to technical expertise requirements, regulatory compliance, and capital investment. The market serves both personal and commercial end users, with demand driven by aging populations, rising disability awareness, and stricter accessibility laws. It remains highly customized, with consumer-specific modifications dictating design and production. Product differentiation relies on ramp systems, entry point configurations, and vehicle compatibility. North America and Europe dominate in value due to supportive infrastructure and enforcement of mobility standards. Asia Pacific is expanding fast due to growing healthcare access and policy reforms. Companies pursue innovation, partnerships with OEMs, and aftermarket service expansion to strengthen competitive positioning and meet evolving mobility needs.
Report Coverage
The research report offers an in-depth analysis based on Product, Entry Point, Mode of Entry, End User and Geography. It details leading market players, providing an overview of their business, product offerings, investments, revenue streams, and key applications. Additionally, the report includes insights into the competitive environment, SWOT analysis, current market trends, as well as the primary drivers and constraints. Furthermore, it discusses various factors that have driven market expansion in recent years. The report also explores market dynamics, regulatory scenarios, and technological advancements that are shaping the industry. It assesses the impact of external factors and global economic changes on market growth. Lastly, it provides strategic recommendations for new entrants and established companies to navigate the complexities of the market.
Future Outlook
- The market is expected to witness steady growth driven by increasing demand for accessible transportation solutions globally.
- Aging populations in developed and emerging regions will continue to boost the need for personal mobility vehicles.
- Governments are likely to strengthen regulations and funding programs to promote vehicle accessibility compliance.
- Technological advancements will improve ramp designs, lift systems, and vehicle integration for enhanced user convenience.
- Demand for electric and hybrid wheelchair accessible vehicles is anticipated to rise with the shift toward sustainable transport.
- Manufacturers will focus on lightweight materials and modular designs to support easier conversions across vehicle types.
- Public transportation and ride-sharing services will increasingly adopt accessible vehicles to meet regulatory and consumer expectations.
- Partnerships between OEMs and conversion companies will expand product availability and customization options.
- Asia Pacific is projected to become a key growth region due to improving healthcare infrastructure and urban mobility reforms.
- Market players will invest more in aftersales support and mobility-as-a-service platforms to enhance customer retention.
Request a Free Sample
Fill in your details and we'll send you a free sample report.
- Sample data tables & charts
- Research methodology
Need a Custom Version of This Report?
Tailor the scope, geography, or segments to your exact requirements.
- Custom geography or segment scope
- Direct access to our analyst team
Frequently Asked Questions
What is the current size of the Wheelchair Accessible Vehicle Converters Market?
What are the key segments within the Wheelchair Accessible Vehicle Converters Market?
What are some challenges faced by the Wheelchair Accessible Vehicle Converters Market?
Who are the major players in the Wheelchair Accessible Vehicle Converters Market?
Table of Content
Chapter 1. Report Introduction
- 1.1 Report Description & Purpose
- 1.1.1 Report Title & Market Definition
- 1.1.2 Unique Selling Propositions (USP) & Key Differentiators
- 1.1.3 Value Proposition for Stakeholders
- 1.2 Research Objectives
- 1.2.1 Market Sizing Objectives (Volume & Revenue) (Volume Where Applicable)
- 1.2.2 Segmentation Objectives
- 1.2.3 Competitive Intelligence Objectives
- 1.2.4 Forecast & Scenario Objectives
- 1.3 Report Scope
- 1.3.1 Wheelchair Accessible Vehicle Converters Scope – Segments & Subsegments Covered
- 1.3.2 Geographic Scope – Regions & Countries Covered
- 1.3.3 Historical Period, Base Year & Forecast Period (2024; forecast to 2032)
- 1.3.4 Inclusions & Exclusions
- 1.4 Industry Classification & Applicable Codes
- 1.5 Currency, Measurement Units & Valuation Basis
- 1.6 Target Stakeholders
- 1.7 Limitations & Assumptions
Chapter 2. Executive Summary
- 2.1 Global Wheelchair Accessible Vehicle Converters Market Snapshot
- 2.1.1 Market Size – Historical (2024) & Forecast (2024-2032) (2024: USD 6,379.3 million → 2032: USD 10,260.6 million)
- 2.1.2 Volume & Revenue – Global Totals (Volume Where Applicable)
- 2.1.3 Key Market Highlights – Top Five Facts
- 2.2 Wheelchair Accessible Vehicle Converters Market Segmentation Snapshot
- 2.2.1 Market Split by Region – 2024 vs. 2032
- 2.3 Competitive Snapshot
- 2.3.1 Top 10 Players by Revenue Share – 2024
- 2.3.2 Top 10 Players by Volume Share – 2024 (Volume Where Applicable)
- 2.3.3 Recent Strategic Developments (18-Month Summary)
- 2.4 Key Investment Highlights & Strategic Conclusions
Chapter 3. Wheelchair Accessible Vehicle Converters Market Dynamics & Industry Analysis
- 3.1 Market Overview & Context
- 3.1.1 Wheelchair Accessible Vehicle Converters Market Position in the Broader Industry Value Chain
- 3.1.2 Demand Structure & Purchasing Dynamics
- 3.1.3 Market Maturity & Development Stage by Region
- 3.2 Wheelchair Accessible Vehicle Converters Market Drivers
- 3.3 Wheelchair Accessible Vehicle Converters Market Restraints & Challenges
- 3.4 Wheelchair Accessible Vehicle Converters Market Opportunities
- 3.5 Porter's Five Forces Analysis
- 3.5.1 Threat of New Entrants
- 3.5.2 Bargaining Power of Suppliers
- 3.5.3 Bargaining Power of Buyers
- 3.5.4 Threat of Substitutes
- 3.5.5 Competitive Rivalry – Intensity Assessment
- 3.6 Wheelchair Accessible Vehicle Converters Value Chain Analysis
- 3.6.1 Upstream – Key Inputs, Resources & Suppliers
- 3.6.1.1 Key Input/Resource 1
- 3.6.1.2 Key Input/Resource 2
- 3.6.1.3 Key Input/Resource 3
- 3.6.2 Midstream – Core Operations & Value Creation
- 3.6.2.1 Operating Model & Process Overview
- 3.6.2.2 Key Operating Locations & Capabilities by Company
- 3.6.3 Downstream – Market Channels & End Users
- 3.6.3.1 Direct Sales & Customer Engagement Channels
- 3.6.3.2 Indirect Sales, Intermediaries & Partner Channels
- 3.6.4 Value Chain Profitability Analysis
- 3.6.1 Upstream – Key Inputs, Resources & Suppliers
- 3.7 PESTEL Analysis
- 3.7.1 Political Factors
- 3.7.2 Economic Factors
- 3.7.3 Social Factors
- 3.7.4 Technological Factors
- 3.7.5 Environmental Factors
- 3.7.6 Legal Factors
- 3.8 Wheelchair Accessible Vehicle Converters Supply Chain Analysis
- 3.8.1 Critical Input & Resource Availability Risk Assessment
- 3.8.2 Supplier & Operational Concentration Risk (Geographic Exposure)
- 3.8.3 Supply & Service Disruption Impact Analysis
- 3.9 Regulatory & Policy Landscape
Note: The regulatory and policy landscape section covers regulations based on their applicability to the market, Wheelchair Accessible Vehicle Converters category, geography, and scope of the study. Only regulatory frameworks with a material impact on operations, compliance, trade, sustainability, or market access are analyzed in detail.
Chapter 4. Key Investment Pockets & Opportunity Analysis
- 4.1 Wheelchair Accessible Vehicle Converters Market Attractiveness Analysis
- 4.1.1 By Region – Investment Attractiveness Matrix (Market Size × CAGR)
- 4.2 Absolute Revenue Growth Opportunity
- 4.2.1 By Region – Absolute Revenue Growth Through 2032
- 4.3 Incremental Demand Opportunity
- 4.3.1 By Region – Incremental Demand Through 2032
- 4.3.2 Segment – Incremental Demand
- 4.4 Emerging Submarket Opportunity Deep Dive (Subject to Applicability)
- 4.5 Priority Market Opportunity Scorecards
- 4.5.1 United States
- 4.5.2 Europe
- 4.5.3 Asia
- 4.5.4 Middle East & Africa
Note: Priority market opportunity scorecards reflect the geographic scope and strategic relevance of the study. Listed markets are indicative and may be adapted to the industry.
Chapter 5. Wheelchair Accessible Vehicle Converters Cross-Border Trade & Market Access Analysis
- 5.1 International Trade & Cross-Border Activity Overview
- 5.1.1 Global Export Value by Country (2024)
- 5.1.2 Global Export Volume by Country (2024) (Volume Where Applicable)
- 5.1.3 Global Import Value by Country (2024)
- 5.1.4 Global Import Volume by Country (2024) (Volume Where Applicable)
- 5.1.5 Net Trade Balance by Country (2024)
- 5.2 Export Analysis – Segment
- 5.2.1 Category 1 (Applicable Classification Code)
- 5.2.2 Category 2 (Applicable Classification Code)
- 5.2.3 Category 3 (Applicable Classification Code)
- 5.2.4 Category 4 (Applicable Classification Code)
- 5.2.5 Category 5 (Applicable Classification Code)
- 5.3 Import Analysis – Segment
- 5.3.1 Category 1 (Applicable Classification Code)
- 5.3.2 Category 2 (Applicable Classification Code)
- 5.3.3 Category 3 (Applicable Classification Code)
- 5.3.4 Category 4 (Applicable Classification Code)
- 5.3.5 Category 5 (Applicable Classification Code)
- 5.4 Cross-Border Pricing & Transaction Benchmarks
- 5.4.1 Export Pricing – Segment & Country
- 5.4.2 Import Pricing – Segment & Source Country
- 5.4.3 Price Trends (2024)
- 5.5 Key Cross-Border Trade & Delivery Routes
- 5.5.1 Cross-Border Trade/Delivery Route 1
- 5.5.2 Cross-Border Trade/Delivery Route 2
- 5.5.3 Cross-Border Trade/Delivery Route 3
- 5.5.4 Cross-Border Trade/Delivery Route 4
- 5.5.5 Cross-Border Trade/Delivery Route 5
- 5.6 Trade Policy & Market Access Impact Assessment
- 5.6.1 Tariff & Non-Tariff Barriers
- 5.6.2 Regional Trade & Economic Integration Frameworks
- 5.6.3 Bilateral & Multilateral Trade Agreements
- 5.6.4 Cross-Border Operating, Licensing & Localization Requirements
Note: This chapter applies where cross-border trade or delivery is relevant to Wheelchair Accessible Vehicle Converters. Goods, services, and digital offerings are assessed using applicable classifications and transaction measures. Import-export volumes, trade balances, and route analyses are included only where meaningful to the market.
Chapter 6. Competitive Landscape & Company Benchmarking
- 6.1 Wheelchair Accessible Vehicle Converters Market Concentration & Structure
- 6.1.1 Herfindahl-Hirschman Index (HHI) – vs. 2024
- 6.1.2 Leading, Mid-Sized & Emerging Player Structure
- 6.1.3 Global, Regional & Local Player Dynamics
- 6.2 Wheelchair Accessible Vehicle Converters Market Share Analysis – 2024
- 6.2.1 Global Revenue Share by Company
- 6.2.2 Global Volume Share by Company (Volume Where Applicable)
- 6.2.3 Regional Revenue Share
- 6.2.4 Market Share Evolution ( vs. 2024)
- 6.2.5 Company Market Share by Key Segment
- 6.2.6 Company Market Share by Customer Group
- 6.3 Operating Scale, Capacity & Infrastructure Analysis
- 6.3.1 Global Operating Scale & Supply Capacity
- 6.3.2 Resource Utilization & Operating Efficiency
- 6.3.3 Output, Service Delivery & Activity Metrics
- 6.3.4 Operating Footprint & Infrastructure Map
- 6.3.5 Planned Operational & Capacity Expansion
- 6.4 Wheelchair Accessible Vehicle Converters Competitive Benchmarking Matrix
- 6.4.1 Revenue, Growth, Profitability & Operating Metric Comparison
- 6.4.2 Channel Revenue Mix
- 6.4.3 Geographic Revenue Exposure
- 6.4.4 R&D Intensity
- 6.4.5 Sustainability Maturity
- 6.5 Strategic Developments in Wheelchair Accessible Vehicle Converters (Last 24 Months)
- 6.5.1 Mergers, Acquisitions & Divestments
- 6.5.2 New Products, Services & Solutions in Wheelchair Accessible Vehicle Converters
- 6.5.3 Operational & Infrastructure Expansions
- 6.5.4 Strategic Alliances, Joint Ventures & Partnerships
- 6.5.5 Distribution Expansion & Market Entry
- 6.5.6 Sustainability & ESG Initiatives
- 6.6 Competitive Strategy Mapping
- 6.6.1 Leader, Challenger, Follower & Niche Classification
- 6.6.2 Pricing Strategy Comparison
- 6.6.3 Channel Strategy Matrix
Note: Strategic developments are included based on their materiality and the availability of reliable information.
Chapter 7. Global Wheelchair Accessible Vehicle Converters Market – By Sales & Delivery Channel
- 7.1 Segment Overview
- 7.1.1 Volume & Revenue Split by Channel (2024 & 2032) (Volume Where Applicable)
- 7.1.2 Channel Mix Evolution (2024-2032)
Chapter 8. Regional Market Analysis – Global Overview
- 8.1 Global Regional Overview
- 8.1.1 Regional Volume Share (Volume Where Applicable)
- 8.1.2 Regional Revenue Share
- 8.1.3 Regional Volume by Region (Volume Where Applicable)
- 8.1.4 Regional Revenue by Region
- 8.1.5 Regional Forecast Through 2032
- 8.2 Cross-Regional Segment Analysis
- 8.2.1 By Sales & Delivery Channel
- 8.2.2 By Competitive Positioning & Price Tier
Chapter 9. North America Wheelchair Accessible Vehicle Converters Market
- 9.1 United States
- 9.2 Canada
- 9.3 Mexico
Chapter 10. Europe Wheelchair Accessible Vehicle Converters Market
- 10.1 Germany
- 10.2 France
- 10.3 Italy
- 10.4 United Kingdom
- 10.5 Spain
- 10.6 Poland
- 10.7 Russia
- 10.8 Netherlands
- 10.9 Belgium
- 10.10 Sweden
- 10.11 Denmark
- 10.12 Norway
- 10.13 Rest of Europe
Chapter 11. Asia Pacific Wheelchair Accessible Vehicle Converters Market
- 11.1 China
- 11.2 India
- 11.3 Japan
- 11.4 South Korea
- 11.5 Thailand
- 11.6 Indonesia
- 11.7 Vietnam
- 11.8 Malaysia
- 11.9 Australia
- 11.10 Rest of Asia Pacific
Chapter 12. Latin America Wheelchair Accessible Vehicle Converters Market
- 12.1 Brazil
- 12.2 Argentina
- 12.3 Colombia
- 12.4 Chile
- 12.5 Rest of Latin America
Chapter 13. Middle East Wheelchair Accessible Vehicle Converters Market
- 13.1 Saudi Arabia
- 13.2 United Arab Emirates
- 13.3 Turkey
- 13.4 Israel
- 13.5 Iran
- 13.6 Rest of the Middle East
Chapter 14. Africa Wheelchair Accessible Vehicle Converters Market
- 14.1 South Africa
- 14.2 Egypt
- 14.3 Nigeria
- 14.4 Morocco
- 14.5 Rest of Africa
Chapter 15. Wheelchair Accessible Vehicle Converters Company Profiles
- 15.1 [Company 01]
- 15.1.1 Company Overview
- 15.1.2 Key Management Personnel
- 15.1.3 Products & Services Portfolio
- 15.1.4 Financial Performance
- 15.1.5 Key Market Focus & Geographic Presence
- 15.1.6 Recent Developments & Strategic Initiatives
Note: The company profile list is preliminary and may change based on research findings, market developments, data availability, and client requirements.
Chapter 16. Appendices
- Appendix A – List of Abbreviations & Acronyms
- Appendix B – Industry Classification Code Reference – Full Series
- Appendix C – Supply, Output & Operating Capacity Data Tables
- Appendix D – End-Use & Demand Base Tables
- Appendix E – Demand, Adoption & Usage Assumptions
- Appendix F – Pricing & Revenue Metric Reference Tables
- Appendix G – Company Operations & Infrastructure Database
- Appendix H – Cross-Border Trade & Activity Data Tables (Where Applicable)
- Appendix I – Regulatory Summary Tables
- Appendix J – Primary Research Participant List (Anonymized)
- Appendix K – Primary Research Questionnaire Framework
- Appendix L – Data Sources & Bibliography
- Appendix M – Market Size Divergence & Source Comparison
Chapter 17. Research Methodology
- 17.1 Research Framework & Philosophy
- 17.2 Secondary Research – Sources, Hierarchy & Data Extraction
- 17.3 Data Modeling – Bottom-Up & Top-Down Market Sizing
- 17.4 Primary Research – Stakeholder Framework, LOI & Sample Sizes
- 17.5 Forecast Methodology – Regression, Scenario & Sensitivity Analysis
- 17.6 Quality Control – Four-Layer Validation Framework
- 17.7 Limitations & Standard Assumptions
- 17.8 Disclaimer
