
Market Overview:
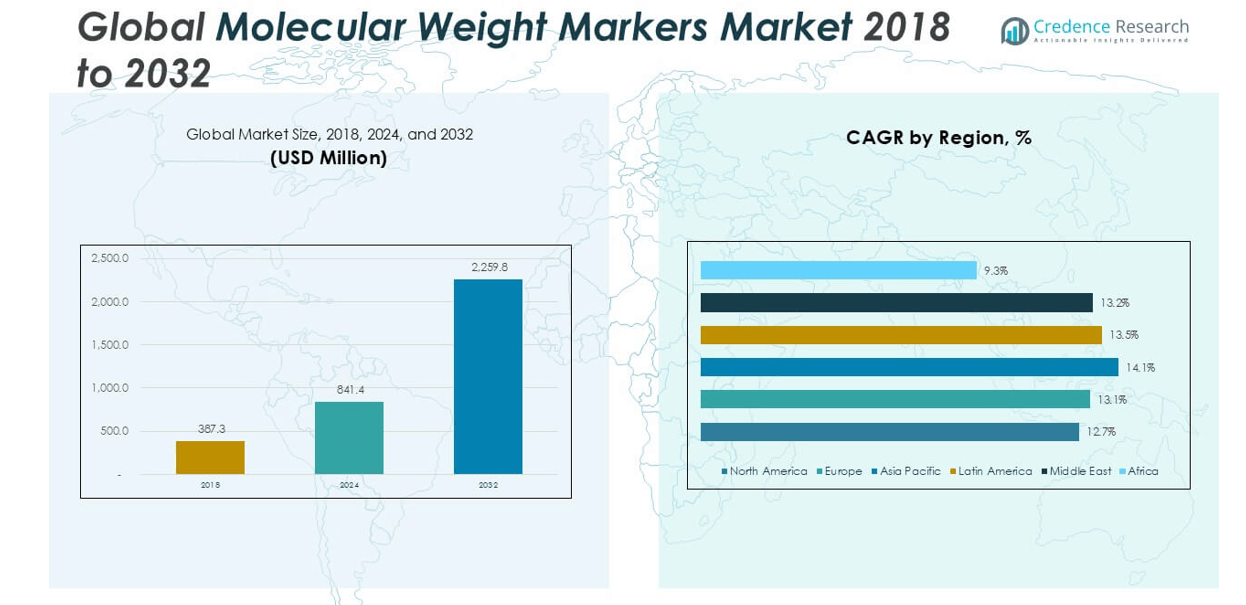
The Molecular Weight Markers market size was valued at USD 387.3 million in 2018, grew to USD 841.4 million in 2024, and is anticipated to reach USD 2,259.8 million by 2032, at a CAGR of 13.19% during the forecast period.
| REPORT ATTRIBUTE | DETAILS |
|---|---|
| Historical Period | 2020-2023 |
| Base Year | 2024 |
| Forecast Period | 2025-2032 |
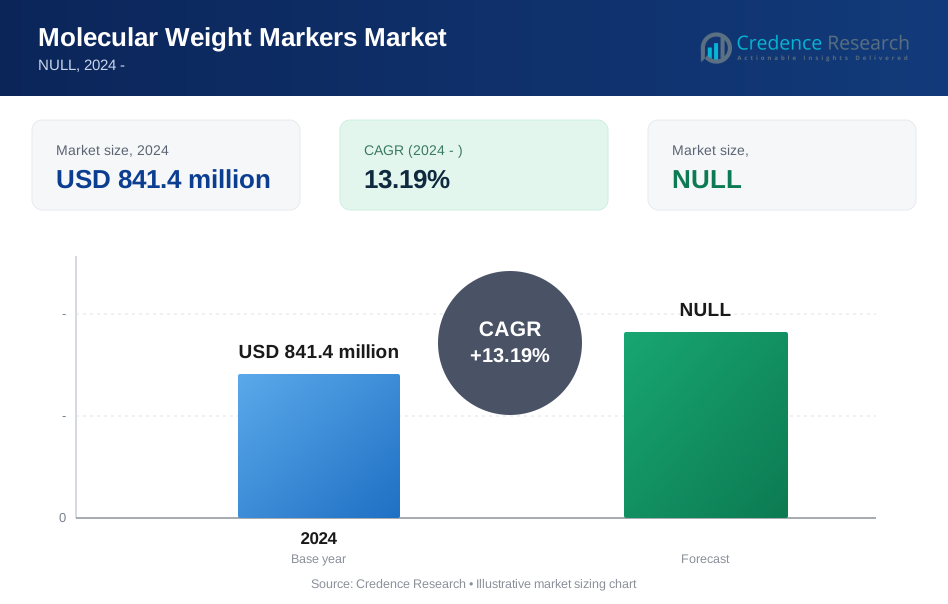
| Molecular Weight Markers Market Size 2024 | USD 841.4 million |
| Molecular Weight Markers Market, CAGR | 13.19% |
| Molecular Weight Markers Market Size 2032 | USD 2,259.8 million |
The Molecular Weight Markers market is led by prominent players such as Thermo Fisher Scientific, Bio-Rad Laboratories, Merck KGaA, Agilent Technologies, Promega Corporation, Takara Bio, F. Hoffmann-La Roche Ltd., and HiMedia Laboratories. These companies maintain a strong competitive edge through continuous product innovation, global distribution networks, and strategic partnerships. Thermo Fisher Scientific and Bio-Rad Laboratories, in particular, hold substantial market shares due to their broad product portfolios and technological advancements in electrophoresis and molecular diagnostics. Regionally, North America dominates the market with a 32.9% share in 2024, driven by advanced research infrastructure, significant R&D investments, and widespread adoption of molecular techniques in academic and clinical settings. Europe and Asia Pacific follow closely, benefiting from expanding life sciences research and growing biopharmaceutical sectors.
Market Insights
- The global Molecular Weight Markers market was valued at USD 841.4 million in 2024 and is projected to reach USD 2,259.8 million by 2032, growing at a CAGR of 13.19% during the forecast period.
- Rising demand for molecular diagnostics and increasing investment in genomic and proteomic research are driving market growth, particularly in applications such as PCR, sequencing, and Western blotting.
- High-throughput technologies and specialty markers are emerging trends, with DNA markers—especially the 50 bp to 100 bp range—accounting for the largest segment share due to widespread use in genetic studies.
- Thermo Fisher Scientific, Bio-Rad Laboratories, and Merck KGaA lead the competitive landscape through product innovation and global reach, while emerging players are gaining momentum in developing regions.
- North America dominates the market with a 32.9% share, followed by Europe (28.2%) and Asia Pacific (23.8%); however, high product costs and limited standardization remain key restraints in lower-income regions.
Market Segmentation Analysis:
By Product
The Molecular Weight Markers market by product is segmented into DNA markers, protein markers, and RNA markers. Among these, DNA markers dominate the market, driven by their extensive use in genetic and genomic research. Within DNA markers, the 50 bp to 100 bp sub-segment holds the largest share due to its optimal resolution for analyzing short DNA fragments, making it ideal for applications like PCR and cloning. Protein markers also contribute significantly, especially the 10 kDa to 100 kDa range, widely used in Western blotting for protein identification. RNA markers, though smaller in share, are gaining traction in transcriptomic research.
- For instance, Thermo Fisher Scientific's GeneRuler DNA Ladder Mix includes fragments ranging from 100 bp to 10,000 bp, offering precise sizing in electrophoresis workflows and supporting over 2 million PCR-based experiments annually.
By Type
By type, the market is classified into prestained markers, unstained markers, and specialty markers. Prestained markers lead the segment with the highest revenue share, as they provide immediate visual confirmation during gel electrophoresis and are user-friendly in tracking sample migration. Their popularity in both academic and industrial labs continues to rise due to increased demand for time-efficient and reliable results. Unstained markers follow in usage, particularly in applications requiring post-staining flexibility. Specialty markers, while niche, are seeing growth in specialized assays and diagnostic research where precision and specificity are critical.
- For instance, Bio-Rad’s Precision Plus Protein™ Dual Color Standards offer 10 prestained proteins ranging from 10 to 250 kDa, and are used in over 4,500 global labs for reproducible Western blot analysis.
By Application
Based on application, the market is segmented into nucleic acid and proteomics applications. Nucleic acid applications account for the dominant share, especially in PCR and sequencing, owing to the high throughput demand in genetic testing, diagnostics, and molecular biology studies. PCR leads due to its widespread use in detecting genetic variations and amplifying DNA. Sequencing continues to expand with advancements in next-generation sequencing (NGS) technologies. In the proteomics segment, Western blotting is the leading sub-segment, propelled by its crucial role in protein expression analysis and biomarker identification in pharmaceutical and academic research.
Market Overview
Expansion of Genomic and Proteomic Research
The increasing global focus on genomic and proteomic research is a major driver of the molecular weight markers market. Governments and private institutions are heavily investing in life sciences to advance personalized medicine, drug discovery, and molecular diagnostics. This has significantly increased the demand for accurate and reliable molecular weight markers in DNA, RNA, and protein analysis. Continuous technological developments, particularly in PCR, sequencing, and Western blotting, further support the need for molecular markers, making them essential tools in both academic and industrial research settings.
- For instance, Illumina has shipped more than 20,000 high-throughput sequencers worldwide, including the NovaSeq platform, which integrates molecular weight markers into over 80% of genomic research protocols.
Rising Demand for Diagnostic Applications
Molecular weight markers are gaining prominence in diagnostic applications, particularly in disease detection and monitoring. Their use in PCR-based testing and nucleic acid sequencing is crucial for identifying genetic disorders, infectious diseases, and cancers. The COVID-19 pandemic further amplified this demand, reinforcing the importance of molecular-level diagnostics. With growing healthcare awareness and the expansion of molecular diagnostics in clinical laboratories, the need for precise molecular weight markers continues to rise. This trend is especially strong in emerging markets, where diagnostic infrastructure is rapidly developing.
- For instance, QIAGEN supported over 100 million COVID-19 diagnostic tests using its RT-PCR kits, which incorporate molecular markers for precise target validation.
Technological Advancements in Electrophoresis
Continuous innovation in electrophoresis and related analytical techniques has positively impacted the molecular weight markers market. Developments in gel composition, staining methods, and imaging systems have made electrophoretic processes more accurate and efficient. Prestained markers, for instance, have simplified workflows by offering real-time tracking and reduced processing time. Additionally, advances in automation and miniaturization have expanded the use of molecular weight markers in high-throughput platforms. These innovations improve reproducibility and convenience, encouraging broader adoption across biotech companies, research institutes, and clinical labs.
Key Trends & Opportunities
Growing Adoption of High-Throughput Technologies
The rising use of high-throughput technologies such as next-generation sequencing (NGS) and automated Western blotting presents a significant opportunity for the molecular weight markers market. These platforms demand precise molecular weight standards to ensure accuracy and consistency across large sample volumes. As research and clinical laboratories strive for higher efficiency, the integration of high-throughput systems has led to increased consumption of molecular markers. This trend opens new avenues for manufacturers to develop compatible, high-quality marker products tailored for automated workflows and multiplexed analyses.
- For instance, Merck’s Milli-Q® CLX 7000 systems support over 1,000 labs worldwide, with integrated electrophoresis marker modules calibrated for automated sample analysis.
Increased Focus on Specialty and Custom Markers
There is a growing demand for specialty and custom molecular weight markers, especially in niche research areas like rare disease studies, epigenetics, and advanced proteomics. These markers offer enhanced specificity, tailored molecular weight ranges, and compatibility with unique experimental setups. Customization options allow researchers to address complex biological questions with greater precision, driving innovation in marker formulations. As academic institutions and pharmaceutical companies invest more in cutting-edge research, suppliers offering flexible and specialized marker solutions are well-positioned to capitalize on this emerging opportunity.
- For instance, Promega’s Custom RNA and Protein Markers Division has delivered over 1,200 tailored marker kits for projects including rare neurological disorder studies and CRISPR-based screens.
Key Challenges
High Cost of Advanced Marker Products
One of the key challenges in the molecular weight markers market is the relatively high cost of advanced products, such as prestained or specialty markers. These products offer added convenience and performance benefits but come at a premium, which may limit their adoption in cost-sensitive markets. Smaller academic institutions, diagnostic labs in developing regions, and budget-constrained research facilities often opt for more affordable alternatives. This pricing sensitivity can hinder market penetration for high-end marker products despite their superior efficiency.
Limited Standardization Across Laboratories
The lack of standardized protocols and marker formats across laboratories creates challenges in data reproducibility and comparison. Variations in gel types, buffer systems, and detection methods can lead to inconsistent results, making it difficult to establish uniform benchmarks. This inconsistency hampers collaborative research efforts and impedes the validation of experimental outcomes. Addressing this issue requires industry-wide initiatives to promote standardized guidelines and marker formulations that ensure compatibility across different laboratory environments and analytical platforms.
Complex Storage and Handling Requirements
Molecular weight markers, particularly RNA and protein-based variants, often require stringent storage and handling conditions to maintain stability and performance. Cold chain logistics, protection from degradation, and frequent quality checks increase operational complexity for end users. In resource-limited settings or field-based research, maintaining ideal storage conditions poses a significant hurdle. These logistical and stability challenges can lead to product wastage, compromised results, and increased operational costs, especially in decentralized or mobile research setups.
Regional Analysis
North America
North America held the largest share in the global Molecular Weight Markers market, accounting for approximately 32.9% of the global revenue in 2024. The market size in the region grew from USD 130.39 million in 2018 to USD 276.48 million in 2024 and is projected to reach USD 718.16 million by 2032, expanding at a CAGR of 12.7%. The region benefits from robust investment in biotechnology and pharmaceutical research, a well-established healthcare infrastructure, and widespread adoption of advanced molecular diagnostic techniques. Increasing academic research funding and expanding use of molecular diagnostics continue to drive regional demand.
Europe
Europe captured a significant 28.2% share of the global Molecular Weight Markers market in 2024. The market increased from USD 110.02 million in 2018 to USD 237.74 million in 2024 and is expected to reach USD 633.87 million by 2032, registering a CAGR of 13.1% during the forecast period. The region’s growth is driven by strong biomedical research activity, government funding, and the presence of leading research institutions. Rising adoption of molecular diagnostics and proteomics in clinical settings, coupled with demand for specialty markers in pharmaceutical R&D, supports the market expansion across Western and Central Europe.
Asia Pacific
Asia Pacific is emerging as the fastest-growing regional market, with a CAGR of 14.1%, and accounted for approximately 23.8% of global market revenue in 2024. The market rose from USD 89.42 million in 2018 to USD 203.98 million in 2024, with projections reaching USD 582.57 million by 2032. Rapid advancements in biotechnology, rising research funding, and expanding academic and pharmaceutical sectors in countries like China, India, and South Korea are major drivers. Additionally, growing awareness and use of molecular diagnostics in clinical and research laboratories boost the regional market's momentum.
Latin America
Latin America represented about 7.9% of the global Molecular Weight Markers market in 2024, growing from USD 32.72 million in 2018 to USD 72.29 million in 2024, and expected to reach USD 198.41 million by 2032 at a CAGR of 13.5%. The region is witnessing steady progress due to the increasing presence of international biotech firms, improved research infrastructure, and supportive government initiatives in Brazil, Mexico, and Argentina. Rising investment in academic life sciences and growing adoption of molecular tools in diagnostic laboratories contribute to regional market growth.
Middle East
The Middle East accounted for around 3.9% of the global Molecular Weight Markers market in 2024. The market expanded from USD 16.38 million in 2018 to USD 35.59 million in 2024, and is projected to reach USD 95.59 million by 2032, growing at a CAGR of 13.2%. Market growth is supported by increasing healthcare modernization, government-led research funding, and growing demand for molecular diagnostics in GCC countries. The establishment of advanced research centers and diagnostic laboratories across the UAE and Saudi Arabia continues to fuel demand for reliable molecular weight markers.
Africa
Africa held the smallest share of the global Molecular Weight Markers market, contributing 1.8% in 2024. The regional market increased from USD 8.33 million in 2018 to USD 15.31 million in 2024, and is anticipated to reach USD 31.18 million by 2032, registering a CAGR of 9.3%. Although growth is relatively slower, the market is gradually expanding due to international funding, increasing diagnostic awareness, and development of healthcare infrastructure in countries such as South Africa, Nigeria, and Kenya. Limited research funding and access to high-end lab technologies remain key challenges for broader market penetration.
Market Segmentations:
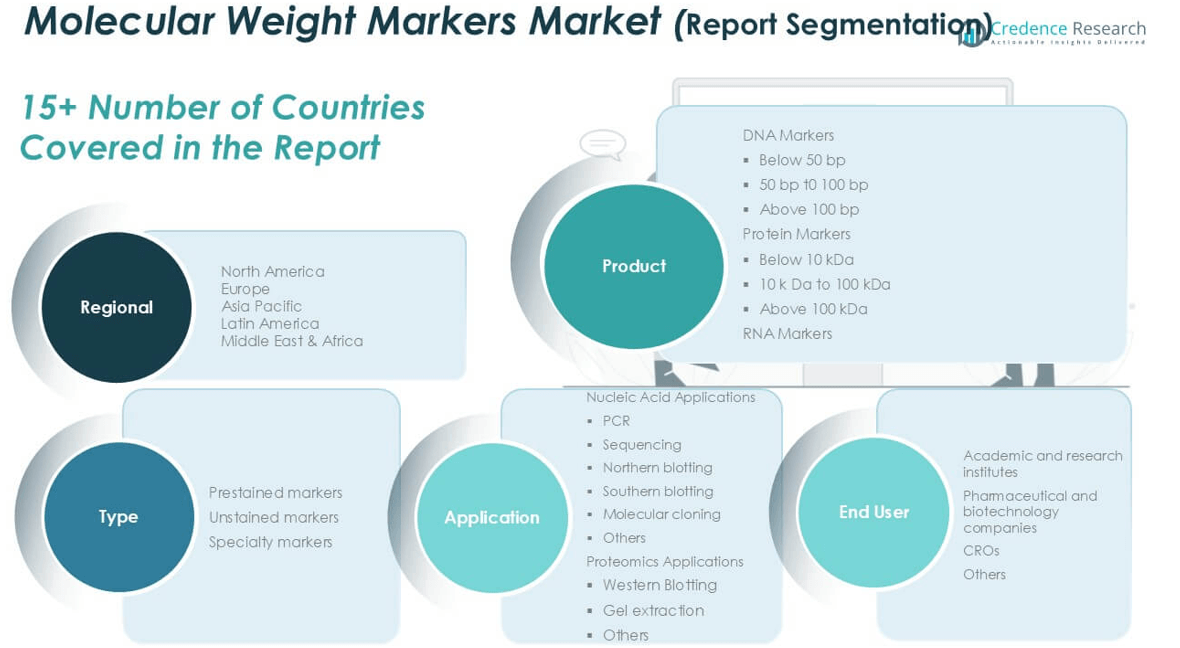
By Product
- DNA Markers
- Below 50 bp
- 50 bp to 100 bp
- Above 100 bp
- Protein Markers
- Below 10 kDa
- 10 kDa to 100 kDa
- Above 100 kDa
- RNA Markers
By Type
- Prestained Markers
- Unstained Markers
- Specialty Markers
By Application
- Nucleic Acid Applications
- PCR
- Sequencing
- Northern Blotting
- Southern Blotting
- Molecular Cloning
- Others
- Proteomics Applications
- Western Blotting
- Gel Extraction
- Others
By End User Industry
- Academic and Research Institutes
- Pharmaceutical and Biotechnology Companies
- Contract Research Organizations (CROs)
- Others
By Geography
- North America
- U.S.
- Canada
- Mexico
- Europe
- Germany
- France
- U.K.
- Italy
- Spain
- Rest of Europe
- Asia Pacific
- China
- Japan
- India
- South Korea
- South-east Asia
- Rest of Asia Pacific
- Latin America
- Brazil
- Argentina
- Rest of Latin America
- Middle East & Africa
- GCC Countries
- South Africa
- Rest of the Middle East and Africa
Competitive Landscape
The competitive landscape of the Molecular Weight Markers market is characterized by the presence of several well-established players focusing on product innovation, strategic collaborations, and geographical expansion to strengthen their market position. Key companies such as Thermo Fisher Scientific, Bio-Rad Laboratories, Merck KGaA, and Agilent Technologies dominate the market through a broad product portfolio and strong global distribution networks. These firms continuously invest in research and development to introduce advanced prestained, unstained, and specialty markers that meet the evolving demands of molecular biology and proteomics applications. Emerging players like HiMedia Laboratories and Takara Bio are also gaining traction by offering cost-effective and customized solutions, particularly in developing markets. Strategic partnerships with academic and research institutions further enable these companies to maintain relevance and enhance brand visibility. The market exhibits moderate-to-high competition, with differentiation based on product performance, application-specific compatibility, pricing, and customer support services. Ongoing technological advancements and regional market expansion remain key focus areas across the industry.
Key Player Analysis
- Agilent Technologies, Inc.
- Bio-Rad Laboratories, Inc.
- Hoffmann-La Roche Ltd.
- Merck KGaA
- Promega Corporation
- Takara Bio, Inc.
- Thermo Fisher Scientific, Inc.
- HiMedia Laboratories
Recent Developments
- In June 2025, Agilent launched the InfinityLab Pro iQ Series at ASMS 2025. While primarily focused on advanced LC-mass detection (including oligonucleotides, therapeutic peptides, and proteins), this system represents Agilent's push for improvements in biological molecule analysis, which closely ties to the development and application of molecular weight marker technology.
- In 2024, Oncodesign Precision Medicine entered into a strategic collaboration with Navigo Proteins GmbH to advance the development of novel systematic radio theranostic agents.
- In May 2024, Radar Therapeutics emerged from stealth mode with the announcement that it raised USD 13.4 million in an oversubscribed seed financing round led by NfX Bio. Eli Lilly & Co., Biovision, and KdT Ventures also participated, along with PearVC, BEVC, and other investors. The company plans to use the funds to advance several internal programs, expand its team, and explore partnership opportunities.
- In April 2024, New England Biolabs (NEB) announced the release of its Monarch Mag Viral DNA/RNA Extraction Kit. This kit improves the recovery of low amounts of viral nucleic acids to enable highly sensitive detection. It employs a magnetic bead-based process to extract viral RNA and DNA both reproducibly and efficiently, allowing for scalable high-throughput automation.
- In December 2023, TransGen Biotech Co. Ltd launched its nucleic acid electrophoresis-related equipment to fully establish a powerful combination of equipment and reagents to boost life science research.
- In November 2023, TransGen Biotech Co. Ltd launched its western blot vertical electrophoresis and transfer system. Western Blot is an experimental method in molecular biology, biochemistry, and immunogenetics.
Market Concentration & Characteristics
The Molecular Weight Markers market exhibits moderate to high market concentration, with a few global players dominating overall revenue share. Leading companies such as Thermo Fisher Scientific, Bio-Rad Laboratories, Merck KGaA, and Agilent Technologies maintain strong positions through established brand reputation, extensive product lines, and robust global distribution networks. It reflects a technology-driven structure, where innovation, product accuracy, and compatibility with advanced platforms define competitiveness. The market favors companies that offer high-performance, application-specific markers, particularly for nucleic acid and protein analysis. Entry barriers remain significant due to high R&D costs, stringent quality standards, and the need for specialized manufacturing infrastructure. It shows characteristics of steady demand from academic, clinical, and pharmaceutical sectors, with product usage embedded in routine laboratory workflows. Customers seek consistent performance, ease of use, and reliability, which keeps switching rates low. Regional demand varies, with North America, Europe, and Asia Pacific accounting for the bulk of revenue due to strong research ecosystems and rising diagnostic adoption.
Report Coverage
The research report offers an in-depth analysis based on Product, Type, Application, End User Industry and Geography. It details leading market players, providing an overview of their business, product offerings, investments, revenue streams, and key applications. Additionally, the report includes insights into the competitive environment, SWOT analysis, current market trends, as well as the primary drivers and constraints. Furthermore, it discusses various factors that have driven market expansion in recent years. The report also explores market dynamics, regulatory scenarios, and technological advancements that are shaping the industry. It assesses the impact of external factors and global economic changes on market growth. Lastly, it provides strategic recommendations for new entrants and established companies to navigate the complexities of the market.
Future Outlook
- The market will continue to expand with increasing applications in genomics and proteomics research.
- Demand for high-resolution and specialty markers will rise with advancements in molecular diagnostics.
- Adoption of automation and high-throughput systems will drive the need for compatible marker products.
- Prestained and ready-to-use marker formats will gain popularity for workflow efficiency.
- Growth in personalized medicine will boost the usage of molecular weight markers in clinical labs.
- Emerging economies will offer new opportunities due to expanding biotech and academic sectors.
- Companies will focus on developing cost-effective and customizable marker solutions.
- Strategic collaborations between manufacturers and research institutions will increase.
- Market players will invest more in R&D to enhance marker precision and shelf life.
- Regulatory support and funding in life sciences will support long-term market sustainability.
Request a Free Sample
Fill in your details and we'll send you a free sample report.
- Sample data tables & charts
- Research methodology
Need a Custom Version of This Report?
Tailor the scope, geography, or segments to your exact requirements.
- Custom geography or segment scope
- Direct access to our analyst team
Frequently Asked Questions
What is the current size of the Molecular Weight Markers Market?
What factors are driving the growth of the Molecular Weight Markers Market?
What are the key segments within the Molecular Weight Markers Market?
Who are the major players in the Molecular Weight Markers Market?
Table of Content
Chapter 1. Report Introduction
- 1.1 Report Description & Purpose
- 1.1.1 Report Title & Market Definition
- 1.1.2 Unique Selling Propositions (USP) & Key Differentiators
- 1.1.3 Value Proposition for Stakeholders
- 1.2 Research Objectives
- 1.2.1 Market Sizing Objectives (Volume & Revenue)
- 1.2.2 Segmentation Objectives
- 1.2.3 Competitive Intelligence Objectives
- 1.2.4 Forecast & Scenario Objectives
- 1.3 Report Scope
- 1.3.1 Molecular Weight Markers Scope – Types & Subtypes Covered
- 1.3.2 Geographic Scope – Regions & Countries Covered
- 1.3.3 Historical Period, Base Year & Forecast Period (2024; forecast to the forecast period)
- 1.3.4 Inclusions & Exclusions
- 1.4 HS Code & Classification Framework
- 1.5 Currency, Units & Pricing Basis
- 1.6 Target Stakeholders
- 1.7 Limitations & Assumptions
Chapter 2. Executive Summary
- 2.1 Global Molecular Weight Markers Market Snapshot
- 2.1.1 Market Size – Historical (2024) & Forecast (the forecast period) (2024: USD 841.4 million → forecast year: NULL)
- 2.1.2 Volume & Revenue – Global Totals
- 2.1.3 Key Market Highlights – Top Five Facts
- 2.2 Molecular Weight Markers Market Segmentation Snapshot
- 2.2.1 Market Split by Region – 2024 vs.
- 2.3 Competitive Snapshot
- 2.3.1 Top 10 Players by Revenue Share – 2024
- 2.3.2 Top 10 Players by Volume Share – 2024
- 2.3.3 Recent Strategic Developments (18-Month Summary)
- 2.4 Key Investment Highlights & Strategic Conclusions
Chapter 3. Molecular Weight Markers Market Dynamics & Industry Analysis
- 3.1 Market Overview & Context
- 3.1.1 Molecular Weight Markers Market Position in the Broader Automotive Value Chain
- 3.1.2 OEM vs. Replacement Market Dynamics
- 3.1.3 Market Maturity & Development Stage by Region
- 3.2 Molecular Weight Markers Market Drivers
- 3.3 Molecular Weight Markers Market Restraints & Challenges
- 3.4 Molecular Weight Markers Market Opportunities
- 3.5 Porter's Five Forces Analysis
- 3.5.1 Threat of New Entrants
- 3.5.2 Bargaining Power of Suppliers
- 3.5.3 Bargaining Power of Buyers
- 3.5.4 Threat of Substitutes
- 3.5.5 Competitive Rivalry – Intensity Assessment
- 3.6 Molecular Weight Markers Value Chain Analysis
- 3.6.1 Upstream – Raw Material/Input Suppliers
- 3.6.1.1 Raw Material/Input 1
- 3.6.1.2 Raw Material/Input 2
- 3.6.1.3 Raw Material/Input 3
- 3.6.2 Midstream – Production/Manufacturing/Service Delivery
- 3.6.2.1 Production/Process Overview
- 3.6.2.2 Key Facility Locations & Capacity by Manufacturer
- 3.6.3 Downstream – Distribution & End Consumer
- 3.6.3.1 Primary Channel – B2B/OEM
- 3.6.3.2 Secondary Channels – Dealer, Retail, Online, Direct
- 3.6.4 Value Chain Profitability Analysis
- 3.6.1 Upstream – Raw Material/Input Suppliers
- 3.7 PESTEL Analysis
- 3.7.1 Political Factors
- 3.7.2 Economic Factors
- 3.7.3 Social Factors
- 3.7.4 Technological Factors
- 3.7.5 Environmental Factors
- 3.7.6 Legal Factors
- 3.8 Molecular Weight Markers Supply Chain Analysis
- 3.8.1 Raw Material/Input Supply Risk Assessment
- 3.8.2 Manufacturing Concentration Risk (Geographic Exposure)
- 3.8.3 Trade Disruption Impact Analysis
- 3.9 Regulatory & Policy Landscape
Note: The regulatory and policy landscape section covers regulations based on their applicability to the market, Molecular Weight Markers category, geography, and scope of the study. Only regulatory frameworks with a material impact on operations, compliance, trade, sustainability, or market access are analyzed in detail.
Chapter 4. Key Investment Pockets & Opportunity Analysis
- 4.1 Molecular Weight Markers Market Attractiveness Analysis
- 4.1.1 By Region – Investment Attractiveness Matrix (Volume × CAGR)
- 4.2 Absolute Revenue Growth Opportunity
- 4.2.1 By Region – Absolute USD Growth Through the forecast period
- 4.3 Incremental Volume Opportunity
- 4.3.1 By Region – Incremental Volume Through the forecast period
- 4.3.2 Segment – Incremental Volume
- 4.4 Emerging Submarket Opportunity Deep Dive (Subject to Applicability)
- 4.5 Emerging Market Opportunity Scorecards
- 4.5.1 United States
- 4.5.2 Europe
- 4.5.3 Asia
- 4.5.4 Middle East & Africa
Note: Emerging Market Opportunity Scorecards will be included based on relevance and strategic importance. Regions listed are indicative and may vary depending on data availability and market dynamics.
Chapter 5. Molecular Weight Markers Import-Export Analysis & Trade Flows
- 5.1 Global Trade Overview
- 5.1.1 Global Export Value by Country (2024)
- 5.1.2 Global Export Volume by Country (2024)
- 5.1.3 Global Import Value by Country (2024)
- 5.1.4 Global Import Volume by Country (2024)
- 5.1.5 Net Trade Balance by Country (2024)
- 5.2 Export Analysis – Segment
- 5.2.1 Type 1 (HS Code)
- 5.2.2 Type 2 (HS Code)
- 5.2.3 Type 3 (HS Code)
- 5.2.4 Type 4 (HS Code)
- 5.2.5 Type 5 (HS Code)
- 5.3 Import Analysis – Segment
- 5.3.1 Type 1 (HS Code)
- 5.3.2 Type 2 (HS Code)
- 5.3.3 Type 3 (HS Code)
- 5.3.4 Type 4 (HS Code)
- 5.3.5 Type 5 (HS Code)
- 5.4 Average Unit Trade Prices
- 5.4.1 Average Export Price – Segment & Country
- 5.4.2 Average Import Price – Segment & Source Country
- 5.4.3 Price Trends (2024)
- 5.5 Key Trade Route Analysis
- 5.5.1 Trade Route 1
- 5.5.2 Trade Route 2
- 5.5.3 Trade Route 3
- 5.5.4 Trade Route 4
- 5.5.5 Trade Route 5
- 5.6 Trade Policy Impact Assessment
- 5.6.1 US Anti-Dumping & Section 301 Tariffs
- 5.6.2 EU Customs Union Impact
- 5.6.3 Major Free Trade Agreements
- 5.6.4 USMCA Rules of Origin
Note: Trade policy analysis will be included only where relevant to the Molecular Weight Markers market.
Chapter 6. Competitive Landscape & Company Benchmarking
- 6.1 Molecular Weight Markers Market Concentration & Structure
- 6.1.1 Herfindahl-Hirschman Index (HHI) – vs. 2024
- 6.1.2 Tier 1, Tier 2 & Tier 3 Market Structure
- 6.1.3 Global, Regional & Local Player Dynamics
- 6.2 Molecular Weight Markers Market Share Analysis – 2024
- 6.2.1 Global Revenue Share by Company
- 6.2.2 Global Volume Share by Company
- 6.2.3 Regional Revenue Share
- 6.2.4 Market Share Evolution ( vs. 2024)
- 6.2.5 OEM Segment Share by Company
- 6.2.6 Replacement Segment Share by Company
- 6.3 Production/Delivery Capacity & Facility Analysis
- 6.3.1 Global Installed Capacity
- 6.3.2 Capacity Utilization Rates
- 6.3.3 Production/Output Volume
- 6.3.4 Facility Locations & Capacity Map
- 6.3.5 Planned Capacity Additions
- 6.4 Molecular Weight Markers Competitive Benchmarking Matrix
- 6.4.1 Revenue, Volume, CAGR & Profitability Comparison
- 6.4.2 Channel Revenue Mix
- 6.4.3 Geographic Revenue Exposure
- 6.4.4 R&D Intensity
- 6.4.5 Sustainability Maturity
- 6.5 Strategic Developments in Molecular Weight Markers (Last 24 Months)
- 6.5.1 Mergers, Acquisitions & Divestments
- 6.5.2 New Molecular Weight Markers Launches
- 6.5.3 Facility Expansions
- 6.5.4 Strategic Alliances, Joint Ventures & Partnerships
- 6.5.5 Distribution Expansion & Market Entry
- 6.5.6 Sustainability & ESG Initiatives
- 6.6 Competitive Strategy Mapping
- 6.6.1 Leader, Challenger, Follower & Niche Classification
- 6.6.2 Pricing Strategy Comparison
- 6.6.3 Channel Strategy Matrix
Note: Strategic developments are included based on their materiality and the availability of reliable information.
Chapter 7. Global Molecular Weight Markers Market – By Distribution Channel
- 7.1 Segment Overview
- 7.1.1 Volume & Revenue Split by Channel (2024 & )
- 7.1.2 Channel Mix Evolution (the forecast period)
Chapter 8. Regional Market Analysis – Global Overview
- 8.1 Global Regional Overview
- 8.1.1 Regional Volume Share
- 8.1.2 Regional Revenue Share
- 8.1.3 Regional Volume by Region
- 8.1.4 Regional Revenue by Region
- 8.1.5 Regional Forecast Through the forecast period
- 8.2 Cross-Regional Segment Analysis
- 8.2.1 By Distribution Channel
- 8.2.2 By Brand/Price Tier
Chapter 9. North America Molecular Weight Markers Market
- 9.1 United States
- 9.2 Canada
- 9.3 Mexico
Chapter 10. Europe Molecular Weight Markers Market
- 10.1 Germany
- 10.2 France
- 10.3 Italy
- 10.4 United Kingdom
- 10.5 Spain
- 10.6 Poland
- 10.7 Russia
- 10.8 Netherlands
- 10.9 Belgium
- 10.10 Sweden
- 10.11 Denmark
- 10.12 Norway
- 10.13 Rest of Europe
Chapter 11. Asia Pacific Molecular Weight Markers Market
- 11.1 China
- 11.2 India
- 11.3 Japan
- 11.4 South Korea
- 11.5 Thailand
- 11.6 Indonesia
- 11.7 Vietnam
- 11.8 Malaysia
- 11.9 Australia
- 11.10 Rest of Asia Pacific
Chapter 12. Latin America Molecular Weight Markers Market
- 12.1 Brazil
- 12.2 Argentina
- 12.3 Colombia
- 12.4 Chile
- 12.5 Rest of Latin America
Chapter 13. Middle East Molecular Weight Markers Market
- 13.1 Saudi Arabia
- 13.2 United Arab Emirates
- 13.3 Turkey
- 13.4 Israel
- 13.5 Iran
- 13.6 Rest of the Middle East
Chapter 14. Africa Molecular Weight Markers Market
- 14.1 South Africa
- 14.2 Egypt
- 14.3 Nigeria
- 14.4 Morocco
- 14.5 Rest of Africa
Chapter 15. Molecular Weight Markers Company Profiles
- 15.1 [Company 01]
- 15.1.1 Company Overview
- 15.1.2 Key Management Personnel
- 15.1.3 Products & Services Portfolio
- 15.1.4 Financial Performance
- 15.1.5 Key Market Focus & Geographic Presence
- 15.1.6 Recent Developments & Strategic Initiatives
Note: The company profile list is preliminary and may change based on research findings, market developments, data availability, and client requirements.
Chapter 16. Appendices
- Appendix A – List of Abbreviations & Acronyms
- Appendix B – Industry Classification Code Reference – Full Series
- Appendix C – Production & Capacity Data Tables
- Appendix D – End-Use & Demand Base Tables
- Appendix E – Consumption & Replacement Rate Assumptions
- Appendix F – ASP Reference Tables
- Appendix G – Manufacturing & Facility Database
- Appendix H – Import-Export Data Tables
- Appendix I – Regulatory Summary Tables
- Appendix J – Primary Research Participant List (Anonymized)
- Appendix K – Primary Research Questionnaire Framework
- Appendix L – Data Sources & Bibliography
- Appendix M – Market Size Divergence & Source Comparison
Chapter 17. Research Methodology
- 17.1 Research Framework & Philosophy
- 17.2 Secondary Research – Sources, Hierarchy & Data Extraction
- 17.3 Data Modeling – Bottom-Up & Top-Down Market Sizing
- 17.4 Primary Research – Stakeholder Framework, LOI & Sample Sizes
- 17.5 Forecast Methodology – Regression, Scenario & Sensitivity Analysis
- 17.6 Quality Control – Four-Layer Validation Framework
- 17.7 Limitations & Standard Assumptions
- 17.8 Disclaimer
