
Scam law and real-time payments are reshaping fraud budgets
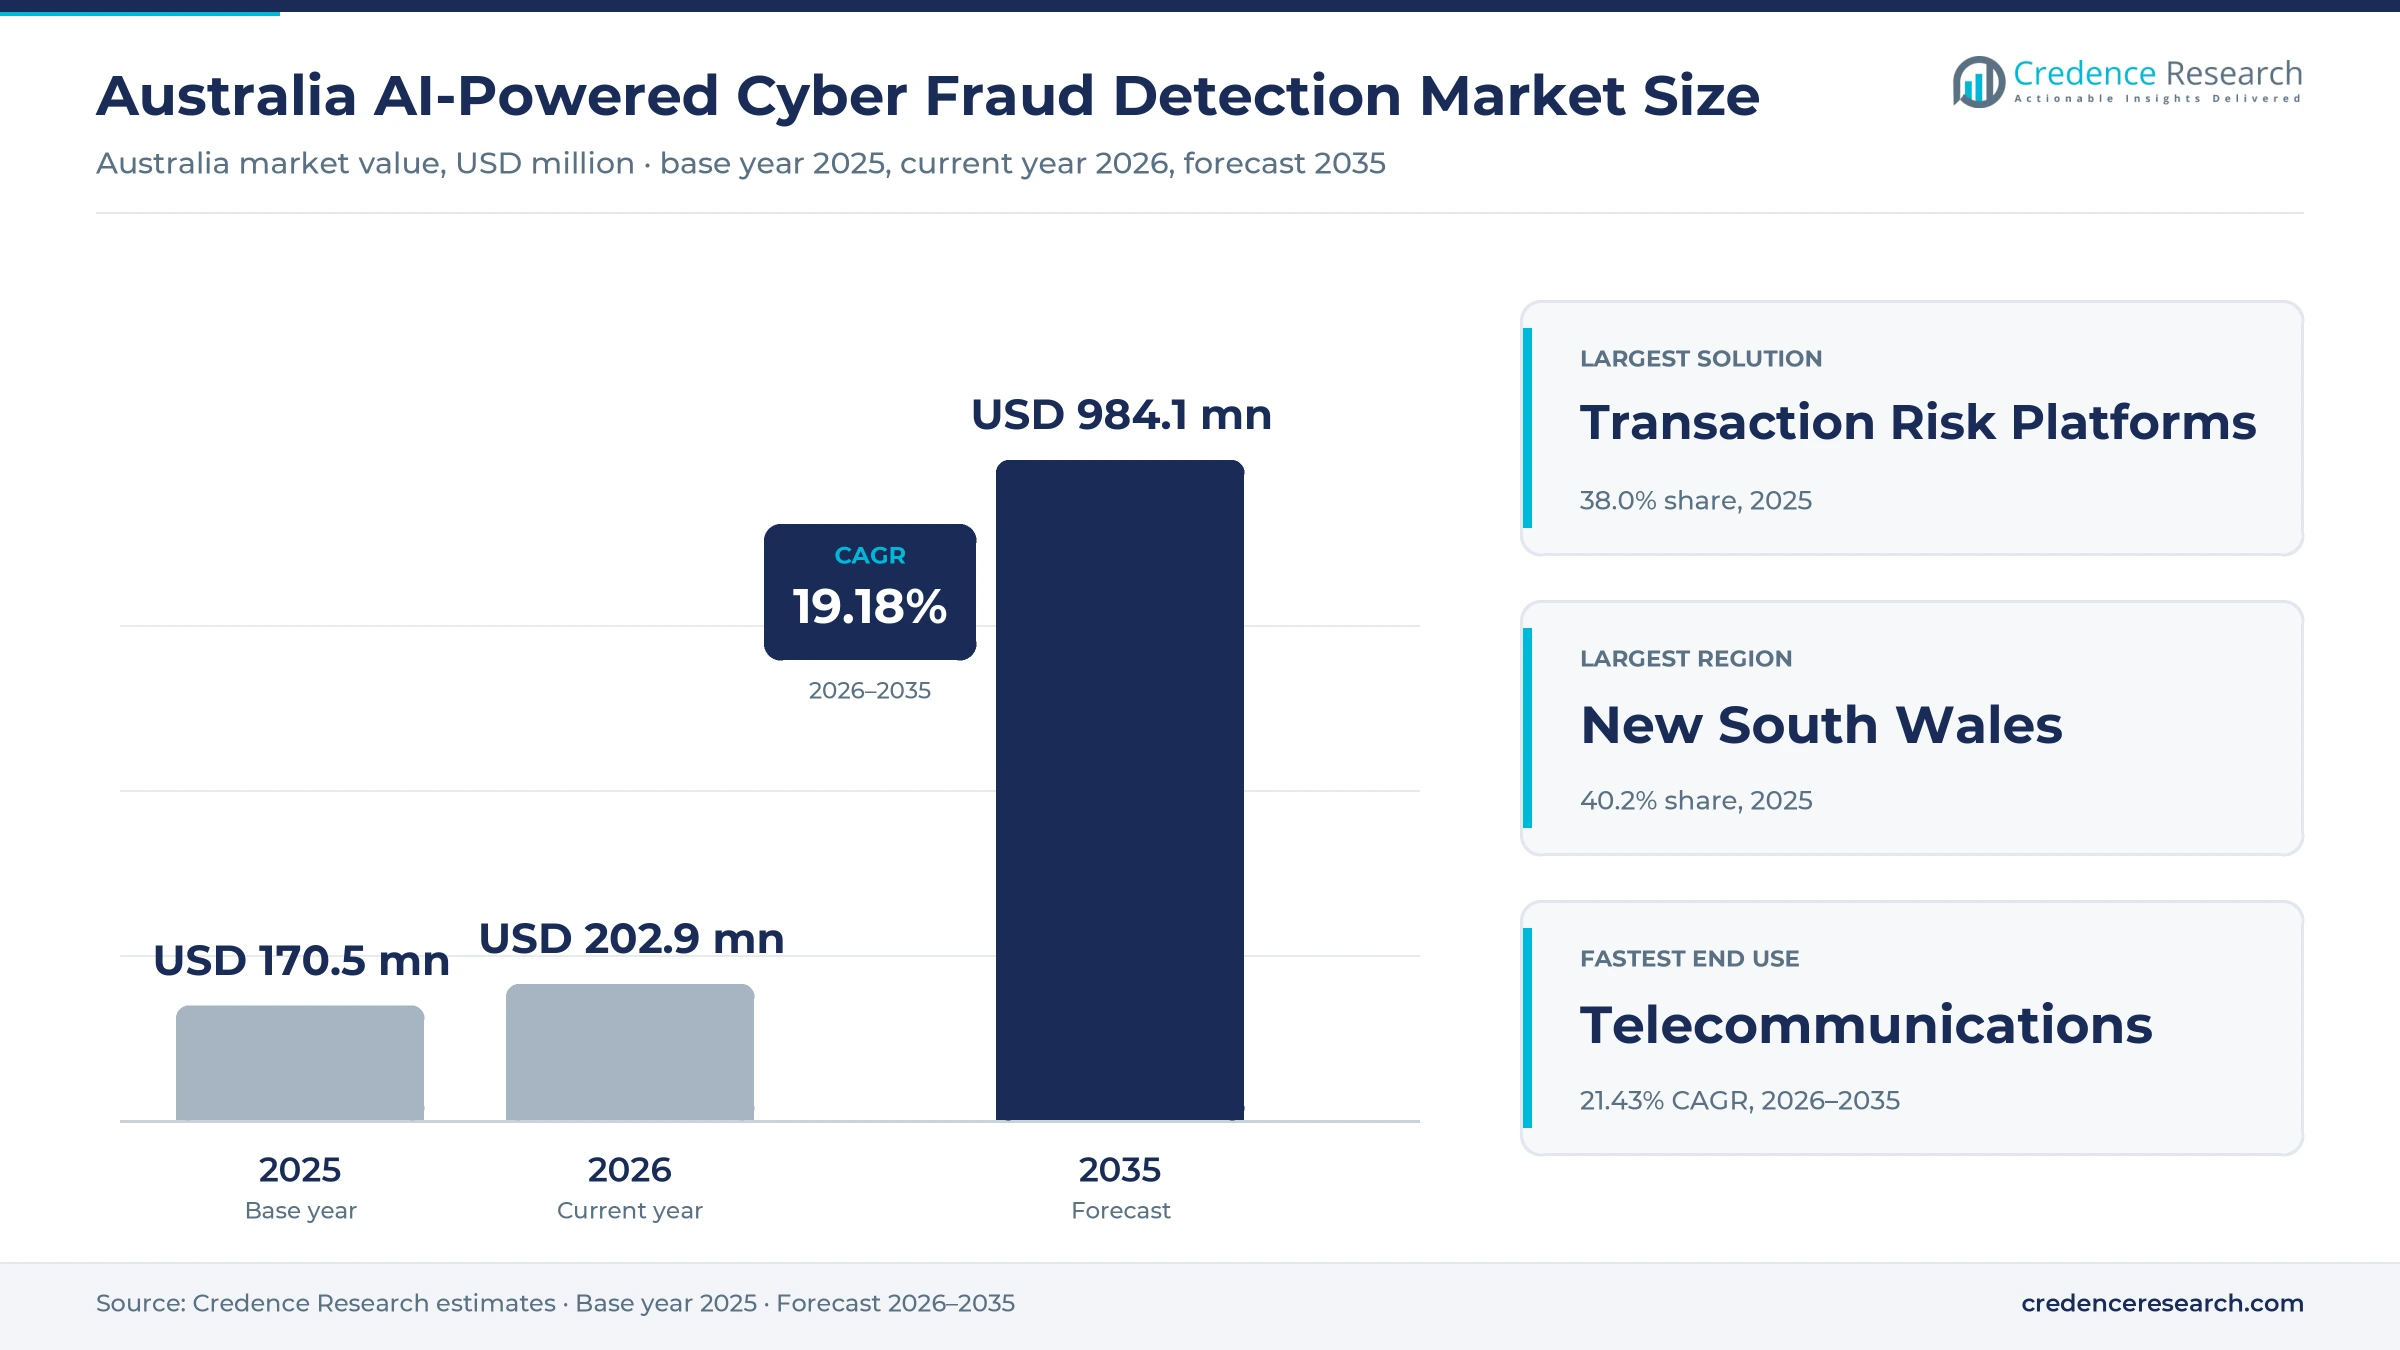
The Australia AI-powered cyber fraud detection market was valued at USD 170.5 million in 2025 and is projected to increase from USD 202.9 million in 2026 to USD 984.1 million by 2035, registering a CAGR of 19.18% during 2026–2035. Demand comes from banks, telecommunications carriers, payment firms and public agencies that must spot fraud and scam payments before money leaves an account. The Scams Prevention Framework designated banks, telecommunications services and digital platforms in May 2026, and the key bank duties can apply from March 31, 2027, which moves detection from voluntary practice toward a civil penalty obligation. New South Wales held the largest regional share, 40.2% in 2025, as the most populous state, while Queensland is the fastest-growing region at 19.62% a year. Scam losses reported by the National Anti-Scam Centre reached AUD 2.18 billion in 2025, and shared behavioral and telco signals are now moving into bank decision engines across the country.
Which payments, accounts and claims does this market count?
The market counts software, shared intelligence services and supporting delivery that use machine learning to score payments, accounts, identities and claims in Australia. Buyers include banks, telecommunications carriers, non-bank payment and commerce firms, and public agencies, and they usually purchase through subscriptions, usage-based contracts or internally delivered programs.
Scam reimbursement, stolen funds, general cybersecurity tools with no fraud function and rules-only systems without machine learning fall outside the count. The value chain runs from data and signal providers through model and platform vendors to integrators and the fraud operations teams that act on each alert.
Australia AI-Powered Cyber Fraud Detection Market Insights
- The market grows from USD 170.5 million in 2025 to USD 984.1 million by 2035, a 19.18% CAGR, as binding scam duties reach banks, telcos and digital platforms.
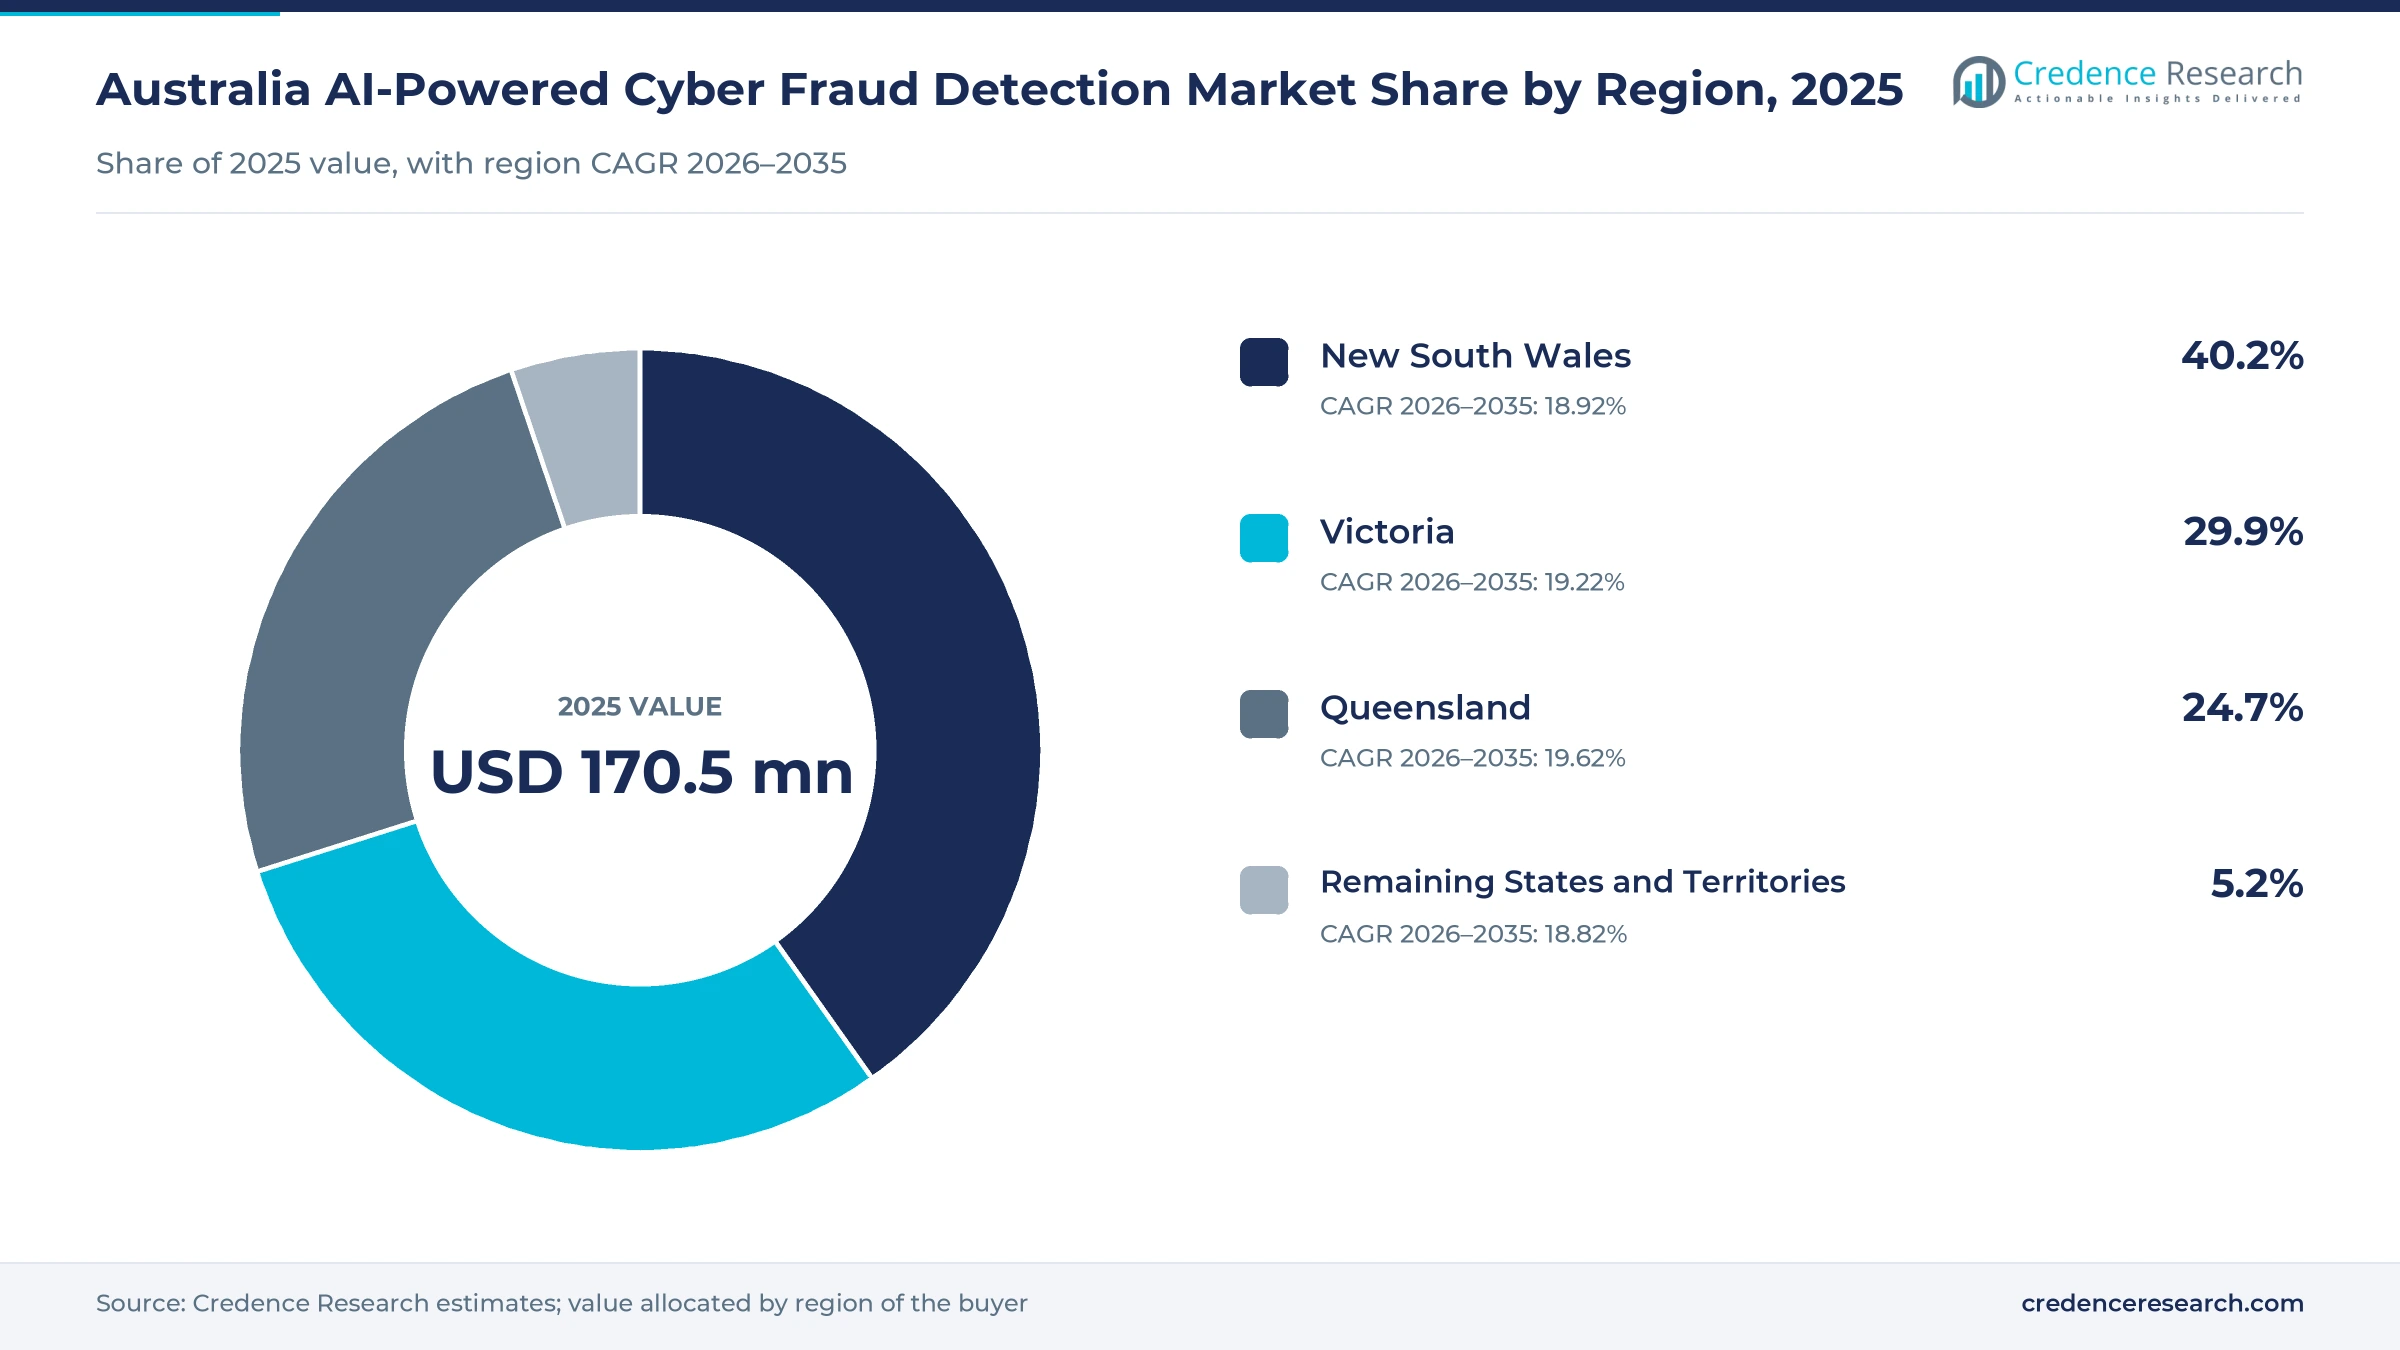
- New South Wales held 40.2% of 2025 value, ahead of Victoria at 29.9%, reflecting the largest state population and concentrated financial buying.
- Banking took 63.0% of 2025 value because major banks fund the largest detection programs, including CommBank at AUD 1 billion a year.
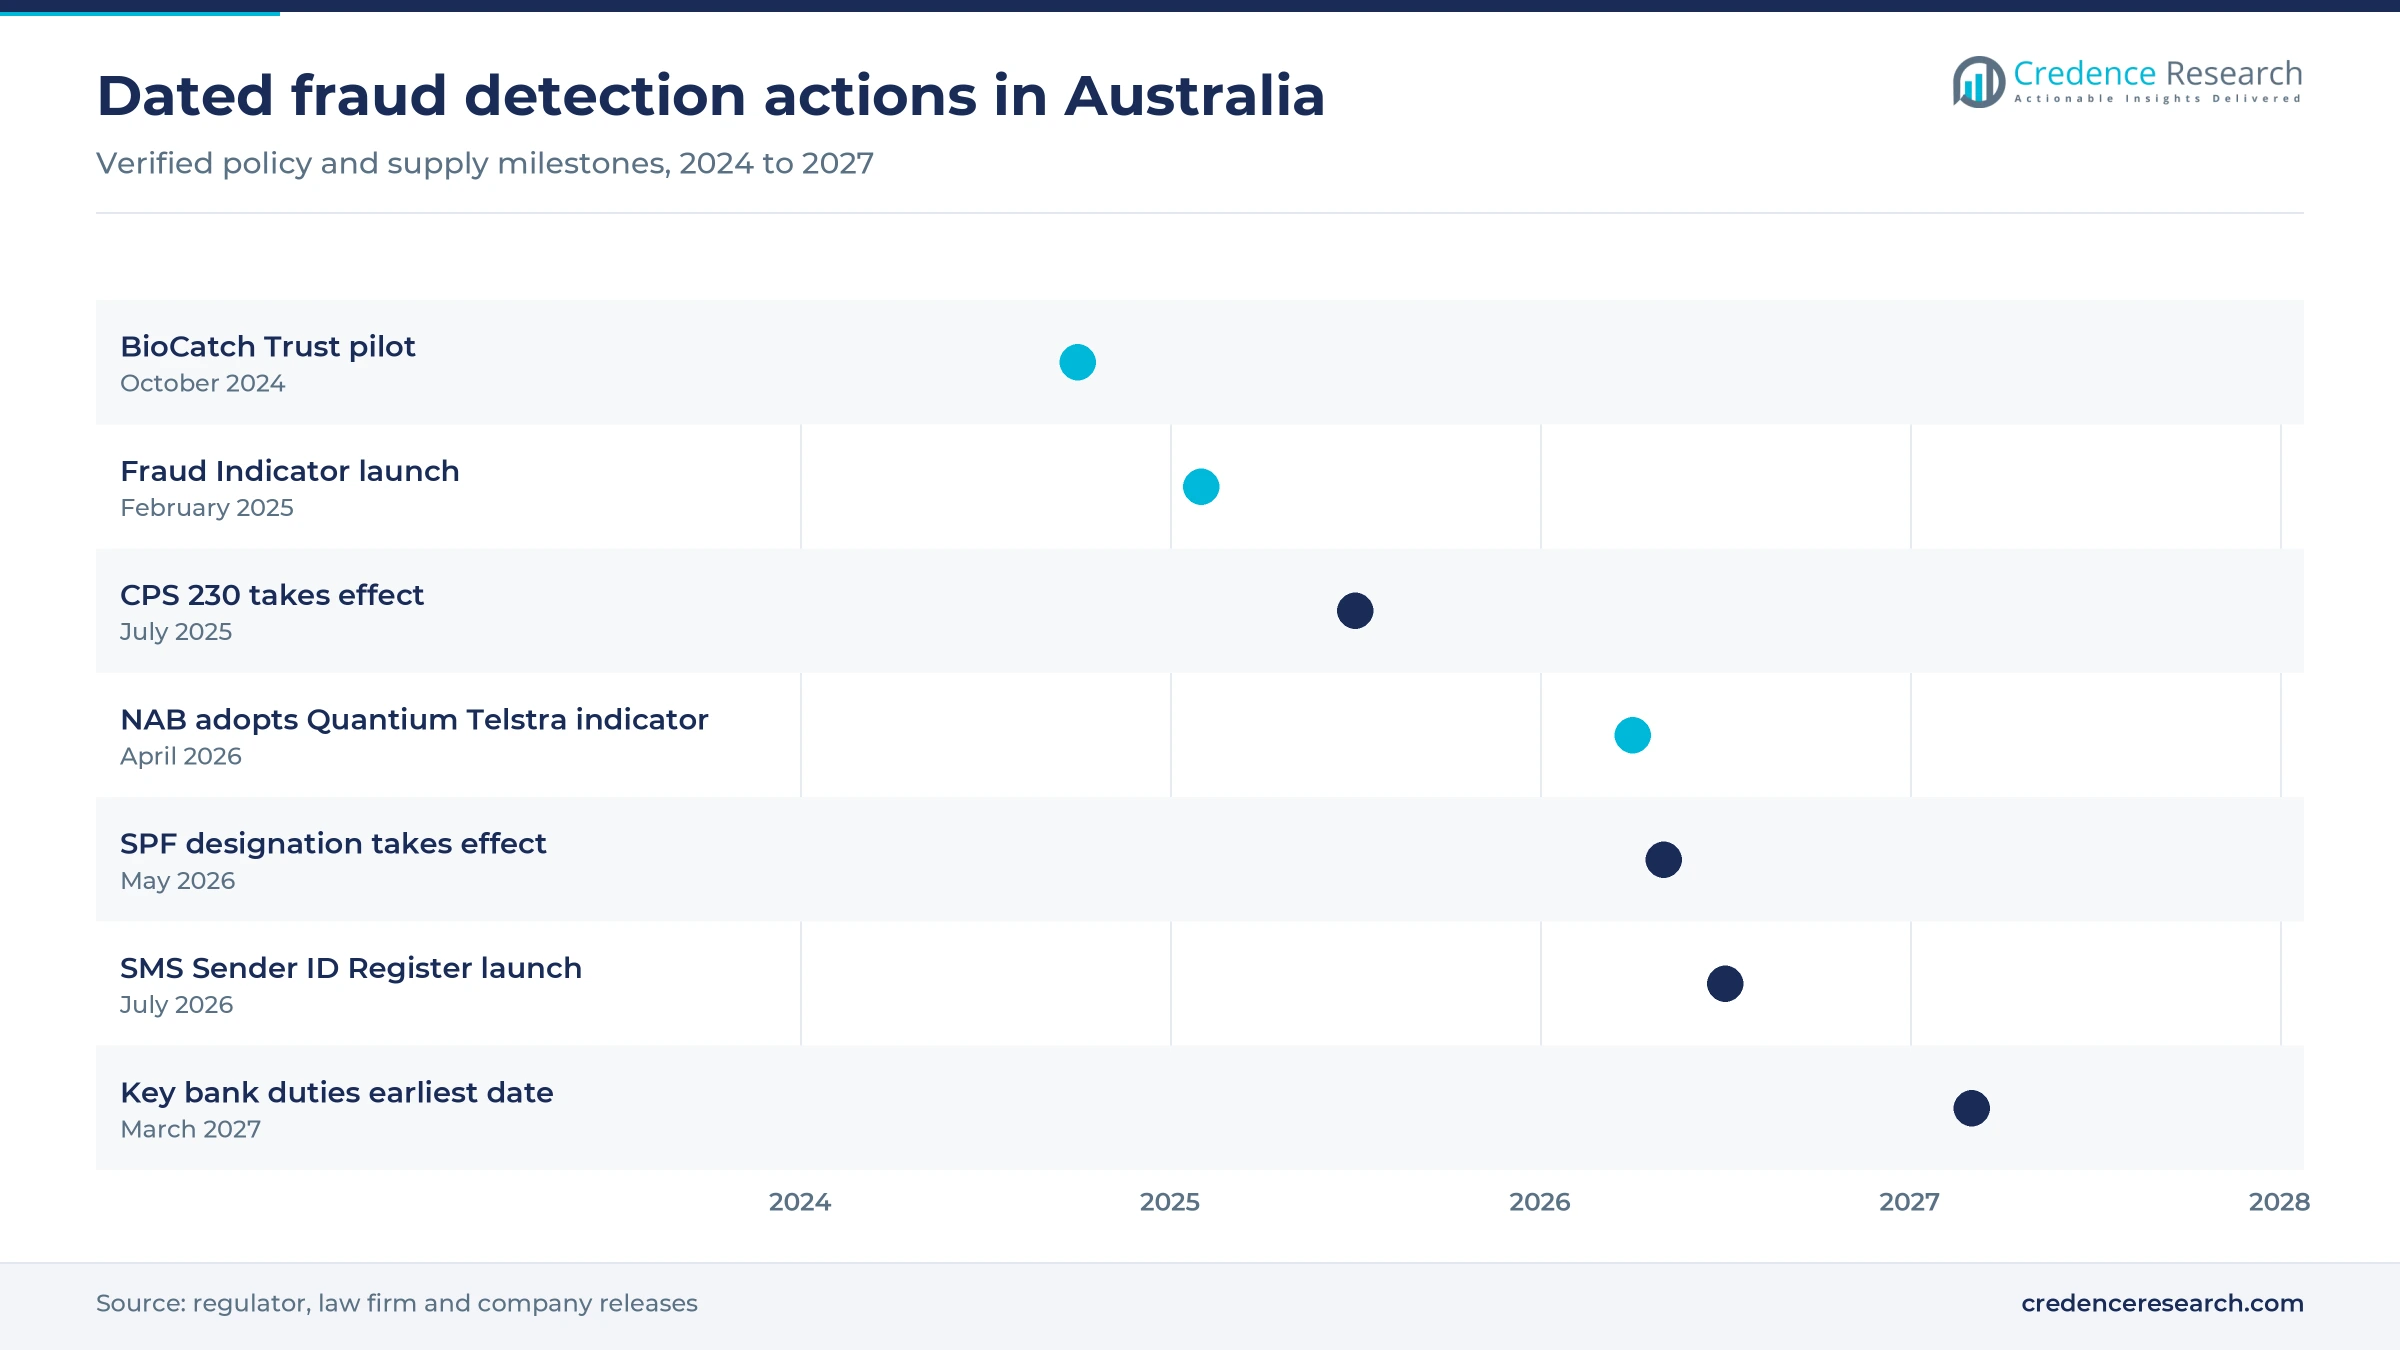
- The Scams Prevention Framework designated its first sectors in May 2026, with key bank obligations able to apply from March 31, 2027, reshaping fraud budgets.
- Shared networks are changing competition, since BioCatch Trust analyzed over 180 million Australian payments in the third quarter of 2025 across banks serving most customers.
Transaction engines lead as scam intelligence gains fastest
Why do transaction engines lead while scam intelligence grows fastest?
Based on solution type, the market is categorized into Transaction Risk Platforms, Financial Crime Intelligence Platforms, Behavioural and Scam Intelligence Platforms, and Fraud Operations and Infrastructure. Transaction Risk Platforms led with 38.0% of 2025 value because Australian-issued cards alone carried 5.78 million fraudulent transactions in the year to June 2025, according to AusPayNet, and each one needs a scored decision. Behavioural and Scam Intelligence Platforms grow fastest at 21.16% a year as BioCatch Trust analyzed more than 180 million payments in the third quarter of 2025, according to Biometric Update, and flagged over AUD 60 million in attempted fraud.
How is deployment shifting toward hosted fraud services?
Based on deployment model, the market is categorized into Cloud, Hybrid and On-Premises. Cloud led with 46.0% of 2025 value and is also the fastest at 20.08% a year, because smaller institutions prefer hosted services to running models themselves. Greater Bank, a Newcastle lender with more than 270,000 customers, replaced four or five legacy fraud and anti-money laundering systems with a SAS hosted managed service on Microsoft Azure, according to iTnews in June 2022. Major banks also layer new models over existing estates, as CommBank integrated its agentic system into an existing fraud framework during April 2026, according to SecurityBrief Australia.
Which industries fund the most detection spending?
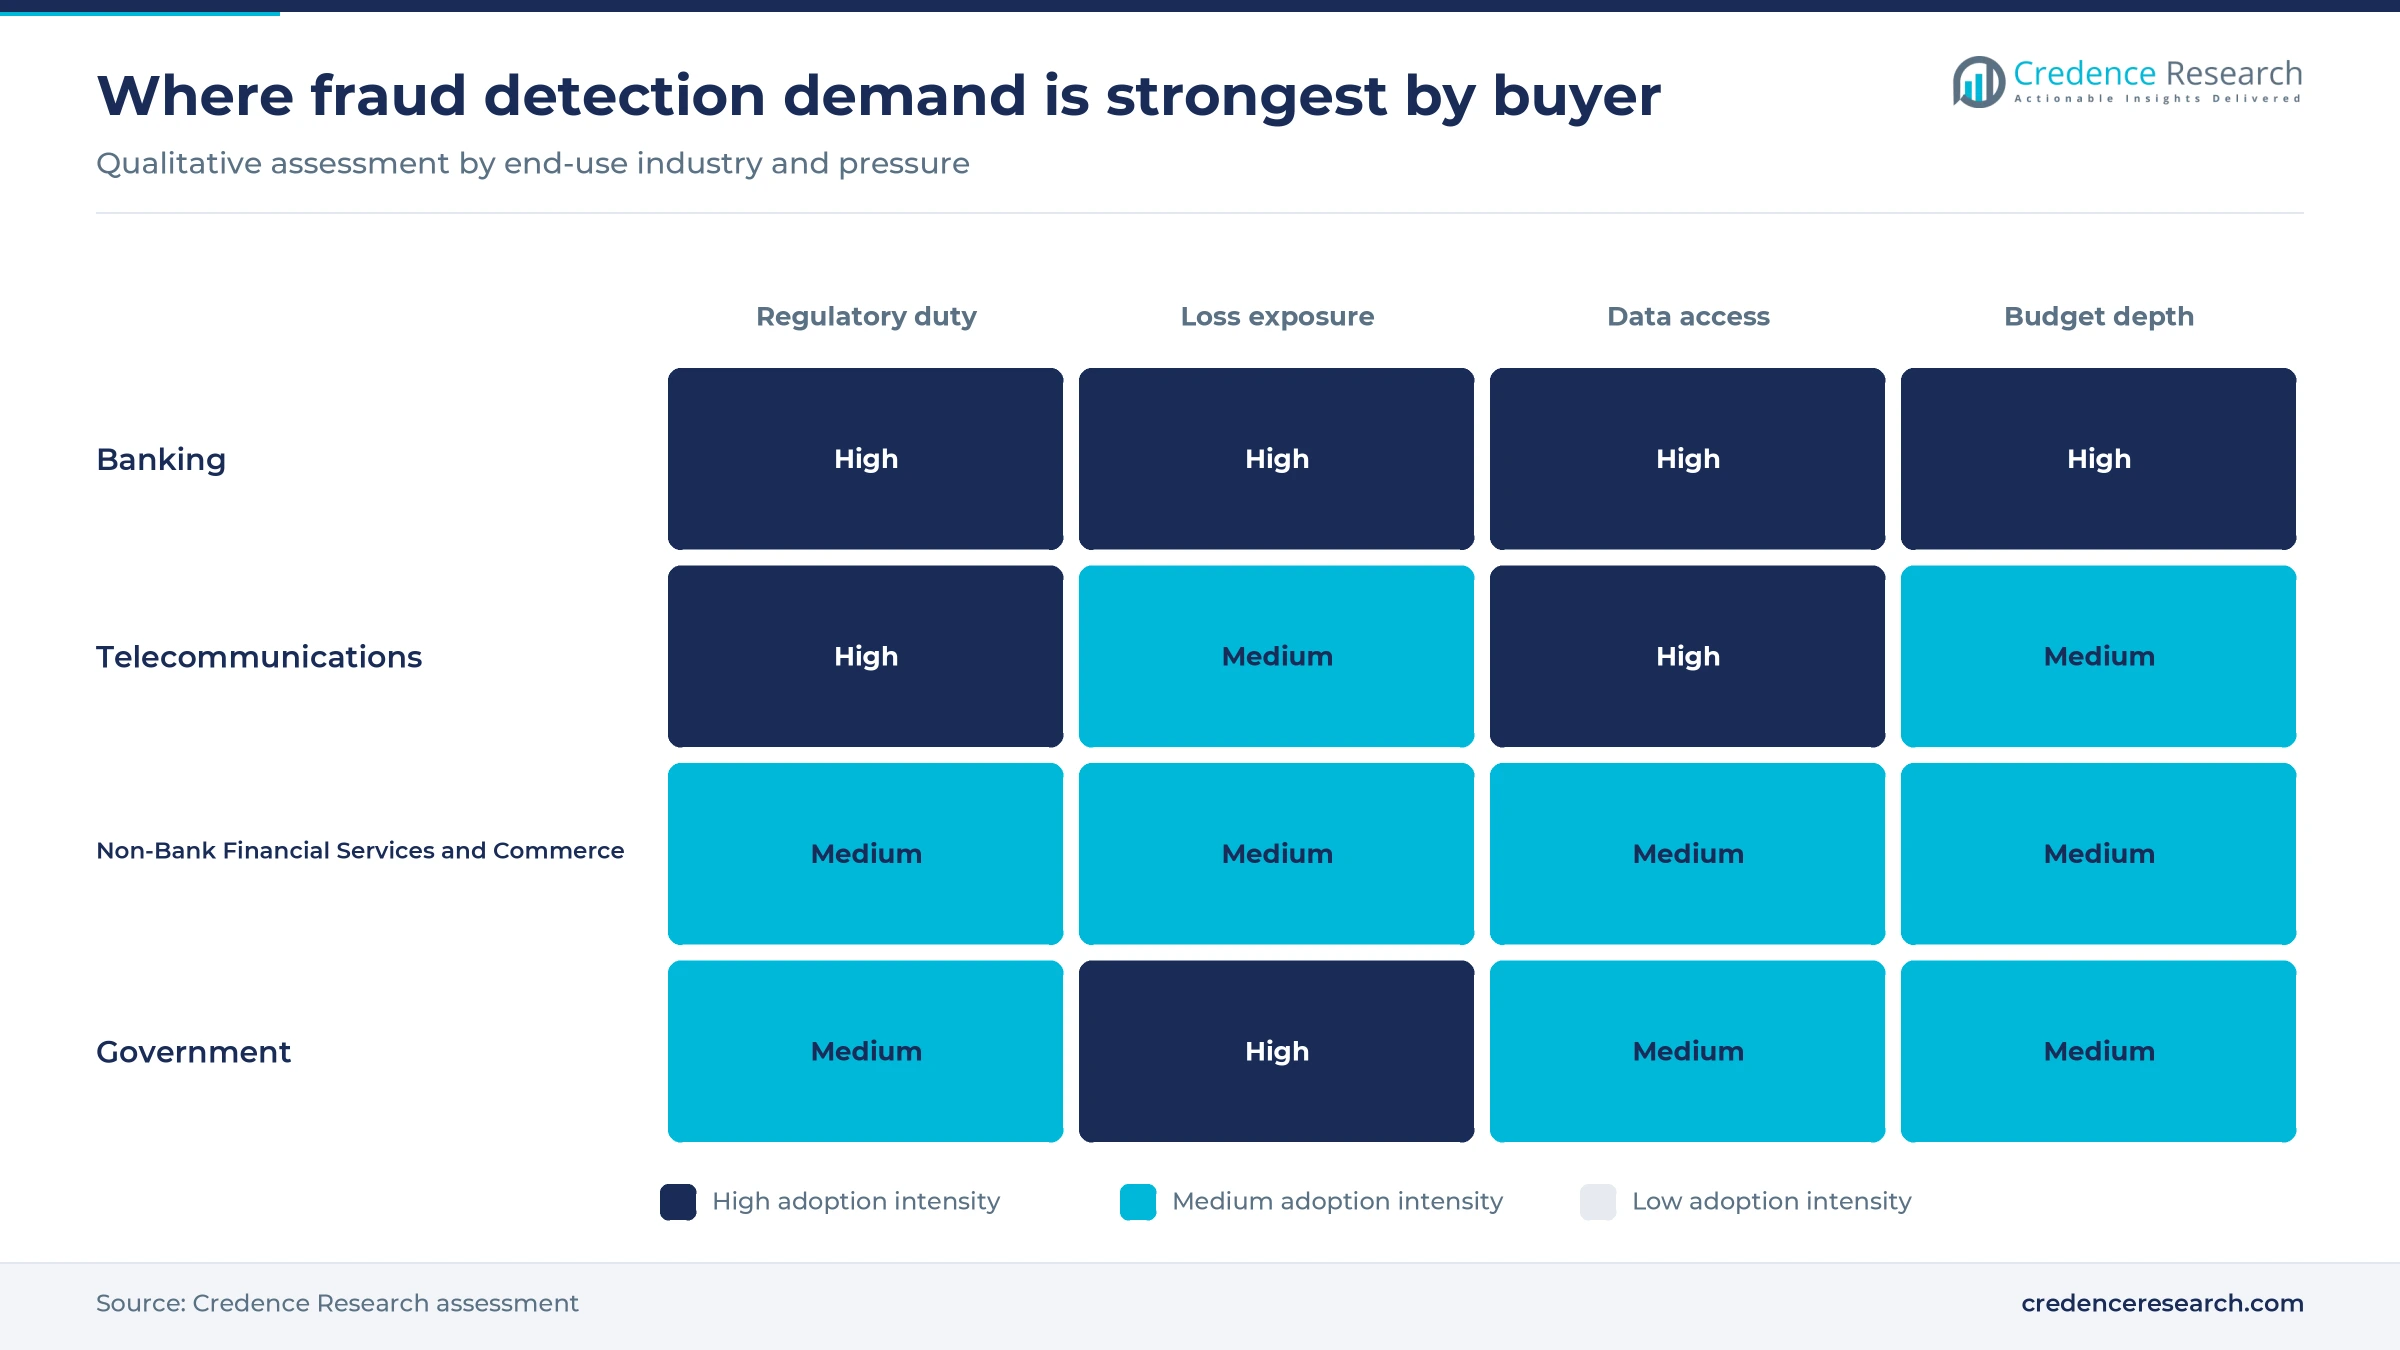
Based on end-use industry, the market is categorized into Banking, Telecommunications, Non-Bank Financial Services and Commerce, and Government. Banking led with 63.0% of 2025 value because CommBank alone reports AUD 1 billion of annual spending on fraud, scams, cyber threats and financial crime, according to SecurityBrief Australia in April 2026. Telecommunications grows fastest at 21.43% a year as carriers now sell signals as well as block traffic, with NAB adopting a Quantium Telstra product combining more than 60 risk signals in April 2026, and telcos blocking 492.7 million scam calls during 2025, according to the Australian Communications and Media Authority.
Why are authorised scams the fastest-growing application?
Based on application, the market is categorized into Unauthorised Payment Fraud, Authorised Payment Scams, Account and Identity Fraud, and Digital Claims and Public Payment Fraud. Unauthorised Payment Fraud led with 34.0% of 2025 value because card fraud reached AUD 854 million in the year to June 2025, according to AusPayNet, and established scoring budgets sit there. Authorised Payment Scams grow fastest at 20.76% a year as reported scam losses reached AUD 2.18 billion in 2025, according to the Australian Competition and Consumer Commission, and customers bore 96% of big bank scam losses in the period reviewed by ASIC in Report 761.
| Segment Group | Leading Sub-segment | Share, 2025 | Fastest-growing Sub-segment | CAGR, 2026–2035 |
|---|---|---|---|---|
| By Solution Type | Transaction Risk Platforms | 38.0% | Behavioural and Scam Intelligence Platforms | 21.16% |
| By Deployment Model | Cloud | 46.0% | Cloud | 20.08% |
| By End-Use Industry | Banking | 63.0% | Telecommunications | 21.43% |
| By Application | Unauthorised Payment Fraud | 34.0% | Authorised Payment Scams | 20.76% |
Request a Free Sample
Fill in your details and we'll send you a free sample report.
- Sample data tables & charts
- Research methodology
Binding scam duties and rising losses are funding AI models
Cross-sector scam prevention duties create a compliance budget
Cross-sector law is the strongest fraud detection demand trigger because it creates a duty shared by banks, carriers and platforms. Parliament passed the framework on Feb. 13, 2025, with penalties of up to AUD 50 million per offense reported by Jones Day. Herbert Smith Freehills Kramer reports that the designation instrument took effect on May 23, 2026, and the earliest date for key bank obligations is March 31, 2027. The draft bank code asks for systems that detect scams, identify affected consumers and block scam-linked accounts, which favors machine learning over static rules. As a result, compliance teams now sit beside fraud teams in purchasing decisions, and banking still accounts for 63.0% of 2025 value.
Real-time payment protection pushes scoring before funds move
Instant account-to-account payments leave little recovery time, so banks want a decision before money moves. Banks unveiled Confirmation of Payee in July 2025 after investing AUD 100 million, with rollout planned across more than 100 banks, credit unions and payment providers, according to Finextra. The name check only addresses one step, however, so banks also score the receiving account. The BioCatch Trust network retrieved a beneficiary account profile in more than 70% of transactions during the third quarter of 2025, according to Biometric Update, which allows risk assessment before funds leave. In turn, this pattern supports continuing spending on Transaction Risk Platforms, which held 38.0% of 2025 value.
Scam and identity exposure keeps fraud on board agendas
Loss levels keep the problem visible even as some measures improve. The Australian Competition and Consumer Commission reported 481,523 scam reports and AUD 2.18 billion in losses for 2025, up 7.8% on 2024, with investment scams alone at AUD 837.7 million. AusPayNet recorded AUD 854 million of card fraud in the year to June 2025, when card spending reached AUD 1.2 trillion. The Australian Bureau of Statistics said on March 12, 2026 that 3.2 million Australians experienced personal fraud in 2024-25. The same release showed 72% of card fraud victims were fully repaid by their bank or card issuer, so issuers carry much of that cost directly, which strengthens the return case for better detection.
Prudential rules raise the standard for fraud systems
Prudential and financial crime rules add a second budget line beyond scam law. APRA CPS 230 took effect on July 1, 2025, and Clifford Chance notes that service providers must meet the same operational risk standards as the regulated entity. AUSTRAC transition rules took effect on March 31, 2026, and tranche two sectors came under regulation on July 1, 2026, according to FinTech Global. Those changes increase demand for anti-money laundering software that shares data with fraud teams. As a result, buyers now favor vendors that document model behavior, contingency plans and audit trails, which supports Cloud services holding 46.0% of 2025 value.
Banks are buying shared signals rather than isolated models
Shift toward shared interbank intelligence networks
Banks are moving from isolated models toward shared signals because mule accounts move funds between institutions. ANZ, Commonwealth Bank, NAB, Westpac and Suncorp Bank began a BioCatch Trust pilot on Oct. 1, 2024, according to Information Age from the Australian Computer Society. By the third quarter of 2025 the network covered more than AUD 330 billion in payments and most of the banked population, according to Biometric Update. Macquarie Bank later joined that network in August 2025, according to brokernews.com.au. The National Anti-Scam Centre also joined the Australian Financial Crimes Exchange intelligence loop in June 2024, according to iTnews. This shift explains why Behavioural and Scam Intelligence Platforms grow at 21.16% a year.
Rise of telco signals inside bank decision engines
Telco data is emerging as a bank fraud input because a suspicious call often precedes a scam payment. CommBank and Telstra launched Fraud Indicator on Feb. 10, 2025, and CommBank expected its detection of fraudulently opened accounts to improve by more than 25%, according to Finextra. Telstra said on April 23, 2026 that NAB was adopting the Quantium Telstra Scam and Fraud Indicator, which brings together more than 60 risk signals through one API. Scam Indicator also reached landlines in August 2024, according to iTnews, where 85% of residential services belong to people over 60. Consequently, Telecommunications is the fastest end-use group at 21.43% a year.
Opportunity in customer-owned and regional banks
Smaller lenders offer an open fraud detection opportunity because their performance gap is measurable. ASIC reviewed 15 banks outside the four majors in Report 790, published on Aug. 20, 2024, and found they stopped 19% of scam transactions by value, with results varying significantly between banks. Customer-owned banks lodged more than 3,000 Fraud Reporting Exchange requests during 2025, according to the National Anti-Scam Centre. Greater Bank showed a route for such lenders in June 2022 by taking SAS as a managed service for its 270,000 customers. Vendors that package models, data and operations for these institutions can reach buyers that cannot justify a dedicated data science team.
Opportunity in digital claims and public payment integrity
Public payment integrity is an open opportunity because federal agencies have dedicated funding and a broad remit. The Australian National Audit Office says the Fraud Fusion Taskforce started in November 2022 with AUD 126.3 million over four years, and Services Australia received a further AUD 23.5 million over two years in the 2024-25 budget. The taskforce links 21 other agencies with its two co-leads, creating a large shared data problem. Services Australia also planned myGov controls for high-risk transactions by June 2025, according to iTnews in August 2024. Insurers face a similar task, and insurance claims analytics methods can transfer to benefit claims, supporting the Behavioural and Scam Intelligence Platforms and operations layers.
Evidence, liability and AI governance gaps slow purchasing
Liability rules are still unfinished for buyers
Purchasing is harder while several key framework rules remain open for lenders. Treasury published only draft sector codes on May 28, 2026, and Herbert Smith Freehills Kramer lists the external dispute instrument, the refined scam definition and the information sharing rules as outstanding. Banks therefore size programs against draft codes, and vendors cannot promise a fixed compliance scope. Phased contracts reduce that risk, since buyers can extend modules once the final rules are published.
Detection results remain uneven and hard to compare
Buyers struggle to compare products because public performance evidence is thin. ASIC found the four major banks stopped about 13% of scam payments in Report 761, while banks and BioCatch declined to disclose false-positive rates, according to Information Age in November 2024. CommBank also gave no loss or false-positive results for its April 2026 agentic system, according to SecurityBrief Australia. Pilots with agreed metrics remain the practical answer for procurement teams.
AI governance gaps slow model approval
Model approvals take longer as supervisors press boards on AI risk. APRA wrote to banks, insurers and superannuation managers on April 30, 2026, saying assurance practices were not keeping pace with AI scale, speed and complexity, according to The Nightly. That letter affects fraud models directly because they make automated payment decisions. Institutions respond with added documentation and human review points, which lengthens deployment but gives vendors with audit tooling an advantage.
Scammers shift channels faster than models adapt
Controls in one channel push criminals toward another, so models age quickly. Scamwatch text message reports fell from 77,365 in 2024 to 29,058 in 2025, according to the Australian Competition and Consumer Commission, while Scamwatch online reports with a loss rose 31.8%. Biometric Update also reported account takeover attempts up 47% in a year during November 2025. Criminals also rebuild quickly, since the OECD says ASIC was removing an average of 230 investment scam websites a week as of February 2026. Buyers therefore face frequent retraining costs, which favors continuously updated services.
New South Wales leads as Queensland grows the fastest
| Region | Value, 2025 (USD million) | Share, 2025 | CAGR, 2026–2035 |
|---|---|---|---|
| New South Wales | 68.5 | 40.2% | 18.92% |
| Victoria | 51.0 | 29.9% | 19.22% |
| Queensland | 42.1 | 24.7% | 19.62% |
| Remaining States and Territories | 8.9 | 5.2% | 18.82% |
New South Wales holds the largest buying base
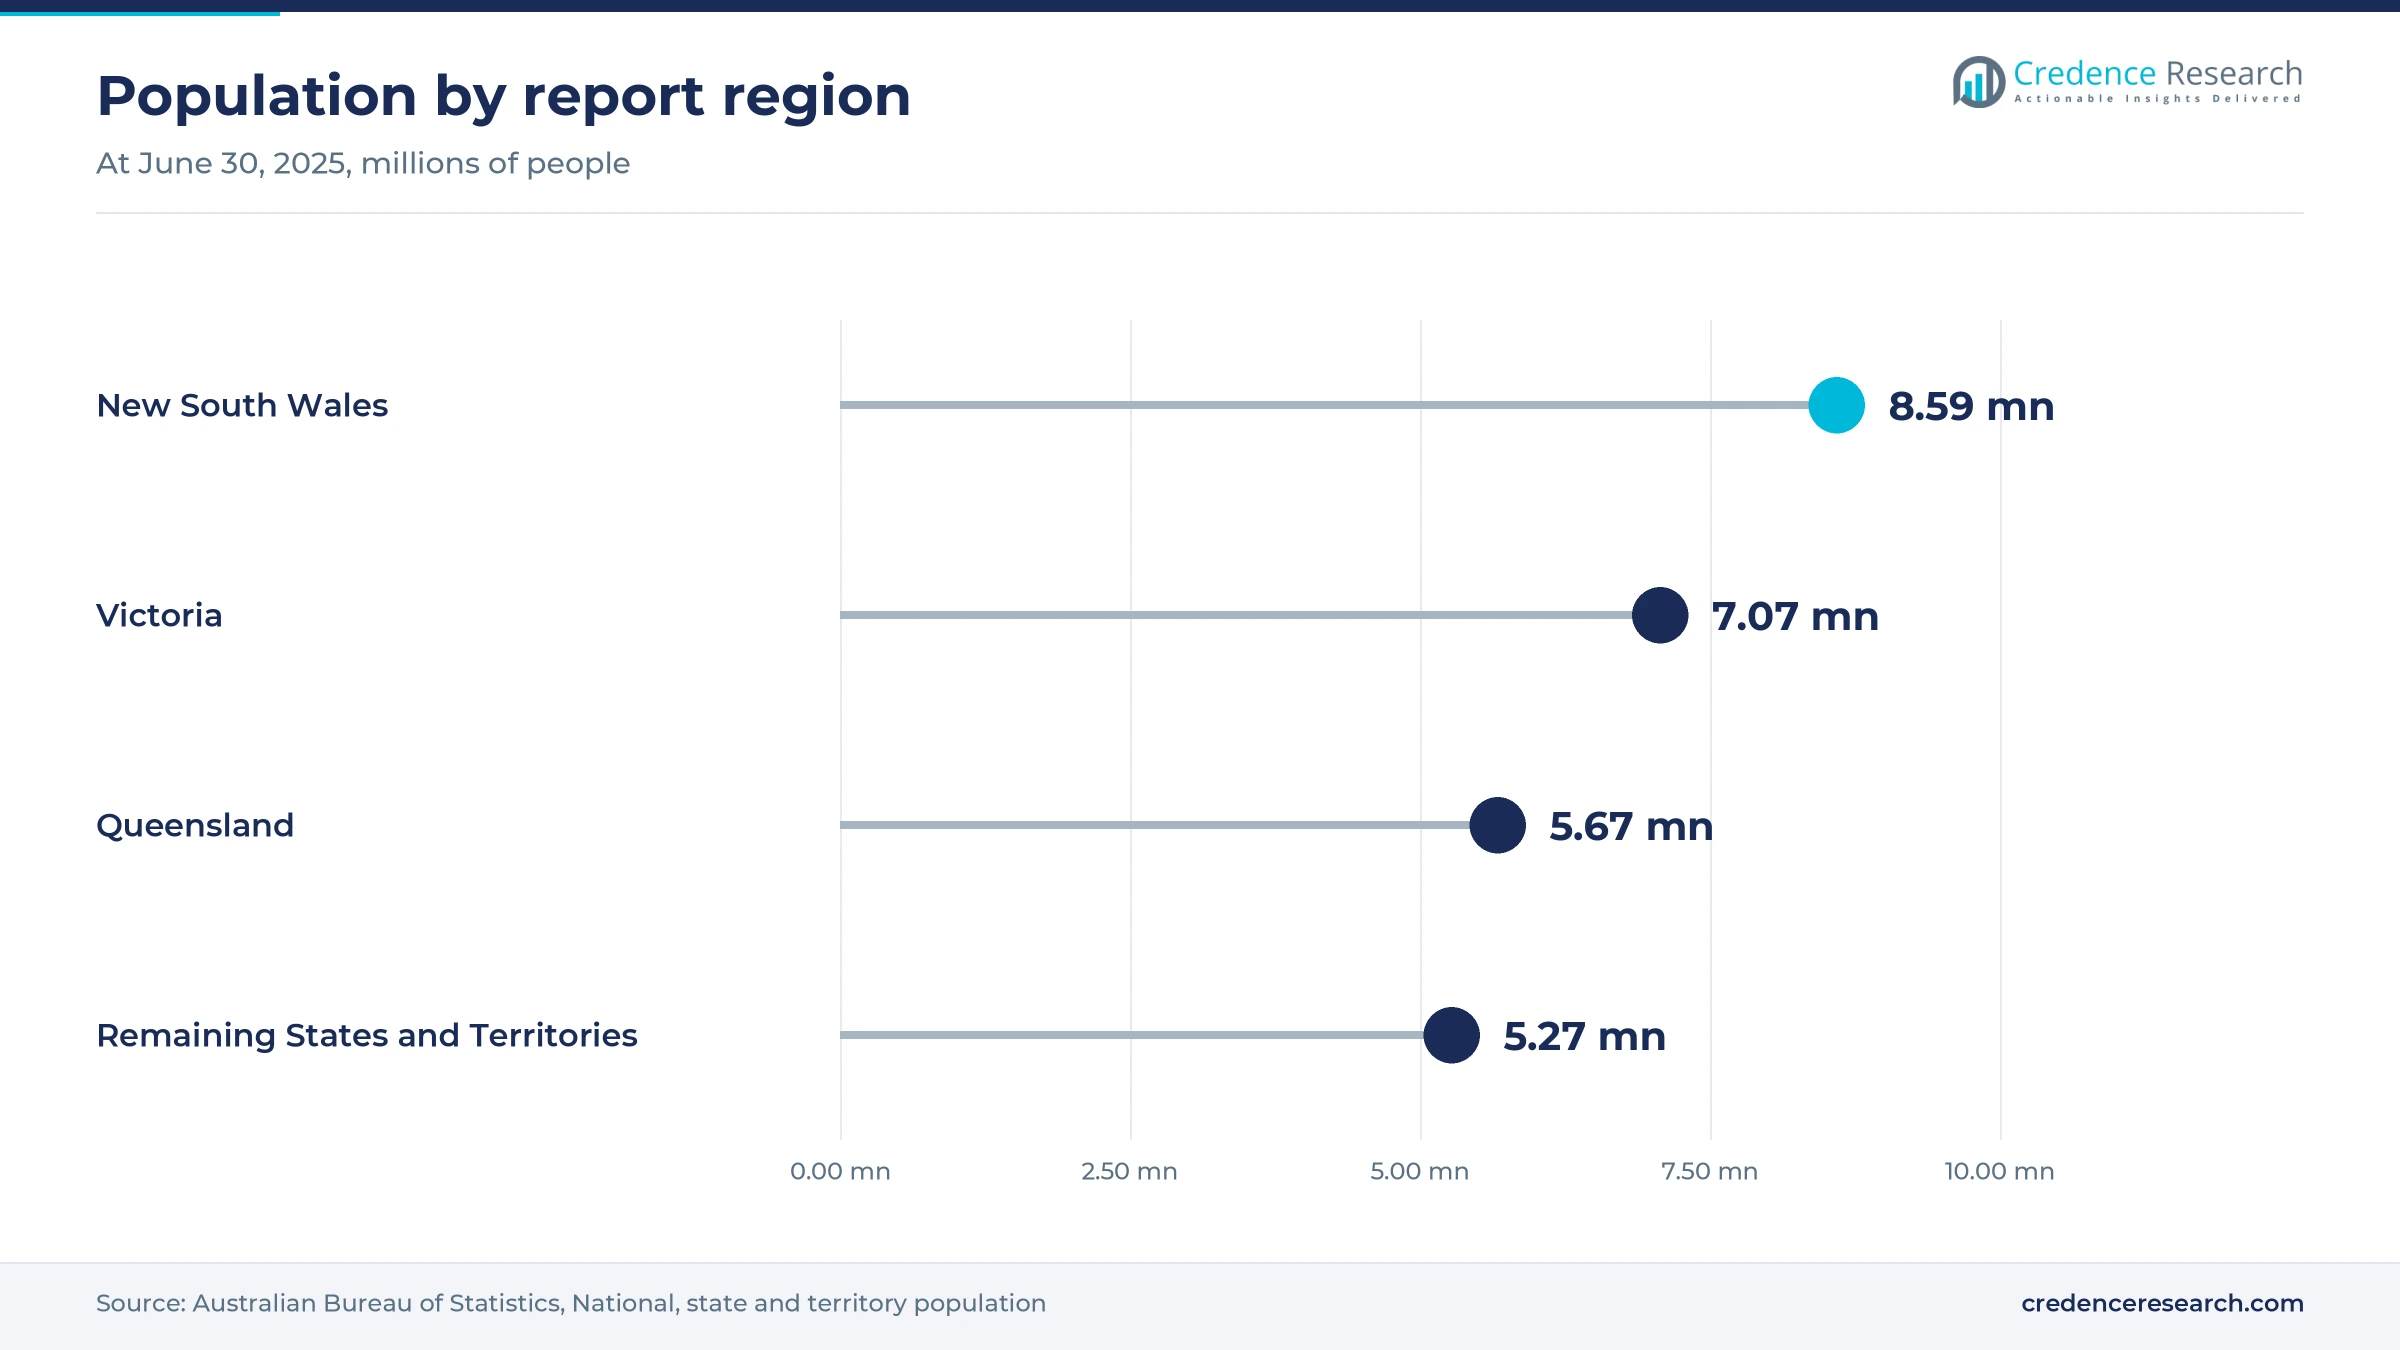
New South Wales held 40.2% of 2025 value and grows at 18.92% a year, from the largest state population of about 8.59 million in June 2025, according to the Australian Bureau of Statistics. That population is 31.1% of the national total, so the share also reflects concentrated financial buying rather than headcount alone. Newcastle-based Greater Bank provides a regional example, having moved its fraud and financial crime platform to a SAS managed service for 270,000 customers.
Victoria follows with steady growth in population
Victoria held 29.9% of 2025 value and grows at 19.22% a year, supported by a population of about 7.07 million that rose 1.8% in the year to June 2025, according to the Australian Bureau of Statistics. That growth adds 123,500 residents, the largest increase of any state, widening the pool of retail accounts and digital service users. Victorian demand therefore rests on national bank and telecommunications programs as well as a steadily expanding customer base.
Queensland records the fastest regional growth
Queensland held 24.7% of 2025 value and grows fastest at 19.62% a year, from a population of about 5.67 million, or 20.5% of the national total. The Australian Bureau of Statistics recorded growth of 1.8% in the year to June 2025, or 97,900 people. Suncorp Bank also joined the October 2024 BioCatch Trust pilot, according to Information Age. That share therefore sits above the state's population weight, a gap that rests on Credence Research estimates rather than published fraud-technology spending data.
Remaining states and territories start from a small base
Remaining States and Territories held 5.2% of 2025 value and grow at 18.82% a year, well below their 22.7% population weight of about 6.28 million people. The Credence Research model reads the gap as purchasing run through national bank and carrier contracts, which it assigns to the eastern states. Western Australia grew fastest nationally at 2.2% in the year to June 2025, according to the Australian Bureau of Statistics, while Tasmania grew 0.2%.
Banks, telcos and regulators are moving together
| Development | Status and market relevance |
|---|---|
| In April 2026, NAB adopted the Quantium Telstra Scam and Fraud Indicator, which combines more than 60 telco risk signals through one API. | Live adoption; adds telco signals to NAB fraud systems before funds leave an account. |
| In April 2026, CommBank announced an agentic AI system that finds emerging fraud patterns and generates rules within its fraud framework. | Deployed; part of AUD 1 billion annual spending, with no result figures disclosed. |
| In May 2026, the Scams Prevention Framework designation instrument took effect for banks, telecommunications services and digital platforms. | In force; key bank duties can apply from March 31, 2027. |
| In July 2026, the SMS Sender ID Register launched, with telcos applying an Unverified label to unregistered sender IDs. | Operating; the Australian Communications and Media Authority cites penalties up to AUD 250,000 per contravention. |
| In July 2025, Australian banks unveiled Confirmation of Payee following AUD 100 million of investment under the Scam-Safe Accord. | Rolling out across more than 100 banks, credit unions and payment providers. |
Behavioral, telco and agentic models are widening detection
- Behavioral biometrics reads session, device and account patterns, and BioCatch Trust uses them to assess the receiving account before funds move between banks.
- Telco signal APIs add call and mobile service data to bank decisions, with Quantium Telstra combining more than 60 risk signals in one service.
- Agentic AI searches transaction data for new patterns and proposes rules, as CommBank described in April 2026 alongside tools that monitor 80 million signals a day.
- Real-time call assistants summarize phone conversations for fraud staff, and Westpac disclosed such a pilot in May 2025 that may also detect a scammer coaching a customer.
Need a Custom Version of This Report?
Tailor the scope, geography, or segments to your exact requirements.
- Custom geography or segment scope
- Direct access to our analyst team
Global engines compete with local shared-signal networks
Competition splits between global scoring engines and local networks built on shared data. SAS sells fraud and anti-money laundering decisioning as a hosted managed service, while IBM Safer Payments was used by Volt Bank through a partner platform before that lender closed its deposit business in June 2022. BioCatch competes through network effects, since the largest Australian banks feed its Trust service. Quantium Telstra holds an unusual position because its telco signals are difficult for a software rival to reproduce. Visa completed its purchase of Featurespace on Dec. 20, 2024, which ties real-time AI payment protection to a card network. Vendors also face in-house competition, as ANZ reported more than 170 new algorithms and biometrics capabilities in December 2024. Buyers increasingly compare identity verification add-ons, audit evidence and managed delivery, and many hand alerts to managed security operations only when incidents cross into system compromise.
Who supplies Australian banks and carriers with detection tools?
| Company | Type | Role in the market |
|---|---|---|
| SAS Institute | Global analytics vendor | Runs hosted fraud and anti-money laundering decisioning for Greater Bank on Microsoft Azure. |
| BioCatch | Behavioral intelligence vendor | Operates the BioCatch Trust network used by major Australian banks since an October 2024 pilot. |
| Quantium Telstra | Local data and analytics business | Develops Scam Indicator and Fraud Indicator used by CommBank, and a combined product adopted by NAB. |
| IBM Safer Payments | Global payment fraud product | Used by Volt Bank through a partner platform, as reported in July 2020, before Volt closed its deposit business in June 2022. |
| FICO | Global scoring vendor | Publishes Australian scam research, with an April 2025 survey of 1,004 adults on payment scam concerns. |
Network access will matter as much as model accuracy
Credence Research's view is that access to shared signals will separate vendors more than raw model accuracy through 2030. The National Anti-Scam Centre figure of AUD 2.18 billion shows that losses remain large despite heavy spending, and the end-2027 information sharing rules will reward firms that already exchange data across sectors. Banks will likely keep core transaction engines and add behavioral and telco layers around them. The most assumption-heavy figure in this report is the banking share, because institutions rarely separate AI fraud spending from broader financial crime budgets.
How Credence Research built the Australian estimates
The report uses 2025 as the base year and forecasts market value to 2035 from the Credence Research model. Segment and regional splits are Credence Research estimates, informed by regulator releases, official statistics, industry body data, company announcements and trade press opened during research. Named sources include the Australian Competition and Consumer Commission, AusPayNet, the Australian Bureau of Statistics, ASIC and the Australian National Audit Office. No interviews or surveys were conducted for this edition, and vendor activity is described only where a public source confirmed it.
Mandatory duties from 2027 set the pace of spending to 2035
Spending should accelerate as the framework moves from design to enforcement, with the key bank duties able to apply from March 31, 2027 and sharing duties expected by the end of 2027. The market is projected to reach USD 984.1 million by 2035 at a 19.18% CAGR, with Authorised Payment Scams and Telecommunications providing the fastest growth. Growth will probably depend on the final codes for banks and telcos, and on whether AI results can be evidenced to supervisors. Smaller lenders and public agencies should broaden the buyer base through managed services over the period.
Frequently Asked Questions
How big is the Australia AI-powered cyber fraud detection market?
What is driving demand for these fraud detection tools?
Which end-use industry leads the market?
Which state holds the largest share?
When do the main scam duties apply to banks?
Why is telecommunications growing so fast in this market?
Which companies are active in the market?
What is the main challenge for buyers?
Table of Content
Chapter 1 Market Segmentation
- 1.1 Segmentation Framework
- 1.1.1 Product and Service Classification
- 1.1.2 Application and End-Use Classification
- 1.1.3 Technology and Solution Classification
- 1.1.4 Customer and Distribution Channel Classification
- 1.1.5 Geographic Segmentation
- 1.1.6 Market Segment Definitions and Boundaries
- 1.2 By Solution Type
- 1.2.1 Transaction Risk Platforms
- 1.2.2 Financial Crime Intelligence Platforms
- 1.2.3 Behavioural and Scam Intelligence Platforms
- 1.2.4 Fraud Operations and Infrastructure
- 1.3 By Deployment Model
- 1.3.1 Cloud
- 1.3.2 Hybrid
- 1.3.3 On-Premises
- 1.4 By End-Use Industry
- 1.4.1 Banking
- 1.4.2 Telecommunications
- 1.4.3 Non-Bank Financial Services and Commerce
- 1.4.4 Government
- 1.5 By Application
- 1.5.1 Unauthorised Payment Fraud
- 1.5.2 Authorised Payment Scams
- 1.5.3 Account and Identity Fraud
- 1.5.4 Digital Claims and Public Payment Fraud
Chapter 2 Introduction
- 2.1 Report Objectives and Scope
- 2.2 Product Definition and Industry Terminology
- 2.3 Market Inclusions and Exclusions
- 2.4 Research Process
- 2.4.1 Primary Research and Expert Interviews
- 2.4.2 Secondary Research and Source Review
- 2.4.3 Top-Down and Bottom-Up Estimation
- 2.4.4 Data Triangulation and Verification
- 2.5 Market Size Measurement Basis
- 2.5.1 2025: USD 170.5 million → 2035: USD 984.1 million
- 2.6 Historical and Forecast Reference Periods
- 2.6.1 Historical Period: 2018-2025
- 2.6.2 Base Year: 2025
- 2.6.3 Forecast Period: 2025-2035
- 2.7 Research Assumptions and Limitations
Chapter 3 Executive Summary
- 3.1 Market Snapshot and Key Findings
- 3.2 Base-Year Market Size, 2025
- 3.3 Forecast Market Size, 2035
- 3.4 Revenue and Volume Growth Outlook
- 3.5 Key Demand and Supply Indicators
- 3.6 Leading Market Segments
- 3.7 Fastest-Growing Market Opportunities
- 3.8 Regional Performance Highlights
- 3.9 Technology and Industry Transformation
- 3.10 Competitive Landscape Summary
- 3.11 Analyst View and Strategic Implications
Chapter 4 Australia AI-Powered Cyber Fraud Detection Market Trends and Developments
- 4.1 Historical Industry Development, 2018-2025
- 4.2 Recent Market Trends and Developments
- 4.3 Demand and Customer Behavior Trends
- 4.4 Technology and Product Innovation
- 4.5 Artificial Intelligence, Automation and Digitalization
- 4.6 Local Manufacturing and Supply Chain Realignment
- 4.7 Industry Partnerships, Mergers and Acquisitions
- 4.8 Sustainability and Circular Economy Developments
- 4.9 Government and Private Sector Investment Trends
- 4.10 Emerging Business Models and Commercialization
- 4.11 Industry Developments and Announcements
Chapter 5 Australia AI-Powered Cyber Fraud Detection Market Supply and Demand Analysis
- 5.1 Demand Trend and Consumption Analysis, 2018-2025
- 5.2 Demand Forecast, 2025-2035
- 5.3 Supply Chain Structure and Procurement Trends
- 5.4 Supply-Demand Gap and Bottlenecks
- 5.5 Import Dependence and Sourcing Structure
- 5.6 Regional Supply and Demand Concentration
Chapter 6 Australia AI-Powered Cyber Fraud Detection Market Pricing Analysis
- 6.1 Pricing Structure and Measurement
- 6.2 Historical Pricing Trends, 2018-2025
- 6.3 Pricing Outlook, 2025-2035
- 6.4 Pricing by Product and Market Segment
- 6.5 Geographic Pricing Differences
- 6.6 Key Input, Energy, Labor and Logistics Costs
- 6.7 Contract Pricing and Purchasing Models
- 6.8 Pricing Sensitivity and Competitive Positioning
- 6.9 Price, Margin and Profitability Implications
Chapter 7 Australia AI-Powered Cyber Fraud Detection Market Dynamics
- 7.1 Market Growth Drivers
- 7.1.1 Demand-Side Drivers
- 7.1.2 Technology and Innovation Drivers
- 7.1.3 Infrastructure and Investment Drivers
- 7.1.4 Regulatory and Policy Drivers
- 7.2 Market Restraints
- 7.2.1 Cost and Affordability Constraints
- 7.2.2 Technology and Adoption Barriers
- 7.2.3 Supply Chain and Operational Constraints
- 7.3 Market Challenges
- 7.3.1 Competitive Pressure and Margin Erosion
- 7.3.2 Skills, Infrastructure and Implementation Gaps
- 7.4 Emerging Market Opportunities
- 7.5 Market Dynamics Impact and Time-Horizon Assessment
Chapter 8 Australia AI-Powered Cyber Fraud Detection Value Chain Analysis
- 8.1 Industry Value Chain Overview
- 8.2 Upstream Suppliers and Critical Inputs
- 8.3 Technology and Component Providers
- 8.4 Manufacturing or Service Delivery
- 8.5 Distribution, Channel Partners and Integrators
- 8.6 Downstream Applications and End Users
- 8.7 Value Addition and Profit Pools
- 8.8 Vertical Integration and Outsourcing
- 8.9 Supplier Concentration and Risk
- 8.10 Supply Chain Localization and Resilience
Chapter 9 Australia AI-Powered Cyber Fraud Detection Market Regulations and Policies
- 9.1 Relevant Laws, Standards and Compliance Frameworks
- 9.2 Product, Service, Safety and Quality Requirements
- 9.3 Government Policies, Incentives and Subsidies
- 9.4 Imports, Exports and Trade Barriers
- 9.5 Public Procurement and Local Content Requirements
- 9.6 Data Protection, AI and Cybersecurity Compliance
- 9.7 Upcoming Policy Changes and Market Implications
Chapter 10 Australia AI-Powered Cyber Fraud Detection Market Hotspots and Opportunities
- 10.1 Market Opportunity Mapping and Growth Hotspots
- 10.2 High-Growth Applications and Customer Groups
- 10.3 Underserved Markets and White-Space Opportunities
- 10.4 Emerging Technology and Product Opportunities
- 10.5 New Capacity and Investment Hotspots
- 10.6 Market Entry and Expansion Opportunities
- 10.7 Distribution and Partnership Opportunities
- 10.8 Near-Term and Long-Term Commercial Potential
- 10.9 Opportunity Attractiveness and Execution Risks
Chapter 11 Australia AI-Powered Cyber Fraud Detection Market Outlook, 2025-2035
- 11.1 Market Size and Analysis
- 11.1.1 Revenue (Market Measurement: 2025: USD 170.5 million → 2035: USD 984.1 million)
- 11.1.2 Historical Market Size, 2018-2025
- 11.1.3 Base-Year Market Size, 2025
- 11.2 Market Forecast, 2025-2035
- 11.2.1 Revenue Forecast to 2035
- 11.2.2 CAGR and Year-on-Year Growth
- 11.2.3 Incremental Revenue Opportunity
- 11.3 Forecast Assumptions and Scenario Analysis
- 11.3.1 Base-Case Forecast
- 11.3.2 Optimistic and Conservative Scenarios
- 11.3.3 Technology, Pricing and Policy Sensitivities
- 11.4 Market Attractiveness and Growth Outlook
Chapter 12 Australia AI-Powered Cyber Fraud Detection Market Segmentation and Outlook
- 12.1 Segmentation Summary and Market Shares, 2025
- 12.2 Largest and Fastest-Growing Segments
- 12.3 By Solution Type - Market Size and Forecast, 2025-2035
- 12.3.1 Segment Definition and Scope
- 12.3.2 Historical Market Size, 2018-2025
- 12.3.3 Revenue Forecast, 2025-2035
- 12.3.4 Base-Year Market Share, 2025
- 12.3.5 Segment CAGR and Growth Drivers
- 12.3.6 Subsegment Market Size and Forecast
- 12.3.6.1 Transaction Risk Platforms
- 12.3.6.2 Financial Crime Intelligence Platforms
- 12.3.6.3 Behavioural and Scam Intelligence Platforms
- 12.3.6.4 Fraud Operations and Infrastructure
- 12.3.7 Subsegment Pricing and Adoption Trends
- 12.3.8 Leading Suppliers and Competition
- 12.3.9 Regional Demand and Opportunities
- 12.4 By Deployment Model - Market Size and Forecast, 2025-2035
- 12.4.1 Segment Definition and Scope
- 12.4.2 Historical Market Size, 2018-2025
- 12.4.3 Revenue Forecast, 2025-2035
- 12.4.4 Base-Year Market Share, 2025
- 12.4.5 Segment CAGR and Growth Drivers
- 12.4.6 Subsegment Market Size and Forecast
- 12.4.6.1 Cloud
- 12.4.6.2 Hybrid
- 12.4.6.3 On-Premises
- 12.4.7 Subsegment Pricing and Adoption Trends
- 12.4.8 Leading Suppliers and Competition
- 12.4.9 Regional Demand and Opportunities
- 12.5 By End-Use Industry - Market Size and Forecast, 2025-2035
- 12.5.1 Segment Definition and Scope
- 12.5.2 Historical Market Size, 2018-2025
- 12.5.3 Revenue Forecast, 2025-2035
- 12.5.4 Base-Year Market Share, 2025
- 12.5.5 Segment CAGR and Growth Drivers
- 12.5.6 Subsegment Market Size and Forecast
- 12.5.6.1 Banking
- 12.5.6.2 Telecommunications
- 12.5.6.3 Non-Bank Financial Services and Commerce
- 12.5.6.4 Government
- 12.5.7 Subsegment Pricing and Adoption Trends
- 12.5.8 Leading Suppliers and Competition
- 12.5.9 Regional Demand and Opportunities
- 12.6 By Application - Market Size and Forecast, 2025-2035
- 12.6.1 Segment Definition and Scope
- 12.6.2 Historical Market Size, 2018-2025
- 12.6.3 Revenue Forecast, 2025-2035
- 12.6.4 Base-Year Market Share, 2025
- 12.6.5 Segment CAGR and Growth Drivers
- 12.6.6 Subsegment Market Size and Forecast
- 12.6.6.1 Unauthorised Payment Fraud
- 12.6.6.2 Authorised Payment Scams
- 12.6.6.3 Account and Identity Fraud
- 12.6.6.4 Digital Claims and Public Payment Fraud
- 12.6.7 Subsegment Pricing and Adoption Trends
- 12.6.8 Leading Suppliers and Competition
- 12.6.9 Regional Demand and Opportunities
- 12.7 Segment Growth Comparison
- 12.8 Segment Attractiveness and Priority Matrix
Chapter 13 Australia AI-Powered Cyber Fraud Detection End-Use and Application Market Outlook
- 13.1 End-Use Industry and Customer Demand Structure
- 13.2 Leading Applications and Customer Groups
- 13.3 End-Use Market Size, Share and Forecast
- 13.4 Major End-Use Industry Deep Dives
- 13.4.1 Customer Requirements and Use Cases
- 13.4.2 Demand and Replacement Cycles
- 13.4.3 Technical and Regulatory Considerations
- 13.4.4 Purchasing and Procurement Models
- 13.4.5 Leading Vendors and Distribution Channels
- 13.4.6 Forecast and Commercial Opportunities
- 13.5 Emerging Applications and Cross-Segment Demand
- 13.6 End-Use Industry Investment Priorities
Chapter 14 Australia AI-Powered Cyber Fraud Detection Geographic Market Outlook, 2025-2035
- 14.1 Domestic Market Distribution and Demand Clusters
- 14.2 State- or Province-Wise Market Size and Forecast, 2025-2035
- 14.3 City and Metropolitan Market Outlook
- 14.4 Industrial, Manufacturing and Commercial Clusters
- 14.5 Geographic Concentration of Key End Users
- 14.6 Local Pricing and Purchasing Differences
- 14.7 Domestic Production Facilities and Capacity Map
- 14.8 Local Infrastructure and Project Pipeline
- 14.9 State-Level Policy and Incentive Differences
- 14.10 Subnational Investment Hotspots and Opportunities
- 14.11 Distribution and Logistics Networks
- 14.12 Domestic Competitive Footprint
Chapter 15 Australia AI-Powered Cyber Fraud Detection Technology, Innovation and Sustainability Outlook
- 15.1 Technology Landscape and Maturity
- 15.2 Product, Process and Service Innovation
- 15.3 AI, Automation and Digital Tools in the Industry
- 15.4 Technology Adoption and Performance Benchmarking
- 15.5 Innovation Pipeline and R&D Investment
- 15.6 Patent and Intellectual Property Trends
- 15.7 Energy Efficiency and Resource Management
- 15.8 Sustainability, Recycling and Circularity
- 15.9 Technology Roadmap, 2025-2035
- 15.10 Risks of Obsolescence and Technology Substitution
Chapter 16 Australia AI-Powered Cyber Fraud Detection Market Key Strategic Imperatives
- 16.1 Growth and Market Entry Priorities
- 16.2 High-Return Products and Segments
- 16.3 Pricing, Profitability and Cost Optimization
- 16.4 Technology Investment and Product Differentiation
- 16.5 Supply Chain Localization and Resilience
- 16.6 Distribution and Customer Acquisition
- 16.7 Partnership, Acquisition and Capacity Strategy
- 16.8 Regional Expansion Priorities
- 16.9 Short-, Medium- and Long-Term Actions
Chapter 17 Competition Outlook
- 17.1 Industry Competition Characteristics
- 17.2 Market Structure and Concentration
- 17.3 Market Share and Competitive Positioning, 2025
- 17.4 Company-Wise Revenue and Product Benchmarking
- 17.5 Production and Service Capacity Benchmarking
- 17.6 Technology, Pricing and Differentiation
- 17.7 Regional Footprint and Distribution Strength
- 17.8 Mergers, Acquisitions and Strategic Alliances
- 17.9 New Entrants and Competitive Threats
- 17.10 Porter's Five Forces and Industry Attractiveness
- 17.11 Competitive Outlook, 2025-2035
Chapter 18 Company Profiles
- 18.1 Company Coverage and Selection Criteria
- 18.2 SAS Institute
- 18.2.1 Business Description
- 18.2.2 Company Ownership and Geographic Presence
- 18.2.3 Product and Service Portfolio
- 18.2.4 Manufacturing and Operating Footprint
- 18.2.5 Financial Performance and Investment
- 18.2.6 Market Share and Competitive Position
- 18.2.7 Technology and Innovation Capabilities
- 18.2.8 Strategic Alliances or Partnerships
- 18.2.9 Recent Developments
- 18.2.10 Growth Strategy and Outlook
- 18.3 NICE Actimize
- 18.4 FICO
- 18.5 Oracle Financial Services
- 18.6 Featurespace (Visa)
- 18.7 IBM Safer Payments
- 18.8 Quantexa
- 18.9 BioCatch
- 18.10 Quantium Telstra
- 18.11 Other Relevant Market Participants
Note: Every listed company is profiled on the structure shown under the first company. The company list is preliminary and may change based on research findings, market developments, data availability and client requirements.
Chapter 19 Disclaimer
- 19.1 Research and Forecast Disclaimer
- 19.2 Data Source and Estimation Limitations
Note: The depth of individual sections depends on data availability for this market. Volume, capacity, trade and other unit-based metrics are included where applicable.

