
Outsourced monitoring becomes a compliance purchase
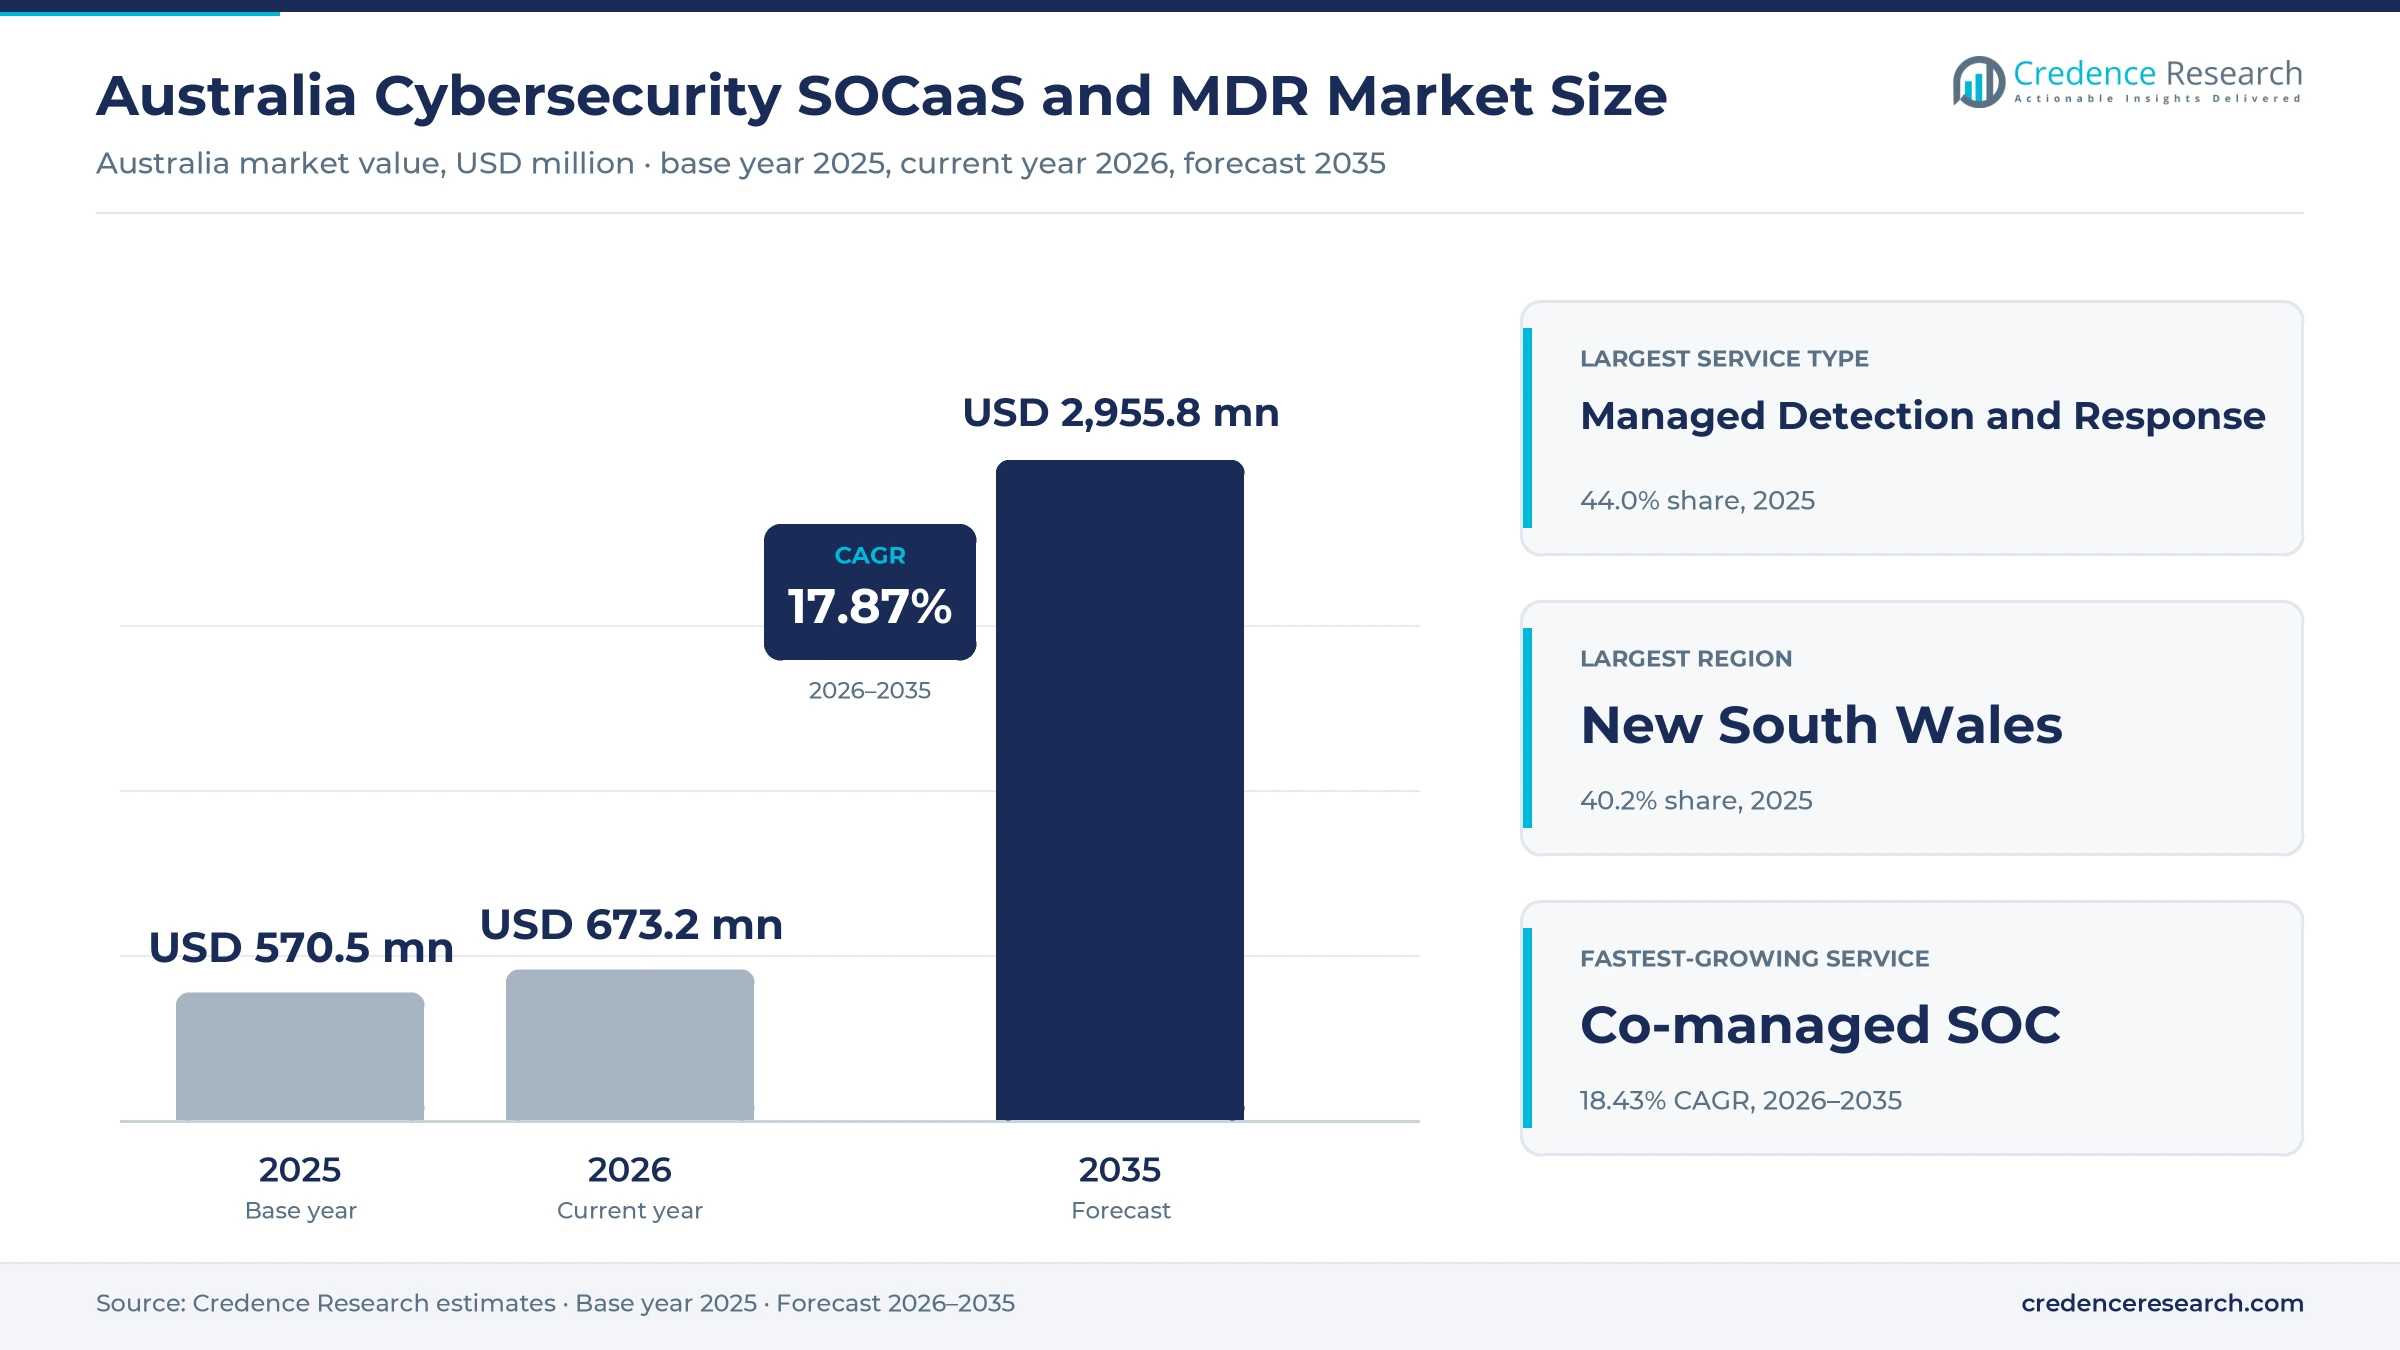
The Australia cybersecurity SOCaaS and MDR market was valued at USD 570.5 million in 2025 and is projected to increase from USD 673.2 million in 2026 to USD 2.96 billion by 2035, registering a CAGR of 17.87% during 2026–2035. Demand comes from banks, insurers, federal and state agencies, utilities, carriers and a growing number of mid-sized firms that cannot staff analysts around the clock but must detect, contain and report attacks within hours. New South Wales held the largest regional share, 40.2% in 2025, because Sydney hosts most bank, insurer and listed company headquarters as well as several provider operations centers. Remaining States and Territories is the fastest-growing region at 18.48% a year, as Western Australia, South Australia, Tasmania and the territories extend monitoring from a small base. At the same time, consolidation is reshaping supply, with Accenture closing its purchase of Melbourne-founded CyberCX in February 2026.
Which security operations services does the estimate count?
The estimate counts spending in Australia on SOC-as-a-Service, managed detection and response, and co-managed security operations center services, where an outside provider monitors security telemetry, investigates alerts, hunts for threats and contains incidents on the client's behalf. Buyers include large enterprises, mid-market firms, small businesses and government entities, who pay through per-endpoint subscriptions, telemetry-based subscriptions and fixed retainers.
The estimate excludes security software bought for in-house teams, one-off penetration tests, standalone incident response retainers that carry no monitoring, and consulting projects. The value chain links detection platform vendors, carriers, consultancies and specialist providers that run operations centers, distributors and managed service partners that resell services, and the regulators that set reporting duties.
Australia Cybersecurity SOCaaS and MDR Market Insights
- The Australia cybersecurity SOCaaS and MDR market was valued at USD 570.5 million in 2025 and is projected to reach USD 2.96 billion by 2035, registering a CAGR of 17.87% during 2026–2035.
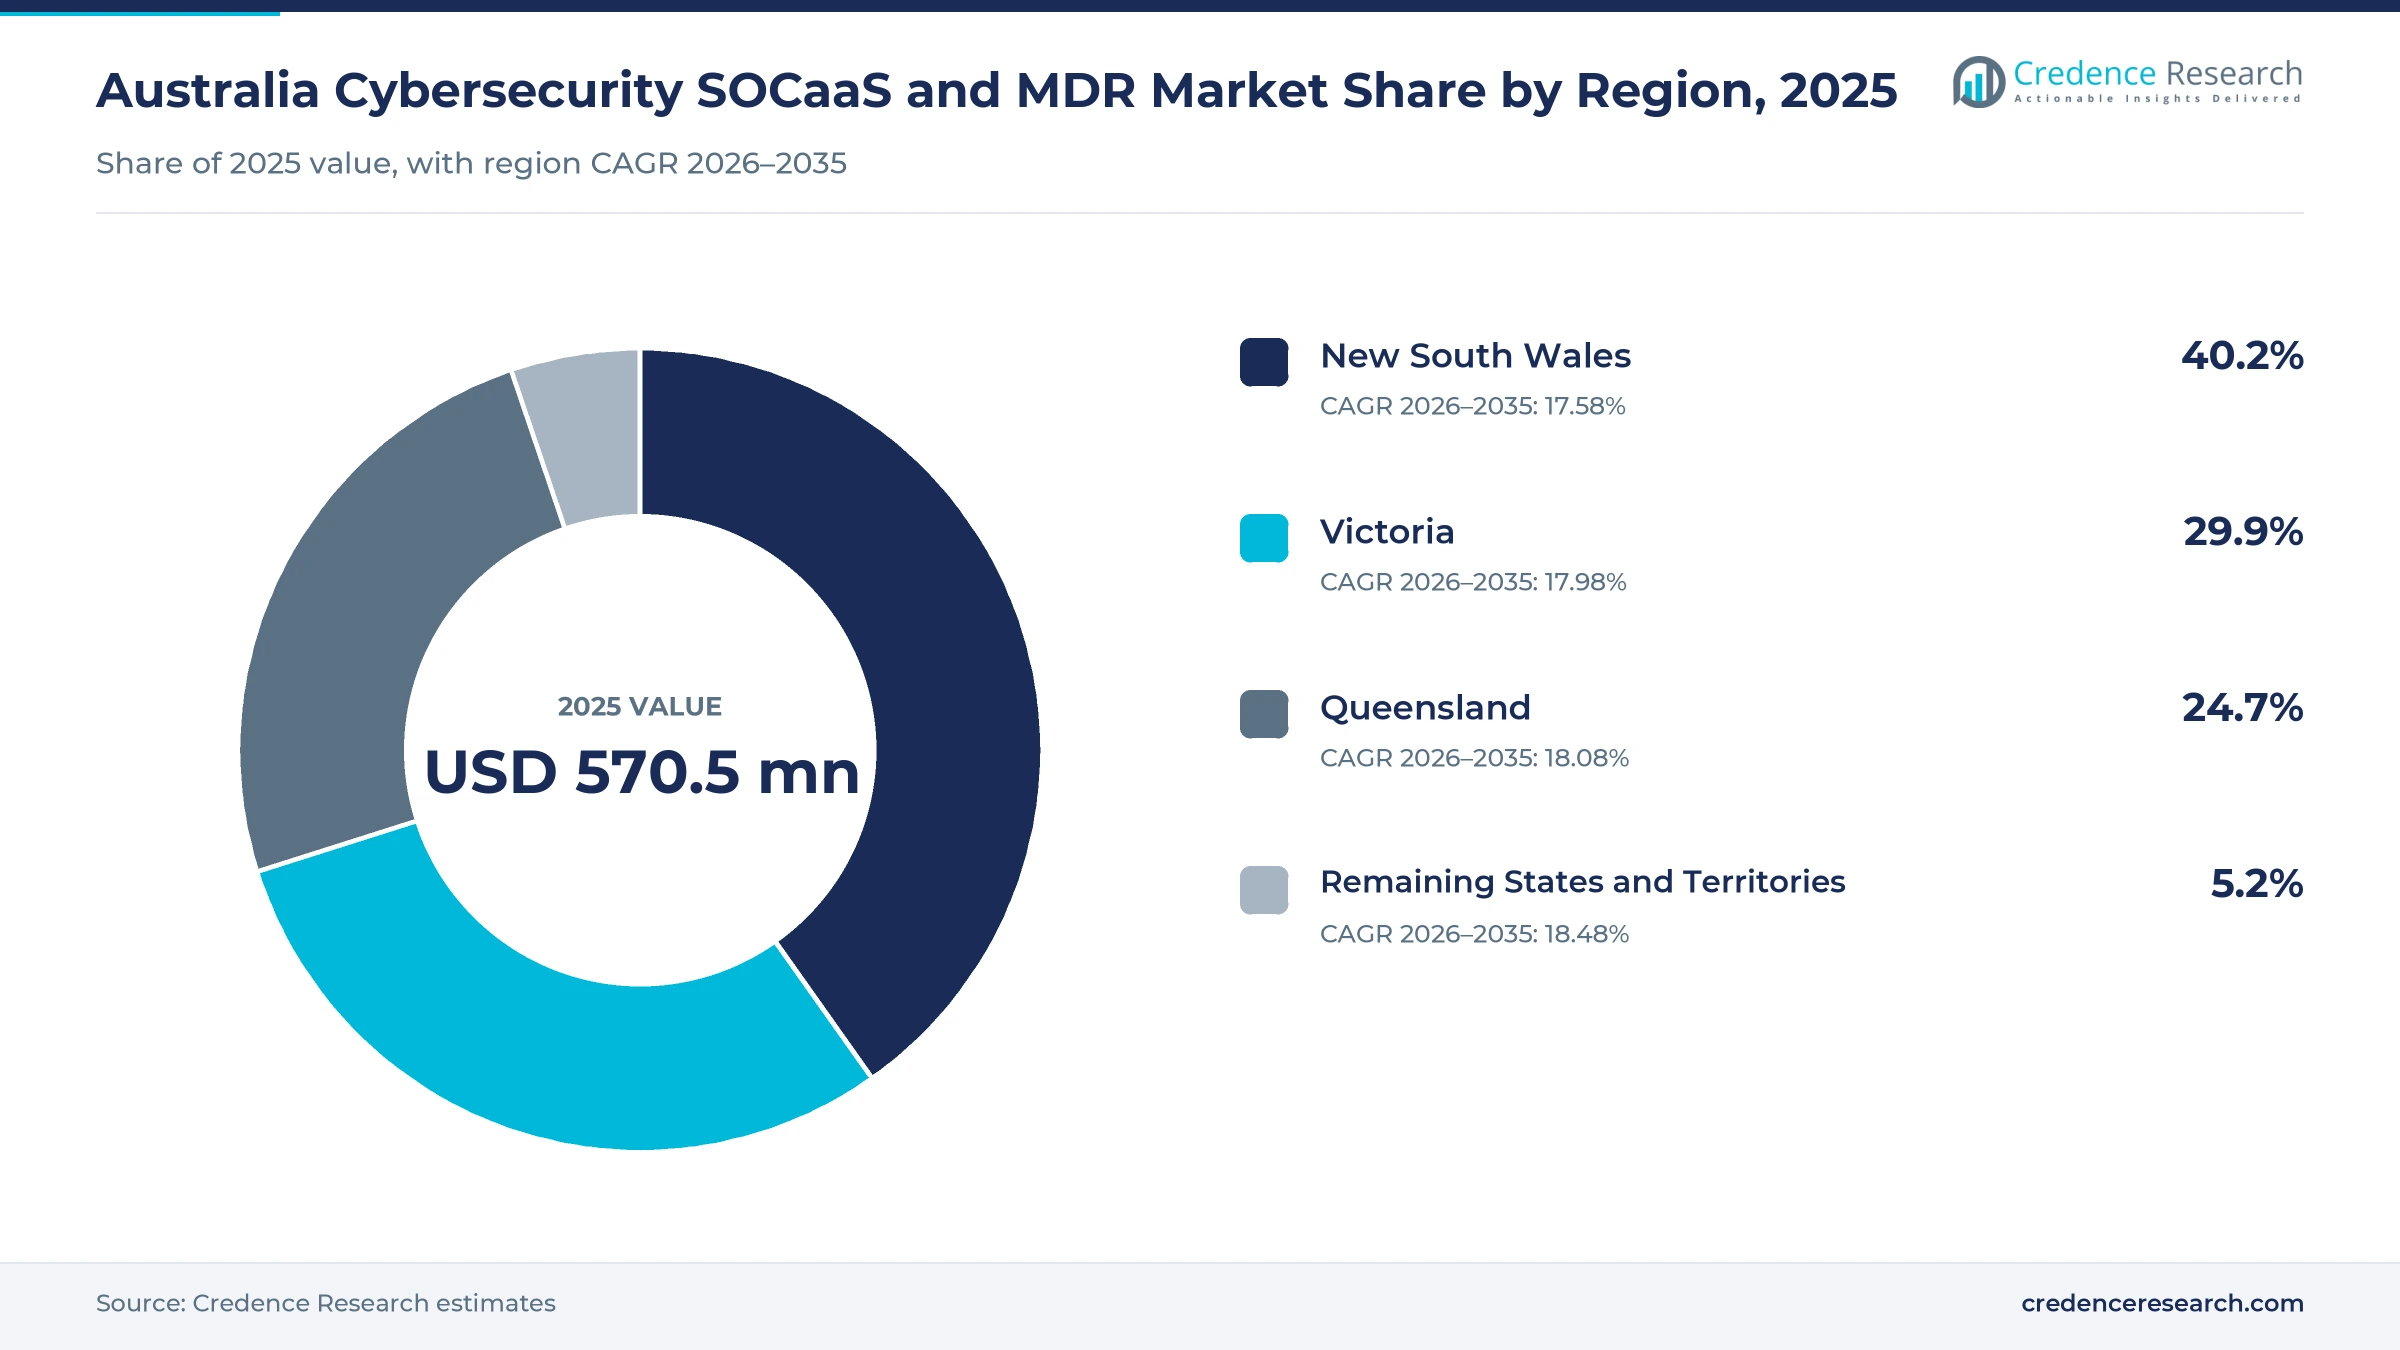
- New South Wales held 40.2% of 2025 value, because Sydney concentrates bank, insurer and corporate headquarters and several provider operations centers.
- Managed Detection and Response led service types with a 44.0% share of 2025 value, as buyers want containment as well as monitoring.
- The Australian Signals Directorate responded to more than 1,200 incidents in 2024-25, an 11% increase, while cybercrime reports reached about one every six minutes.
- Accenture completed its acquisition of CyberCX on Feb. 27, 2026, adding about 1,400 security professionals and a network of operations centers across Australia and New Zealand.
Detection services lead as co-managed models grow fastest
Why does managed detection and response hold the lead?
Based on service type, the market is categorized into SOC-as-a-Service, Managed Detection and Response, and Co-managed SOC. Managed Detection and Response led with a 44.0% share of 2025 value, because buyers want a provider that contains attacks on endpoints and identities rather than only forwarding alerts. Co-managed SOC grows fastest at 18.43% a year, as organizations with small internal teams keep control of their tools while providers cover nights, weekends and surges.
Which customers buy the most outsourced monitoring?
Based on customer type, the market is categorized into Large Enterprises, Mid-Market Enterprises, Small Businesses and Government Entities. Large Enterprises led with a 41.0% share of 2025 value, because they run the largest estates and face the strictest board and regulator scrutiny. Small Businesses grow fastest at 18.70% a year, as rising losses push smaller firms toward packaged services sold by distributors, managed service partners and carriers.
Which industries spend the most on security operations?
Based on end-use industry, the market is categorized into Financial Services, Government and Public Administration, Critical Infrastructure Industries and Non-Critical-Infrastructure Private Industries. Financial Services led with a 30.0% share of 2025 value, because banks and insurers carry the highest breach costs and prudential duties. Critical Infrastructure Industries grow fastest at 18.35% a year, as operators must report serious incidents within 12 hours.
How much monitoring is delivered from inside Australia?
Based on delivery model, the market is categorized into Australian Onshore Delivery, Hybrid Onshore-Offshore Delivery and Offshore Delivery. Australian Onshore Delivery led with a 52.0% share of 2025 value, because agencies and regulated firms want cleared analysts and data kept in the country. Australian Onshore Delivery also grows fastest at 18.12% a year, while fully offshore models lose share as sovereignty clauses spread into private contracts.
| Segment Group | Leading Sub-segment | Share, 2025 | Fastest-growing Sub-segment | CAGR, 2026–2035 |
|---|---|---|---|---|
| By Service Type | Managed Detection and Response | 44.0% | Co-managed SOC | 18.43% |
| By Customer Type | Large Enterprises | 41.0% | Small Businesses | 18.70% |
| By End-Use Industry | Financial Services | 30.0% | Critical Infrastructure Industries | 18.35% |
| By Delivery Model | Australian Onshore Delivery | 52.0% | Australian Onshore Delivery | 18.12% |
Request a Free Sample
Fill in your details and we'll send you a free sample report.
- Sample data tables & charts
- Research methodology
Reporting deadlines, CPS 230 and skills gaps lift demand
How do 12-hour incident rules push operators to outsource?
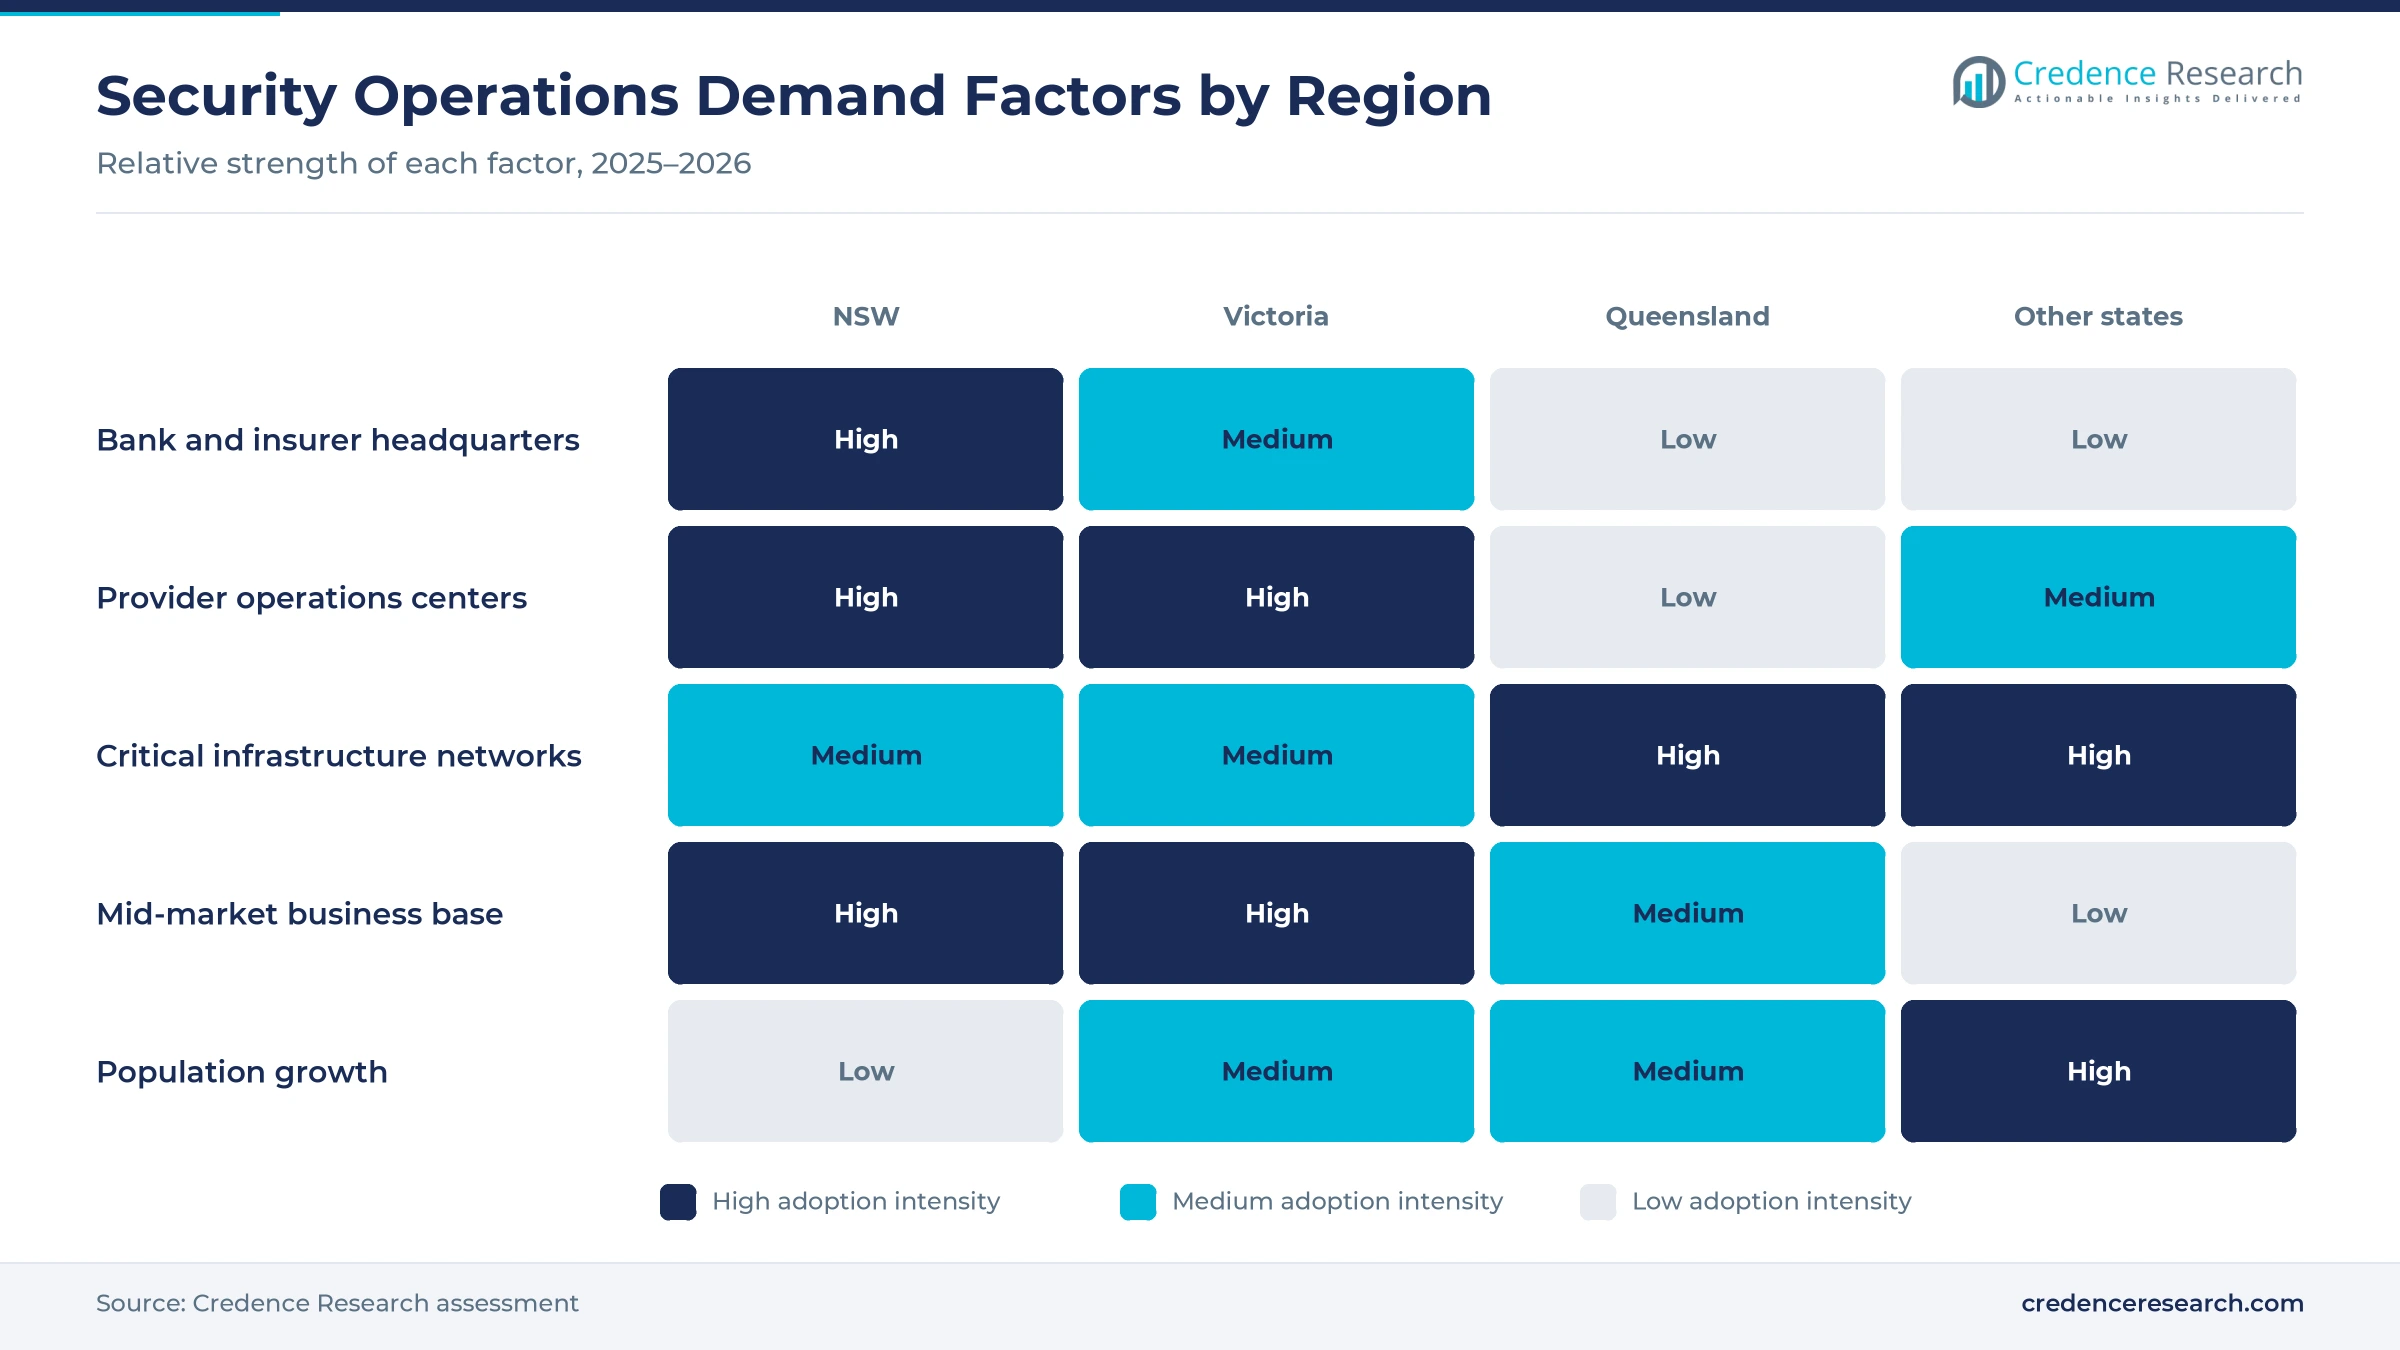
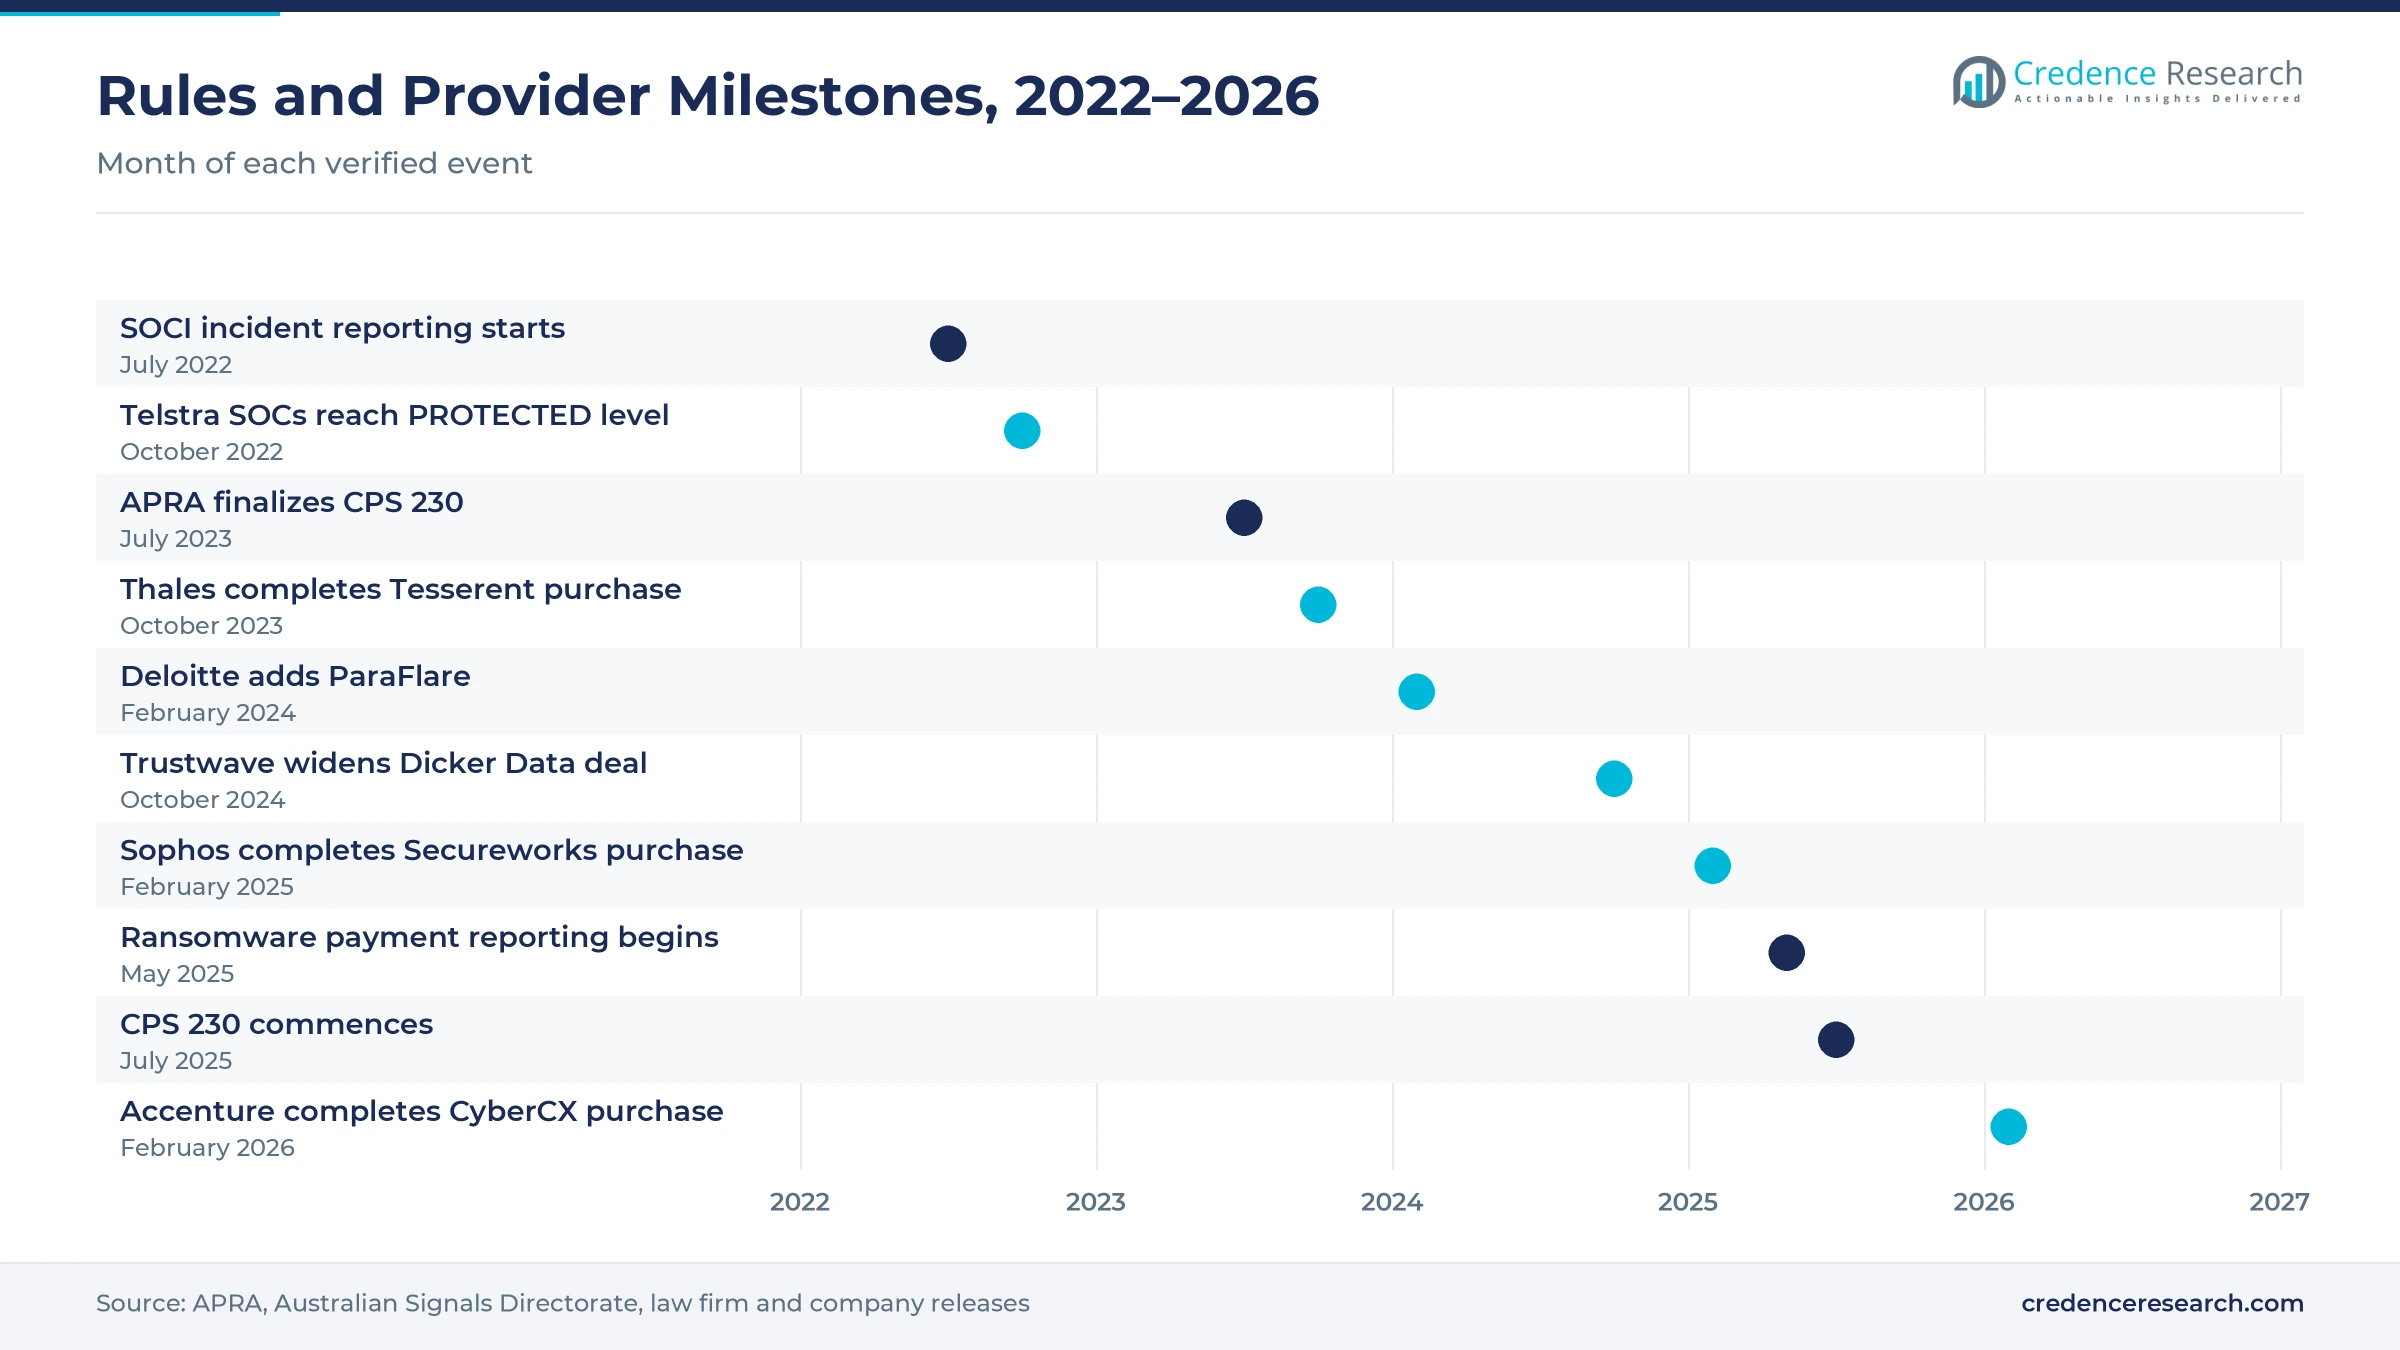
Critical infrastructure operators must now detect and report serious cyber incidents within hours, which makes round-the-clock monitoring a compliance need rather than an option. Responsible entities must report incidents with a significant impact within 12 hours and other relevant incidents within 72 hours, duties that took effect on July 8, 2022, according to law firm Corrs Chambers Westgarth. The Cyber and Infrastructure Security Centre said 47 mandatory reports were lodged between April 1 and Dec. 31, 2022, according to Cyber Daily. Because few operators can staff analysts every night, many buy monitoring as part of wider critical infrastructure protection programs. As a result, Critical Infrastructure Industries grow at 18.35% a year, the fastest end-use group.
Why does APRA's CPS 230 lift bank and insurer purchases?
Banks, insurers and superannuation funds now face prudential rules that judge how well they withstand and recover from disruption, which turns detection and response into a board-level purchase. APRA finalized its CPS 230 operational risk standard on July 17, 2023, and the standard commenced on July 1, 2025, requiring entities to set and test controls and manage material service providers, according to APRA. IBM's 2026 study put the average breach cost for Australian financial services at A$6.31 million, against A$4.22 million across all sectors, according to IT Brief. Because outsourced monitoring partners can count as material service providers, banks also tighten reporting and testing terms. In turn, Financial Services held the largest end-use share at 30.0% of 2025 value.
How does the analyst shortage push buyers to outsource?
A shortage of experienced analysts pushes organizations to rent detection and response skills rather than build full internal teams. AustCyber chief executive Chris Kirk said Australia would need an additional 85,000 cyber workers by 2030 to meet the growing threat, according to The Nightly in June 2024. Deloitte added ParaFlare's 66-person managed detection and response team to its Australian cyber practice of more than 680 people on Feb. 1, 2024, according to Deloitte Australia. Macquarie Government says its service is run by Australian NV1-cleared specialists with no offshore hand-off, according to Macquarie Government. As a result, Co-managed SOC services grow fastest at 18.43% a year, as internal teams keep control while providers cover nights and surges.
Why do rising cybercrime losses widen business demand?
Rising losses from cybercrime are moving smaller organizations from basic antivirus toward monitored services with a response team behind them. The Australian Signals Directorate received more than 84,700 cybercrime reports in 2024-25, about one every six minutes, according to the Minister for Defence. The average self-reported cost per report rose 14% to A$56,600 for small businesses, while medium businesses reported A$97,200, up 55%, according to Cyber Daily. The federal Cyber Security Strategy also commits A$290.8 million to protect businesses and citizens, including support for small and medium business, according to the Minister for Home Affairs. In turn, Mid-Market Enterprises and Small Businesses both outgrow Large Enterprises, the largest customer type at 41.0%.
Onshore delivery, AI triage and partner channels advance
Why is the shift to onshore PROTECTED-level delivery rising?
Government agencies and regulated firms increasingly insist that security data and analysts stay in Australia, which shifts contracts toward onshore operations centers. Telstra upgraded its security operations centers in Canberra, Sydney and Melbourne to operate at the ISM PROTECTED level in October 2022, according to iTWire. Trustwave moved Pacific client data for its Fusion platform onshore on July 18, 2023, hosting it on IRAP-assessed AWS services in Sydney, according to Trustwave. Macquarie Government also says its response runbooks are trusted by 42% of federal government agencies, which strengthens its onshore position. As a result, Australian Onshore Delivery led with 52.0% of 2025 value, and fully offshore delivery keeps losing share through 2035.
How is AI-assisted triage changing SOC economics?
Providers are adding AI agents to alert triage and investigation, which lets each analyst cover more customers and shortens response times. DXC Technology and 7AI launched an agentic security operations service on Aug. 4, 2025, claiming savings of 30 minutes to 2.5 hours per investigation, according to SecurityBrief Australia. IBM found that Australian organizations with extensive AI security use averaged A$3.46 million per breach, against A$5.21 million for those without AI tools, and identified breaches 68 days faster, according to IT Brief. Macquarie Government also says an automated Tier-1 layer handles initial containment before analysts investigate. In turn, managed detection and response, the largest service type at 44.0% of 2025 value, becomes cheaper to deliver to mid-market buyers.
Can MSP and reseller channels open the small business tier?
Distributors and managed service partners give security operations providers a path to thousands of smaller firms they could not reach through direct sales. Trustwave expanded its partnership with Dicker Data on Oct. 21, 2024, so the distributor's resellers can offer managed detection and response, co-managed SOC and SIEM services, according to LevelBlue. LevelBlue then completed its acquisition of Trustwave on Aug. 19, 2025, forming what it calls the world's largest pure-play managed security services provider, according to Business Wire. Sophos, which completed its purchase of Secureworks on Feb. 3, 2025, said it already supported more than 28,000 organizations through its detection and response services. As a result, Small Businesses grow at 18.70% a year, the fastest customer type.
Is there an opening in telecom-bundled security services?
Telecom carriers already run networks for most large and mid-sized firms, which gives them an opening to bundle monitoring and response with connectivity contracts. Telstra launched Cyber Detection and Response Endpoint with BlueVoyant on Sept. 8, 2021, offering round-the-clock monitoring and response for laptops, tablets and phones, according to BlueVoyant. Optus launched a Managed Threat Monitoring Service built on Devo's platform in August 2024 for enterprise and mid-market customers, with triage by its own security operations center, according to IT Brief. Optus also described itself as a Zscaler managed security services provider on Jan. 30, 2026, backed by 24/7 monitoring and response. In turn, Mid-Market Enterprises add demand as carriers package security into network renewals.
Analyst scarcity, data costs and contract duties weigh
Why does analyst scarcity squeeze provider margins?
Providers compete with banks, consultancies and federal agencies for the same small pool of analysts, especially those who hold security clearances. The shortfall of 85,000 workers projected for 2030 by AustCyber's chief executive keeps wage pressure high while many contracts run at fixed prices for several years. As a result, smaller providers struggle to staff every shift with experienced analysts, which can lengthen response times. Providers respond with automation, graduate programs and analyst pools shared across many clients.
How do rising data volumes inflate monitoring costs?
Telemetry from cloud services, endpoints and identity systems keeps growing, and providers that price by data volume pass those costs on to clients. Many buyers respond by limiting the log sources they send, which leaves blind spots that attackers can exploit. The Australian Signals Directorate notified entities of potential malicious activity more than 1,700 times in 2024-25, up 83%, according to Cyber Daily. Providers answer with tiered storage, filtering at the source and per-endpoint pricing that caps bills.
Why do resilience rules complicate provider contracts?
CPS 230 makes banks, insurers and superannuation funds answer for risks at material service providers, including outsourced monitoring partners, from July 1, 2025. As a result, providers face longer due diligence, audit rights and testing clauses before contracts are signed. Smaller providers without formal assurance reports can lose bids even when their service quality is strong. Many respond by obtaining independent assurance reports and mapping controls to several frameworks at once.
How does rapid consolidation unsettle buyer relationships?
Ownership of several large providers has changed within three years, which leaves buyers reviewing contracts, platforms and account teams. Thales completed its purchase of Tesserent in October 2023, Sophos bought Secureworks in February 2025, LevelBlue bought Trustwave in August 2025 and Accenture closed its CyberCX deal in February 2026. As a result, some clients face platform migrations or changed service terms during a contract. Buyers respond with exit clauses, data portability terms and multi-provider strategies.
Sydney leads while smaller states grow from a low base
| Region | Value, 2025 (USD million) | Share, 2025 | CAGR, 2026–2035 |
|---|---|---|---|
| New South Wales | 229.3 | 40.2% | 17.58% |
| Victoria | 170.6 | 29.9% | 17.98% |
| Queensland | 140.9 | 24.7% | 18.08% |
| Remaining States and Territories | 29.7 | 5.2% | 18.48% |
Why do Sydney headquarters anchor the lead?
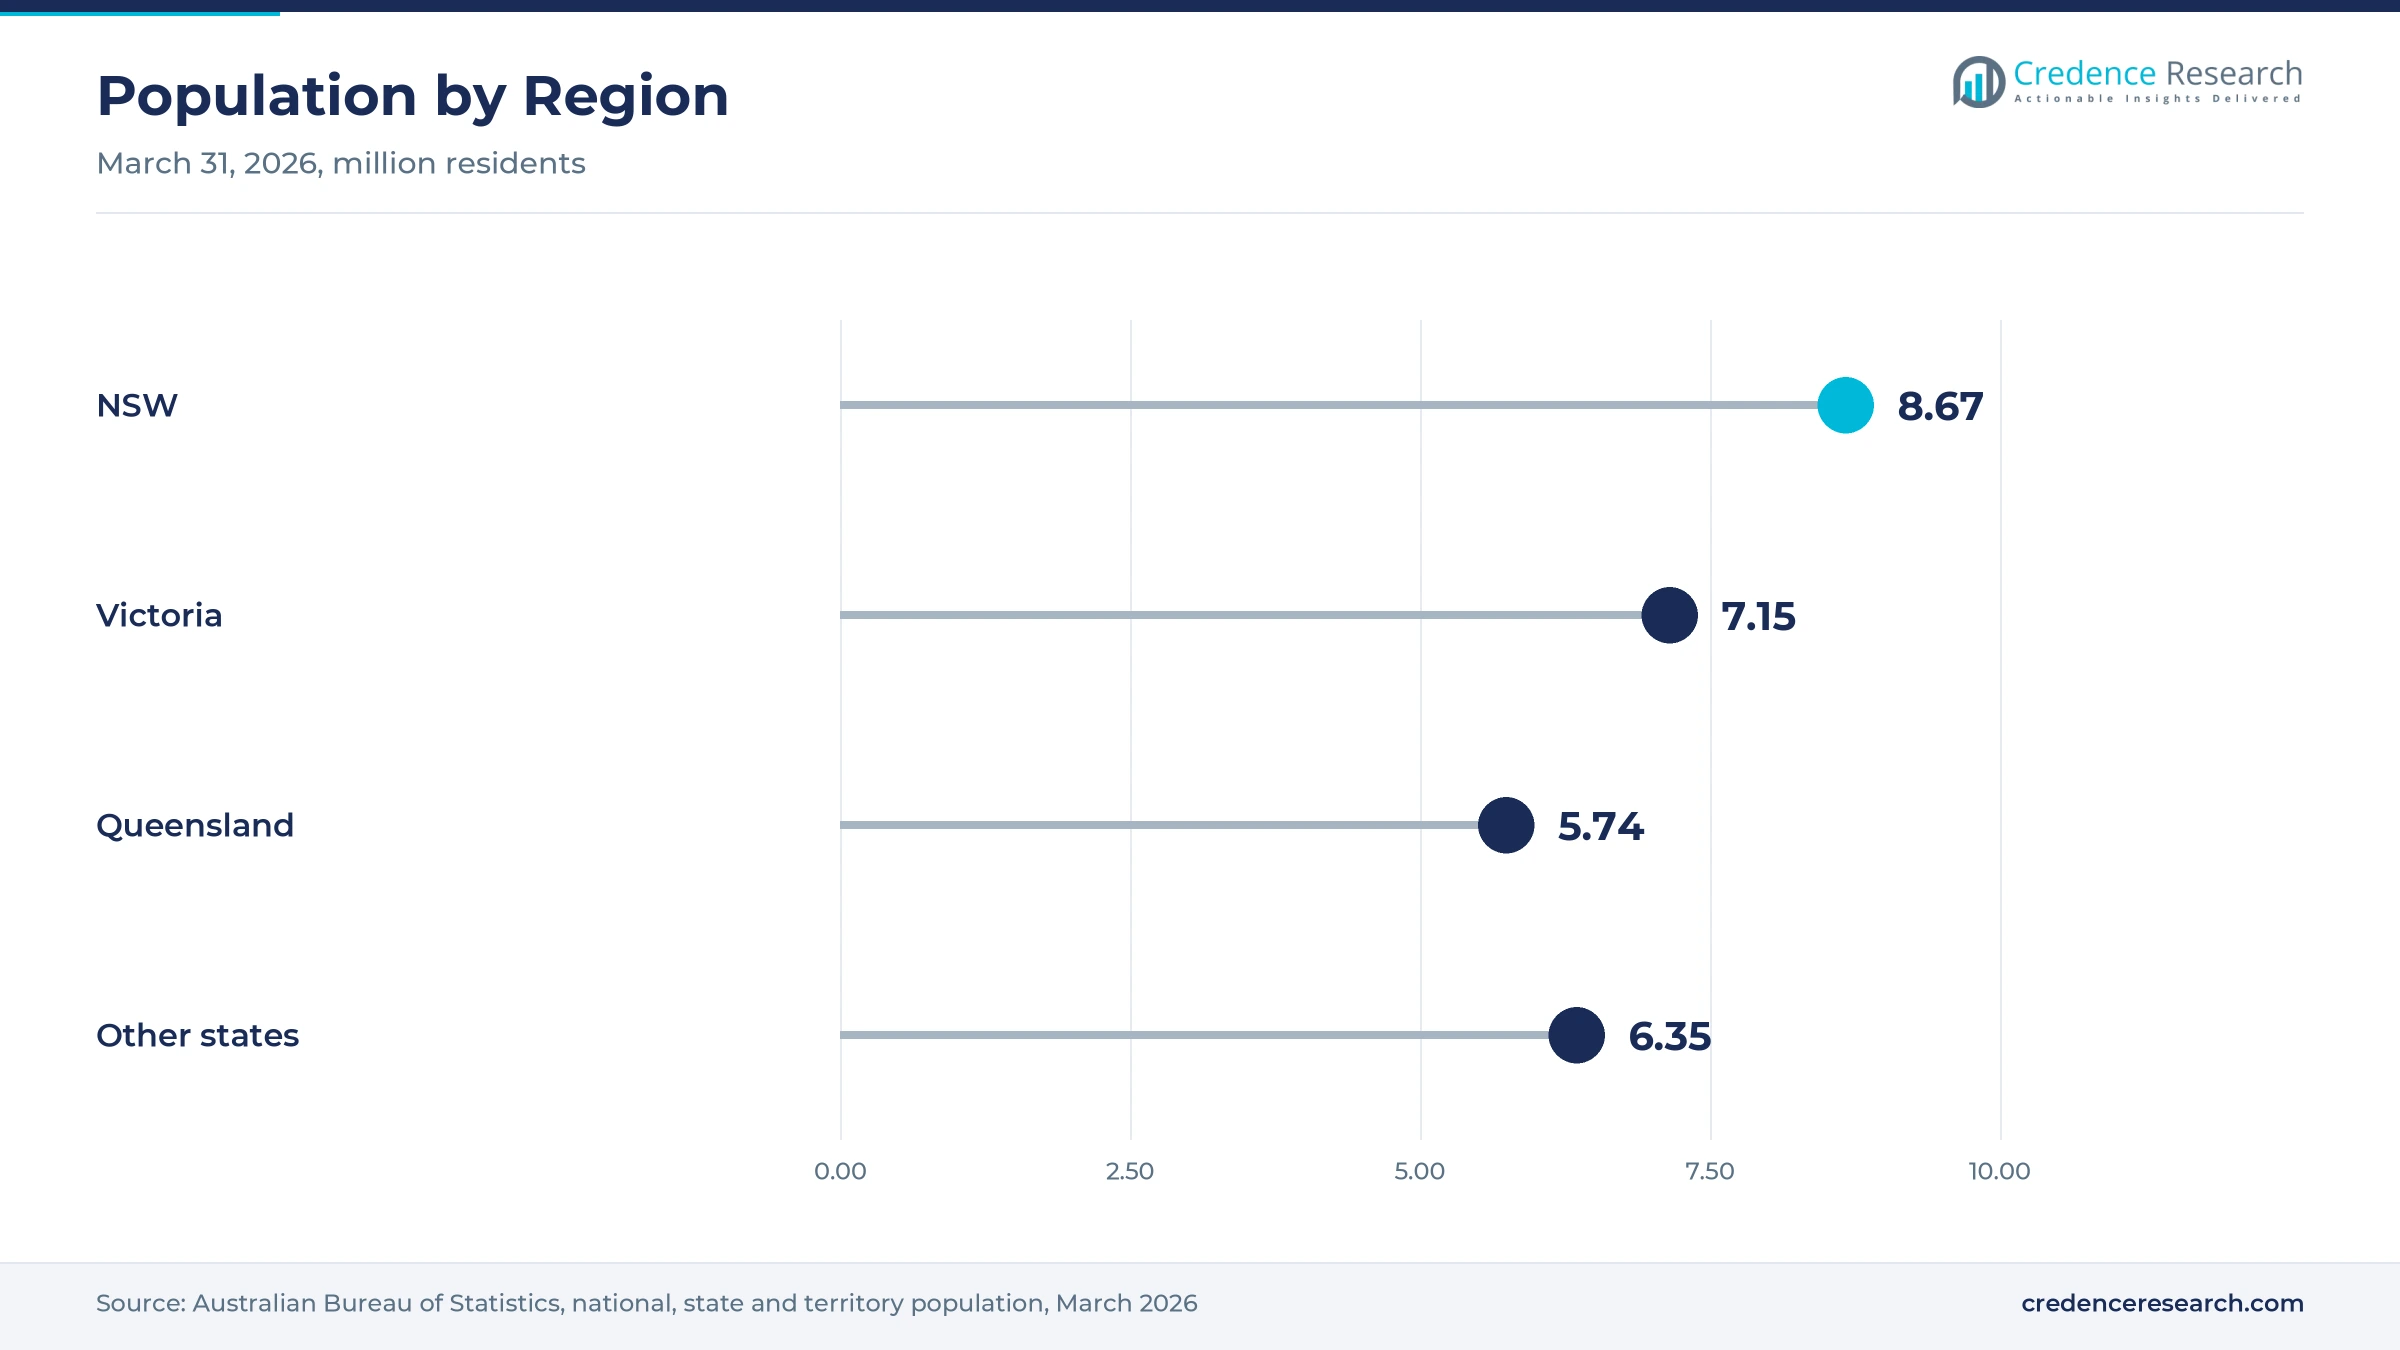
New South Wales held 40.2% of 2025 value and grows at 17.58% a year, because Sydney hosts the headquarters of most banks, insurers and listed companies that buy outsourced detection. Optus runs its advanced security operations center on its Sydney campus, alongside its network management center, according to Trustwave. Macquarie Government launched its SOC-as-a-Service offer in September 2019 from existing centers in Sydney and Canberra, according to ARN. New South Wales had about 8.67 million residents at March 31, 2026, according to the Australian Bureau of Statistics.
How do Melbourne providers support Victoria's share?
Victoria held 29.9% of 2025 value and grows at 17.98% a year, because Melbourne combines large corporate, university and hospital buyers with major security service providers. CyberCX was founded in Melbourne in 2019 and runs a network of security operations centers across Australia and New Zealand, according to CyberCX. Telstra also operates one of its PROTECTED-level operations centers in Melbourne, which serves agency and enterprise clients, and demand for hospital data protection adds monitoring work. Victoria's population grew 1.6% in the year to March 2026.
Why does Queensland add steady monitoring demand?
Queensland held 24.7% of 2025 value and grows at 18.08% a year, because long electricity, rail and port networks and a large state public sector need continuous monitoring across vast distances. Queensland's population rose 1.6% to about 5.74 million in the year to March 2026, according to the Australian Bureau of Statistics, which adds new connections, devices and services to protect. Credence Research estimates that many Queensland contracts use hybrid delivery from interstate operations centers, which keeps prices competitive for mid-sized buyers.
How do smaller states and territories grow fastest?
Remaining States and Territories held 5.2% of 2025 value and grows fastest at 18.48% a year, because resources, energy and public sector buyers extend monitoring from a small base. Western Australia's population rose 2.1% in the year to March 2026, the fastest of any state, according to the Australian Bureau of Statistics. These states and territories held about 6.35 million residents combined, yet many local buyers still rely on providers based in Sydney and Melbourne, which leaves room for local partners.
Acquisitions reshape the provider field from 2023 to 2026
| Development | Status and market relevance |
|---|---|
| In October 2023, Thales completed its acquisition of Tesserent, which brought about 500 staff across nine offices. | Formed Thales Cyber Services ANZ |
| In February 2024, Deloitte Australia added ParaFlare and its 66-person managed detection and response team. | Expanded sovereign detection services |
| In October 2024, Trustwave expanded its partnership with Dicker Data to resell detection and co-managed SOC services. | Widened the reseller channel |
| In February 2025, Sophos completed its acquisition of Secureworks and its Taegis detection and response platform. | Consolidated global providers |
| In February 2026, Accenture completed its acquisition of CyberCX and its about 1,400 security professionals. | Consolidated local services |
Telemetry platforms and automation shape modern SOCs
- Extended detection and response platforms collect alerts from endpoints, identities, networks and cloud services, which lets analysts find and contain attacks in one console.
- Cloud-native SIEM and data lakes store and correlate large telemetry volumes in Australian cloud regions, which helps providers meet data residency terms.
- AI-assisted triage agents group, enrich and close routine alerts automatically, which frees analysts to investigate the incidents that matter.
- Automated response playbooks isolate devices, disable accounts and block indicators within minutes, which limits damage before analysts finish an investigation.
Need a Custom Version of This Report?
Tailor the scope, geography, or segments to your exact requirements.
- Custom geography or segment scope
- Direct access to our analyst team
Carriers, consultancies and sovereign specialists compete
Competition combines carriers, global consultancies and sovereign specialist providers that run operations centers inside Australia. Accenture completed its purchase of CyberCX in February 2026, adding about 1,400 professionals and a network of operations centers across Australia and New Zealand. Telstra runs PROTECTED-level centers in Canberra, Sydney and Melbourne, while Optus sells managed threat monitoring built on Devo and managed Zscaler services. Macquarie Government focuses on federal agencies with cleared onshore analysts, and Thales Cyber Services ANZ grew from the Tesserent purchase. Deloitte added ParaFlare's detection team in 2024, and Trustwave, now owned by LevelBlue, sells through Dicker Data's reseller network. Providers compete on clearances, onshore delivery, response times, platform partnerships and price per endpoint. Regulated buyers also add security consulting services to prepare for CPS 230 audits and incident response testing.
Which providers shape Australian SOC services?
| Company | Type | Role in the market |
|---|---|---|
| Accenture/CyberCX | Consulting and security services firm | Runs operations centers across Australia and New Zealand after closing the CyberCX deal in 2026 |
| Telstra Purple | Carrier services arm | Telstra runs PROTECTED-level operations centers in Canberra, Sydney and Melbourne |
| Optus Business | Carrier services arm | Sells managed threat monitoring built on Devo and managed Zscaler services |
| Macquarie Government | Sovereign specialist provider | Offers PROTECTED-level detection and response with NV1-cleared analysts |
| Thales Cyber Services ANZ | Security service provider | Formed from the Tesserent acquisition completed in October 2023 |
| Deloitte Cyber ANZ | Consulting and security services firm | Added ParaFlare's detection and response team in February 2024 |
| Trustwave ANZ | Managed security provider | Hosts Fusion platform data in Sydney and resells through Dicker Data |
Credence Research view on outsourced threat monitoring
Credence Research's view is that outsourced security operations in Australia will keep growing well ahead of overall security spending, because incident reporting, prudential resilience rules and a deep analyst shortage make round-the-clock coverage hard to build in-house. Managed detection and response remains the largest service, yet co-managed models gain as larger buyers keep their own tools and teams. Providers that combine cleared onshore analysts, AI-assisted triage and strong partner channels should gain share as buyers consolidate suppliers. Onshore delivery is likely to stay the default for agencies, banks and critical infrastructure operators through 2035.
How the security operations services estimate was built
The report uses 2025 as the base year on a calendar basis, and market values come from the Credence Research model. That model combines regulatory obligations, incident and cybercrime statistics, government funding programs, population data and company releases. Region growth rates and segment splits are Credence Research estimates built from state population growth, the location of buyer headquarters and operations centers, and published provider offers, while regional shares follow the source sheet. Sources used are government, statistical agency, international organization, law firm, trade press and company publications, and no interviews or surveys were used.
Mandatory readiness keeps outsourced monitoring rising
The Australia cybersecurity SOCaaS and MDR market is expected to reach USD 2.96 billion by 2035, a 17.87% CAGR during 2026–2035, as mandatory readiness, prudential resilience rules and analyst shortages keep outsourcing rising. Growth should be strongest in co-managed services, small businesses, critical infrastructure industries and onshore delivery. Demand for managed security services more broadly will also rise as providers fold monitoring, response and advisory work into single contracts. Australia had about 44,299 secure internet servers per million people in 2024, according to the World Bank, a large footprint that providers must help defend.
Frequently Asked Questions
How big is the Australia cybersecurity SOCaaS and MDR market?
Which service type leads the market?
Which region leads the market?
How fast must critical infrastructure operators report incidents?
How does CPS 230 affect outsourced monitoring?
How costly is cybercrime for Australian businesses?
Who are the leading companies in the market?
What are the main challenges for the market?
Table of Content
Chapter 1 Market Segmentation
- 1.1 Segmentation Framework
- 1.1.1 Product and Service Classification
- 1.1.2 Application and End-Use Classification
- 1.1.3 Technology and Solution Classification
- 1.1.4 Customer and Distribution Channel Classification
- 1.1.5 Geographic Segmentation
- 1.1.6 Market Segment Definitions and Boundaries
- 1.2 By Service Type
- 1.2.1 Managed Detection and Response
- 1.2.2 SOC-as-a-Service
- 1.2.3 Co-managed SOC
- 1.3 By Customer Type
- 1.3.1 Large Enterprises
- 1.3.2 Mid-Market Enterprises
- 1.3.3 Small Businesses
- 1.3.4 Government Entities
- 1.4 By End-Use Industry
- 1.4.1 Financial Services
- 1.4.2 Government and Public Administration
- 1.4.3 Critical Infrastructure Industries
- 1.4.4 Non-Critical-Infrastructure Private Industries
- 1.5 By Delivery Model
- 1.5.1 Australian Onshore Delivery
- 1.5.2 Hybrid Onshore-Offshore Delivery
- 1.5.3 Offshore Delivery
Chapter 2 Introduction
- 2.1 Report Objectives and Scope
- 2.2 Product Definition and Industry Terminology
- 2.3 Market Inclusions and Exclusions
- 2.4 Research Process
- 2.4.1 Primary Research and Expert Interviews
- 2.4.2 Secondary Research and Source Review
- 2.4.3 Top-Down and Bottom-Up Estimation
- 2.4.4 Data Triangulation and Verification
- 2.5 Market Size Measurement Basis
- 2.5.1 2025: USD 570.5 million → 2035: USD 2.96 billion
- 2.6 Historical and Forecast Reference Periods
- 2.6.1 Historical Period: 2018-2025
- 2.6.2 Base Year: 2025
- 2.6.3 Forecast Period: 2025-2035
- 2.7 Research Assumptions and Limitations
Chapter 3 Executive Summary
- 3.1 Market Snapshot and Key Findings
- 3.2 Base-Year Market Size, 2025
- 3.3 Forecast Market Size, 2035
- 3.4 Revenue and Volume Growth Outlook
- 3.5 Key Demand and Supply Indicators
- 3.6 Leading Market Segments
- 3.7 Fastest-Growing Market Opportunities
- 3.8 Regional Performance Highlights
- 3.9 Technology and Industry Transformation
- 3.10 Competitive Landscape Summary
- 3.11 Analyst View and Strategic Implications
Chapter 4 Australia Cybersecurity SOCaaS and MDR Market Trends and Developments
- 4.1 Historical Industry Development, 2018-2025
- 4.2 Recent Market Trends and Developments
- 4.3 Demand and Customer Behavior Trends
- 4.4 Technology and Product Innovation
- 4.5 Artificial Intelligence, Automation and Digitalization
- 4.6 Local Manufacturing and Supply Chain Realignment
- 4.7 Industry Partnerships, Mergers and Acquisitions
- 4.8 Sustainability and Circular Economy Developments
- 4.9 Government and Private Sector Investment Trends
- 4.10 Emerging Business Models and Commercialization
- 4.11 Industry Developments and Announcements
Chapter 5 Australia Cybersecurity SOCaaS and MDR Market Supply and Demand Analysis
- 5.1 Demand Trend and Consumption Analysis, 2018-2025
- 5.2 Demand Forecast, 2025-2035
- 5.3 Supply Chain Structure and Procurement Trends
- 5.4 Supply-Demand Gap and Bottlenecks
- 5.5 Import Dependence and Sourcing Structure
- 5.6 Regional Supply and Demand Concentration
Chapter 6 Australia Cybersecurity SOCaaS and MDR Market Pricing Analysis
- 6.1 Pricing Structure and Measurement
- 6.2 Historical Pricing Trends, 2018-2025
- 6.3 Pricing Outlook, 2025-2035
- 6.4 Pricing by Product and Market Segment
- 6.5 Geographic Pricing Differences
- 6.6 Key Input, Energy, Labor and Logistics Costs
- 6.7 Contract Pricing and Purchasing Models
- 6.8 Pricing Sensitivity and Competitive Positioning
- 6.9 Price, Margin and Profitability Implications
Chapter 7 Australia Cybersecurity SOCaaS and MDR Market Dynamics
- 7.1 Market Growth Drivers
- 7.1.1 Demand-Side Drivers
- 7.1.2 Technology and Innovation Drivers
- 7.1.3 Infrastructure and Investment Drivers
- 7.1.4 Regulatory and Policy Drivers
- 7.2 Market Restraints
- 7.2.1 Cost and Affordability Constraints
- 7.2.2 Technology and Adoption Barriers
- 7.2.3 Supply Chain and Operational Constraints
- 7.3 Market Challenges
- 7.3.1 Competitive Pressure and Margin Erosion
- 7.3.2 Skills, Infrastructure and Implementation Gaps
- 7.4 Emerging Market Opportunities
- 7.5 Market Dynamics Impact and Time-Horizon Assessment
Chapter 8 Australia Cybersecurity SOCaaS and MDR Value Chain Analysis
- 8.1 Industry Value Chain Overview
- 8.2 Upstream Suppliers and Critical Inputs
- 8.3 Technology and Component Providers
- 8.4 Manufacturing or Service Delivery
- 8.5 Distribution, Channel Partners and Integrators
- 8.6 Downstream Applications and End Users
- 8.7 Value Addition and Profit Pools
- 8.8 Vertical Integration and Outsourcing
- 8.9 Supplier Concentration and Risk
- 8.10 Supply Chain Localization and Resilience
Chapter 9 Australia Cybersecurity SOCaaS and MDR Market Regulations and Policies
- 9.1 Relevant Laws, Standards and Compliance Frameworks
- 9.2 Product, Service, Safety and Quality Requirements
- 9.3 Government Policies, Incentives and Subsidies
- 9.4 Imports, Exports and Trade Barriers
- 9.5 Public Procurement and Local Content Requirements
- 9.6 Data Protection, AI and Cybersecurity Compliance
- 9.7 Upcoming Policy Changes and Market Implications
Chapter 10 Australia Cybersecurity SOCaaS and MDR Market Hotspots and Opportunities
- 10.1 Market Opportunity Mapping and Growth Hotspots
- 10.2 High-Growth Applications and Customer Groups
- 10.3 Underserved Markets and White-Space Opportunities
- 10.4 Emerging Technology and Product Opportunities
- 10.5 New Capacity and Investment Hotspots
- 10.6 Market Entry and Expansion Opportunities
- 10.7 Distribution and Partnership Opportunities
- 10.8 Near-Term and Long-Term Commercial Potential
- 10.9 Opportunity Attractiveness and Execution Risks
Chapter 11 Australia Cybersecurity SOCaaS and MDR Market Outlook, 2025-2035
- 11.1 Market Size and Analysis
- 11.1.1 Revenue (Market Measurement: 2025: USD 570.5 million → 2035: USD 2.96 billion)
- 11.1.2 Historical Market Size, 2018-2025
- 11.1.3 Base-Year Market Size, 2025
- 11.2 Market Forecast, 2025-2035
- 11.2.1 Revenue Forecast to 2035
- 11.2.2 CAGR and Year-on-Year Growth
- 11.2.3 Incremental Revenue Opportunity
- 11.3 Forecast Assumptions and Scenario Analysis
- 11.3.1 Base-Case Forecast
- 11.3.2 Optimistic and Conservative Scenarios
- 11.3.3 Technology, Pricing and Policy Sensitivities
- 11.4 Market Attractiveness and Growth Outlook
Chapter 12 Australia Cybersecurity SOCaaS and MDR Market Segmentation and Outlook
- 12.1 Segmentation Summary and Market Shares, 2025
- 12.2 Largest and Fastest-Growing Segments
- 12.3 By Service Type - Market Size and Forecast, 2025-2035
- 12.3.1 Segment Definition and Scope
- 12.3.2 Historical Market Size, 2018-2025
- 12.3.3 Revenue Forecast, 2025-2035
- 12.3.4 Base-Year Market Share, 2025
- 12.3.5 Segment CAGR and Growth Drivers
- 12.3.6 Subsegment Market Size and Forecast
- 12.3.6.1 Managed Detection and Response
- 12.3.6.2 SOC-as-a-Service
- 12.3.6.3 Co-managed SOC
- 12.3.7 Subsegment Pricing and Adoption Trends
- 12.3.8 Leading Suppliers and Competition
- 12.3.9 Regional Demand and Opportunities
- 12.4 By Customer Type - Market Size and Forecast, 2025-2035
- 12.4.1 Segment Definition and Scope
- 12.4.2 Historical Market Size, 2018-2025
- 12.4.3 Revenue Forecast, 2025-2035
- 12.4.4 Base-Year Market Share, 2025
- 12.4.5 Segment CAGR and Growth Drivers
- 12.4.6 Subsegment Market Size and Forecast
- 12.4.6.1 Large Enterprises
- 12.4.6.2 Mid-Market Enterprises
- 12.4.6.3 Small Businesses
- 12.4.6.4 Government Entities
- 12.4.7 Subsegment Pricing and Adoption Trends
- 12.4.8 Leading Suppliers and Competition
- 12.4.9 Regional Demand and Opportunities
- 12.5 By End-Use Industry - Market Size and Forecast, 2025-2035
- 12.5.1 Segment Definition and Scope
- 12.5.2 Historical Market Size, 2018-2025
- 12.5.3 Revenue Forecast, 2025-2035
- 12.5.4 Base-Year Market Share, 2025
- 12.5.5 Segment CAGR and Growth Drivers
- 12.5.6 Subsegment Market Size and Forecast
- 12.5.6.1 Financial Services
- 12.5.6.2 Government and Public Administration
- 12.5.6.3 Critical Infrastructure Industries
- 12.5.6.4 Non-Critical-Infrastructure Private Industries
- 12.5.7 Subsegment Pricing and Adoption Trends
- 12.5.8 Leading Suppliers and Competition
- 12.5.9 Regional Demand and Opportunities
- 12.6 By Delivery Model - Market Size and Forecast, 2025-2035
- 12.6.1 Segment Definition and Scope
- 12.6.2 Historical Market Size, 2018-2025
- 12.6.3 Revenue Forecast, 2025-2035
- 12.6.4 Base-Year Market Share, 2025
- 12.6.5 Segment CAGR and Growth Drivers
- 12.6.6 Subsegment Market Size and Forecast
- 12.6.6.1 Australian Onshore Delivery
- 12.6.6.2 Hybrid Onshore-Offshore Delivery
- 12.6.6.3 Offshore Delivery
- 12.6.7 Subsegment Pricing and Adoption Trends
- 12.6.8 Leading Suppliers and Competition
- 12.6.9 Regional Demand and Opportunities
- 12.7 Segment Growth Comparison
- 12.8 Segment Attractiveness and Priority Matrix
Chapter 13 Australia Cybersecurity SOCaaS and MDR End-Use and Application Market Outlook
- 13.1 End-Use Industry and Customer Demand Structure
- 13.2 Leading Applications and Customer Groups
- 13.3 End-Use Market Size, Share and Forecast
- 13.4 Major End-Use Industry Deep Dives
- 13.4.1 Customer Requirements and Use Cases
- 13.4.2 Demand and Replacement Cycles
- 13.4.3 Technical and Regulatory Considerations
- 13.4.4 Purchasing and Procurement Models
- 13.4.5 Leading Vendors and Distribution Channels
- 13.4.6 Forecast and Commercial Opportunities
- 13.5 Emerging Applications and Cross-Segment Demand
- 13.6 End-Use Industry Investment Priorities
Chapter 14 Australia Cybersecurity SOCaaS and MDR Geographic Market Outlook, 2025-2035
- 14.1 Domestic Market Distribution and Demand Clusters
- 14.2 State- or Province-Wise Market Size and Forecast, 2025-2035
- 14.3 City and Metropolitan Market Outlook
- 14.4 Industrial, Manufacturing and Commercial Clusters
- 14.5 Geographic Concentration of Key End Users
- 14.6 Local Pricing and Purchasing Differences
- 14.7 Domestic Production Facilities and Capacity Map
- 14.8 Local Infrastructure and Project Pipeline
- 14.9 State-Level Policy and Incentive Differences
- 14.10 Subnational Investment Hotspots and Opportunities
- 14.11 Distribution and Logistics Networks
- 14.12 Domestic Competitive Footprint
Chapter 15 Australia Cybersecurity SOCaaS and MDR Technology, Innovation and Sustainability Outlook
- 15.1 Technology Landscape and Maturity
- 15.2 Product, Process and Service Innovation
- 15.3 AI, Automation and Digital Tools in the Industry
- 15.4 Technology Adoption and Performance Benchmarking
- 15.5 Innovation Pipeline and R&D Investment
- 15.6 Patent and Intellectual Property Trends
- 15.7 Energy Efficiency and Resource Management
- 15.8 Sustainability, Recycling and Circularity
- 15.9 Technology Roadmap, 2025-2035
- 15.10 Risks of Obsolescence and Technology Substitution
Chapter 16 Australia Cybersecurity SOCaaS and MDR Market Key Strategic Imperatives
- 16.1 Growth and Market Entry Priorities
- 16.2 High-Return Products and Segments
- 16.3 Pricing, Profitability and Cost Optimization
- 16.4 Technology Investment and Product Differentiation
- 16.5 Supply Chain Localization and Resilience
- 16.6 Distribution and Customer Acquisition
- 16.7 Partnership, Acquisition and Capacity Strategy
- 16.8 Regional Expansion Priorities
- 16.9 Short-, Medium- and Long-Term Actions
Chapter 17 Competition Outlook
- 17.1 Industry Competition Characteristics
- 17.2 Market Structure and Concentration
- 17.3 Market Share and Competitive Positioning, 2025
- 17.4 Company-Wise Revenue and Product Benchmarking
- 17.5 Production and Service Capacity Benchmarking
- 17.6 Technology, Pricing and Differentiation
- 17.7 Regional Footprint and Distribution Strength
- 17.8 Mergers, Acquisitions and Strategic Alliances
- 17.9 New Entrants and Competitive Threats
- 17.10 Porter's Five Forces and Industry Attractiveness
- 17.11 Competitive Outlook, 2025-2035
Chapter 18 Company Profiles
- 18.1 Company Coverage and Selection Criteria
- 18.2 Telstra Purple
- 18.2.1 Business Description
- 18.2.2 Company Ownership and Geographic Presence
- 18.2.3 Product and Service Portfolio
- 18.2.4 Manufacturing and Operating Footprint
- 18.2.5 Financial Performance and Investment
- 18.2.6 Market Share and Competitive Position
- 18.2.7 Technology and Innovation Capabilities
- 18.2.8 Strategic Alliances or Partnerships
- 18.2.9 Recent Developments
- 18.2.10 Growth Strategy and Outlook
- 18.3 Accenture/CyberCX
- 18.4 Optus Business
- 18.5 Thales Cyber Services ANZ
- 18.6 IBM Security ANZ
- 18.7 Secureworks ANZ
- 18.8 Macquarie Government
- 18.9 DXC Technology ANZ
- 18.10 Trustwave ANZ
- 18.11 Deloitte Cyber ANZ
- 18.12 Other Relevant Market Participants
Note: Every listed company is profiled on the structure shown under the first company. The company list is preliminary and may change based on research findings, market developments, data availability and client requirements.
Chapter 19 Disclaimer
- 19.1 Research and Forecast Disclaimer
- 19.2 Data Source and Estimation Limitations
Note: The depth of individual sections depends on data availability for this market. Volume, capacity, trade and other unit-based metrics are included where applicable.

