
Asia Pacific physical security tracks public programs
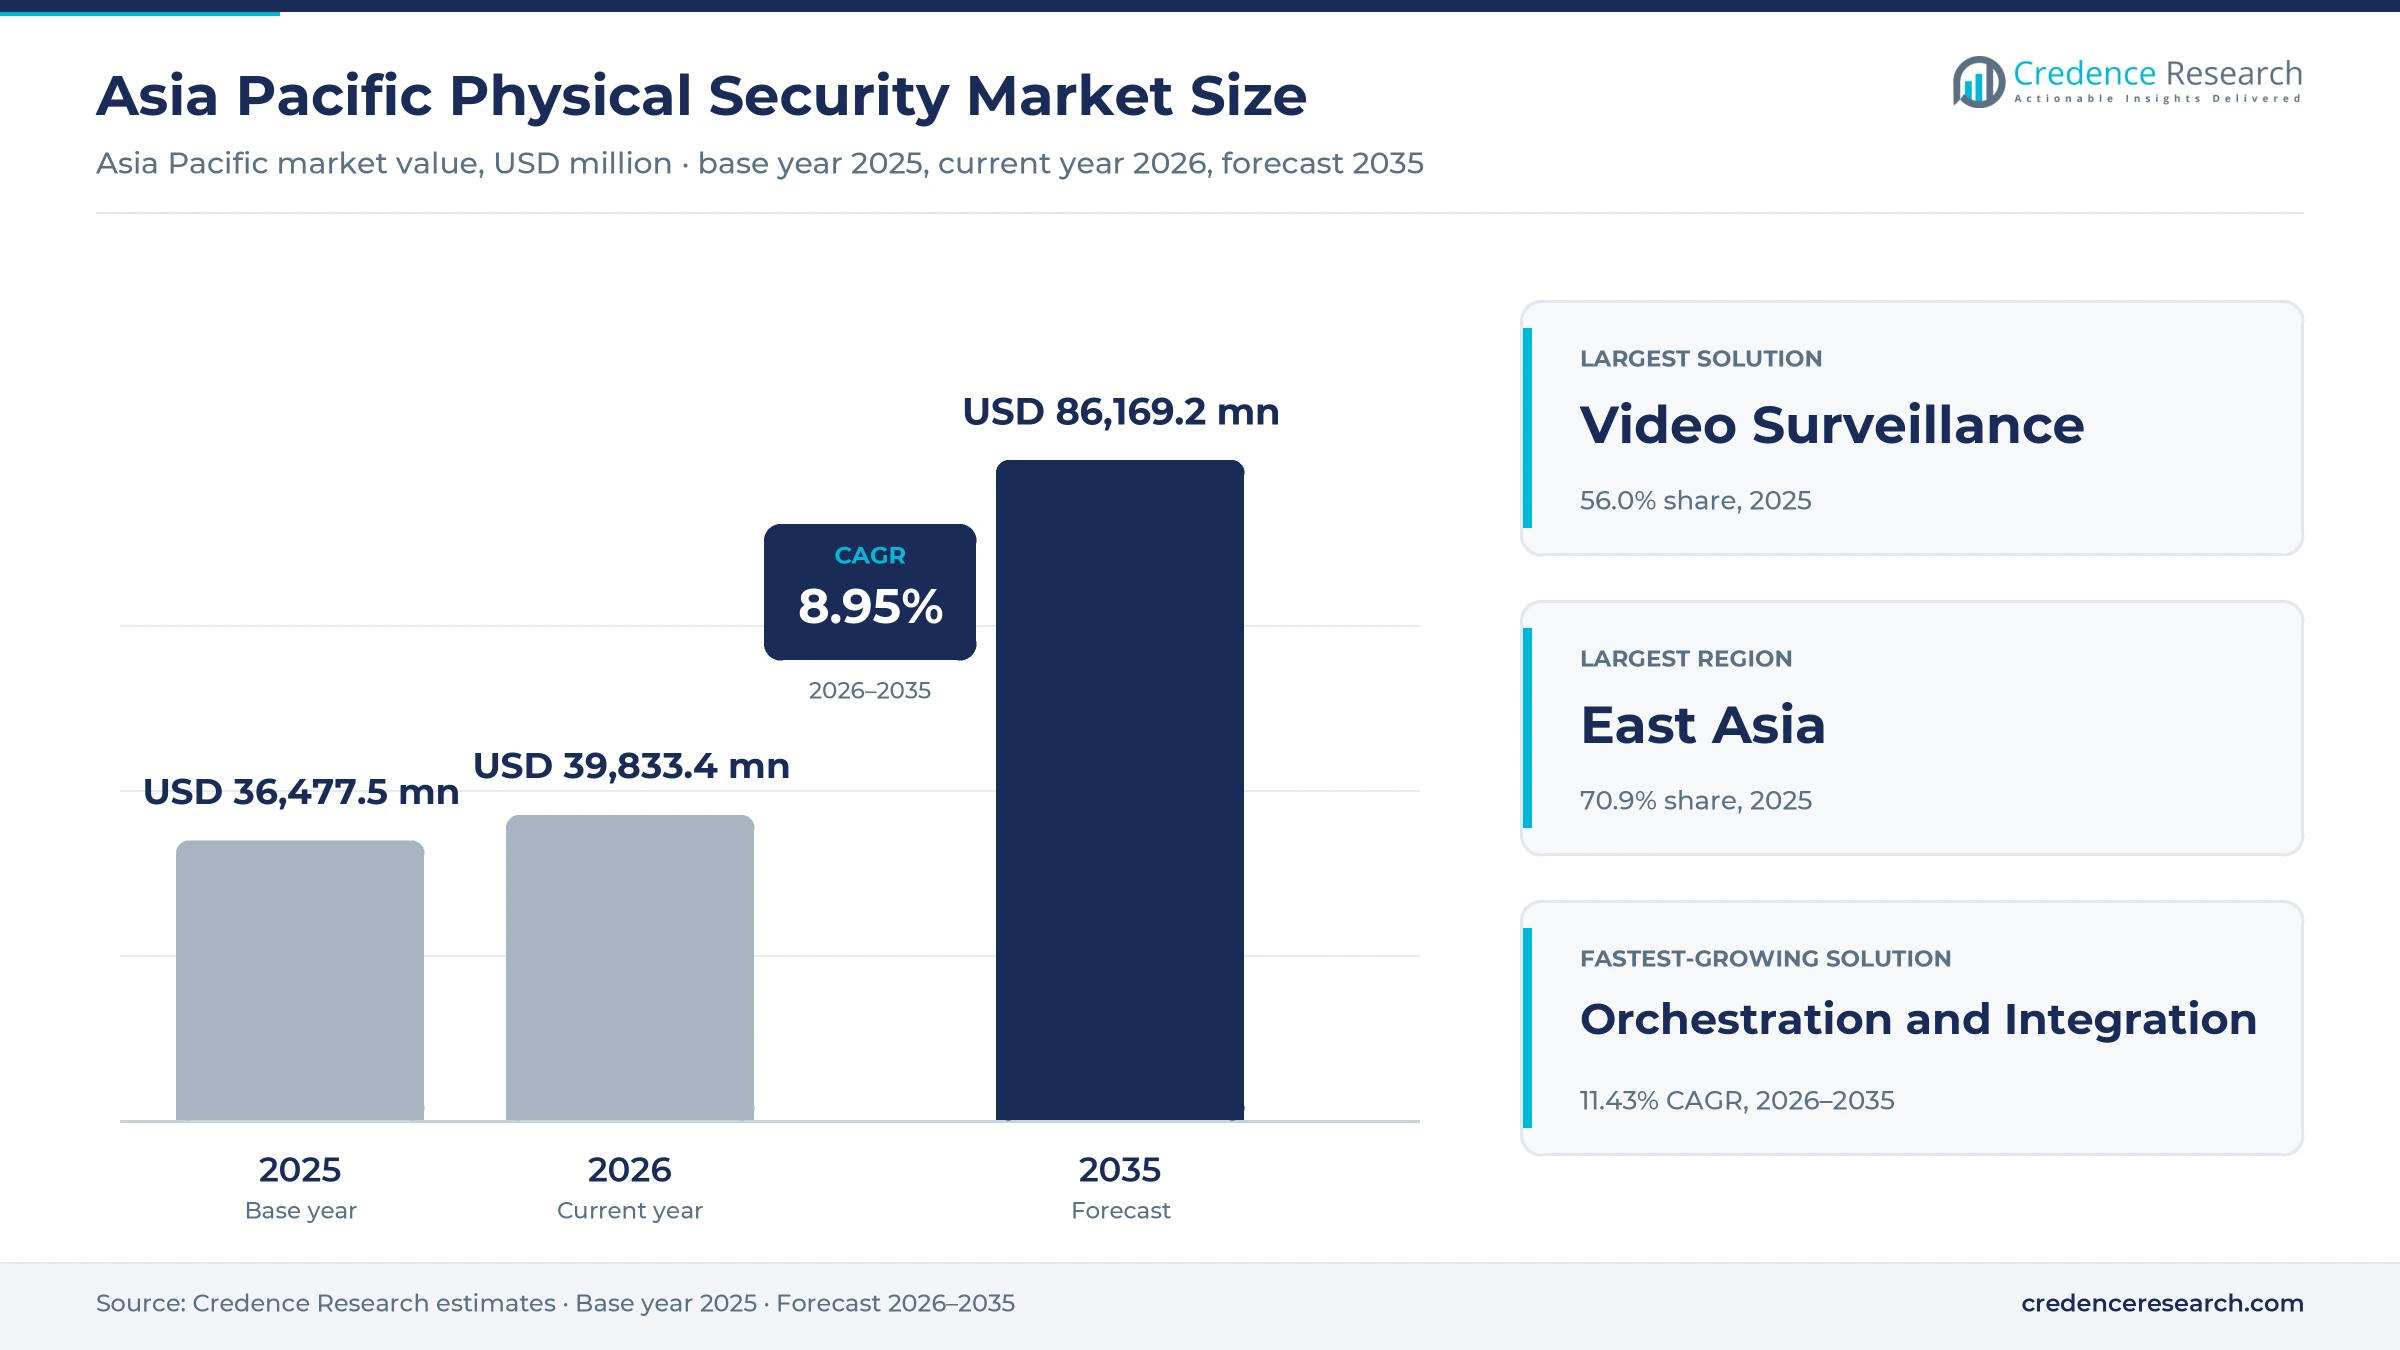
The Asia Pacific physical security market was valued at USD 36.48 billion in 2025 and is projected to increase from USD 39.83 billion in 2026 to USD 86.17 billion by 2035, registering a CAGR of 8.95% during 2026–2035. Demand comes from public camera estates, airport and bank identity checks, and rules that oblige critical asset owners to manage site risks. East Asia held the largest regional share, 70.9% in 2025, because China, Japan and South Korea combine dense urban populations with established vendors and monitoring services. South Asia is the fastest-growing region at 10.43% a year, helped by India's camera certification rules and airport face boarding. Buying criteria are also changing, since India and Vietnam now require cybersecurity certification before cameras can be sold, and South Korea requires its own certification for public agency supply. As a result, vendors with tested devices and local support hold a stronger position in public tenders than vendors competing only on unit price.
What does Asia Pacific physical security spending cover?
The market counts video surveillance, access control, alarm and detection systems, and the software that links them, along with installation, maintenance and monitoring services bought for sites across East Asia, South Asia, Southeast Asia and Oceania. Buyers include government agencies, infrastructure operators, factories, logistics sites, banks, offices, hospitals and schools, and they purchase through integrators, distributors and direct contracts.
Manned guarding payroll, cybersecurity software without a site function, consumer smart home cameras sold at retail, and vehicle dash cameras are excluded from the estimate. The value chain runs from chip and sensor suppliers through device makers and software houses to integrators and monitoring companies, and most project value is captured close to the buyer.
Asia Pacific Physical Security Market Insights
- Spending rises from USD 36.48 billion in 2025 to USD 86.17 billion by 2035, an 8.95% CAGR over 2026–2035, as public camera estates and identity systems expand across the region.
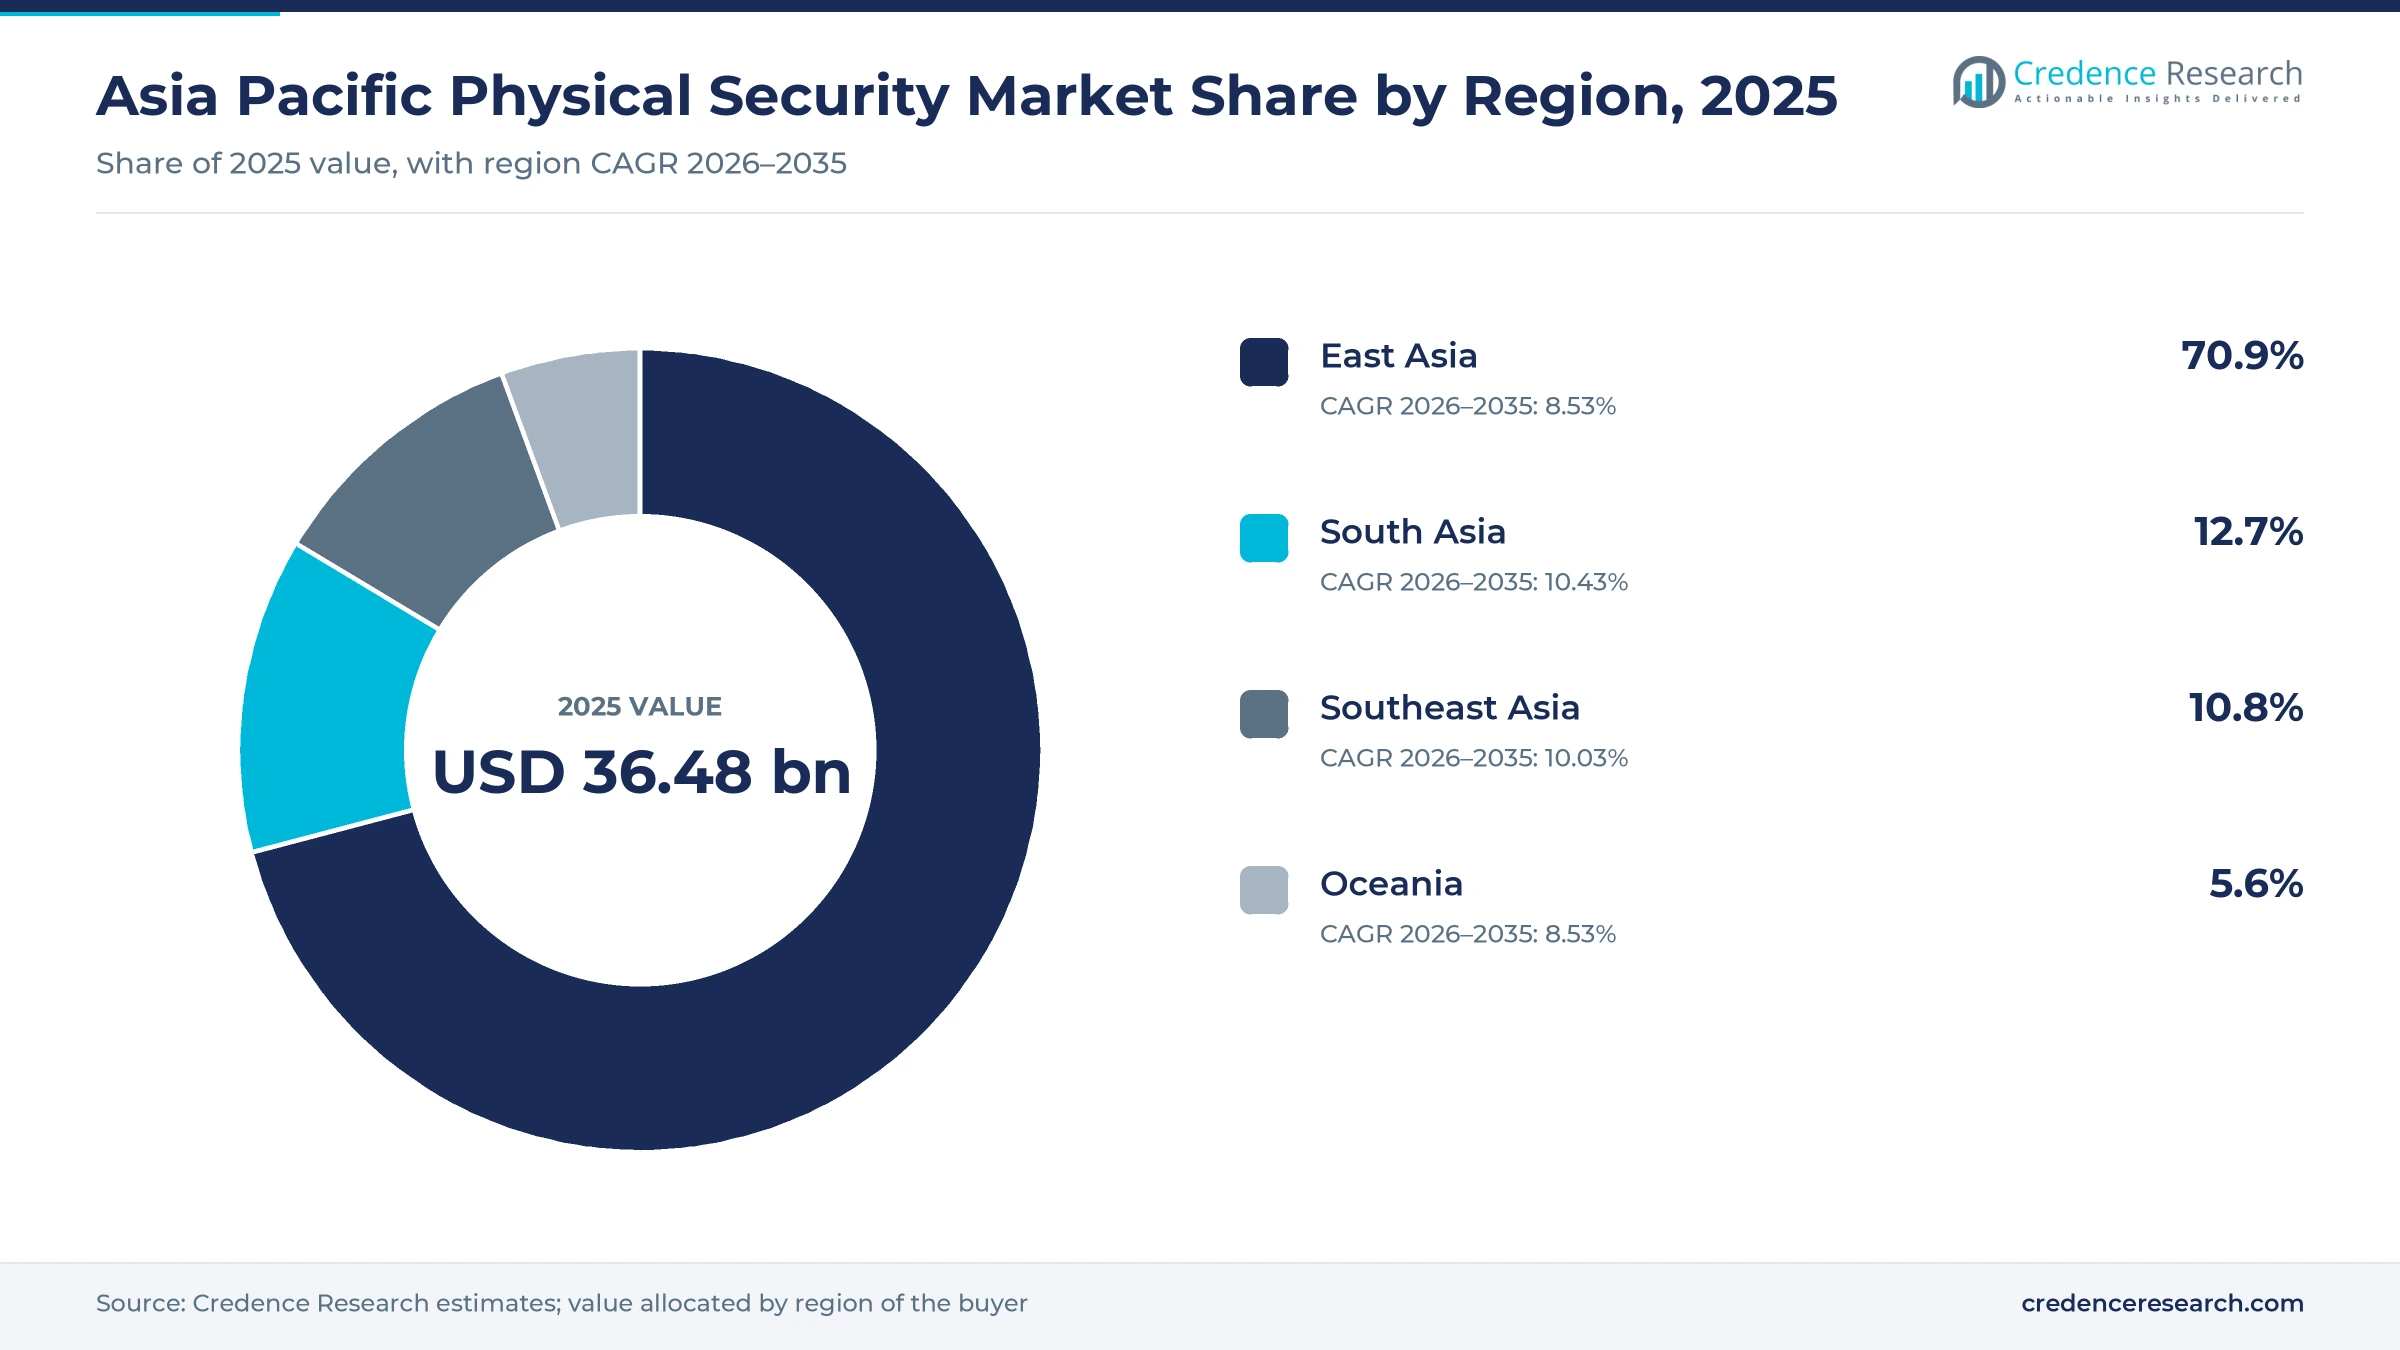
- East Asia accounted for 70.9% of 2025 value, because China, Japan and South Korea host the largest installed camera bases and leading regional vendors.
- Video surveillance held 56.0% of 2025 value, because police and city programs such as Singapore's camera estate remain the largest single purchases in the region.
- Vietnam began full enforcement of its IP camera cybersecurity regulation on Jan. 1, 2026, following India's certification requirement of April 2025, which changes who can bid.
- Hikvision and Dahua both raised prices during early 2026 as memory costs climbed, which gives certified vendors with local assembly more room in public and enterprise tenders.
Cameras lead while integration software grows fastest
Why do cameras hold the largest solution share?
Based on solution type, the market is categorized into video surveillance, access control systems, alarm and detection systems, and security orchestration and integration. Video Surveillance led with 56.0% of 2025 value because police estates dominate purchases, and Singapore alone runs more than 100,000 police cameras. ALSOK's disclosure of 600,743 electronic security contracts in Japan shows that alarms remain a recurring base rather than a growth story. Security Orchestration and Integration grows fastest at 11.43% a year, as Hikvision reports that its large vision model cuts perimeter false alarms by 90%, which makes linked systems easier to justify. Buyers of electronic door and credential systems increasingly want the same console for video events.
How do public agencies shape end-use demand?
Based on end-use industry, the market is categorized into government and critical infrastructure, manufacturing and logistics, financial and business facilities, and healthcare and education. Government and Critical Infrastructure led with 44.0% of 2025 value because Australia's critical infrastructure rules cover eight sectors and include a physical security domain, according to FTI Consulting. Healthcare and Education grows fastest at 10.28% a year, as South Korea has required operating room cameras for surgery under anesthesia since Sept. 25, 2023, with 30 days of retention. Hanwha Vision also announced in April 2026 that Indian finance, retail and logistics customers awarded it projects during the first quarter.
Why does on-premises deployment still dominate?
Based on deployment model, the market is categorized into on-premises, cloud-hosted and hybrid systems. On-Premises led with 63.0% of 2025 value because public buyers control where footage sits, and South Korea's National Intelligence Service certification requires encrypted video generation, transmission and storage for agency supply. Cloud-Hosted grows fastest at 11.87% a year, as Safie in Japan reported 354,000 billable cloud cameras at the end of December 2025 and a 55.3% share of cloud recording in 2024. Hybrid designs suit banks and multi-site operators, since they keep recording local while central teams review events remotely. Safie's recurring plans show how hosted video subscriptions now compete with local recorders.
Which pricing model fits each type of buyer?
Based on pricing model, the market is categorized into project-based capital purchase, subscription-based service and maintenance and monitoring contracts. Project-Based Capital Purchase led with 58.0% of 2025 value because city programs buy in funded phases, such as Hanoi's 261 AI cameras installed in 2025 toward a goal of 40,000 by 2030. Subscription-Based Service grows fastest at 12.07% a year, as Hanwha Vision added OnCloud and its Keeper tool for small business owners in its February 2026 update. Monitoring contracts provide stability, and ALSOK reported 536,267 HOME ALSOK contracts in its fiscal 2026 table. Small sites comparing hosted door credential plans often prefer monthly fees over upfront purchases.
| Segment Group | Leading Sub-segment | Share, 2025 | Fastest-growing Sub-segment | CAGR, 2026–2035 |
|---|---|---|---|---|
| By Solution Type | Video Surveillance | 56.0% | Security Orchestration and Integration | 11.43% |
| By End-Use Industry | Government and Critical Infrastructure | 44.0% | Healthcare and Education | 10.28% |
| By Deployment Model | On-Premises | 63.0% | Cloud-Hosted | 11.87% |
| By Pricing Model | Project-Based Capital Purchase | 58.0% | Subscription-Based Service | 12.07% |
Request a Free Sample
Fill in your details and we'll send you a free sample report.
- Sample data tables & charts
- Research methodology
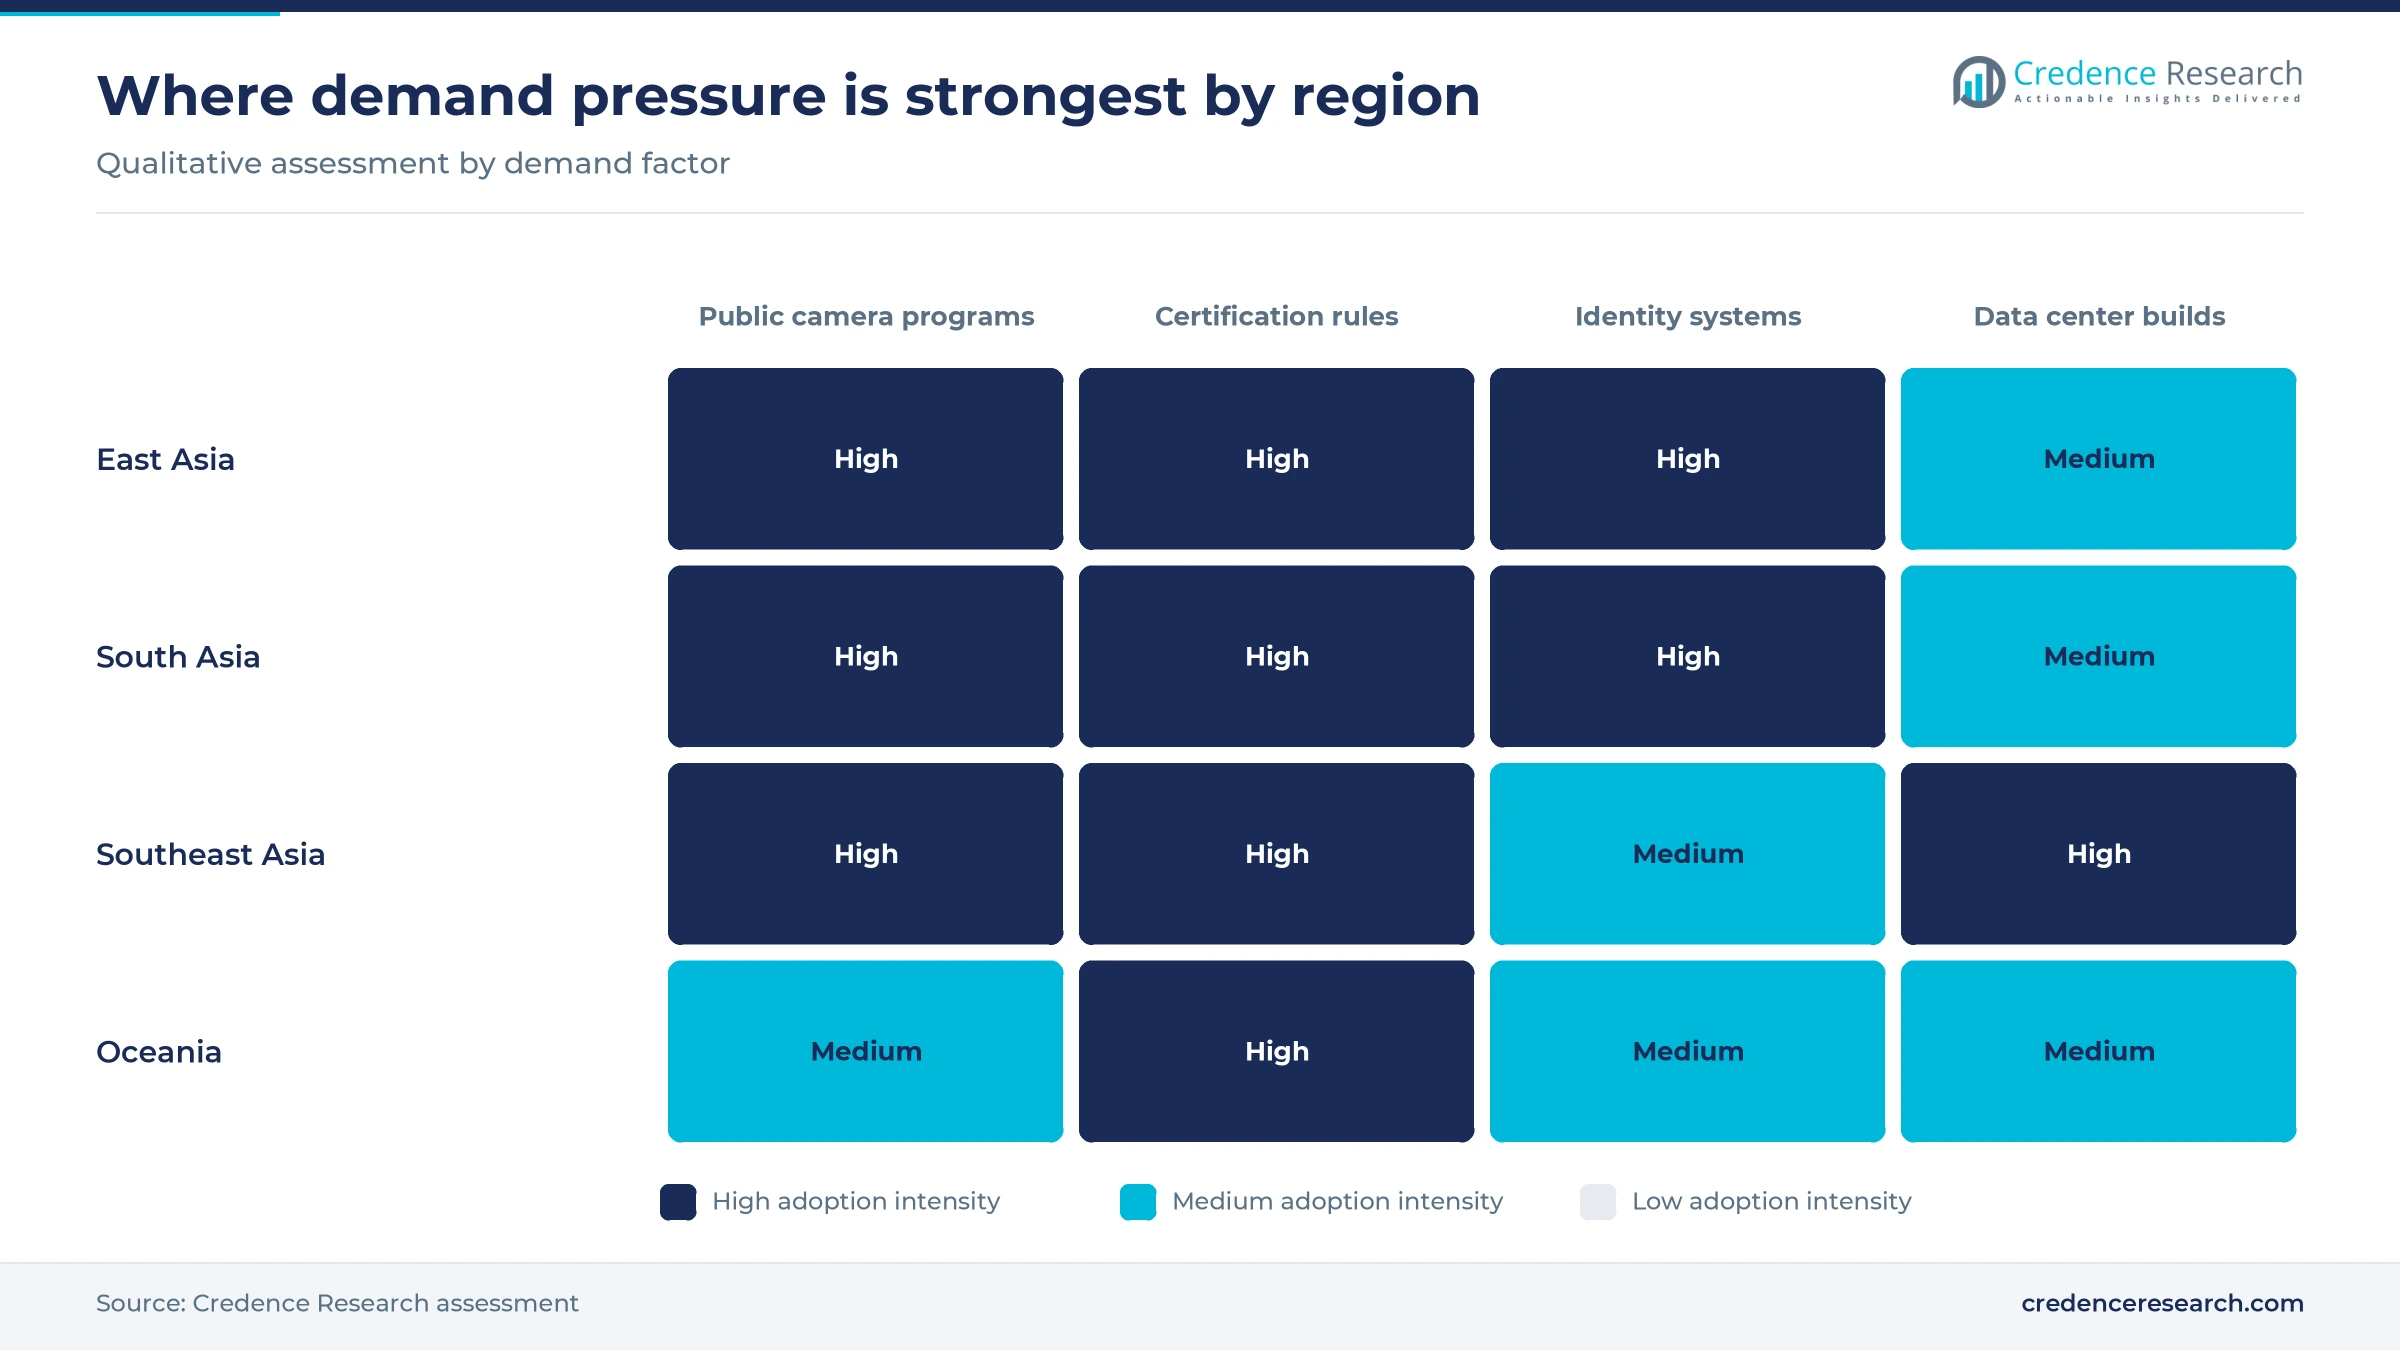
Public camera estates and identity gates pull demand
Installed public safety infrastructure keeps expanding
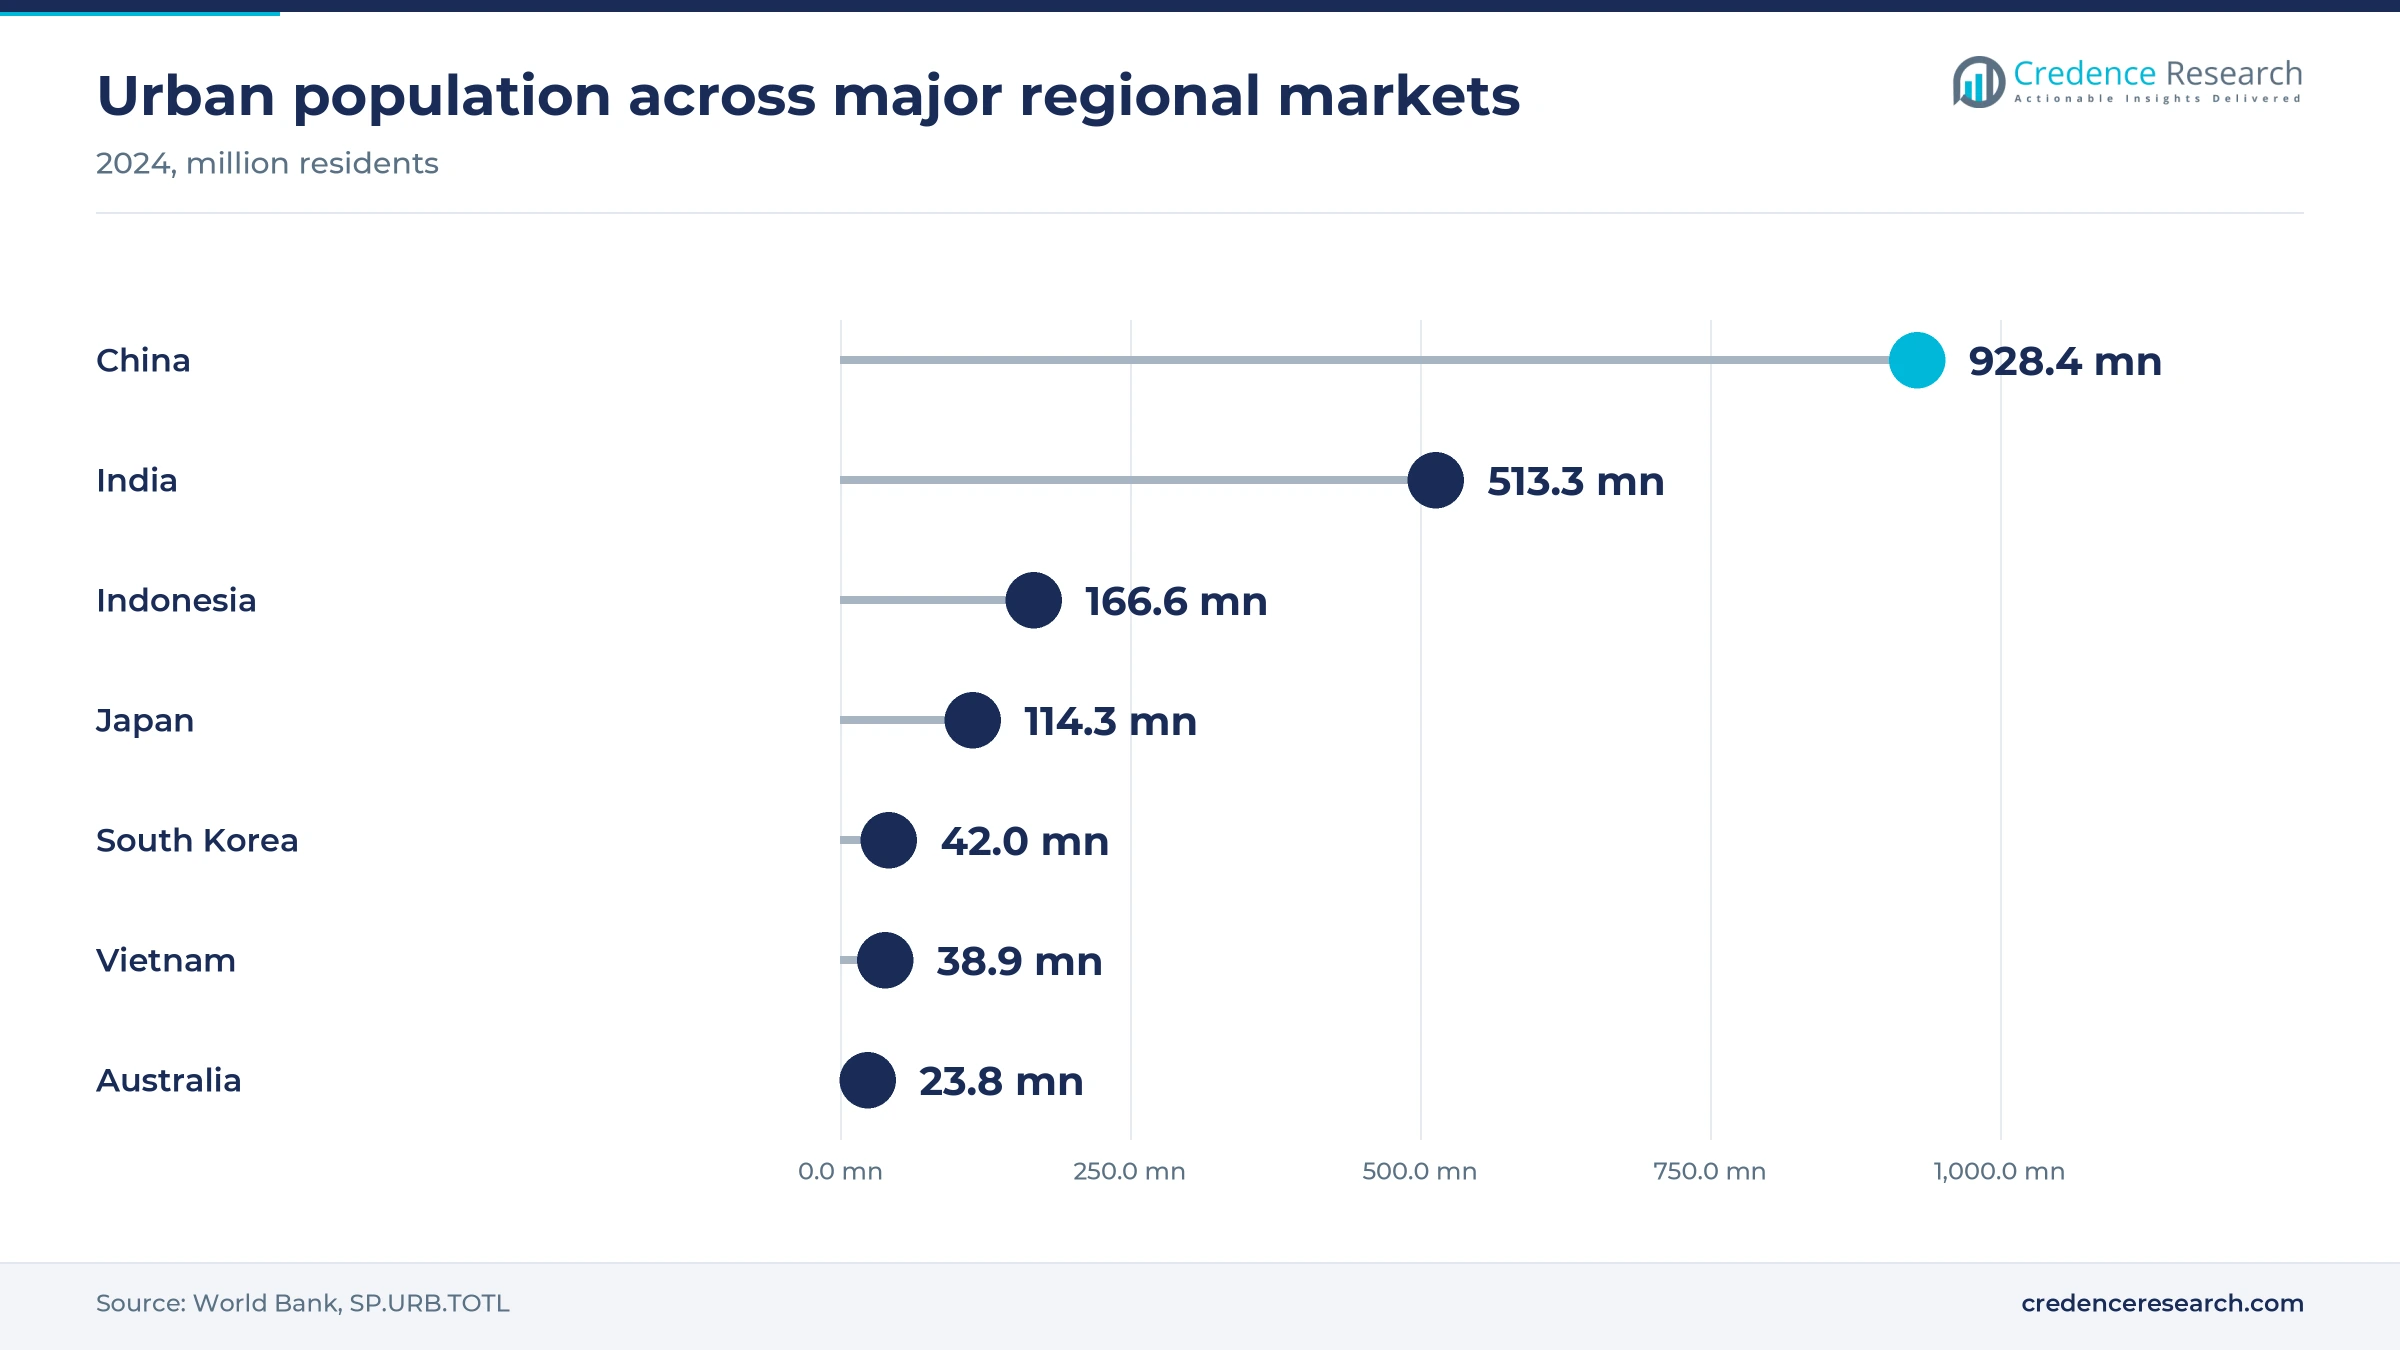
Public camera estates create the largest and most repeatable purchases in the region, because every expansion also brings upgrades, storage and control room work. Singapore's Ministry of Home Affairs told Parliament on Sept. 9, 2026 that police run more than 100,000 cameras and plan to exceed 200,000 by the mid-2030s. Hanoi police installed 261 AI cameras by July 2025, and the city aims to pass 40,000 AI cameras by 2030. Population scale supports this pipeline, since World Bank data for 2024 show about 928 million urban residents in China and 513 million in India. In turn, East Asia retains the largest installed base, while newer public estates across South Asia supply the fastest growth.
Interoperable video and identity workflows win budgets
Buyers now fund identity checks and video together, because one verified face or credential event can open a door, confirm a passenger and flag a fraud risk. NEC introduced walkthrough face recognition gates at Kansai, Narita and Haneda airports during April 2025, supporting Japan's target of 60 million overseas visitors by 2030. Digi Yatra Foundation announced in June 2025 that its app had reached 14 million downloads and 56 million airport journeys, with 15 more airports planned for fiscal 2025–26. The Reserve Bank of India also asked lenders in March 2026 whether AI facial recognition is feasible at ATMs and branches, according to Angel One. As a result, Security Orchestration and Integration is the fastest solution line at 11.43% a year.
Critical infrastructure protection rules set minimums
Regulators are turning site protection into a documented duty, which moves purchases from discretionary upgrades to compliance spending with named deadlines. Australia's risk management program rules cover eight sectors, and owners must apply controls that include physical security and natural hazards, according to FTI Consulting. South Korea's National Intelligence Service makes its Security Function Certification mandatory for public supply, and Hanwha Vision reported four certified AI models on July 23, 2026, with 14 targeted during the second half of 2026. New assets add to this base, since JLL counted 850 megawatts of operating data center capacity in Johor in April 2026. Consequently, Government and Critical Infrastructure held 44.0% of 2025 value.
Guard shortages push owners toward remote monitoring
Labor scarcity is turning people-based protection into technology purchases, particularly in Japan, where guard recruitment has become a national policy question for regulators. Japan's National Police Agency announced on Sept. 10, 2026, that it would study adding security work to a foreign worker program starting in April 2027, citing serious labor shortages, according to The Star. ALSOK's contract table shows why technology is the alternative, with 600,743 electronic security contracts against 4,556 stationed guard contracts in fiscal 2026. Hikvision also states that its large vision model reduces perimeter false alarms by 90%, which lowers the staffing burden of remote response. These conditions favor Subscription-Based Service, which is the fastest pricing line at 12.07% a year.
Certified devices and cloud video reshape buying
Shift toward mandatory camera cybersecurity certification
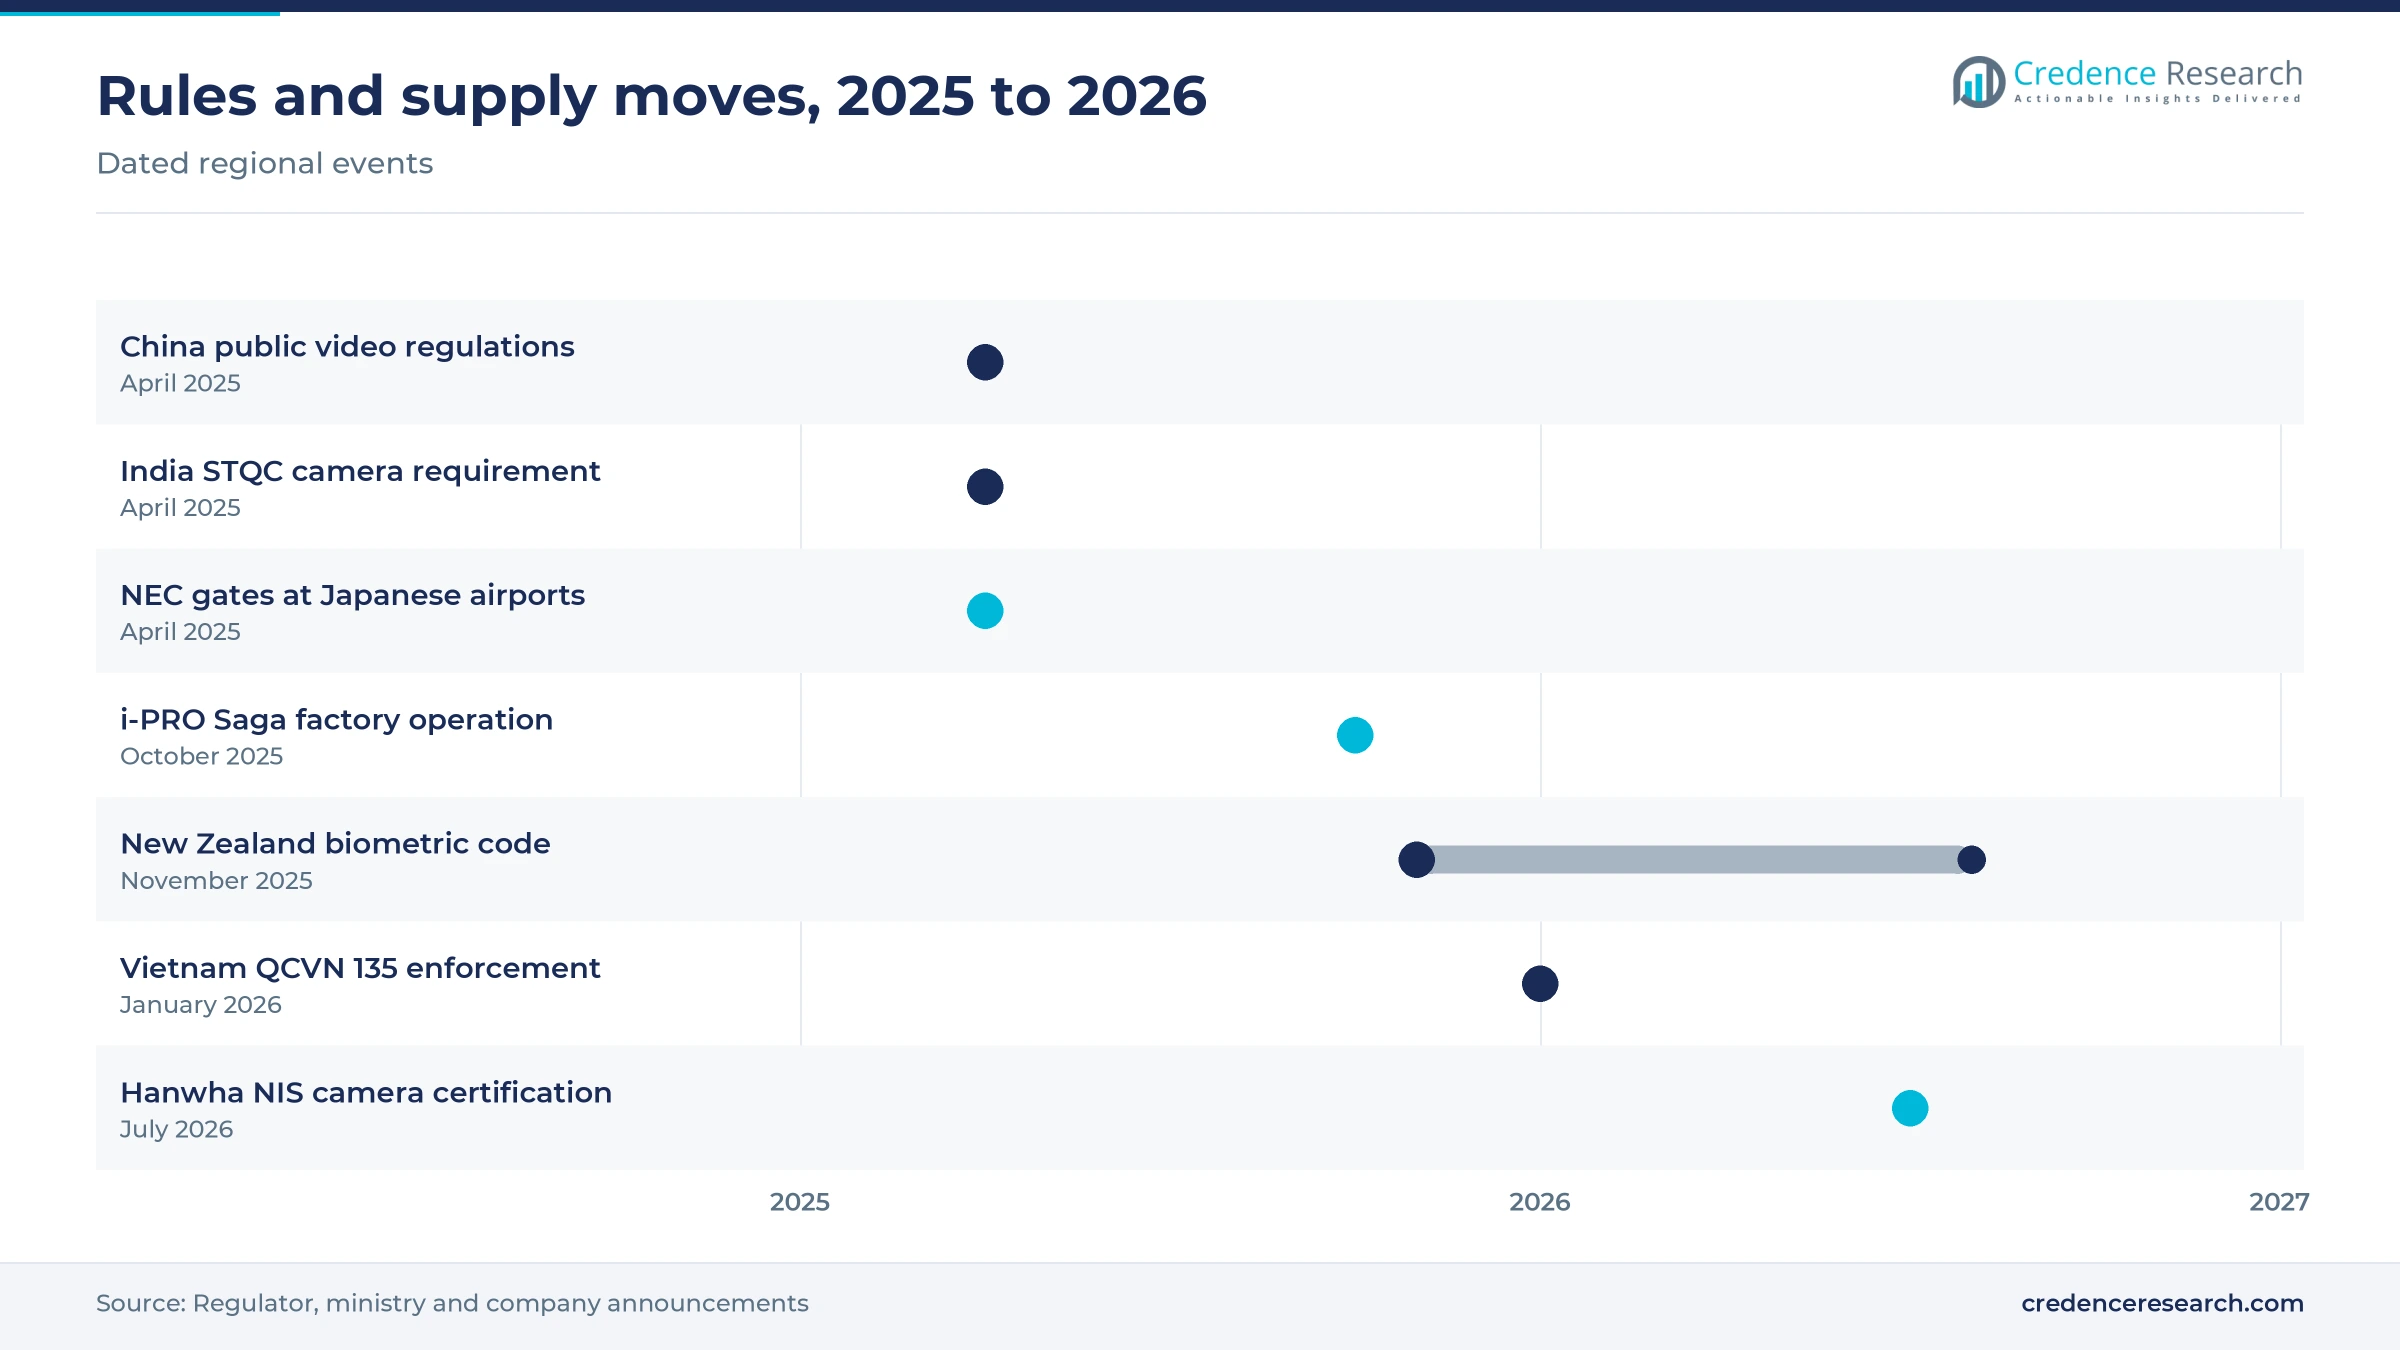
Certification has moved from a preference to a market entry condition in several countries, which changes supplier lists and product cycles. Vietnam's QCVN 135 regulation began trial application on Feb. 15, 2025, and full enforcement on Jan. 1, 2026, after authorities found more than 800,000 cameras streaming publicly, about 45% with vulnerabilities. India made STQC certification under its IoT scheme mandatory for CCTV products in April 2025, according to certification consultancy MPR. Vendors have responded quickly, with Axis Communications announcing the first QCVN certification in Vietnam on Aug. 14, 2026, and its first Indian BIS ER-01 approval on July 3, 2026. Consequently, compliance cost now sits inside every project bid across Southeast Asia and India.
Rise of AI cameras in mainstream product mixes
Analytics are moving into standard cameras, so buyers now expect detection and search functions without a separate server project or a costly retrofit. Hanwha Vision said on Feb. 5, 2026, that AI cameras reached 49% of its network camera sales in the fourth quarter of 2025, up 14 percentage points in a year. Hanoi's police cameras recognize faces and number plates from up to 700 meters, according to Viet Nam News in July 2025, with violation notices sent within two hours. NEC's airport gates apply similar processing to identity at walking speed. Video Surveillance therefore remains at 56.0% of value, with spending moving toward analytics-equipped camera software.
Opening in cloud video for multi-site operators
Cloud video offers a clear opening among multi-site enterprise estates and small business sites, because these buyers lack control room staff and prefer predictable monthly costs. Safie disclosed 354,000 billable cameras at the end of December 2025, showing that Japanese buyers already accept recurring plans at scale. Hanwha Vision also lists OnCloud and its Keeper store management tool for small business owners in its February 2026 update, which shows major vendors moving down market. The current base remains small, since On-Premises still holds 63.0% of 2025 value. However, Cloud-Hosted grows at 11.87% a year, leaving room for integrators that bundle installation, storage and support.
Opening in data center and industrial campus protection
New data center campuses offer an attractive opening, because each site needs layered perimeter, entry and video systems before operators can accept tenants. JLL figures reported by the New Straits Times in April 2026 show Johor with 1,800 megawatts under construction and Malaysia rising from 900 megawatts at the end of 2025 to 2,055 megawatts by the end of 2026. Operators shopping for server hall perimeter and entry systems favor certified suppliers with local service teams. Hanwha Vision also announced logistics and finance project wins in India for the first quarter of 2026, which shows similar demand beyond server halls. Southeast Asia, growing at 10.03% a year, is the natural starting point.
Component costs and privacy rules pressure vendor margins
Memory and sensor costs lift device prices
Component inflation is squeezing vendors and price-sensitive buyers at the same time. Reseller Vikylin reported that Hikvision raised prices by 8% to 15% from Feb. 27, 2026, while Dahua added 3% to 8% from March 5, 2026, with storage-heavy recorders most affected. Small integrators bidding fixed-price projects carry the largest exposure, since their quotes can expire before stock arrives. Consequently, buyers may delay refreshes or accept lower specifications, while vendors shorten quote validity periods and redesign recorders around smaller memory configurations.
Poorly secured cameras damage buyer confidence
Weak device security creates real privacy harm and damages trust in connected systems. South Korean police arrested four suspects in late 2025 over the hacking of more than 120,000 IP cameras, according to BleepingComputer. Vietnam's Department of Information Security also found more than 800,000 cameras streaming publicly. Homes, clinics and small businesses suffer most, because they rarely change default passwords. As a result, buyers demand certified devices, unique passwords and regular firmware updates, which raises support costs for integrators serving small accounts.
Origin restrictions narrow supplier choice
Origin concerns can force costly replacement of working equipment and complicate procurement planning. An Australian audit reported by Al Jazeera on Feb. 9, 2023, found at least 913 Chinese-made cameras in more than 250 government buildings, and the defense department moved to remove its units. Public agencies and their integrators face the largest burden, because replacement also means new recorders and retraining. In response, Johnson Controls has offered Illustra Standard Gen3 cameras made in India with over 75% local components since January 2024.
Biometric privacy rules slow face recognition projects
Stricter biometric rules lengthen project approval and add legal work to many identity deployments. New Zealand's Biometric Processing Privacy Code took force on Nov. 3, 2025, and existing users had until Aug. 3, 2026, to comply, according to Biometric Update. Indian banks also raised data privacy and cost concerns after the central bank's March 2026 query about ATM face checks. Retailers and lenders are most affected, so vendors increasingly offer privacy assessments, consent workflows and non-biometric alternatives alongside hardware.
East Asia holds the base as South Asia sets the pace
| Region | Value, 2025 (USD billion) | Share, 2025 | CAGR, 2026–2035 |
|---|---|---|---|
| East Asia | 25.86 | 70.9% | 8.53% |
| South Asia | 4.63 | 12.7% | 10.43% |
| Southeast Asia | 3.94 | 10.8% | 10.03% |
| Oceania | 2.04 | 5.6% | 8.53% |
East Asia anchors value through scale and domestic vendors
East Asia held 70.9% of 2025 value and grows at 8.53% a year, because China, Japan and South Korea combine the largest installed bases with major manufacturers. China's State Council regulations on public video and image systems took effect on April 1, 2025, and prohibit capture equipment in hotel rooms. South Korea requires National Intelligence Service certification for agency supply, while ALSOK's Japanese book reached 1,408,697 contracts in its fiscal 2026 table. Growth is slower here because much spending replaces existing equipment.
South Asia grows fastest on India-led compliance and tenders
South Asia held 12.7% of 2025 value and grows fastest at 10.43% a year, because India's urban base and rules are pulling suppliers into local certification. Hanwha Vision described India in April 2026 as the third-largest single-country video surveillance market after China and the United States, and it obtained STQC approval that month. Pakistan's central bank also directed banks to install cameras of at least five megapixels in Tier 1 cities and high-risk areas by March 31, 2025, according to Profit.
Southeast Asia builds on city cameras and data campuses
Southeast Asia held 10.8% of 2025 value and grows at 10.03% a year, because governments and data center developers are both adding sites. Singapore plans to double its police estate by the mid-2030s, and Hanoi aims for 40,000 AI cameras by 2030. Johor added 574 megawatts over five years, according to JLL figures published by the New Straits Times in April 2026. Vendors are building local reach as well, and Dahua invested over 35 million baht in a Bangkok showroom.
Oceania buys on compliance and supply chain trust
Oceania held 5.6% of 2025 value and grows at 8.53% a year, the smallest base in the region and one shaped heavily by regulation. Australia's critical infrastructure rules cover eight sectors, so energy, water, health and transport owners must document physical security risks and controls. Public buyers have also scrutinized camera origin since the 2023 audit of government buildings. New Zealand's biometric code, in full effect for existing users since Aug. 3, 2026, adds approval steps for retailers using face recognition.
Certification and factory moves mark 2025 and 2026
| Development | Status and market relevance |
|---|---|
| In April 2025, NEC installed walkthrough face recognition gates at Kansai, Narita and Haneda airports for Japanese border processing. | Live at three airports; supports identity and video convergence |
| In July 2025, Triton completed its purchase of the former Bosch security products business, now called Keenfinity Group, with a plant in Zhuhai, China. | Completed; creates an independent vendor |
| In October 2025, i-PRO took over operation of its Saga factory in Japan, starting near 14,000 cameras a month and targeting 40,000 by fiscal 2028. | Operating; expands Japan-made supply |
| In July 2026, Hanwha Vision reported National Intelligence Service certification for four AI camera models in South Korea. | Certified; opens public agency supply |
| In August 2026, Axis Communications announced the first QCVN certification in Vietnam for three camera models. | Certified; allows continued import and sale |
Edge AI and encrypted devices define new product cycles
- Edge AI processors run detection on the camera itself, which cuts bandwidth use and supports functions such as Hanoi's real-time plate and face recognition.
- Encrypted device designs protect video through generation, transmission and storage, which South Korean agency certification now examines for each model.
- Walkthrough biometric gates verify travelers without stopping them, which NEC introduced at Japanese airports in April 2025 under its Bio-IDiom Edge software.
- Cloud recording platforms replace site recorders for multi-branch operators, which Hanwha Vision now lists under its OnCloud service.
Need a Custom Version of This Report?
Tailor the scope, geography, or segments to your exact requirements.
- Custom geography or segment scope
- Direct access to our analyst team
Certification access separates regional competitors
Competition now turns on certification, local supply and software depth as much as on device price. Hikvision sells in more than 180 countries and regions and promotes large AI models that reduce false alarms, while Dahua Technology has invested in a Bangkok showroom for city, traffic and building solutions. Hanwha Vision is using South Korean and Indian certifications to pursue public, finance and logistics buyers. Japanese suppliers defend quality positions, with NEC concentrated in biometrics and i-PRO scaling its Saga factory. Axis Communications has focused on early certification in Vietnam and India, and Johnson Controls emphasizes Indian-made Illustra cameras. Honeywell markets browser-based access control and visitor management in India, and Keenfinity Group now operates independently with its plant in Zhuhai. As a result, buyers can no longer compare suppliers on hardware alone, and integrators with several certified lines hold a stronger bargaining position.
Companies profiled and their roles in this market
| Company | Type | Role in the market |
|---|---|---|
| Hikvision | Device and AI platform maker | Sells in 180+ countries and regions and promotes large AI models for perimeter protection |
| Dahua Technology | Device and solutions maker | Bangkok showroom for city, traffic and building solutions; raised prices in March 2026 |
| Hanwha Vision | Camera and software maker | NIS certification in South Korea and STQC approval in India during 2026 |
| NEC | Biometrics supplier | Walkthrough face recognition gates at three Japanese airports since April 2025 |
| i-PRO | Camera maker | Runs the Saga factory in Japan as its core plant from October 2025 |
| Axis Communications | Network camera maker | First QCVN certification in Vietnam and first BIS ER-01 approval in India during 2026 |
| Johnson Controls | Building security supplier | Illustra Standard Gen3 cameras made in India with over 75% local components |
| Keenfinity Group | Video, access and alarm maker | Independent since July 2025, with a manufacturing plant in Zhuhai, China |
| Honeywell | Building security supplier | Offers browser-based access control and visitor management systems in India |
Compliance now decides who can bid for public work
Credence Research's view is that compliance has become the main filter in regional purchasing, ahead of unit price in the public segments that set volumes. Vietnam, India and South Korea each now test devices before public or commercial supply, and this reduces the supplier list for any given tender. Consequently, buyers should ask for certification evidence early and budget for component price swings during 2026 and 2027. Vendors should prioritize local service capacity, since multi-site customers increasingly want cloud options with on-site support. The most useful leading indicator is the pace of city camera tenders across India and Southeast Asia.
How the regional estimate was built
The report uses 2025 as the base year and 2035 as the forecast year, with market values from the Credence Research model. Segment and regional splits are Credence Research estimates, informed by government statements, regulator publications, company announcements and investor disclosures opened for this report, along with World Bank urban population data. The total was checked against a top-down estimate and a per-resident spending calculation. No interviews or surveys were conducted for this edition of the report.
Southeast Asian and Indian tenders shape the next decade
Spending is expected to reach USD 86.17 billion by 2035, with East Asia remaining the largest base and India and Southeast Asia adding most of the new tender volume. Singapore's and Hanoi's stated camera targets give visibility well into the 2030s, while data center construction in Malaysia supports nearer-term orders. Component prices remain the main short-term risk to demand, since Hikvision raised list prices by as much as 15% during February 2026. Over the longer period, certified AI cameras, hybrid recording and recurring monitoring should take a larger part of each contract, which rewards suppliers that can support customers across several countries.
Frequently Asked Questions
How big is the Asia Pacific physical security market?
Which region leads Asia Pacific physical security spending?
Which region is growing fastest?
Which solution type holds the largest share?
What rules are changing purchases in the region?
How is cloud deployment developing?
What are the main risks for buyers and vendors?
Which companies operate in this market?
Table of Content
Chapter 1 Market Segmentation
- 1.1 Segmentation Framework
- 1.1.1 Product and Service Classification
- 1.1.2 Application and End-Use Classification
- 1.1.3 Technology and Solution Classification
- 1.1.4 Customer and Distribution Channel Classification
- 1.1.5 Geographic Segmentation
- 1.1.6 Market Segment Definitions and Boundaries
- 1.2 By Solution Type
- 1.2.1 Video Surveillance
- 1.2.2 Access Control Systems
- 1.2.3 Alarm and Detection Systems
- 1.2.4 Security Orchestration and Integration
- 1.3 By End-Use Industry
- 1.3.1 Government and Critical Infrastructure
- 1.3.2 Manufacturing and Logistics
- 1.3.3 Financial and Business Facilities
- 1.3.4 Healthcare and Education
- 1.4 By Deployment Model
- 1.4.1 On-Premises
- 1.4.2 Hybrid
- 1.4.3 Cloud-Hosted
- 1.5 By Pricing Model
- 1.5.1 Project-Based Capital Purchase
- 1.5.2 Maintenance and Monitoring Contract
- 1.5.3 Subscription-Based Service
Chapter 2 Introduction
- 2.1 Report Objectives and Scope
- 2.2 Product Definition and Industry Terminology
- 2.3 Market Inclusions and Exclusions
- 2.4 Research Process
- 2.4.1 Primary Research and Expert Interviews
- 2.4.2 Secondary Research and Source Review
- 2.4.3 Top-Down and Bottom-Up Estimation
- 2.4.4 Data Triangulation and Verification
- 2.5 Market Size Measurement Basis
- 2.5.1 2025: USD 36.48 billion → 2035: USD 86.17 billion
- 2.6 Historical and Forecast Reference Periods
- 2.6.1 Historical Period: 2018-2025
- 2.6.2 Base Year: 2025
- 2.6.3 Forecast Period: 2025-2035
- 2.7 Research Assumptions and Limitations
Chapter 3 Executive Summary
- 3.1 Market Snapshot and Key Findings
- 3.2 Base-Year Market Size, 2025
- 3.3 Forecast Market Size, 2035
- 3.4 Revenue and Volume Growth Outlook
- 3.5 Key Demand and Supply Indicators
- 3.6 Leading Market Segments
- 3.7 Fastest-Growing Market Opportunities
- 3.8 Regional Performance Highlights
- 3.9 Technology and Industry Transformation
- 3.10 Competitive Landscape Summary
- 3.11 Analyst View and Strategic Implications
Chapter 4 Asia Pacific Physical Security Market Trends and Developments
- 4.1 Historical Industry Development, 2018-2025
- 4.2 Recent Market Trends and Developments
- 4.3 Demand and Customer Behavior Trends
- 4.4 Technology and Product Innovation
- 4.5 Artificial Intelligence, Automation and Digitalization
- 4.6 Local Manufacturing and Supply Chain Realignment
- 4.7 Industry Partnerships, Mergers and Acquisitions
- 4.8 Sustainability and Circular Economy Developments
- 4.9 Government and Private Sector Investment Trends
- 4.10 Emerging Business Models and Commercialization
- 4.11 Industry Developments and Announcements
Chapter 5 Asia Pacific Physical Security Market Supply and Demand Analysis
- 5.1 Demand Trend and Consumption Analysis, 2018-2025
- 5.2 Demand Forecast, 2025-2035
- 5.3 Supply Chain Structure and Procurement Trends
- 5.4 Supply-Demand Gap and Bottlenecks
- 5.5 Import Dependence and Sourcing Structure
- 5.6 Regional Supply and Demand Concentration
Chapter 6 Asia Pacific Physical Security Market Pricing Analysis
- 6.1 Pricing Structure and Measurement
- 6.2 Historical Pricing Trends, 2018-2025
- 6.3 Pricing Outlook, 2025-2035
- 6.4 Pricing by Product and Market Segment
- 6.5 Geographic Pricing Differences
- 6.6 Key Input, Energy, Labor and Logistics Costs
- 6.7 Contract Pricing and Purchasing Models
- 6.8 Pricing Sensitivity and Competitive Positioning
- 6.9 Price, Margin and Profitability Implications
Chapter 7 Asia Pacific Physical Security Market Dynamics
- 7.1 Market Growth Drivers
- 7.1.1 Demand-Side Drivers
- 7.1.2 Technology and Innovation Drivers
- 7.1.3 Infrastructure and Investment Drivers
- 7.1.4 Regulatory and Policy Drivers
- 7.2 Market Restraints
- 7.2.1 Cost and Affordability Constraints
- 7.2.2 Technology and Adoption Barriers
- 7.2.3 Supply Chain and Operational Constraints
- 7.3 Market Challenges
- 7.3.1 Competitive Pressure and Margin Erosion
- 7.3.2 Skills, Infrastructure and Implementation Gaps
- 7.4 Emerging Market Opportunities
- 7.5 Market Dynamics Impact and Time-Horizon Assessment
Chapter 8 Asia Pacific Physical Security Value Chain Analysis
- 8.1 Industry Value Chain Overview
- 8.2 Upstream Suppliers and Critical Inputs
- 8.3 Technology and Component Providers
- 8.4 Manufacturing or Service Delivery
- 8.5 Distribution, Channel Partners and Integrators
- 8.6 Downstream Applications and End Users
- 8.7 Value Addition and Profit Pools
- 8.8 Vertical Integration and Outsourcing
- 8.9 Supplier Concentration and Risk
- 8.10 Supply Chain Localization and Resilience
Chapter 9 Asia Pacific Physical Security Market Regulations and Policies
- 9.1 Relevant Laws, Standards and Compliance Frameworks
- 9.2 Product, Service, Safety and Quality Requirements
- 9.3 Government Policies, Incentives and Subsidies
- 9.4 Imports, Exports and Trade Barriers
- 9.5 Public Procurement and Local Content Requirements
- 9.6 Data Protection, AI and Cybersecurity Compliance
- 9.7 Upcoming Policy Changes and Market Implications
Chapter 10 Asia Pacific Physical Security Market Hotspots and Opportunities
- 10.1 Market Opportunity Mapping and Growth Hotspots
- 10.2 High-Growth Applications and Customer Groups
- 10.3 Underserved Markets and White-Space Opportunities
- 10.4 Emerging Technology and Product Opportunities
- 10.5 New Capacity and Investment Hotspots
- 10.6 Market Entry and Expansion Opportunities
- 10.7 Distribution and Partnership Opportunities
- 10.8 Near-Term and Long-Term Commercial Potential
- 10.9 Opportunity Attractiveness and Execution Risks
Chapter 11 Asia Pacific Physical Security Market Outlook, 2025-2035
- 11.1 Market Size and Analysis
- 11.1.1 Revenue (Market Measurement: 2025: USD 36.48 billion → 2035: USD 86.17 billion)
- 11.1.2 Historical Market Size, 2018-2025
- 11.1.3 Base-Year Market Size, 2025
- 11.2 Market Forecast, 2025-2035
- 11.2.1 Revenue Forecast to 2035
- 11.2.2 CAGR and Year-on-Year Growth
- 11.2.3 Incremental Revenue Opportunity
- 11.3 Forecast Assumptions and Scenario Analysis
- 11.3.1 Base-Case Forecast
- 11.3.2 Optimistic and Conservative Scenarios
- 11.3.3 Technology, Pricing and Policy Sensitivities
- 11.4 Market Attractiveness and Growth Outlook
Chapter 12 Asia Pacific Physical Security Market Segmentation and Outlook
- 12.1 Segmentation Summary and Market Shares, 2025
- 12.2 Largest and Fastest-Growing Segments
- 12.3 By Solution Type - Market Size and Forecast, 2025-2035
- 12.3.1 Segment Definition and Scope
- 12.3.2 Historical Market Size, 2018-2025
- 12.3.3 Revenue Forecast, 2025-2035
- 12.3.4 Base-Year Market Share, 2025
- 12.3.5 Segment CAGR and Growth Drivers
- 12.3.6 Subsegment Market Size and Forecast
- 12.3.6.1 Video Surveillance
- 12.3.6.2 Access Control Systems
- 12.3.6.3 Alarm and Detection Systems
- 12.3.6.4 Security Orchestration and Integration
- 12.3.7 Subsegment Pricing and Adoption Trends
- 12.3.8 Leading Suppliers and Competition
- 12.3.9 Regional Demand and Opportunities
- 12.4 By End-Use Industry - Market Size and Forecast, 2025-2035
- 12.4.1 Segment Definition and Scope
- 12.4.2 Historical Market Size, 2018-2025
- 12.4.3 Revenue Forecast, 2025-2035
- 12.4.4 Base-Year Market Share, 2025
- 12.4.5 Segment CAGR and Growth Drivers
- 12.4.6 Subsegment Market Size and Forecast
- 12.4.6.1 Government and Critical Infrastructure
- 12.4.6.2 Manufacturing and Logistics
- 12.4.6.3 Financial and Business Facilities
- 12.4.6.4 Healthcare and Education
- 12.4.7 Subsegment Pricing and Adoption Trends
- 12.4.8 Leading Suppliers and Competition
- 12.4.9 Regional Demand and Opportunities
- 12.5 By Deployment Model - Market Size and Forecast, 2025-2035
- 12.5.1 Segment Definition and Scope
- 12.5.2 Historical Market Size, 2018-2025
- 12.5.3 Revenue Forecast, 2025-2035
- 12.5.4 Base-Year Market Share, 2025
- 12.5.5 Segment CAGR and Growth Drivers
- 12.5.6 Subsegment Market Size and Forecast
- 12.5.6.1 On-Premises
- 12.5.6.2 Hybrid
- 12.5.6.3 Cloud-Hosted
- 12.5.7 Subsegment Pricing and Adoption Trends
- 12.5.8 Leading Suppliers and Competition
- 12.5.9 Regional Demand and Opportunities
- 12.6 By Pricing Model - Market Size and Forecast, 2025-2035
- 12.6.1 Segment Definition and Scope
- 12.6.2 Historical Market Size, 2018-2025
- 12.6.3 Revenue Forecast, 2025-2035
- 12.6.4 Base-Year Market Share, 2025
- 12.6.5 Segment CAGR and Growth Drivers
- 12.6.6 Subsegment Market Size and Forecast
- 12.6.6.1 Project-Based Capital Purchase
- 12.6.6.2 Maintenance and Monitoring Contract
- 12.6.6.3 Subscription-Based Service
- 12.6.7 Subsegment Pricing and Adoption Trends
- 12.6.8 Leading Suppliers and Competition
- 12.6.9 Regional Demand and Opportunities
- 12.7 Segment Growth Comparison
- 12.8 Segment Attractiveness and Priority Matrix
Chapter 13 Asia Pacific Physical Security End-Use and Application Market Outlook
- 13.1 End-Use Industry and Customer Demand Structure
- 13.2 Leading Applications and Customer Groups
- 13.3 End-Use Market Size, Share and Forecast
- 13.4 Major End-Use Industry Deep Dives
- 13.4.1 Customer Requirements and Use Cases
- 13.4.2 Demand and Replacement Cycles
- 13.4.3 Technical and Regulatory Considerations
- 13.4.4 Purchasing and Procurement Models
- 13.4.5 Leading Vendors and Distribution Channels
- 13.4.6 Forecast and Commercial Opportunities
- 13.5 Emerging Applications and Cross-Segment Demand
- 13.6 End-Use Industry Investment Priorities
Chapter 14 Asia Pacific Physical Security Geographic Market Outlook, 2025-2035
- 14.1 Regional Market Size and Country-Level Shares, 2025
- 14.2 Country Market Size Comparison, 2025
- 14.3 Country Market Forecasts, 2025-2035
- 14.4 Subregional Industrial and Demand Clusters
- 14.5 Intra-Regional Pricing and Cost Differences
- 14.6 Cross-Border Trade and Supply Networks
- 14.7 Regional Supply and Demand Balances
- 14.8 Country Opportunity Comparison and Prioritization
Note: Every listed country is covered on the structure shown under the first country.
Chapter 15 Asia Pacific Physical Security Technology, Innovation and Sustainability Outlook
- 15.1 Technology Landscape and Maturity
- 15.2 Product, Process and Service Innovation
- 15.3 AI, Automation and Digital Tools in the Industry
- 15.4 Technology Adoption and Performance Benchmarking
- 15.5 Innovation Pipeline and R&D Investment
- 15.6 Patent and Intellectual Property Trends
- 15.7 Energy Efficiency and Resource Management
- 15.8 Sustainability, Recycling and Circularity
- 15.9 Technology Roadmap, 2025-2035
- 15.10 Risks of Obsolescence and Technology Substitution
Chapter 16 Asia Pacific Physical Security Market Key Strategic Imperatives
- 16.1 Growth and Market Entry Priorities
- 16.2 High-Return Products and Segments
- 16.3 Pricing, Profitability and Cost Optimization
- 16.4 Technology Investment and Product Differentiation
- 16.5 Supply Chain Localization and Resilience
- 16.6 Distribution and Customer Acquisition
- 16.7 Partnership, Acquisition and Capacity Strategy
- 16.8 Regional Expansion Priorities
- 16.9 Short-, Medium- and Long-Term Actions
Chapter 17 Competition Outlook
- 17.1 Industry Competition Characteristics
- 17.2 Market Structure and Concentration
- 17.3 Market Share and Competitive Positioning, 2025
- 17.4 Company-Wise Revenue and Product Benchmarking
- 17.5 Production and Service Capacity Benchmarking
- 17.6 Technology, Pricing and Differentiation
- 17.7 Regional Footprint and Distribution Strength
- 17.8 Mergers, Acquisitions and Strategic Alliances
- 17.9 New Entrants and Competitive Threats
- 17.10 Porter's Five Forces and Industry Attractiveness
- 17.11 Competitive Outlook, 2025-2035
Chapter 18 Company Profiles
- 18.1 Company Coverage and Selection Criteria
- 18.2 Hikvision
- 18.2.1 Business Description
- 18.2.2 Company Ownership and Geographic Presence
- 18.2.3 Product and Service Portfolio
- 18.2.4 Manufacturing and Operating Footprint
- 18.2.5 Financial Performance and Investment
- 18.2.6 Market Share and Competitive Position
- 18.2.7 Technology and Innovation Capabilities
- 18.2.8 Strategic Alliances or Partnerships
- 18.2.9 Recent Developments
- 18.2.10 Growth Strategy and Outlook
- 18.3 Dahua Technology
- 18.4 SECOM
- 18.5 Honeywell
- 18.6 Johnson Controls
- 18.7 i-PRO
- 18.8 Keenfinity Group
- 18.9 Axis Communications
- 18.10 NEC
- 18.11 Hanwha Vision
- 18.12 Other Relevant Market Participants
Note: Every listed company is profiled on the structure shown under the first company. The company list is preliminary and may change based on research findings, market developments, data availability and client requirements.
Chapter 19 Disclaimer
- 19.1 Research and Forecast Disclaimer
- 19.2 Data Source and Estimation Limitations
Note: The depth of individual sections depends on data availability for this market. Volume, capacity, trade and other unit-based metrics are included where applicable.

