
Breach reporting and cloud shifts lift subscription spend
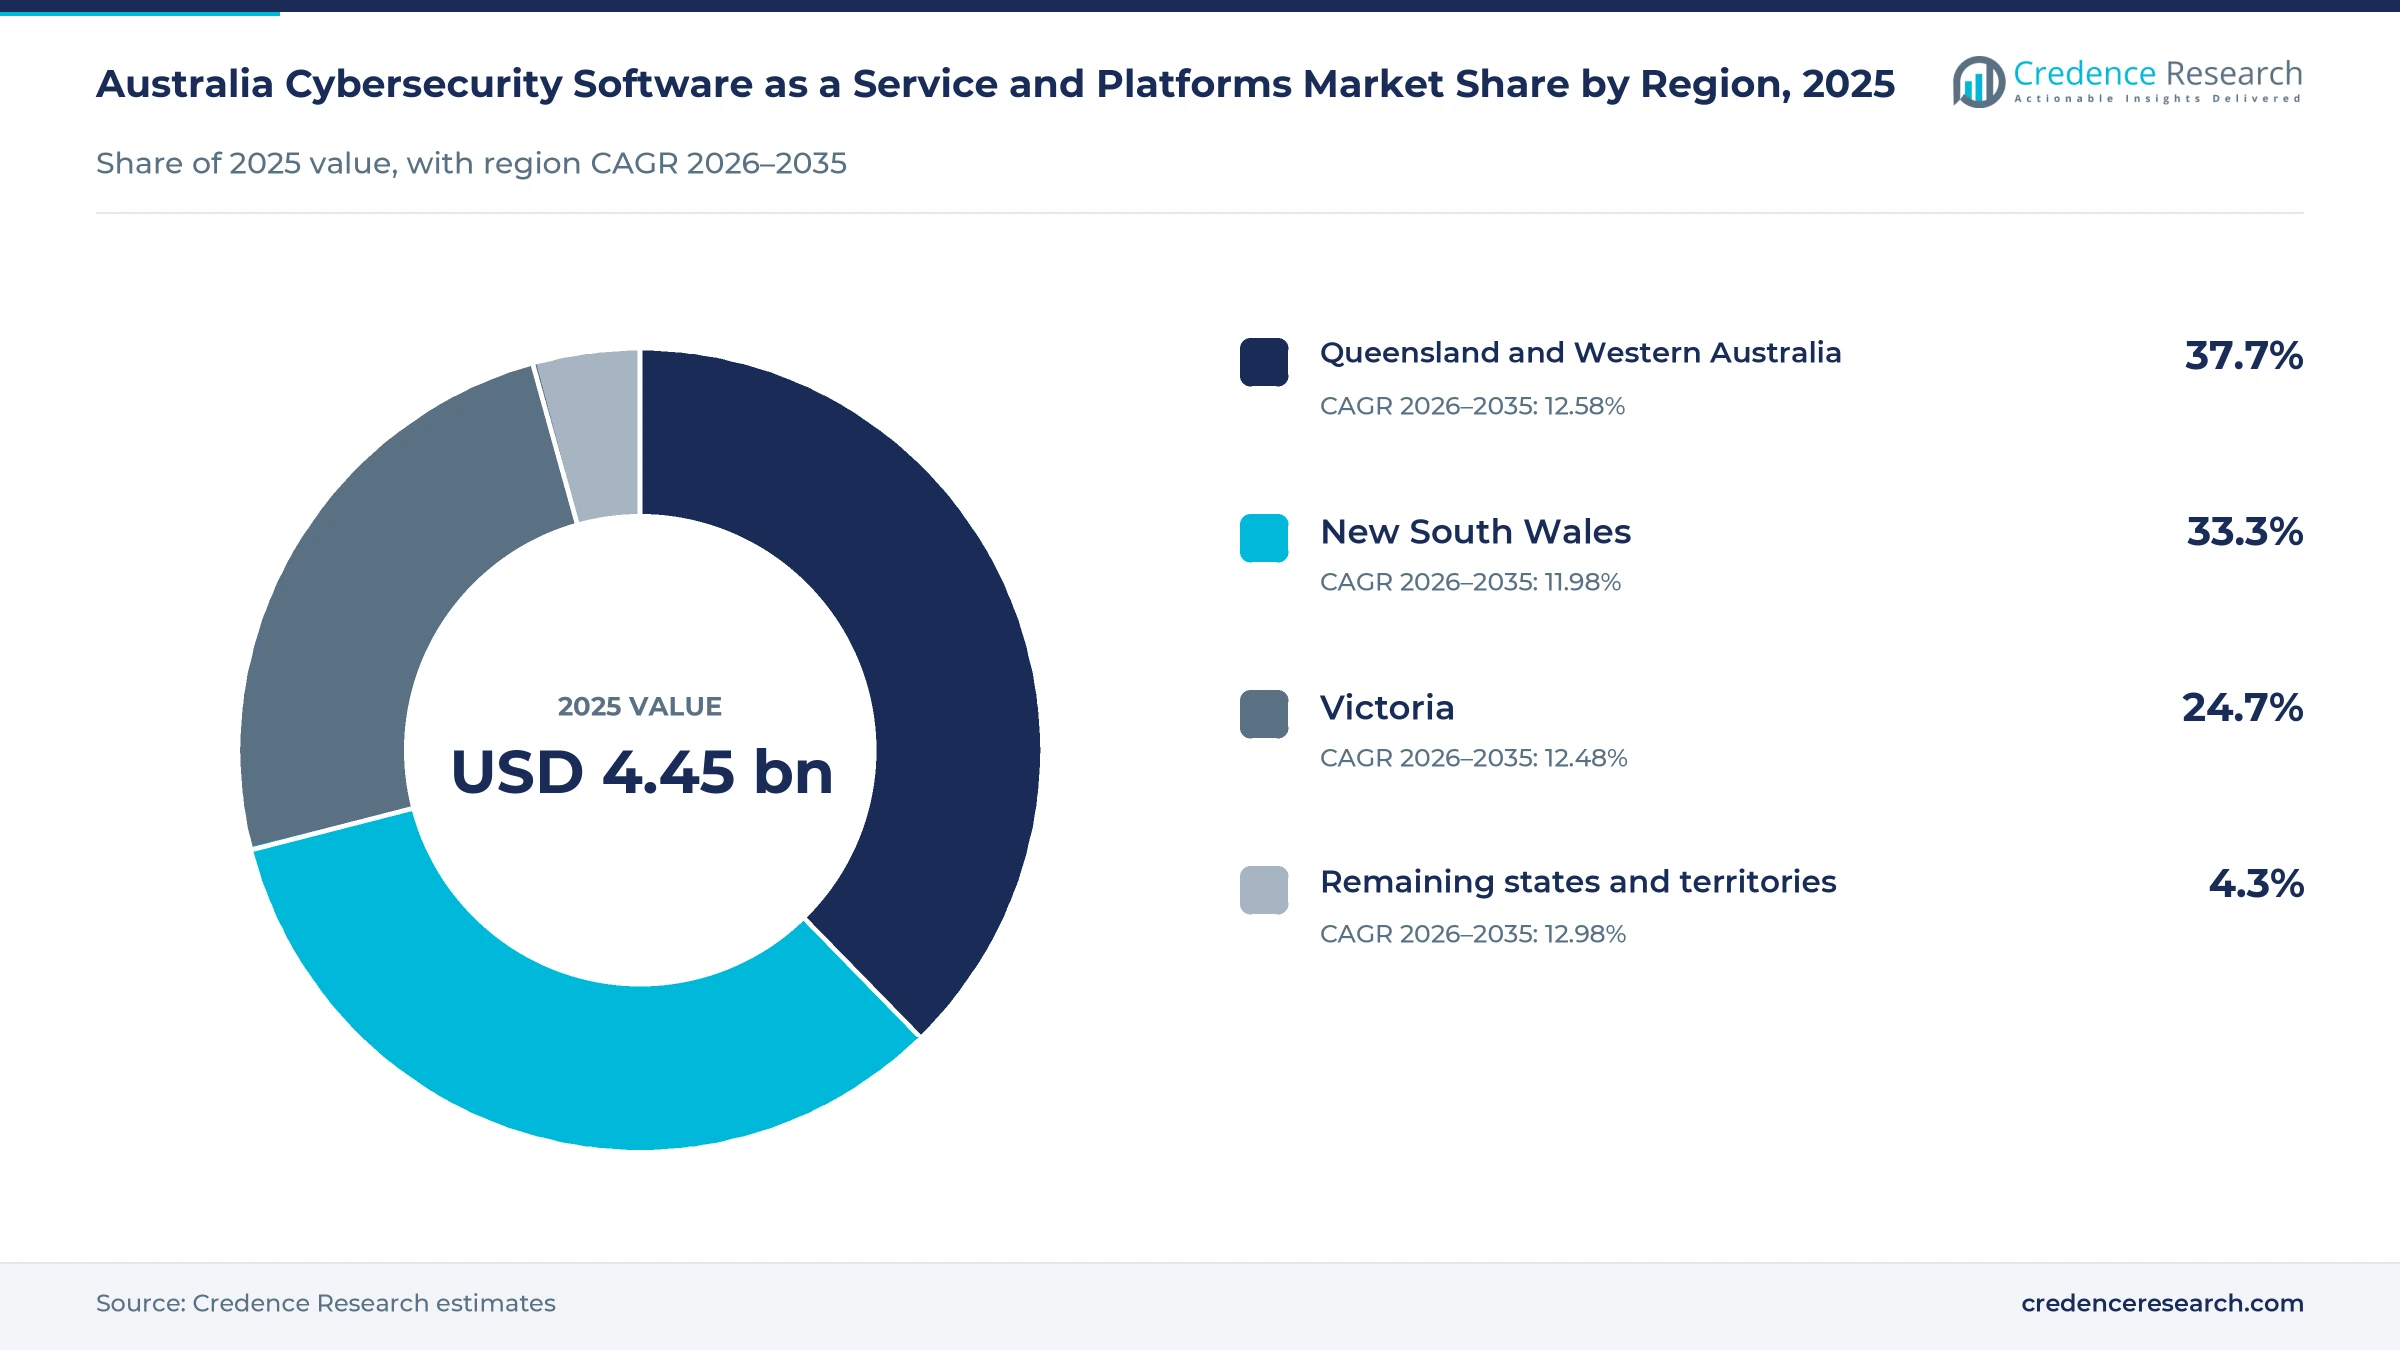
The Australia cybersecurity software as a service and platforms market was valued at USD 4.45 billion in 2025 and is projected to increase from USD 5.01 billion in 2026 to USD 14.33 billion by 2035, registering a CAGR of 12.38% during 2026–2035. Demand comes from enterprises, smaller businesses and government agencies that now buy protection for devices, cloud workloads, identities and security operations as subscriptions rather than as boxed software. Queensland and Western Australia held the largest regional share, 37.7% in 2025, because the combined zone hosts large resources, energy and state government estates. Remaining states and territories is the fastest-growing region at 12.98% a year, as Canberra agencies and South Australian defense suppliers move workloads to assessed cloud services. However, ransomware payment reporting under the Cyber Security Act 2024, which started on May 30, 2025, has pushed buyers toward platforms that keep searchable records of every alert and response.
Which subscription security tools does the estimate cover?
The estimate measures spending by Australian organizations and households on security software delivered as a cloud service or as a vendor-run platform. It counts device and access security, cloud and application security, identity security and security operations and information protection, sold through user, endpoint, workload, consumption or enterprise capacity subscriptions on monthly, annual or multiyear terms.
The estimate excludes perpetual software licenses, firewall and sensor hardware, stand-alone consulting, incident response retainers and cyber insurance premiums. The value chain runs from global platform vendors and cloud hosts through distributors, resellers, cloud marketplaces and managed providers to the enterprises, agencies, small firms and consumers that run the protected accounts and devices.
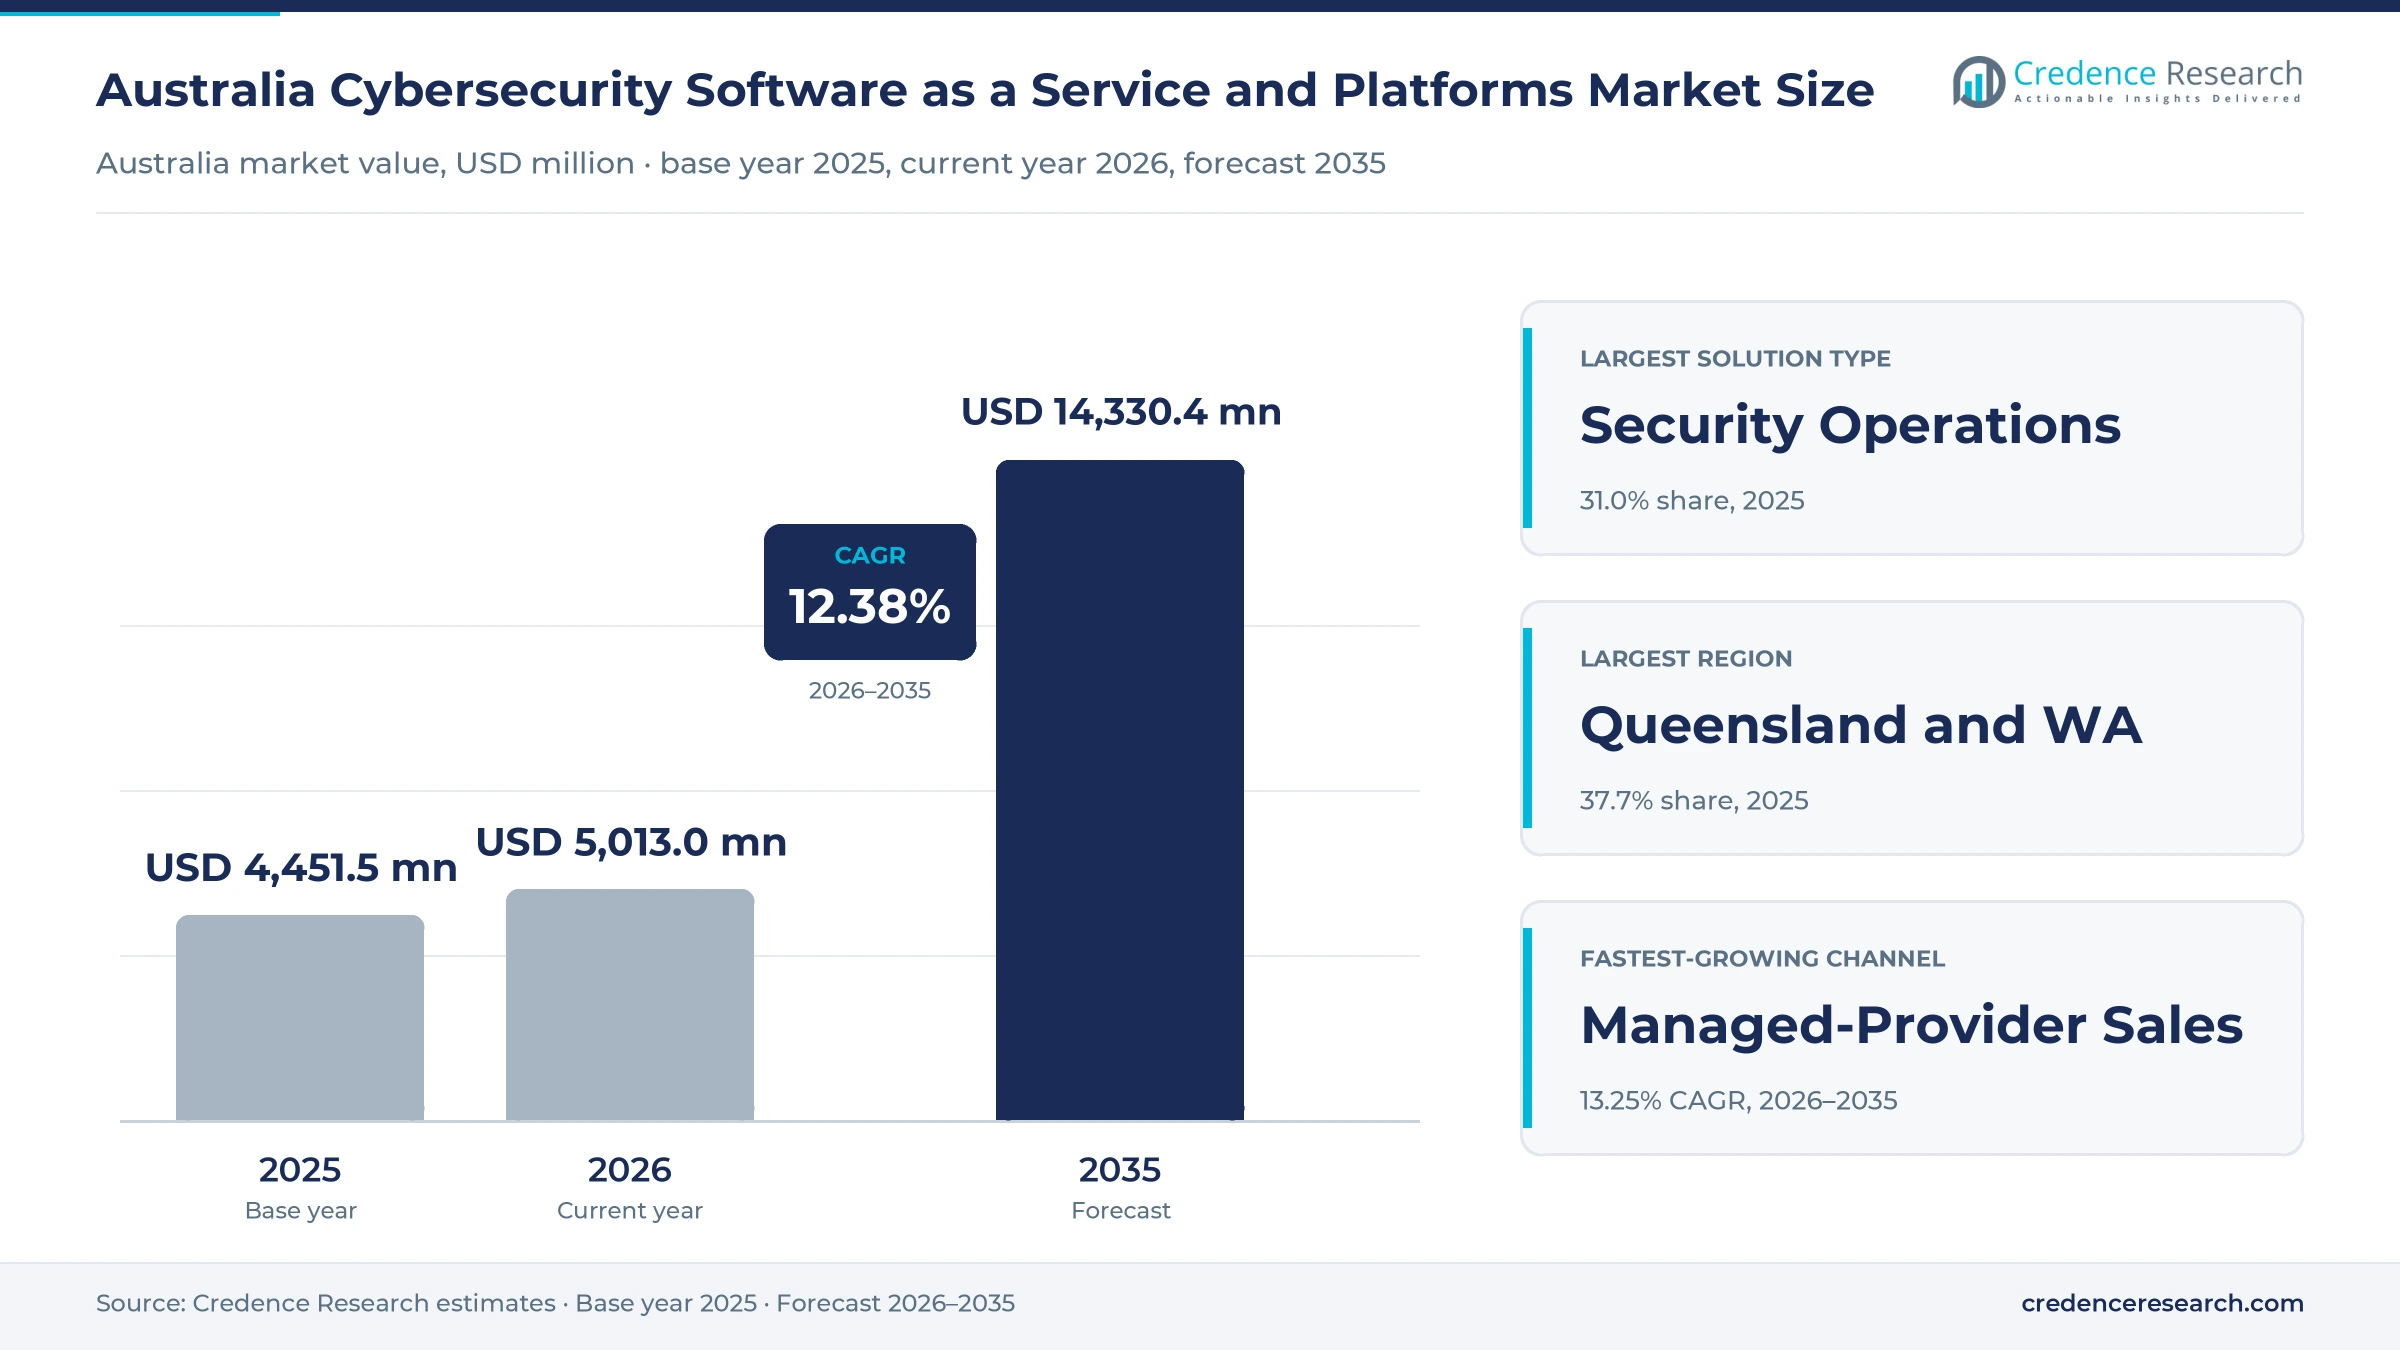
Australia Cybersecurity Software as a Service and Platforms Market Insights
- Subscription security spending in Australia was valued at USD 4.45 billion in 2025 and is projected to reach USD 14.33 billion by 2035, rising at a 12.38% CAGR.
- Queensland and Western Australia held a 37.7% share of 2025 value, the largest of the four regions, because resources, energy and state agency estates buy at scale.
- Security operations and information protection led with a 31.0% share of 2025 value, because detection, logging, email and data protection tools anchor most subscription budgets.
- The Office of the Australian Information Commissioner received 1,205 data breach notifications in 2025, an all-time high and an 8% rise on 2024.
- Fortinet opened a North Sydney headquarters on Feb. 11, 2025, with an A$75 million investment that includes a data center for in-region sovereign hosting.
Security operations lead as cloud protection grows fastest
Why do security operations tools hold the largest value?
Based on solution type, the market is categorized into device and access security, cloud and application security, identity security and security operations and information protection. Security operations and information protection led with a 31.0% share of 2025 value, because detection, logging, email and data loss tools sit at the center of most security budgets. Cloud and application security grows fastest at 13.31% a year, as workloads and business applications keep moving to public clouds.
How do enterprise and smaller buyers differ in spending?
Based on customer type, the market is categorized into enterprise buyers, business buyers, public-sector buyers and consumer and prosumer buyers. Enterprise buyers led with a 52.0% share of 2025 value, because banks, insurers, miners and retailers license protection across thousands of users. Business buyers grow fastest at 13.22% a year, as small and mid-sized firms replace basic antivirus with bundled cloud suites.
Why does shared public cloud dominate deployment?
Based on deployment model, the market is categorized into shared public cloud, dedicated cloud and hybrid platform delivery. Shared public cloud led with a 58.0% share of 2025 value, because multitenant services are quick to deploy and priced per user. Dedicated cloud grows fastest at 13.20% a year, as agencies and regulated buyers ask for isolated tenants and onshore data residency.
Which sales channels move the most subscriptions?
Based on sales channel, the market is categorized into direct vendor sales, reseller and marketplace sales, and managed-provider sales. Direct vendor sales led with a 38.0% share of 2025 value, because large enterprises and agencies negotiate platform agreements with vendors. Managed-provider sales grows fastest at 13.25% a year, as telecom carriers and managed providers bundle security subscriptions with network and monitoring contracts.
| Segment Group | Leading Sub-segment | Share, 2025 | Fastest-growing Sub-segment | CAGR, 2026–2035 |
|---|---|---|---|---|
| By Solution Type | Security operations and information protection | 31.0% | Cloud and application security | 13.31% |
| By Customer Type | Enterprise buyers | 52.0% | Business buyers | 13.22% |
| By Deployment Model | Shared public cloud | 58.0% | Dedicated cloud | 13.20% |
| By Sales Channel | Direct vendor sales | 38.0% | Managed-provider sales | 13.25% |
Request a Free Sample
Fill in your details and we'll send you a free sample report.
- Sample data tables & charts
- Research methodology
Threat exposure, evidence duties and channels drive spend
How does threat exposure sustain persistent monitoring?
A steady stream of attacks keeps Australian organizations paying for tools that watch accounts, devices and cloud workloads every hour of the year. The Australian Signals Directorate responded to more than 1,200 incidents in 2024–25, an 11% rise, and received over 84,700 cybercrime reports, according to its annual threat factsheet for businesses. The same factsheet shows the average self-reported cost for a large business rose 219% to A$202,700, while the overall business average rose 50% to A$80,850. Australia also had about 44,299 secure internet servers per million people in 2024, according to World Bank data, which leaves a wide surface to monitor. This is why security operations and information protection hold 31.0% of 2025 value.
Why do compliance rules expand evidence requirements?
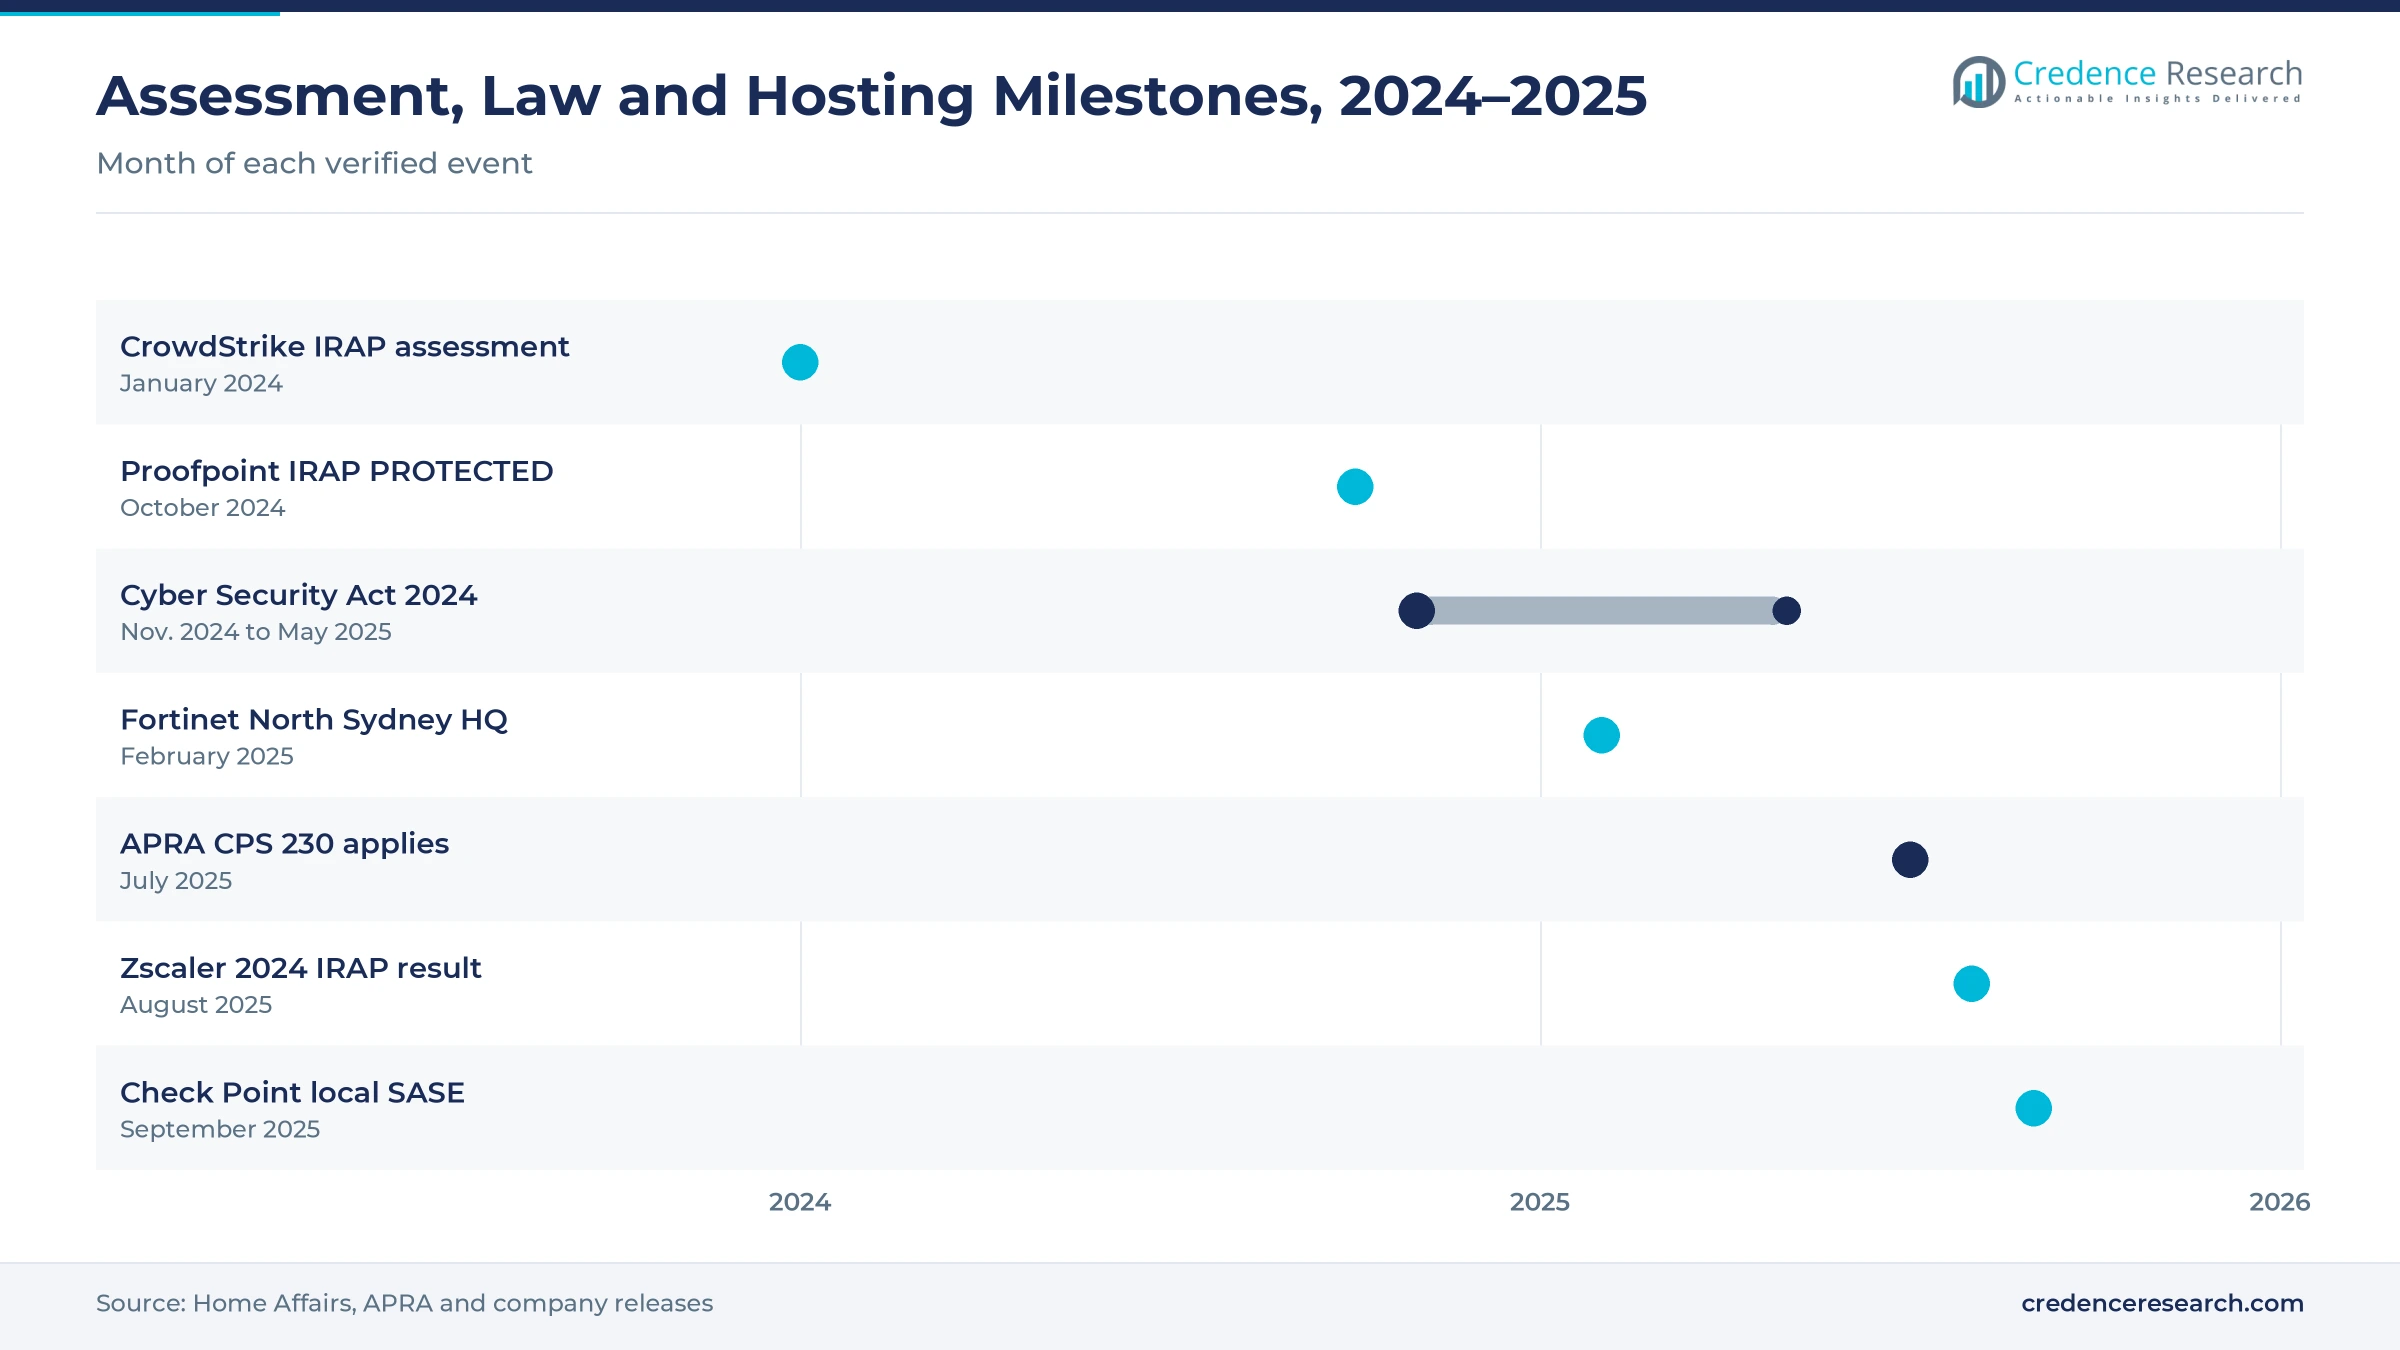
New laws and prudential standards require organizations to prove what happened during an incident, which favors platforms that keep logs and response records. The Cyber Security Act 2024 received Royal Assent on Nov. 29, 2024, and its ransomware payment reporting rules started on May 30, 2025, according to the Department of Home Affairs. The Australian Prudential Regulation Authority finalized its CPS 230 operational risk standard on July 17, 2023, with effect from July 1, 2025, and requires banks, insurers and superannuation funds to manage risks from material service providers. Because these records must be produced on demand, enterprise buyers hold 52.0% of 2025 value, the largest customer share during 2026–2035.
How do channels and product convergence ease adoption?
Broader sales reach and platforms that merge several controls lower the effort of buying and running security for firms without large teams. Telstra said on Sept. 15, 2023, that Palo Alto Networks had become the first dedicated cyber security vendor in its technology alliance program for business customers. Check Point Software launched local Australian instances of Harmony SASE and CloudGuard WAF in September 2025, and Harmony SASE combines firewall as a service, secure web gateway, zero trust network access and SD-WAN in one cloud product. Zscaler said on Aug. 27, 2025, that its Zero Trust Exchange had completed a 2024 IRAP assessment. In turn, managed-provider sales grow at 13.25% a year, the fastest channel.
Why do onshore hosting and IRAP widen public demand?
Government agencies and regulated firms increasingly require local data residency and an assessed security posture before they sign a cloud contract. Microsoft announced on Oct. 24, 2023, an A$5 billion investment over two years that expands its Australian data centers from 20 to 29 sites across Canberra, Sydney and Melbourne. CrowdStrike said on Jan. 17, 2024, that its Falcon platform had completed an IRAP assessment, and Proofpoint completed an IRAP assessment at the PROTECTED level for its email protection service on Oct. 15, 2024. SentinelOne launched a virtual data center in Australia on June 7, 2023, after reaching PROTECTED IRAP status. For buyers, this means dedicated cloud deployment grows at 13.20% a year during 2026–2035.
Converged SASE and identity-first controls gain ground
How is the shift to converged SASE platforms changing buying?
Buyers are replacing separate gateways, remote access tools and web filters with single cloud edges that apply one policy to every user. Fortinet opened its North Sydney headquarters on Feb. 11, 2025, with an A$75 million investment that includes sovereign hosting and secure access service edge capabilities. Zscaler added co-located data centers in Canberra in June 2022 to complement its Sydney and Melbourne sites, which it said would help meet demand from public sector organizations. Check Point Software placed its Harmony SASE instance in Australia in September 2025 to support local data privacy rules. As a result, shared public cloud, the usual delivery model for these edges, holds 58.0% of 2025 value.
Why are stolen logins pushing identity-first protection?
Stolen logins and impersonation now sit behind many reported business crimes, which moves identity checks to the front of security programs. Identity fraud made up 11% of cybercrime reports from businesses in 2024–25, and business email compromise fraud with financial loss made up 15%, according to the Australian Signals Directorate. Okta said in February 2025 that its Okta and Auth0 identity platforms had met the Australian Government PROTECTED level after an independent IRAP assessment. Cisco said on April 27, 2022, that Duo had completed an assessment against the PROTECTED controls of the Information Security Manual. In turn, identity security gains share as buyers add multifactor sign-in and access policies.
Can small and mid-sized firms open a new subscription base?
Smaller businesses face the same attacks as large firms but often lack staff to run security tools, which creates room for simple bundled subscriptions. The Australian Bureau of Statistics reported on June 25, 2026, that 21% of businesses experienced a cyber security incident in 2024–25, and 18% of those reported a financial loss. Average self-reported cybercrime costs reached A$56,600 for small businesses and A$97,200 for medium businesses, a 55% rise for the latter. Telstra also sells Palo Alto Networks protection to its business customers, which gives vendors a national route to smaller firms. As a result, business buyers grow at 13.22% a year, the fastest customer type.
Is there room to grow in protecting third-party platforms?
Attackers increasingly reach customer data through outside software and service providers, which opens demand for tools that secure business applications and partner access. Qantas detected unusual activity on a third-party customer servicing platform used by a call center on June 30, 2025, and confirmed on July 9, 2025, that data for about 5.7 million customers was compromised. The Office of the Australian Information Commissioner received 1,205 breach notifications in 2025, and malicious or criminal attacks caused 716 of them. Health service providers reported 225 of all notifications, the most of any sector, which keeps patient record protection high on health sector security spending plans. Cloud and application security therefore grows at 13.31% a year, the fastest solution type.
Skills gaps, tool sprawl and sovereignty costs slow uptake
How do security skills shortages slow adoption?
Detection platforms and cloud posture tools need trained analysts to tune rules and act on alerts, and these people are hard to hire outside Sydney, Melbourne and Canberra. As a result, mid-sized organizations outside the largest cities often struggle to staff the tools they license. Providers respond with managed detection and outsourced security operations centers, which spread scarce analysts across many clients and lower the staffing burden for each buyer.
Why does tool sprawl complicate platform consolidation?
Many Australian enterprises run separate products for endpoints, email, identity, cloud and logging, which makes moving to one platform slow and costly. The Australian Signals Directorate lists replacing or mitigating legacy technology among its four priority actions for businesses in its 2024–25 threat factsheet, which adds migration work to every consolidation plan. Integration work, migration of detection rules and staff retraining add cost before buyers see savings. Vendors respond with migration credits and bundled licenses, although buyers still worry about relying too heavily on a single supplier.
How does data sovereignty raise delivery costs?
Agencies and regulated firms increasingly ask for data to stay in Australia and for services to pass IRAP assessments, which adds work for every vendor. As a result, providers must build or rent local hosting, repeat assessments as the Information Security Manual changes and staff local support teams. These costs can raise prices for dedicated cloud tenants compared with shared global services. Larger vendors absorb the expense more easily, which narrows choice for some public-sector buyers.
Why do subscription costs weigh on smaller buyers?
Per-user and per-device pricing can add up quickly for firms that already pay for many cloud applications, which slows upgrades to full platforms. The Australian Bureau of Statistics found that 79% of businesses did not report a cyber incident in 2024–25, which can make the risk feel remote to owners. As a result, some small firms keep basic tools until an incident occurs. Bundles sold through telecom carriers and managed providers lower entry prices and simplify billing for these buyers.
Queensland and Western Australia lead the national split
| Region | Value, 2025 (USD billion) | Share, 2025 | CAGR, 2026–2035 |
|---|---|---|---|
| Queensland and Western Australia | 1.68 | 37.7% | 12.58% |
| New South Wales | 1.48 | 33.3% | 11.98% |
| Victoria | 1.10 | 24.7% | 12.48% |
| Remaining states and territories | 0.19 | 4.3% | 12.98% |
How do mining and state agency estates put Queensland and WA first?
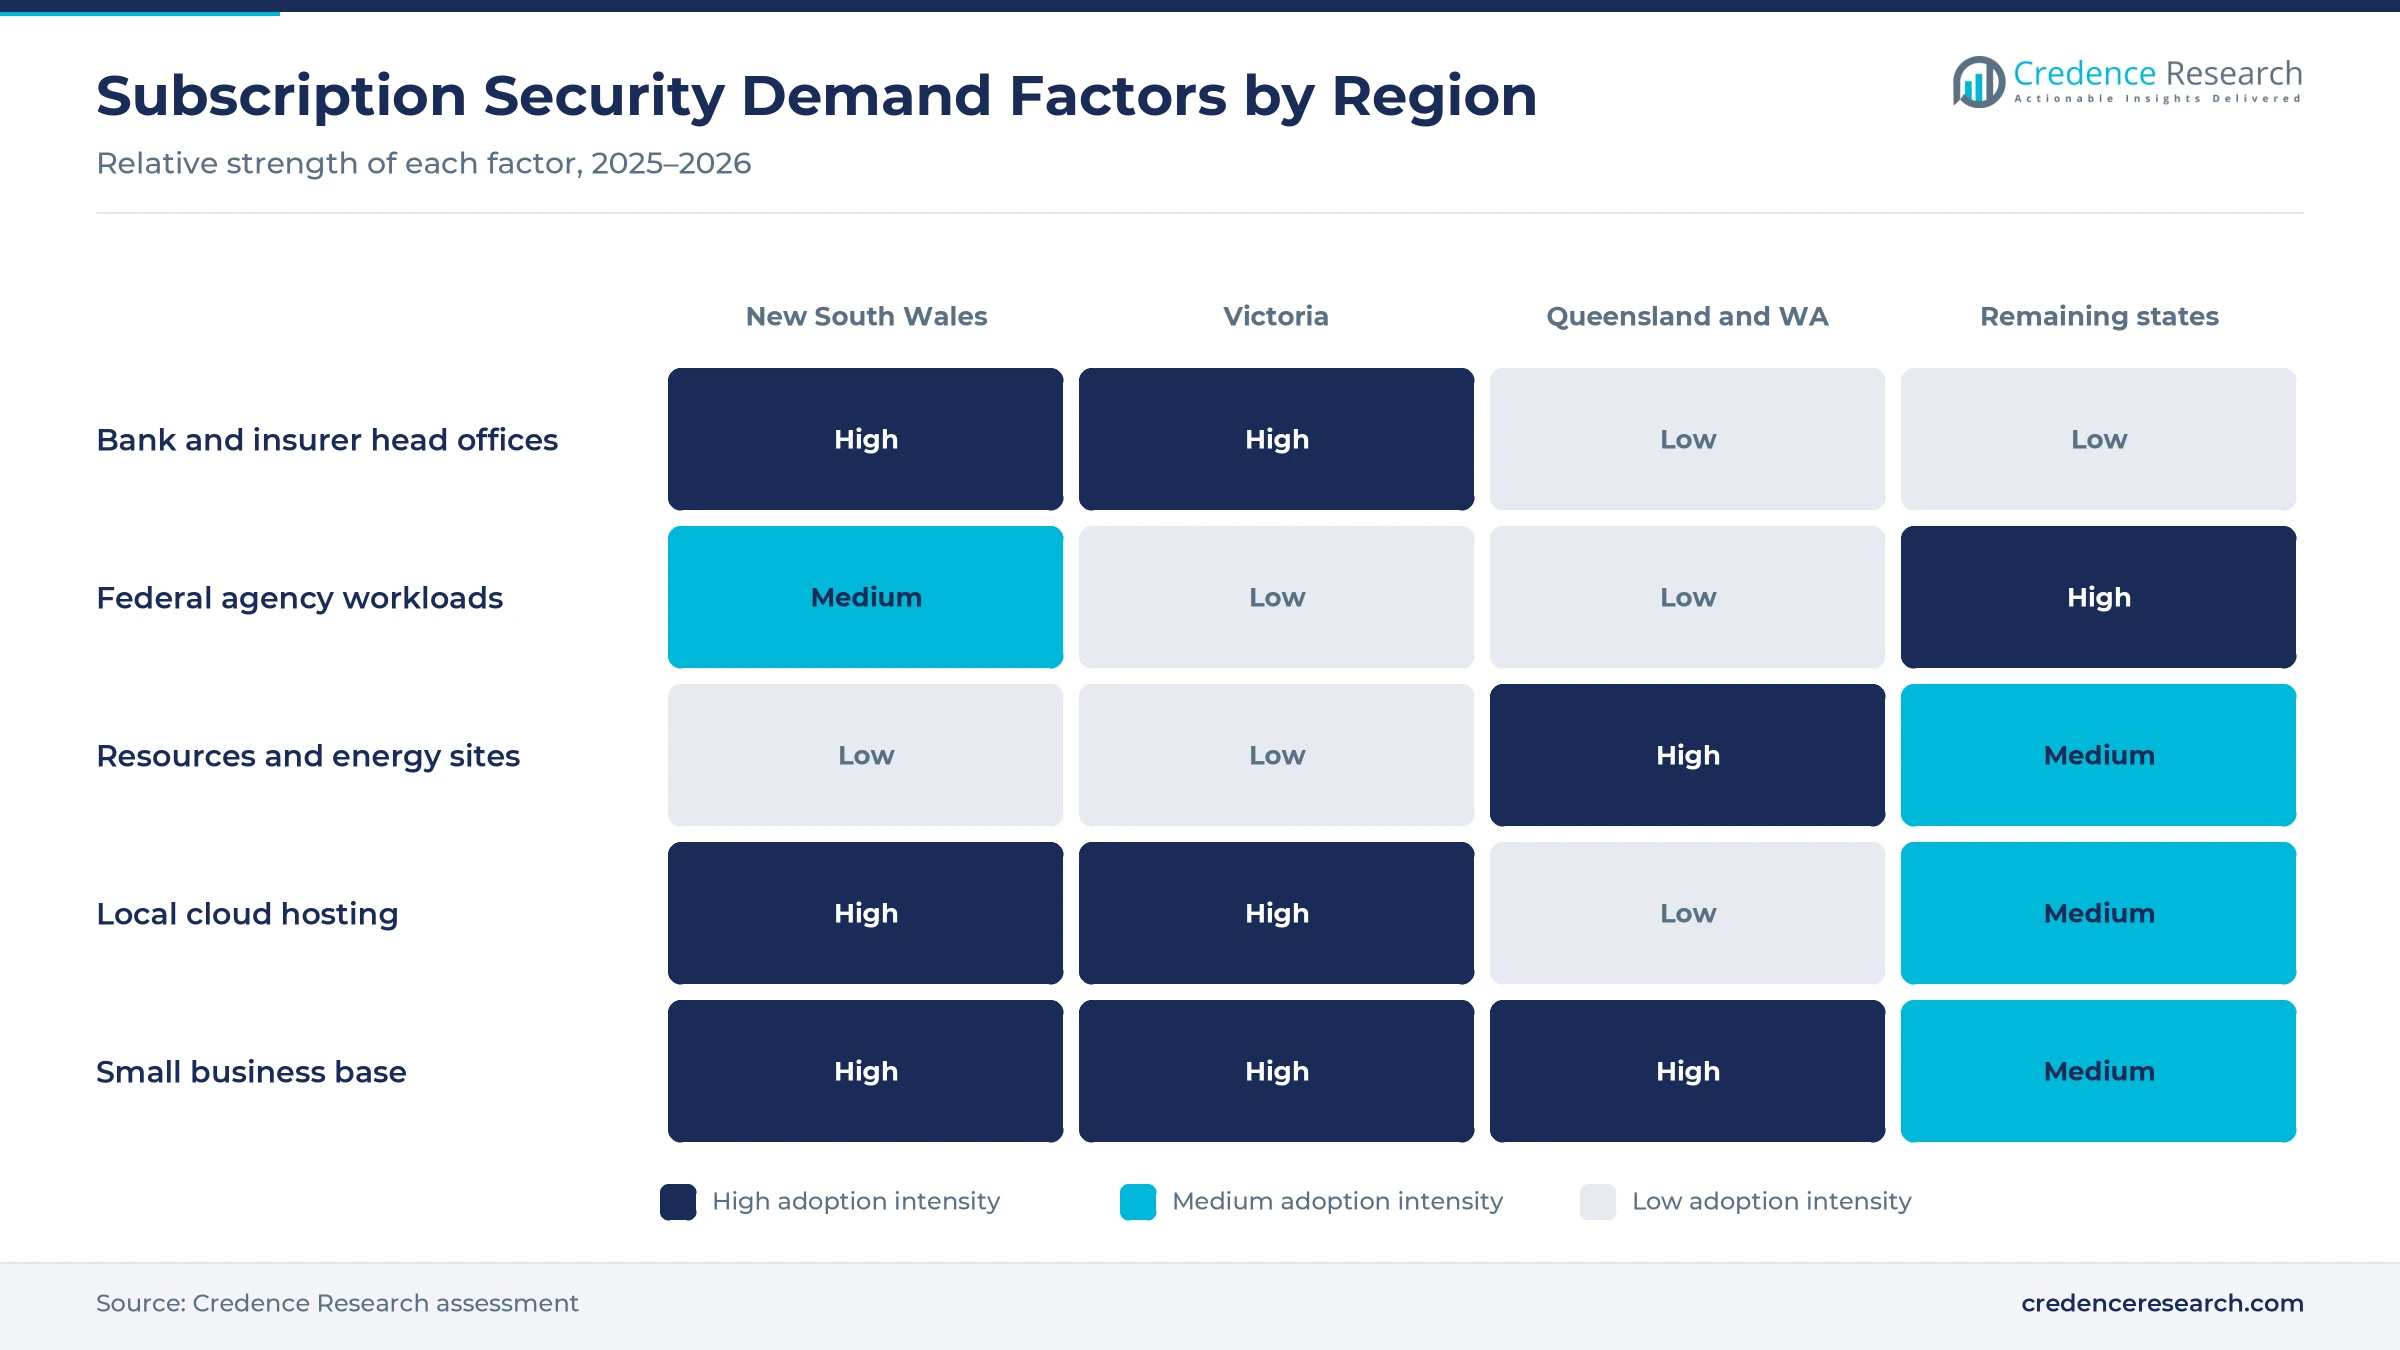
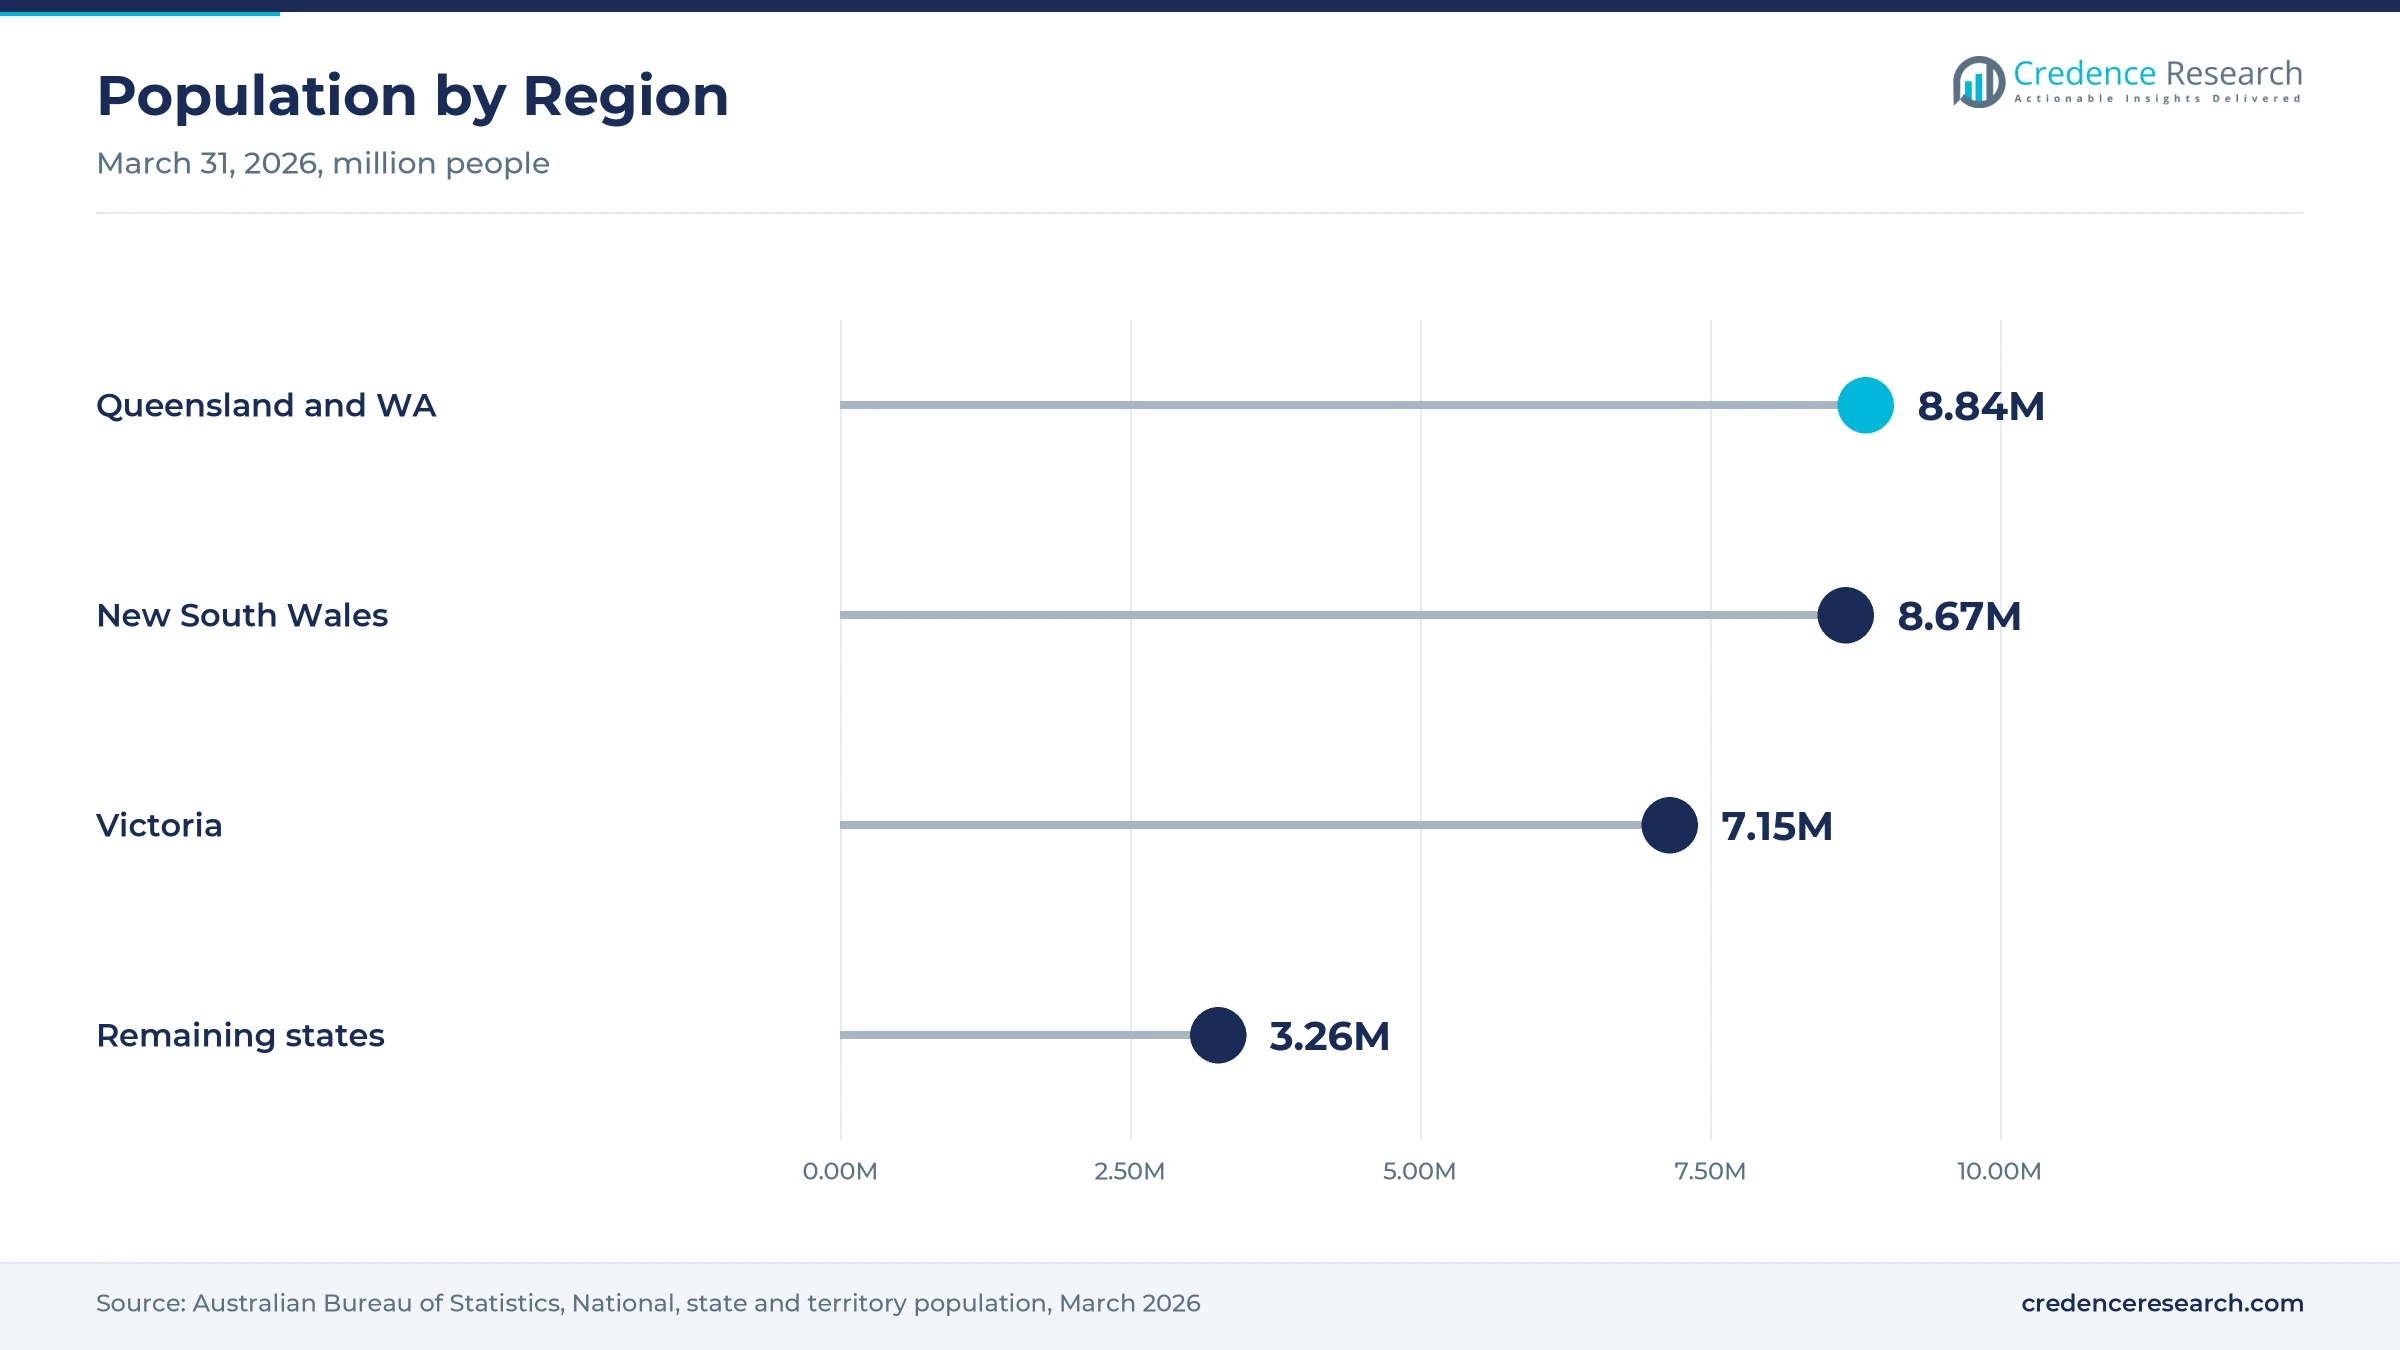
Queensland and Western Australia held a 37.7% share of 2025 value and grow at 12.58% a year, because mining, energy, ports and two large state governments run wide networks of users and remote sites. The two states had about 8.84 million residents on March 31, 2026, according to the Australian Bureau of Statistics. Western Australia had the fastest population growth of any state, 2.1% over the year. Buyers in the zone therefore favor cloud-delivered tools that protect distant sites without local staff.
How does New South Wales anchor enterprise demand?
New South Wales held a 33.3% share of 2025 value and grows at 11.98% a year, because Sydney hosts most bank, insurer and technology company head offices. The state had about 8.67 million residents on March 31, 2026, the most of any state. Fortinet runs its national headquarters in North Sydney, and Microsoft operates data centers in the city. New South Wales therefore buys a large share of enterprise platform agreements and direct vendor contracts.
What supports subscription demand in Victoria?
Victoria held a 24.7% share of 2025 value and grows at 12.48% a year, because Melbourne combines insurers, superannuation funds, universities, health networks and retailers. The state had about 7.15 million residents on March 31, 2026, and grew 1.6% over the previous year, level with Queensland behind Western Australia. Zscaler and Microsoft both run data center capacity in Melbourne, which supports local hosting for these buyers. This keeps Victoria the third largest zone for security subscriptions.
Why are the remaining states and territories growing fastest?
Remaining states and territories held a 4.3% share of 2025 value and grow fastest at 12.98% a year, because Canberra agencies and South Australian defense suppliers are moving to assessed cloud services. The zone had about 3.26 million residents on March 31, 2026, across South Australia, Tasmania, the Northern Territory and the Australian Capital Territory. Zscaler opened Canberra capacity to serve public sector demand, while agencies also invest in critical infrastructure protection.
Government assessments, local hosting and new reporting law
| Development | Status and market relevance |
|---|---|
| In January 2024, CrowdStrike said its Falcon platform had completed an IRAP assessment for Australian Government use. | Opens endpoint protection sales to agencies that require assessed services |
| In October 2024, Proofpoint completed an IRAP assessment at the PROTECTED level for its email protection service. | Extends cloud email security to more public-sector buyers |
| In November 2024, the Cyber Security Act 2024 received Royal Assent and became law. | Ransomware payment reporting applies from May 30, 2025 |
| In February 2025, Fortinet opened its North Sydney headquarters with in-region sovereign hosting. | Adds local hosting, SASE capabilities and a technical assistance center |
| In September 2025, Check Point Software launched local Australian instances of Harmony SASE and CloudGuard WAF. | Gives buyers onshore data residency for converged cloud security |
Cloud telemetry, identity checks and consolidated edges
- Cloud-native endpoint agents send process, file and login activity to vendor platforms, which lets analysts find threats on laptops and servers without local consoles.
- Identity and multifactor services check every sign-in against device, location and risk signals, which blocks many attacks that start with stolen passwords.
- Secure access service edges combine firewall, web gateway and zero trust access in one cloud network, which applies the same policy to staff in any location.
- Security analytics platforms collect logs from endpoints, email, identity and cloud services, which helps teams investigate incidents and keep evidence for regulators.
Need a Custom Version of This Report?
Tailor the scope, geography, or segments to your exact requirements.
- Custom geography or segment scope
- Direct access to our analyst team
Global platforms compete on onshore hosting and assurance
Competition is led by global platform vendors that host services in Australia and hold government assessments. Microsoft is expanding its local data centers from 20 to 29 sites and works with the Australian Signals Directorate on the Microsoft-ASD Cyber Shield. Palo Alto Networks offers an Australian cloud location for Cortex XDR, Cortex Data Lake and WildFire, and sells through Telstra to business customers. CrowdStrike, SentinelOne, Proofpoint and Okta compete for agency work after completing IRAP assessments, while Cisco offers Duo identity protection assessed against PROTECTED controls. Fortinet, Zscaler and Check Point Software compete in cloud network security with onshore hosting. Many buyers combine identity and access management from one vendor with endpoint and email tools from others, so integration matters. Vendors compete on local residency, assessment status, platform breadth and channel reach.
Which vendors lead Australian subscription security?
| Company | Type | Role in the market |
|---|---|---|
| Microsoft | Cloud and security platform | Expanding to 29 local data centers and runs the Cyber Shield with ASD |
| Palo Alto Networks | Network and cloud security vendor | Hosts Cortex XDR in Australia and partners with Telstra |
| CrowdStrike | Endpoint platform vendor | Falcon platform completed IRAP assessment in January 2024 |
| Cisco | Network and identity vendor | Duo assessed against PROTECTED controls in April 2022 |
| Fortinet | Network security vendor | Opened North Sydney headquarters with sovereign hosting |
| SentinelOne | Endpoint platform vendor | Runs an Australian virtual data center since June 2023 |
| Check Point Software | Cloud network security vendor | Launched local Harmony SASE and CloudGuard WAF instances |
| Proofpoint | Email security vendor | Email protection assessed at PROTECTED level in October 2024 |
| Zscaler | Zero trust cloud vendor | Runs data centers in Sydney, Melbourne and Canberra |
| Okta | Identity platform vendor | Okta and Auth0 met the PROTECTED level in February 2025 |
Credence Research view on subscription security demand
Credence Research's view is that Australian spending on subscription security will keep rising quickly because reporting laws, prudential standards and steady attack volumes all reward continuous protection. Security operations and information protection remain the largest solution type, while cloud and application security grows fastest as workloads leave company data centers. Queensland and Western Australia hold the largest regional share, while Canberra and South Australia grow fastest from a small base. Vendors that pair onshore hosting and IRAP assessments with strong carrier and managed-provider channels should gain the most share by 2035.
How the national subscription security estimate was built
The report uses 2025 as the base year on a calendar basis, and market values come from the Credence Research model. That model combines government threat reports, regulator releases, privacy regulator statistics, official population and business statistics and company announcements. Regional growth rates and segment splits are Credence Research estimates built from population, business and incident data, while regional shares follow the client grouping. Sources used are government and regulator pages, World Bank data, trade media and company websites, and no interviews or surveys were used.
Cloud, identity and managed channels carry growth to 2035
The Australia cybersecurity software as a service and platforms market is expected to reach USD 14.33 billion by 2035, a 12.38% CAGR during 2026–2035, as enterprises, agencies and smaller firms keep moving protection to the cloud. Growth should be strongest in cloud and application security, dedicated cloud deployment, business buyers and managed-provider sales, because these areas gain most from onshore hosting and simpler buying. Skills shortages, tool sprawl and sovereignty costs could slow some programs, while converged platforms and carrier bundles should widen access for organizations with small security teams.
Frequently Asked Questions
How big is the Australia cybersecurity software as a service and platforms market?
Which solution type leads spending?
Which region leads the market?
How does the Cyber Security Act 2024 affect demand?
Why do IRAP assessments matter to vendors?
Which customer type grows fastest?
Who are the leading companies in Australian subscription security?
What are the main challenges for buyers?
Table of Content
Chapter 1 Market Segmentation
- 1.1 Segmentation Framework
- 1.1.1 Product and Service Classification
- 1.1.2 Application and End-Use Classification
- 1.1.3 Technology and Solution Classification
- 1.1.4 Customer and Distribution Channel Classification
- 1.1.5 Geographic Segmentation
- 1.1.6 Market Segment Definitions and Boundaries
- 1.2 By Solution Type
- 1.2.1 Device and access security
- 1.2.2 Cloud and application security
- 1.2.3 Identity security
- 1.2.4 Security operations and information protection
- 1.3 By Customer Type
- 1.3.1 Enterprise buyers
- 1.3.2 Business buyers
- 1.3.3 Public-sector buyers
- 1.3.4 Consumer and prosumer buyers
- 1.4 By Deployment Model
- 1.4.1 Shared public cloud
- 1.4.2 Dedicated cloud
- 1.4.3 Hybrid platform
- 1.5 By Sales Channel
- 1.5.1 Direct vendor sales
- 1.5.2 Reseller and marketplace sales
- 1.5.3 Managed-provider sales
Chapter 2 Introduction
- 2.1 Report Objectives and Scope
- 2.2 Product Definition and Industry Terminology
- 2.3 Market Inclusions and Exclusions
- 2.4 Research Process
- 2.4.1 Primary Research and Expert Interviews
- 2.4.2 Secondary Research and Source Review
- 2.4.3 Top-Down and Bottom-Up Estimation
- 2.4.4 Data Triangulation and Verification
- 2.5 Market Size Measurement Basis
- 2.5.1 2025: USD 4.45 billion → 2035: USD 14.33 billion
- 2.6 Historical and Forecast Reference Periods
- 2.6.1 Historical Period: 2018-2025
- 2.6.2 Base Year: 2025
- 2.6.3 Forecast Period: 2025-2035
- 2.7 Research Assumptions and Limitations
Chapter 3 Executive Summary
- 3.1 Market Snapshot and Key Findings
- 3.2 Base-Year Market Size, 2025
- 3.3 Forecast Market Size, 2035
- 3.4 Revenue and Volume Growth Outlook
- 3.5 Key Demand and Supply Indicators
- 3.6 Leading Market Segments
- 3.7 Fastest-Growing Market Opportunities
- 3.8 Regional Performance Highlights
- 3.9 Technology and Industry Transformation
- 3.10 Competitive Landscape Summary
- 3.11 Analyst View and Strategic Implications
Chapter 4 Australia Cybersecurity Software as a Service and Platforms Market Trends and Developments
- 4.1 Historical Industry Development, 2018-2025
- 4.2 Recent Market Trends and Developments
- 4.3 Demand and Customer Behavior Trends
- 4.4 Technology and Product Innovation
- 4.5 Artificial Intelligence, Automation and Digitalization
- 4.6 Local Manufacturing and Supply Chain Realignment
- 4.7 Industry Partnerships, Mergers and Acquisitions
- 4.8 Sustainability and Circular Economy Developments
- 4.9 Government and Private Sector Investment Trends
- 4.10 Emerging Business Models and Commercialization
- 4.11 Industry Developments and Announcements
Chapter 5 Australia Cybersecurity Software as a Service and Platforms Market Supply and Demand Analysis
- 5.1 Demand Trend and Consumption Analysis, 2018-2025
- 5.2 Demand Forecast, 2025-2035
- 5.3 Supply Chain Structure and Procurement Trends
- 5.4 Supply-Demand Gap and Bottlenecks
- 5.5 Import Dependence and Sourcing Structure
- 5.6 Regional Supply and Demand Concentration
Chapter 6 Australia Cybersecurity Software as a Service and Platforms Market Pricing Analysis
- 6.1 Pricing Structure and Measurement
- 6.2 Historical Pricing Trends, 2018-2025
- 6.3 Pricing Outlook, 2025-2035
- 6.4 Pricing by Product and Market Segment
- 6.5 Geographic Pricing Differences
- 6.6 Key Input, Energy, Labor and Logistics Costs
- 6.7 Contract Pricing and Purchasing Models
- 6.8 Pricing Sensitivity and Competitive Positioning
- 6.9 Price, Margin and Profitability Implications
Chapter 7 Australia Cybersecurity Software as a Service and Platforms Market Dynamics
- 7.1 Market Growth Drivers
- 7.1.1 Demand-Side Drivers
- 7.1.2 Technology and Innovation Drivers
- 7.1.3 Infrastructure and Investment Drivers
- 7.1.4 Regulatory and Policy Drivers
- 7.2 Market Restraints
- 7.2.1 Cost and Affordability Constraints
- 7.2.2 Technology and Adoption Barriers
- 7.2.3 Supply Chain and Operational Constraints
- 7.3 Market Challenges
- 7.3.1 Competitive Pressure and Margin Erosion
- 7.3.2 Skills, Infrastructure and Implementation Gaps
- 7.4 Emerging Market Opportunities
- 7.5 Market Dynamics Impact and Time-Horizon Assessment
Chapter 8 Australia Cybersecurity Software as a Service and Platforms Value Chain Analysis
- 8.1 Industry Value Chain Overview
- 8.2 Upstream Suppliers and Critical Inputs
- 8.3 Technology and Component Providers
- 8.4 Manufacturing or Service Delivery
- 8.5 Distribution, Channel Partners and Integrators
- 8.6 Downstream Applications and End Users
- 8.7 Value Addition and Profit Pools
- 8.8 Vertical Integration and Outsourcing
- 8.9 Supplier Concentration and Risk
- 8.10 Supply Chain Localization and Resilience
Chapter 9 Australia Cybersecurity Software as a Service and Platforms Market Regulations and Policies
- 9.1 Relevant Laws, Standards and Compliance Frameworks
- 9.2 Product, Service, Safety and Quality Requirements
- 9.3 Government Policies, Incentives and Subsidies
- 9.4 Imports, Exports and Trade Barriers
- 9.5 Public Procurement and Local Content Requirements
- 9.6 Data Protection, AI and Cybersecurity Compliance
- 9.7 Upcoming Policy Changes and Market Implications
Chapter 10 Australia Cybersecurity Software as a Service and Platforms Market Hotspots and Opportunities
- 10.1 Market Opportunity Mapping and Growth Hotspots
- 10.2 High-Growth Applications and Customer Groups
- 10.3 Underserved Markets and White-Space Opportunities
- 10.4 Emerging Technology and Product Opportunities
- 10.5 New Capacity and Investment Hotspots
- 10.6 Market Entry and Expansion Opportunities
- 10.7 Distribution and Partnership Opportunities
- 10.8 Near-Term and Long-Term Commercial Potential
- 10.9 Opportunity Attractiveness and Execution Risks
Chapter 11 Australia Cybersecurity Software as a Service and Platforms Market Outlook, 2025-2035
- 11.1 Market Size and Analysis
- 11.1.1 Revenue (Market Measurement: 2025: USD 4.45 billion → 2035: USD 14.33 billion)
- 11.1.2 Historical Market Size, 2018-2025
- 11.1.3 Base-Year Market Size, 2025
- 11.2 Market Forecast, 2025-2035
- 11.2.1 Revenue Forecast to 2035
- 11.2.2 CAGR and Year-on-Year Growth
- 11.2.3 Incremental Revenue Opportunity
- 11.3 Forecast Assumptions and Scenario Analysis
- 11.3.1 Base-Case Forecast
- 11.3.2 Optimistic and Conservative Scenarios
- 11.3.3 Technology, Pricing and Policy Sensitivities
- 11.4 Market Attractiveness and Growth Outlook
Chapter 12 Australia Cybersecurity Software as a Service and Platforms Market Segmentation and Outlook
- 12.1 Segmentation Summary and Market Shares, 2025
- 12.2 Largest and Fastest-Growing Segments
- 12.3 By Solution Type - Market Size and Forecast, 2025-2035
- 12.3.1 Segment Definition and Scope
- 12.3.2 Historical Market Size, 2018-2025
- 12.3.3 Revenue Forecast, 2025-2035
- 12.3.4 Base-Year Market Share, 2025
- 12.3.5 Segment CAGR and Growth Drivers
- 12.3.6 Subsegment Market Size and Forecast
- 12.3.6.1 Device and access security
- 12.3.6.2 Cloud and application security
- 12.3.6.3 Identity security
- 12.3.6.4 Security operations and information protection
- 12.3.7 Subsegment Pricing and Adoption Trends
- 12.3.8 Leading Suppliers and Competition
- 12.3.9 Regional Demand and Opportunities
- 12.4 By Customer Type - Market Size and Forecast, 2025-2035
- 12.4.1 Segment Definition and Scope
- 12.4.2 Historical Market Size, 2018-2025
- 12.4.3 Revenue Forecast, 2025-2035
- 12.4.4 Base-Year Market Share, 2025
- 12.4.5 Segment CAGR and Growth Drivers
- 12.4.6 Subsegment Market Size and Forecast
- 12.4.6.1 Enterprise buyers
- 12.4.6.2 Business buyers
- 12.4.6.3 Public-sector buyers
- 12.4.6.4 Consumer and prosumer buyers
- 12.4.7 Subsegment Pricing and Adoption Trends
- 12.4.8 Leading Suppliers and Competition
- 12.4.9 Regional Demand and Opportunities
- 12.5 By Deployment Model - Market Size and Forecast, 2025-2035
- 12.5.1 Segment Definition and Scope
- 12.5.2 Historical Market Size, 2018-2025
- 12.5.3 Revenue Forecast, 2025-2035
- 12.5.4 Base-Year Market Share, 2025
- 12.5.5 Segment CAGR and Growth Drivers
- 12.5.6 Subsegment Market Size and Forecast
- 12.5.6.1 Shared public cloud
- 12.5.6.2 Dedicated cloud
- 12.5.6.3 Hybrid platform
- 12.5.7 Subsegment Pricing and Adoption Trends
- 12.5.8 Leading Suppliers and Competition
- 12.5.9 Regional Demand and Opportunities
- 12.6 By Sales Channel - Market Size and Forecast, 2025-2035
- 12.6.1 Segment Definition and Scope
- 12.6.2 Historical Market Size, 2018-2025
- 12.6.3 Revenue Forecast, 2025-2035
- 12.6.4 Base-Year Market Share, 2025
- 12.6.5 Segment CAGR and Growth Drivers
- 12.6.6 Subsegment Market Size and Forecast
- 12.6.6.1 Direct vendor sales
- 12.6.6.2 Reseller and marketplace sales
- 12.6.6.3 Managed-provider sales
- 12.6.7 Subsegment Pricing and Adoption Trends
- 12.6.8 Leading Suppliers and Competition
- 12.6.9 Regional Demand and Opportunities
- 12.7 Segment Growth Comparison
- 12.8 Segment Attractiveness and Priority Matrix
Chapter 13 Australia Cybersecurity Software as a Service and Platforms End-Use and Application Market Outlook
- 13.1 End-Use Industry and Customer Demand Structure
- 13.2 Leading Applications and Customer Groups
- 13.3 End-Use Market Size, Share and Forecast
- 13.4 Major End-Use Industry Deep Dives
- 13.4.1 Customer Requirements and Use Cases
- 13.4.2 Demand and Replacement Cycles
- 13.4.3 Technical and Regulatory Considerations
- 13.4.4 Purchasing and Procurement Models
- 13.4.5 Leading Vendors and Distribution Channels
- 13.4.6 Forecast and Commercial Opportunities
- 13.5 Emerging Applications and Cross-Segment Demand
- 13.6 End-Use Industry Investment Priorities
Chapter 14 Australia Cybersecurity Software as a Service and Platforms Geographic Market Outlook, 2025-2035
- 14.1 Domestic Market Distribution and Demand Clusters
- 14.2 State- or Province-Wise Market Size and Forecast, 2025-2035
- 14.3 City and Metropolitan Market Outlook
- 14.4 Industrial, Manufacturing and Commercial Clusters
- 14.5 Geographic Concentration of Key End Users
- 14.6 Local Pricing and Purchasing Differences
- 14.7 Domestic Production Facilities and Capacity Map
- 14.8 Local Infrastructure and Project Pipeline
- 14.9 State-Level Policy and Incentive Differences
- 14.10 Subnational Investment Hotspots and Opportunities
- 14.11 Distribution and Logistics Networks
- 14.12 Domestic Competitive Footprint
Chapter 15 Australia Cybersecurity Software as a Service and Platforms Technology, Innovation and Sustainability Outlook
- 15.1 Technology Landscape and Maturity
- 15.2 Product, Process and Service Innovation
- 15.3 AI, Automation and Digital Tools in the Industry
- 15.4 Technology Adoption and Performance Benchmarking
- 15.5 Innovation Pipeline and R&D Investment
- 15.6 Patent and Intellectual Property Trends
- 15.7 Energy Efficiency and Resource Management
- 15.8 Sustainability, Recycling and Circularity
- 15.9 Technology Roadmap, 2025-2035
- 15.10 Risks of Obsolescence and Technology Substitution
Chapter 16 Australia Cybersecurity Software as a Service and Platforms Market Key Strategic Imperatives
- 16.1 Growth and Market Entry Priorities
- 16.2 High-Return Products and Segments
- 16.3 Pricing, Profitability and Cost Optimization
- 16.4 Technology Investment and Product Differentiation
- 16.5 Supply Chain Localization and Resilience
- 16.6 Distribution and Customer Acquisition
- 16.7 Partnership, Acquisition and Capacity Strategy
- 16.8 Regional Expansion Priorities
- 16.9 Short-, Medium- and Long-Term Actions
Chapter 17 Competition Outlook
- 17.1 Industry Competition Characteristics
- 17.2 Market Structure and Concentration
- 17.3 Market Share and Competitive Positioning, 2025
- 17.4 Company-Wise Revenue and Product Benchmarking
- 17.5 Production and Service Capacity Benchmarking
- 17.6 Technology, Pricing and Differentiation
- 17.7 Regional Footprint and Distribution Strength
- 17.8 Mergers, Acquisitions and Strategic Alliances
- 17.9 New Entrants and Competitive Threats
- 17.10 Porter's Five Forces and Industry Attractiveness
- 17.11 Competitive Outlook, 2025-2035
Chapter 18 Company Profiles
- 18.1 Company Coverage and Selection Criteria
- 18.2 Microsoft
- 18.2.1 Business Description
- 18.2.2 Company Ownership and Geographic Presence
- 18.2.3 Product and Service Portfolio
- 18.2.4 Manufacturing and Operating Footprint
- 18.2.5 Financial Performance and Investment
- 18.2.6 Market Share and Competitive Position
- 18.2.7 Technology and Innovation Capabilities
- 18.2.8 Strategic Alliances or Partnerships
- 18.2.9 Recent Developments
- 18.2.10 Growth Strategy and Outlook
- 18.3 Palo Alto Networks
- 18.4 CrowdStrike
- 18.5 Cisco
- 18.6 Fortinet
- 18.7 SentinelOne
- 18.8 Check Point Software
- 18.9 Proofpoint
- 18.10 Zscaler
- 18.11 Okta
- 18.12 Other Relevant Market Participants
Note: Every listed company is profiled on the structure shown under the first company. The company list is preliminary and may change based on research findings, market developments, data availability and client requirements.
Chapter 19 Disclaimer
- 19.1 Research and Forecast Disclaimer
- 19.2 Data Source and Estimation Limitations
Note: The depth of individual sections depends on data availability for this market. Volume, capacity, trade and other unit-based metrics are included where applicable.

