
Grocery repeat orders and fiber packs anchor carton demand
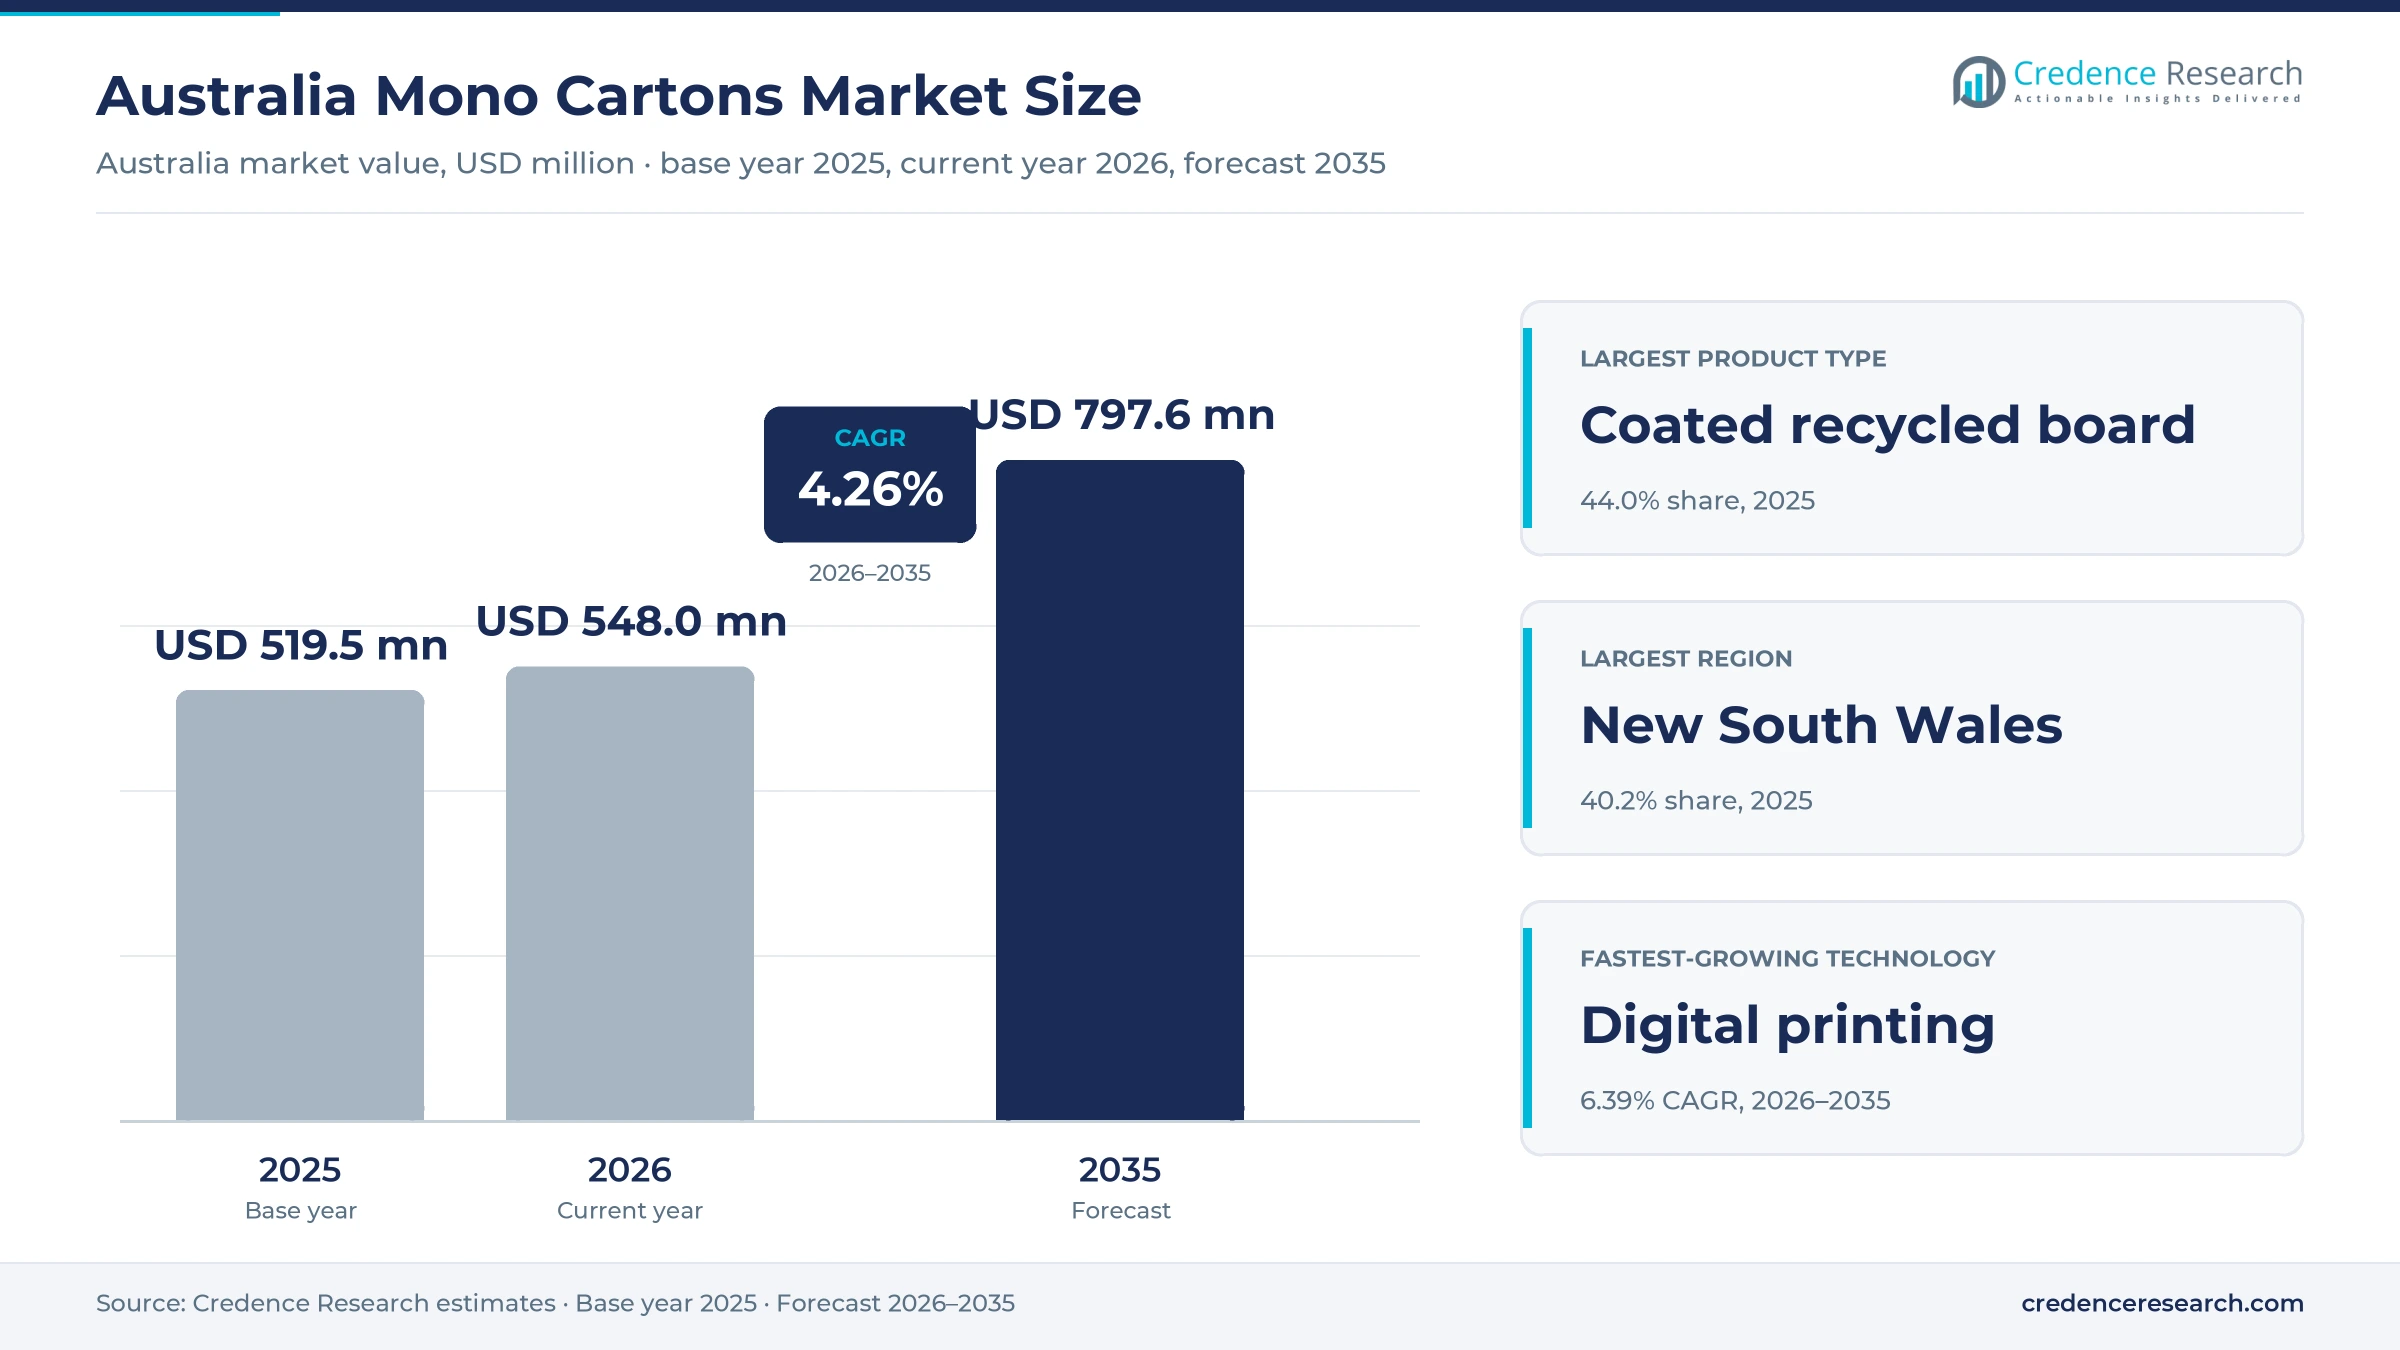
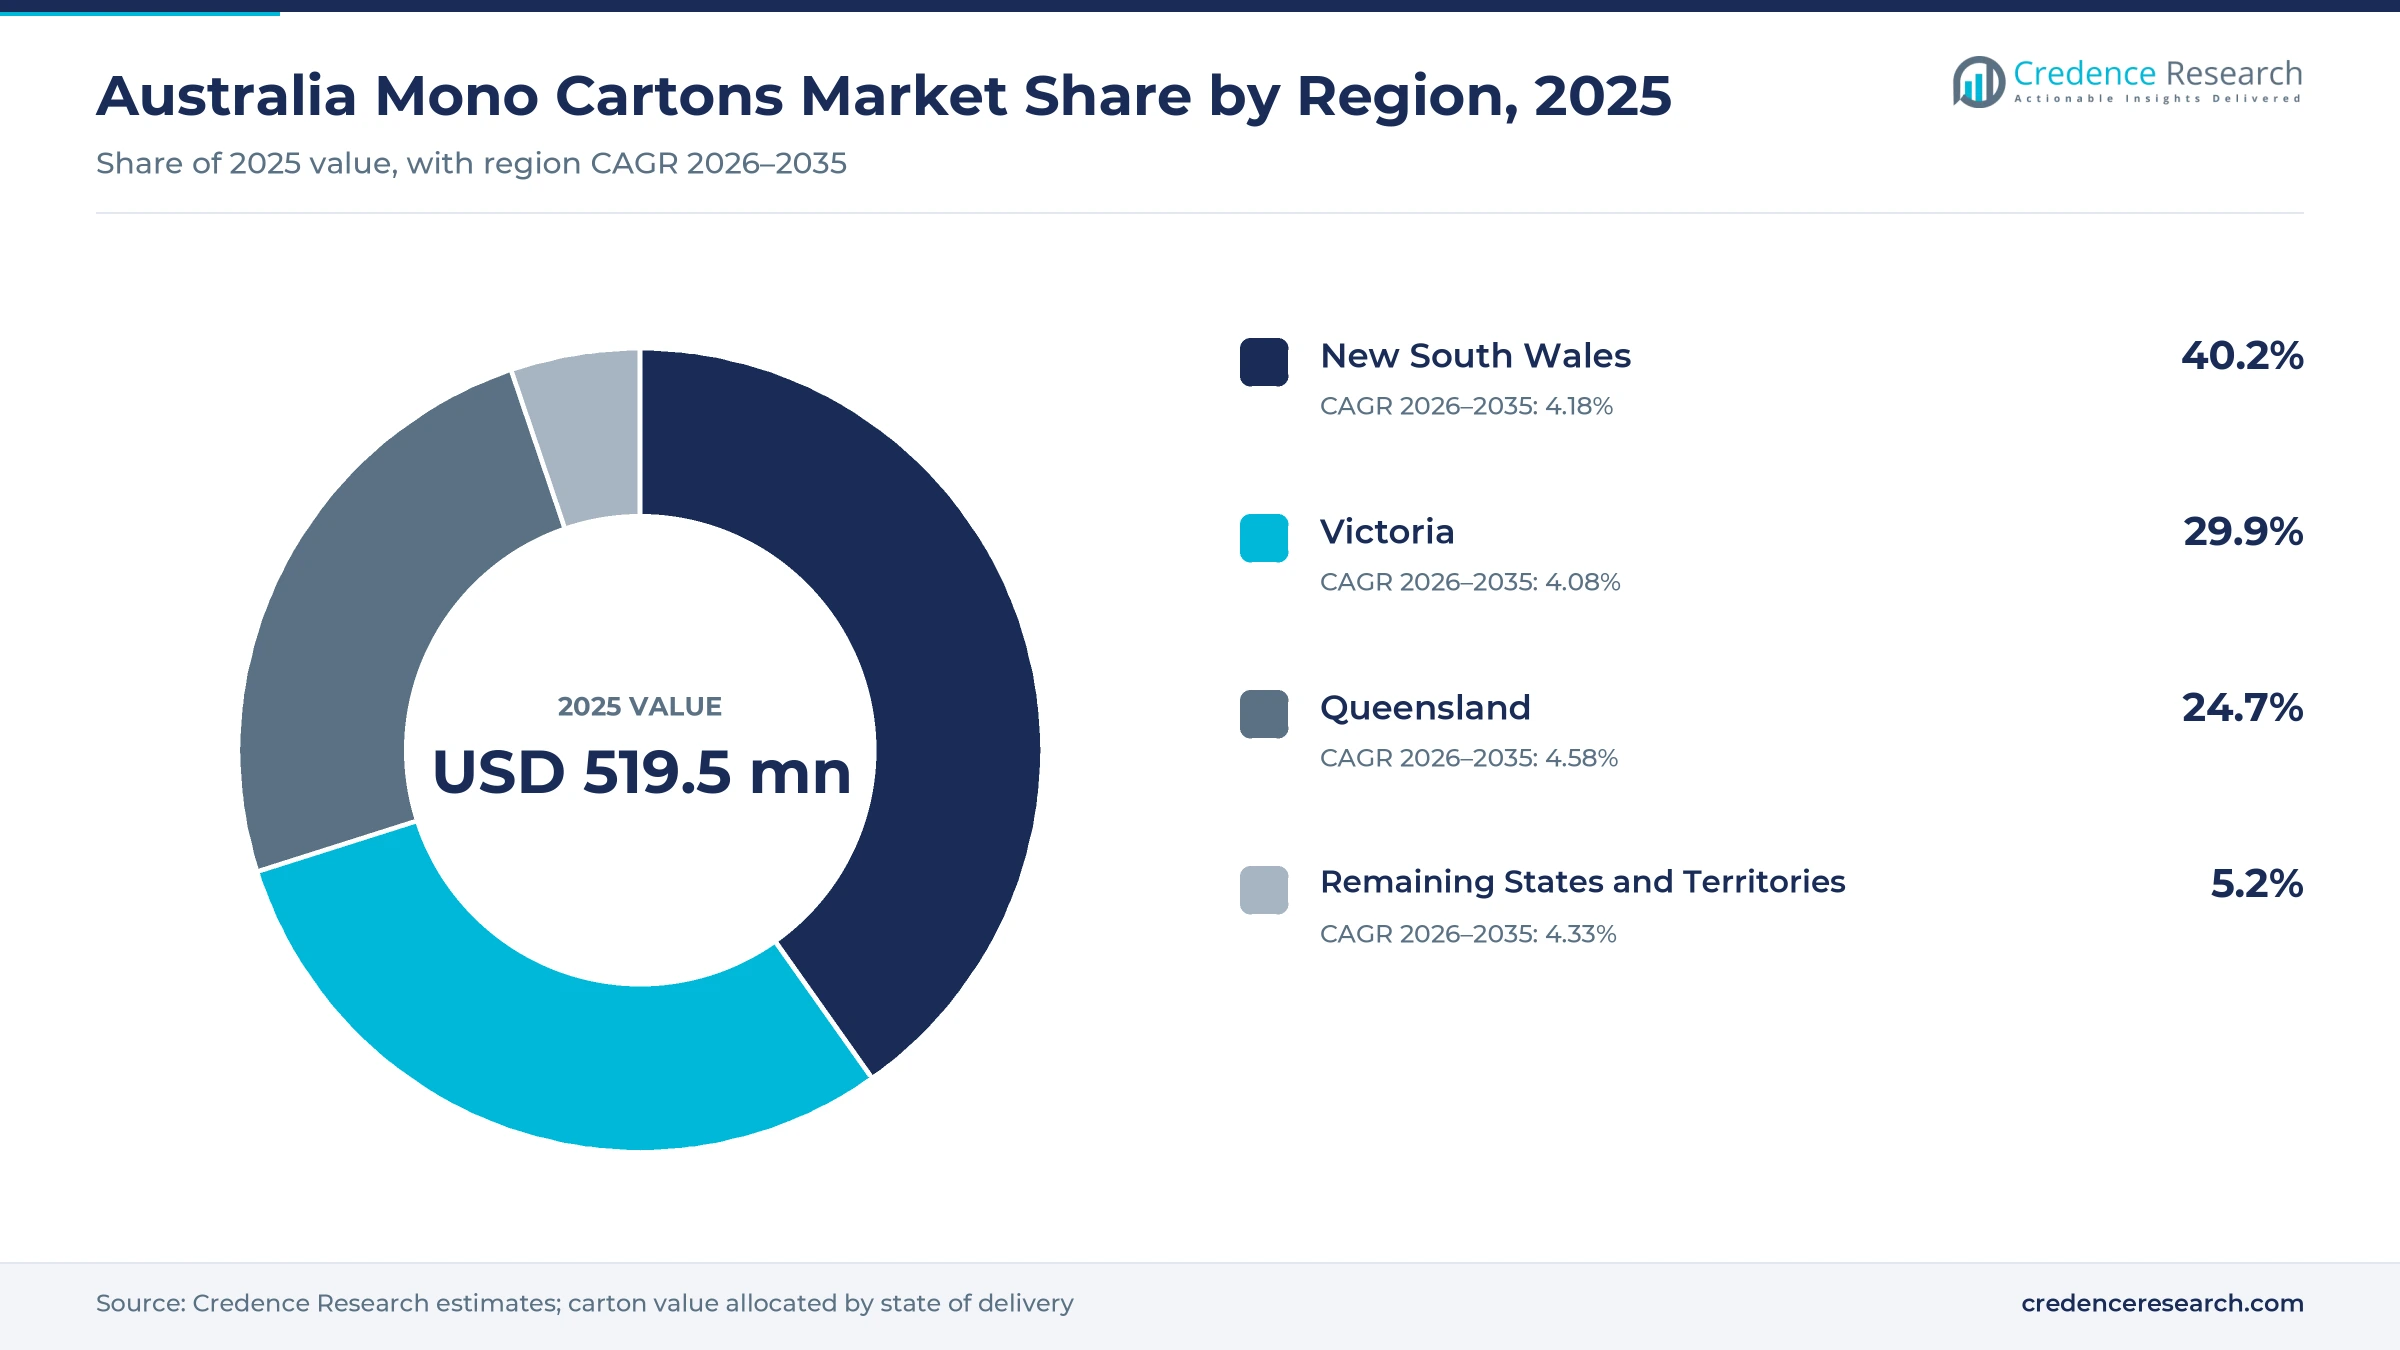
The Australia mono cartons market was valued at USD 519.5 million in 2025 and is projected to increase from USD 548.0 million in 2026 to USD 797.6 million by 2035, registering a CAGR of 4.26% during 2026–2035. Demand comes from food, beverage, health care, personal care and pet product brands that pack single retail units in printed folding cartons made from recycled or virgin paperboard. New South Wales held the largest regional share, 40.2% in 2025, because Sydney hosts many brand owners, contract packers and converting plants. Queensland is the fastest-growing region at 4.58% a year, as population growth and local print capacity raise carton volumes. Packaging policy is also changing, because the federal government opened consultation on packaging regulation reform in September 2024, and most of the 426 responses favored a producer responsibility scheme. As a result, brands are reviewing plastic packs and moving more products into paperboard formats that recycle with fiber streams.
Which paperboard cartons and buyers does the estimate cover?
The estimate measures the value of single-wall printed folding cartons sold in Australia, made from coated recycled board, solid bleached sulphate board or white-top duplex board. Values are stated at converter and distributor selling prices that brand owners, contract packers and retailers pay for printed, die-cut and glued cartons.
The estimate excludes corrugated shipping boxes, liquid packaging cartons, rigid set-up boxes and unprinted board sold on its own. The value chain runs from paperboard mills and board importers through local carton converters and packaging distributors to packing lines, warehouses and retail shelves across the country.
Australia Mono Cartons Market Insights
- The Australia mono cartons market was valued at USD 519.5 million in 2025 and is projected to reach USD 797.6 million by 2035, registering a CAGR of 4.26% during 2026–2035.
- New South Wales held a 40.2% share of 2025 value, because Sydney hosts many brand owners, contract packers and carton converting plants.
- Coated recycled board cartons led with a 44.0% share of 2025 value, because recycled board suits dry food, cereal and household packs at lower cost.
- The federal government opened consultation on packaging regulation reform on Sept. 27, 2024, and the published results in February 2025 showed 426 responses.
- IVE Group bought Melbourne carton maker JacPak in October 2023 and is building a second folding carton site in Sydney to serve national brand owners.
Recycled board leads while premium board grows fastest
Why do coated recycled board cartons lead demand?
Based on product type, the market is categorized into coated recycled board cartons, solid bleached sulphate cartons and white-top duplex cartons. Coated Recycled Board Cartons led with a 44.0% share of 2025 value, because recycled board suits cereal, dry food and household packs at lower cost. Solid Bleached Sulphate Cartons grow fastest at 4.59% a year, as health, beauty and premium food brands seek bright print surfaces.
How does food and beverage packaging dominate use?
Based on end-use industry, the market is categorized into food and beverage, pharmaceutical and health care, personal care and cosmetics, and pet and non-food consumer products. Food and Beverage led with 55.0% of 2025 value, because frozen food, cereal, dairy and confectionery brands buy cartons in every replenishment cycle. Pharmaceutical and Healthcare grows fastest at 4.80% a year, as medicine packs need printed dosage and safety information.
Why does single-product retail packaging lead orders?
Based on application, the market is categorized into single-product retail packaging, multipack packaging and presentation and promotional packaging. Single-Product Retail Packaging led with 62.0% of 2025 value, because most supermarket and pharmacy products sit on shelves in their own printed carton. Presentation and Promotional Packaging grows fastest at 4.84% a year, as brands order seasonal gift packs and window cartons for launches.
Why does offset lithographic printing still lead output?
Based on technology, the market is categorized into offset lithographic printing, flexographic printing and digital printing. Offset Lithographic Printing led with 68.0% of 2025 value, because sheet-fed offset presses deliver sharp images and long runs at low unit cost. Digital Printing grows fastest at 6.39% a year, as brands order shorter runs, regional versions and frequent design changes.
| Segment Group | Leading Sub-segment | Share, 2025 | Fastest-growing Sub-segment | CAGR, 2026–2035 |
|---|---|---|---|---|
| By Product Type | Coated Recycled Board Cartons | 44.0% | Solid Bleached Sulphate Cartons | 4.59% |
| By End-Use Industry | Food and Beverage | 55.0% | Pharmaceutical and Healthcare | 4.80% |
| By Application | Single-Product Retail Packaging | 62.0% | Presentation and Promotional Packaging | 4.84% |
| By Technology | Offset Lithographic Printing | 68.0% | Digital Printing | 6.39% |
Request a Free Sample
Fill in your details and we'll send you a free sample report.
- Sample data tables & charts
- Research methodology
Packaged goods, fiber redesign and converting capacity
How does recurring packaged-goods demand sustain orders?
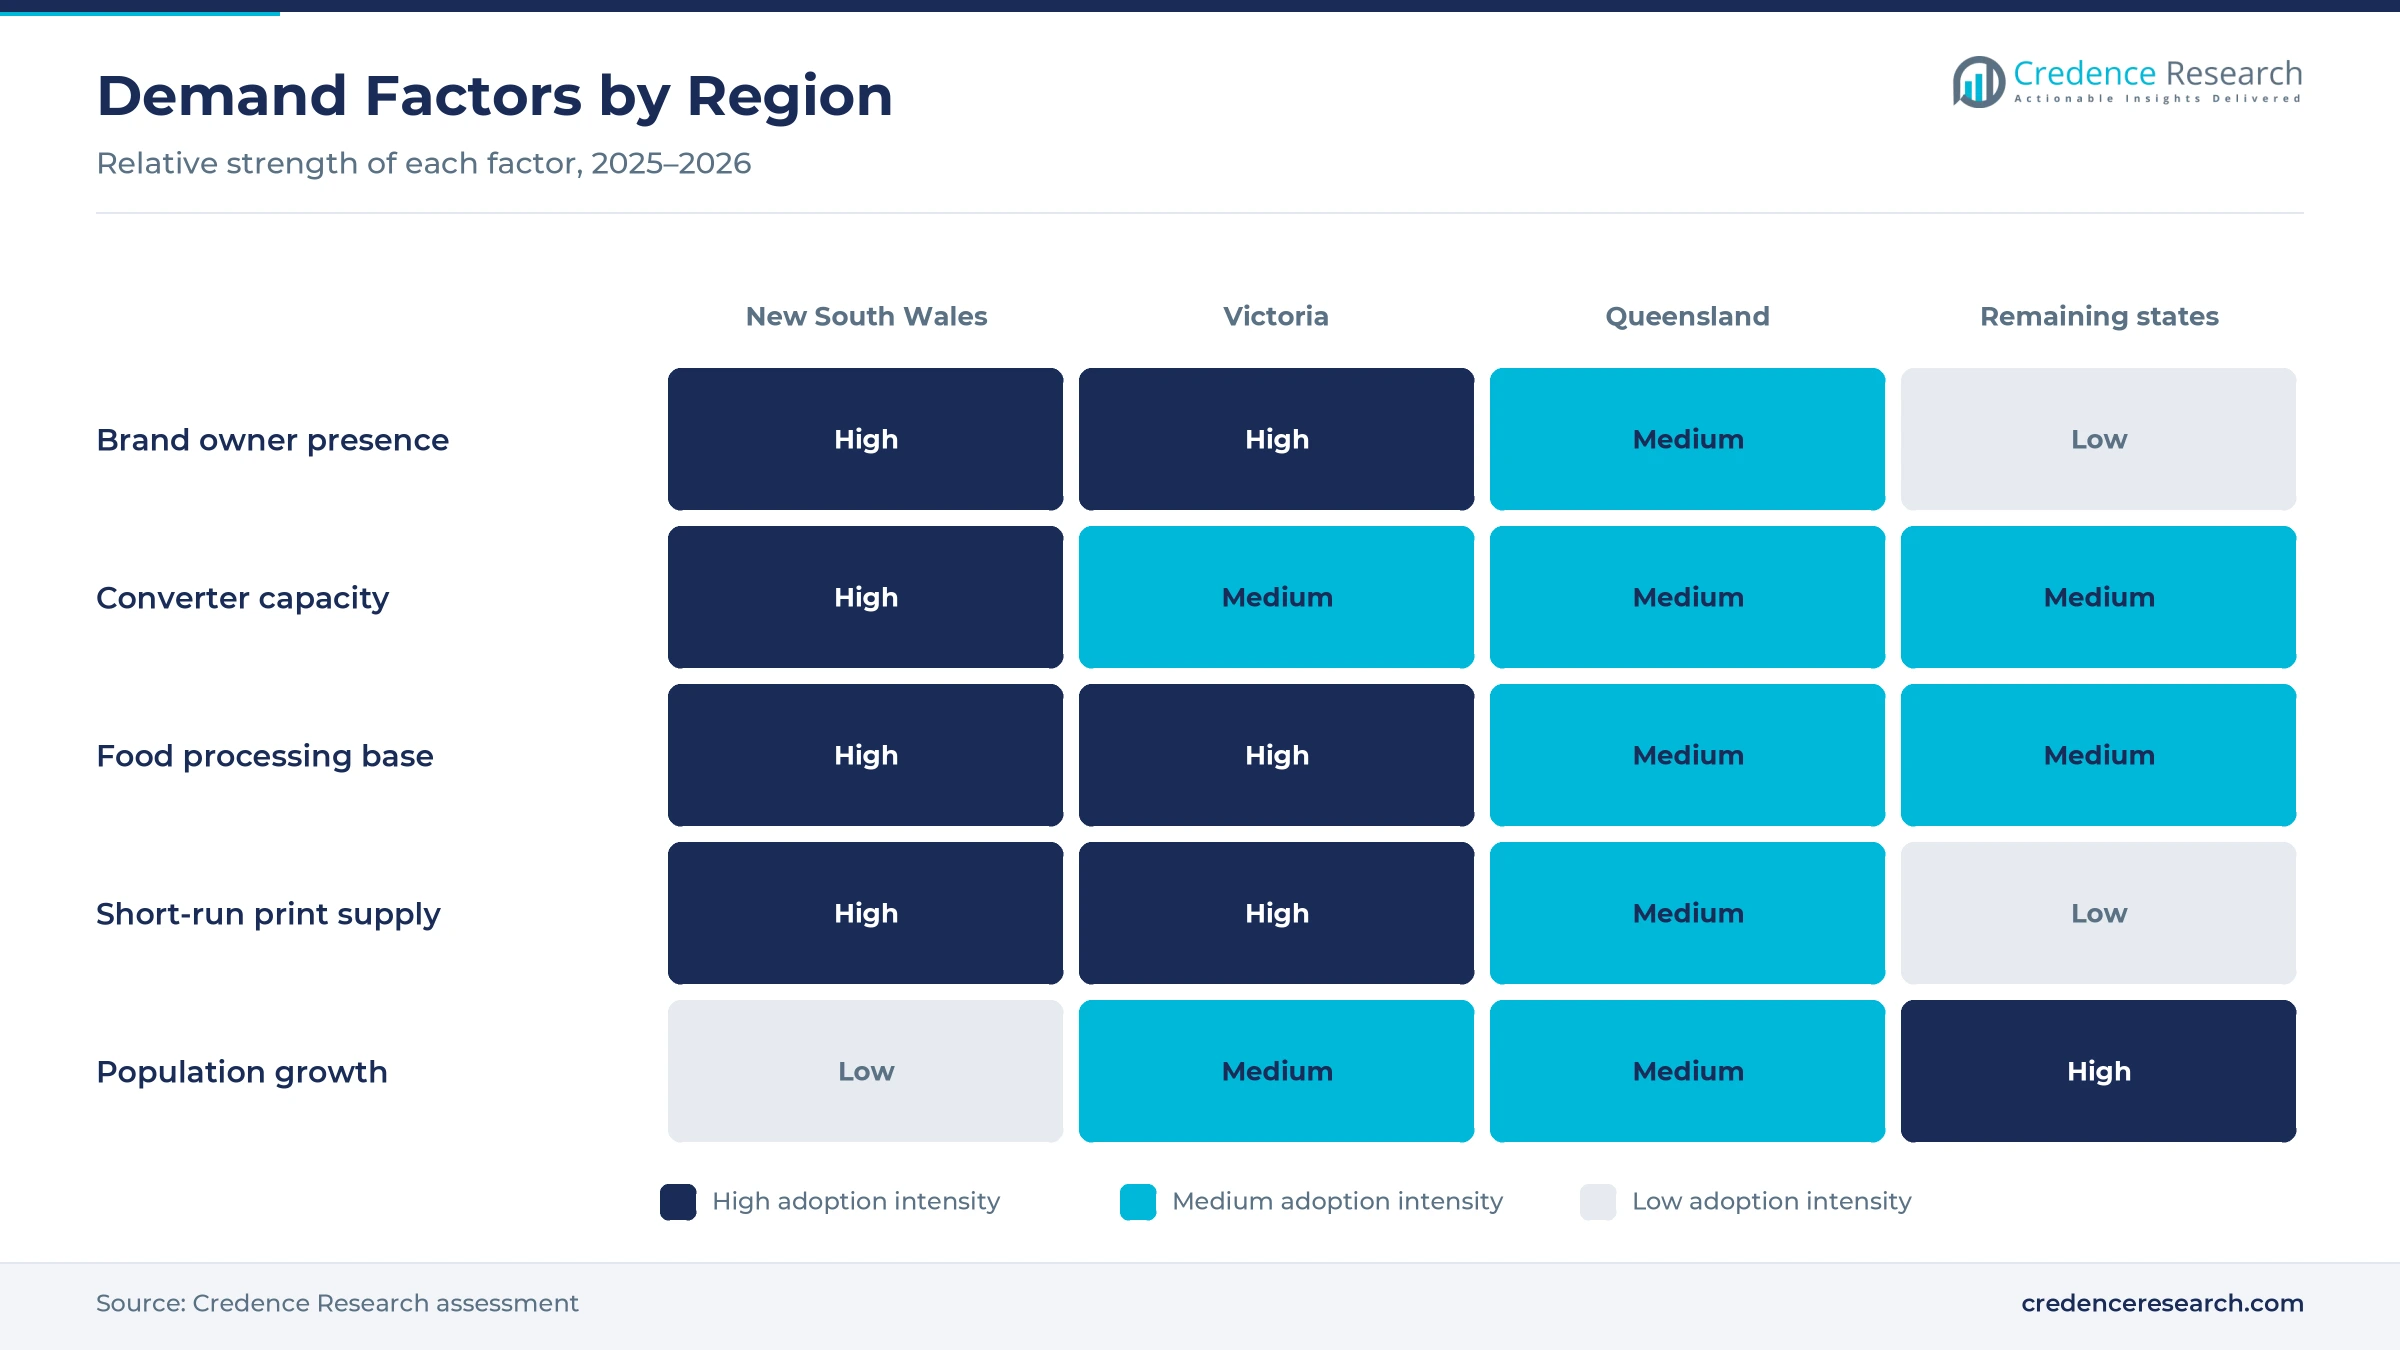
Recurring packaged-goods demand sustains carton orders, because grocery, health and household brands replace printed packs with every production run. Australia placed about 6.98 million metric tons of packaging on the market in 2021-22, and paper and paperboard made up 52.3% of that tonnage, according to APCO data. Manufacturing value added held at about 5.3% of GDP in 2025, according to World Bank data, which keeps local food and consumer goods lines running. The national population also grew 1.4% to about 27.92 million in the year to March 31, 2026, which adds shoppers and pack volumes. As a result, food and beverage held 55.0% of 2025 value, as cereal, frozen food, dairy and confectionery brands reorder cartons throughout the year.
Why does the fiber packaging design transition lift demand?
The fiber packaging design transition lifts carton demand, because brands replace plastic trays, sleeves and clamshells with paperboard formats that recycle more easily. The federal government opened consultation on packaging regulation reform on Sept. 27, 2024, covering retail packaging and mandatory product stewardship, according to Regask. Results released in February 2025 showed 426 responses, and most respondents supported an extended producer responsibility scheme. APCO data also show that 93% of paper and paperboard packaging had good recycling potential in 2021-22, compared with 84% for all packaging. In turn, solid bleached sulphate cartons grow at 4.59% a year, the fastest board rate, as premium food, health and beauty brands move into paperboard packaging with strong print surfaces.
How does investment in specialist converting widen supply?
Investment in specialist converting widens supply, because new lines let converters serve both national brands and small producers. IVE Group agreed in October 2023 to buy JacPak, a Keysborough carton maker with about 100 staff that prints short to medium runs for food, dairy, cosmetics, pharmaceutical and pet care brands, according to IVE Group. IVE then paid about $2.8 million in deposits on die-cutting and folder-gluing systems for a Sydney carton site that mirrors JacPak. Platypus Print Packaging announced the first Koenig and Bauer Rapida 106 X in Australia for Geebung, a press rated at 20,000 sheets per hour. As a result, offset lithographic printing holds 68.0% of 2025 value, supported by new folding and gluing machines at several plants.
Why does eastern state population growth raise volumes?
Population growth in the eastern states raises carton volumes, because more households buy more packaged food, medicines and personal care products. Victoria added about 109,500 residents in the year to March 31, 2026, the largest increase of any state, according to the Australian Bureau of Statistics. Queensland added about 90,100 residents and grew 1.6%, while New South Wales added about 97,000 people. Western Australia recorded the fastest state growth at 2.1%, which supports carton demand from retailers outside the east coast. In turn, Queensland is the fastest-growing region, as Brisbane packers and converters expand local supply for grocery, beverage and household brands.
Short runs and hub consolidation reshape carton supply
How is the shift toward short print runs changing orders?
The shift toward short print runs is changing carton orders, because brands launch more product variants and seasonal designs each year. JacPak built its business on short to medium runs for fast-moving consumer goods, and IVE bought it in October 2023 to replicate that model in Sydney. The Rapida 106 X press that Platypus announced in September 2021 uses simultaneous plate changing and automated pile logistics, which shortens setup time between jobs. Platypus also installed a new folder gluer and a laminating system described as five times faster than its previous machine, and the press is rated at 20,000 sheets per hour. As a result, digital printing grows at 6.39% a year, the fastest technology rate, as brands order small batches with regional or promotional artwork for retail launches.
Why is the rise of converting hub consolidation reshaping supply?
The rise of converting hub consolidation is reshaping supply, because large converters concentrate presses and gluing lines in fewer, larger sites. Opal Cartons planned to close its Heidelberg site in Melbourne by September 2024 and move most equipment to Regency Park in Adelaide and Botany in Sydney, according to PKN Packaging News. Graphic Packaging International completed its purchase of Colorpak in April 2016, which brought folding carton plants in Melbourne and Sydney. Platypus earlier moved several Stafford sites into one 10,000-square-meter plant with HACCP certification in 2018. In turn, New South Wales keeps the largest regional share, as Sydney plants serve brand owners across the east coast.
Can producer responsibility readiness open premium fiber packs?
Producer responsibility readiness opens room for premium fiber packs, because brands that redesign early avoid rushed changes once rules apply. The plastic packaging recycling rate stood at only 20% in 2021-22, which pushes brands to review plastic sleeves, trays and blister packs. Average recycled content in packaging rose to 40% that year, which shows rising demand for verified fiber inputs. Detmold Group launched 2025-2050 sustainability goals in December 2024, covering climate, nature, circularity and governance targets. As a result, solid bleached sulphate cartons gain value, as health and beauty brands swap mixed-material packs for printed board with clear recycling routes and premium finishes.
Is there room to grow in health and beauty packaging?
Health and beauty packaging leaves room to grow, because medicines and cosmetics need printed cartons that carry dosage, ingredient and safety details. JacPak already serves pharmaceutical and cosmetics brands from Keysborough, which gives IVE a base in both categories. Current health expenditure equaled about 10.4% of GDP in 2023, according to World Bank data, which supports steady demand for packed medicines. Opal Cartons holds FSSC 22000 and FSC chain of custody certifications, which suit regulated and premium buyers. In turn, pharmaceutical and health care grows at 4.80% a year, the fastest end-use rate, as contract pharmaceutical manufacturing and cosmetics packaging buyers expand local orders.
Board costs and reform timing weigh on carton converters
How do paperboard costs squeeze converter margins?
Paperboard costs squeeze converter margins, because board makes up a large part of the cost of each printed carton. Small converters feel this most, since they buy board in smaller lots and have less pricing power with brand owners. As a result, some converters struggle to pass on price rises during fixed-price supply contracts. Converters respond by standardizing board grades, nesting layouts to cut waste and adding price review clauses. Over time, larger converting hubs should spread board and energy costs across more volume.
Why does uncertain reform timing delay redesign work?
Uncertain reform timing delays redesign work, because brands do not want to change packs twice before final rules apply. The government released consultation results in February 2025, but the final shape of producer responsibility rules is still being settled. In turn, some buyers postpone moving products from plastic into board until obligations become clear. Converters respond by offering recyclability advice and designs that suit several regulatory options. Clear national rules would speed fiber redesign across food and health brands.
How does site consolidation strain regional supply?
Site consolidation strains regional supply, because fewer plants mean longer freight routes and less spare capacity for urgent jobs. The planned Heidelberg closure moved Opal Cartons production away from Melbourne toward Adelaide and Sydney. As a result, Victorian brands may face longer lead times when demand peaks before holidays. Converters such as JacPak and new Sydney lines help fill the gap with local short-run capacity. Brands also hold more carton stock to protect launches from delays.
Why do barrier needs limit plastic replacement?
Barrier needs limit plastic replacement, because frozen, chilled and greasy products require protection that plain board cannot always provide. Coatings and laminates add cost and can complicate recycling, which weakens the case for switching some packs. In turn, brands test formats for months before committing to fiber designs. Converters respond with water-based coatings and window films that separate during reprocessing. Wider use of these options should open more chilled and frozen categories to cartons over time.
New South Wales leads while Queensland grows fastest
| Region | Value, 2025 (USD million) | Share, 2025 | CAGR, 2026–2035 |
|---|---|---|---|
| New South Wales | 208.8 | 40.2% | 4.18% |
| Victoria | 155.3 | 29.9% | 4.08% |
| Queensland | 128.3 | 24.7% | 4.58% |
| Remaining States and Territories | 27.0 | 5.2% | 4.33% |
Why does New South Wales hold the largest share?
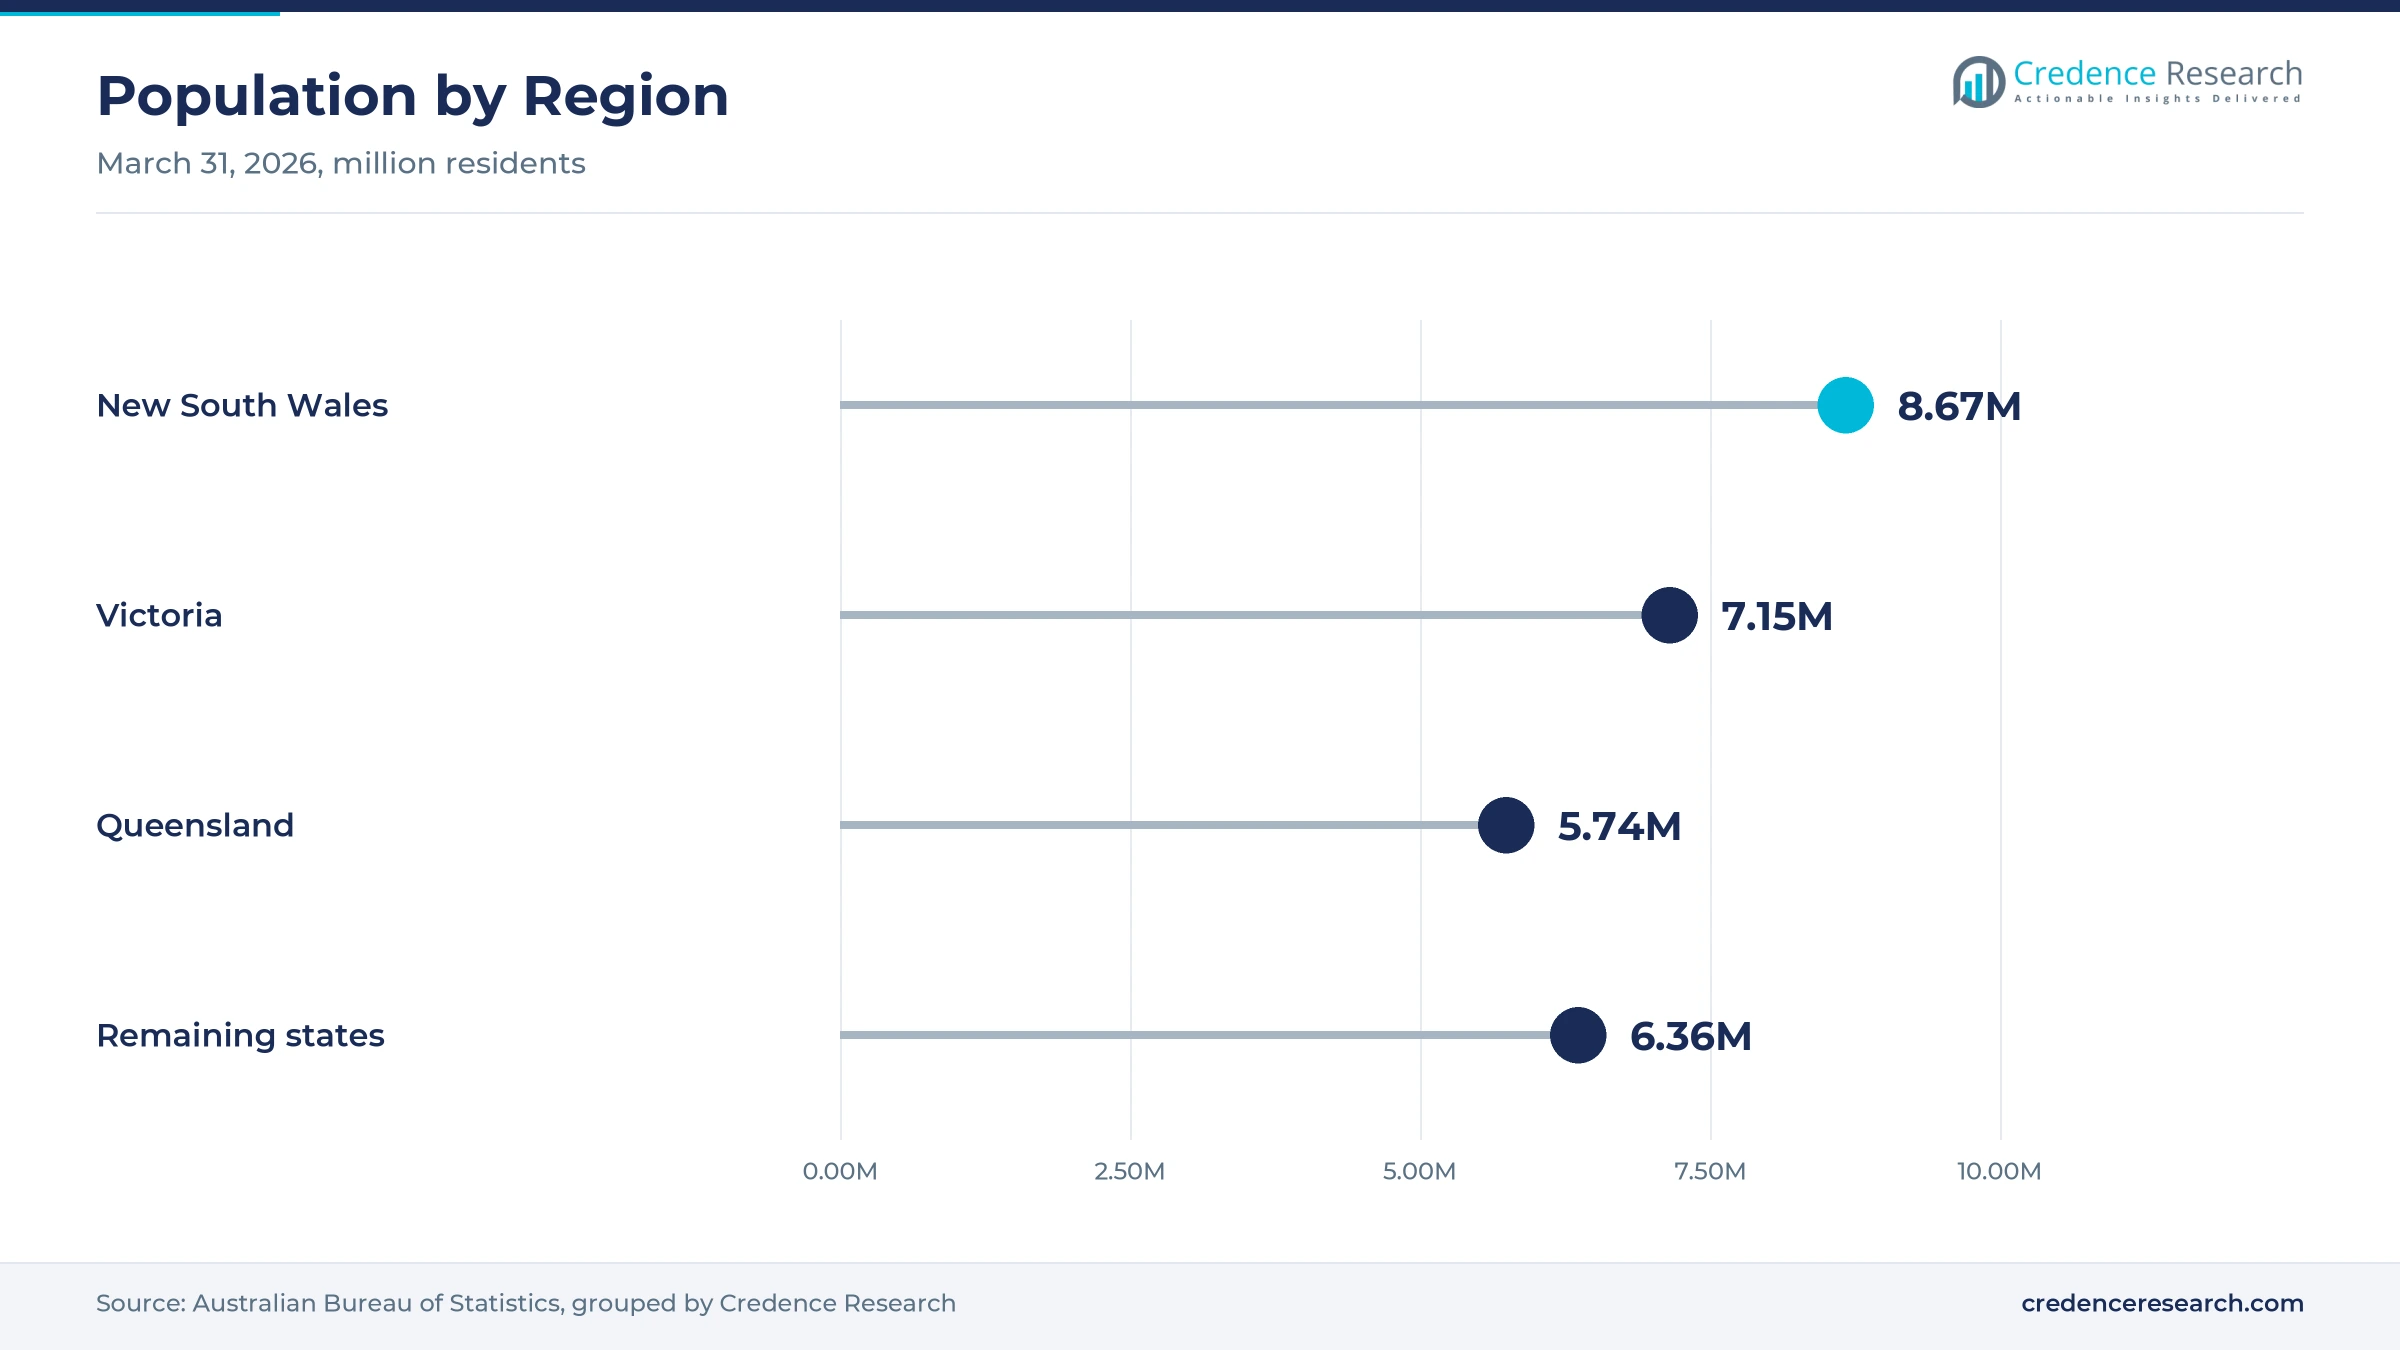
New South Wales held 40.2% of 2025 value and grows at 4.18% a year, because Sydney hosts many brand owners, contract packers and retail head offices. Opal Cartons runs a converting site at Botany, and Graphic Packaging International gained a Sydney carton plant through Colorpak. IVE Group is also adding a Sydney folding carton operation that mirrors JacPak. The state had about 8.67 million residents at March 31, 2026, which supports steady grocery and pharmacy volumes.
How does Victoria sustain carton demand?
Victoria held 29.9% of 2025 value and grows at 4.08% a year, because Melbourne hosts food processors, dairy plants and personal care brands. JacPak prints short and medium runs at Keysborough, and Graphic Packaging International operates a Melbourne carton plant. However, the planned closure of the Opal Cartons Heidelberg site moved some local capacity interstate. The state still added about 109,500 residents in the year to March 2026, the largest increase of any state.
Why is Queensland the fastest-growing region?
Queensland held 24.7% of 2025 value and grows fastest at 4.58% a year, because population growth and local print capacity raise carton volumes. The state had about 5.74 million residents at March 31, 2026, after adding about 90,100 people over the year. Platypus Print Packaging announced a Rapida 106 X press for Geebung and serves customers along the eastern seaboard. In turn, Queensland brands can source printed cartons without long freight routes from southern plants.
How do the remaining states and territories add demand?
The remaining states and territories held 5.2% of 2025 value and grow at 4.33% a year, because wine, food and retail supply chains need printed cartons. Western Australia recorded the fastest state population growth at 2.1% in the year to March 2026. South Australia hosts Opal Cartons at Regency Park and Detmold Group in Brompton, which supply national customers.
Reform steps and converter moves marked 2024 to 2026
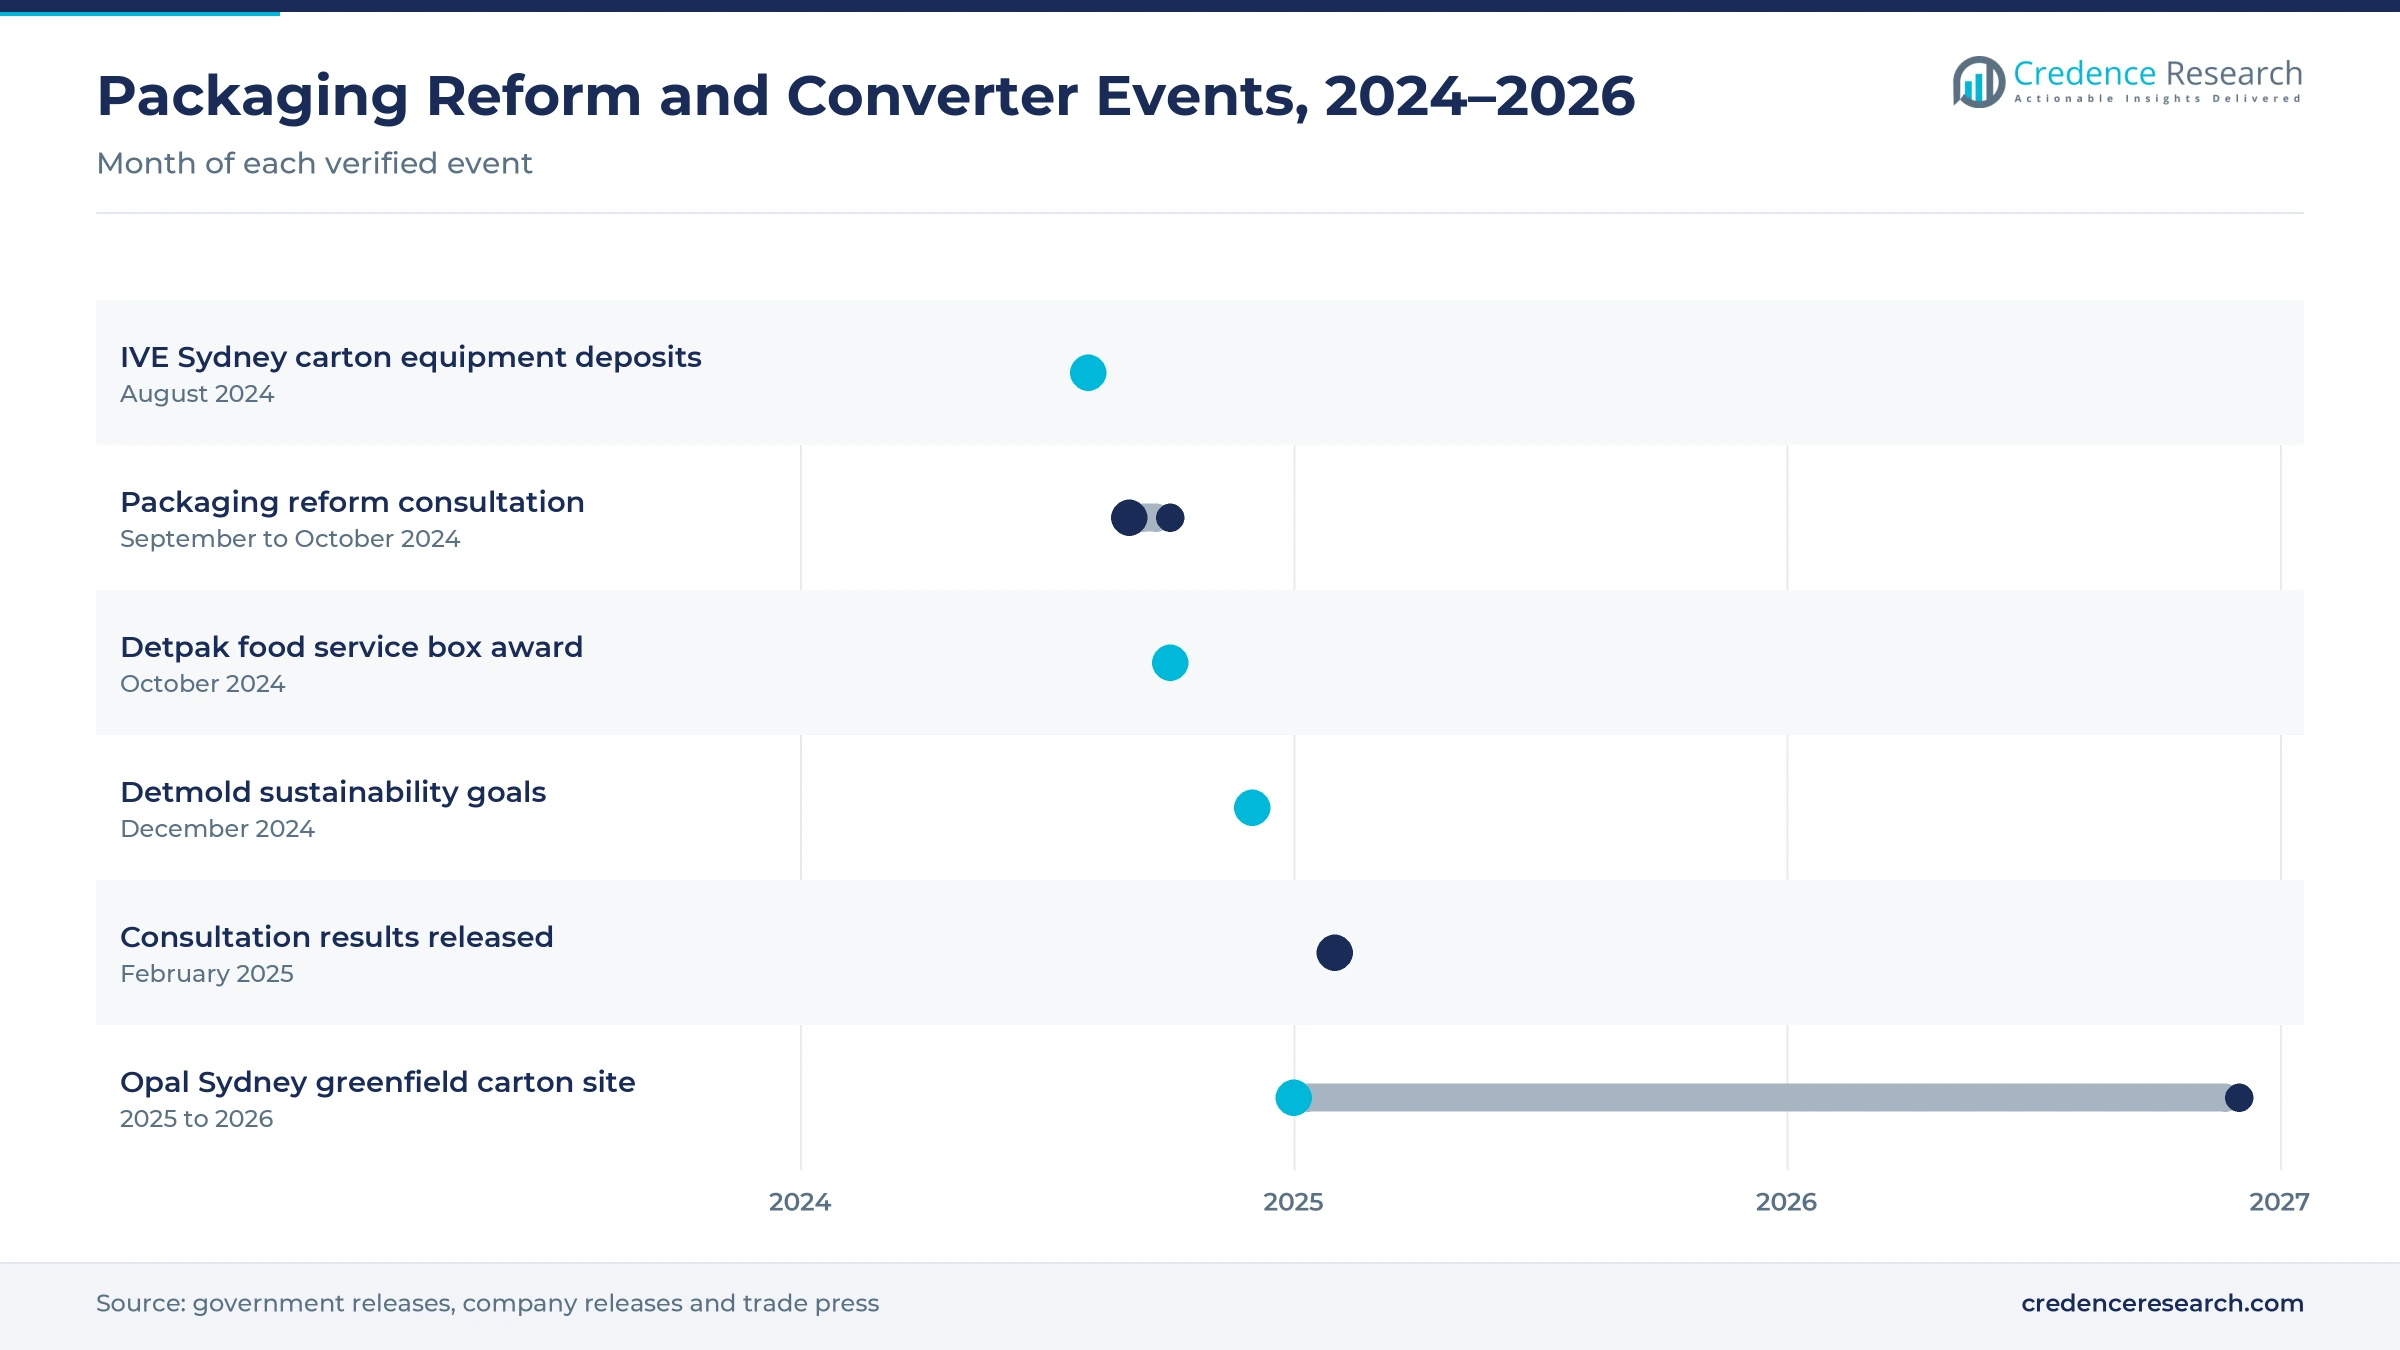
| Development | Status and market relevance |
|---|---|
| In August 2024, IVE Group reported about $2.8 million in deposits for die-cutting and folder-gluing systems at a new Sydney carton site. | Adds a second folding carton hub alongside JacPak in Melbourne |
| In September 2024, the federal government opened consultation on packaging regulation reform with three options. | Set the path toward producer responsibility for packaging |
| In October 2024, Detpak received the Flynn Group Product Excellence Award in Sydney for a Pizza Hut cookie box made with Ferrero and Aryzta. | Shows demand for printed paperboard packs in food service |
| In December 2024, Detmold Group launched 2025-2050 sustainability goals for climate, nature, circularity and governance. | Signals tighter material and recycling targets for paper packaging |
| In February 2025, the government released consultation results showing 426 responses, with most favoring producer responsibility. | Points to stronger obligations for brand owners and their packs |
Offset presses and automated finishing shape output
- Sheet-fed offset presses print high-quality images on board at speeds of up to 20,000 sheets per hour, which keeps long grocery runs cheap.
- Automated plate changing cuts setup time between jobs, which lets converters accept shorter runs without large cost penalties.
- Folder-gluer lines fold and glue straight-line, crash-lock and window cartons in one pass, which speeds delivery to packing lines.
- Window and laminating systems add clear windows and protective films, which helps cartons replace plastic packs for food and gifts.
Need a Custom Version of This Report?
Tailor the scope, geography, or segments to your exact requirements.
- Custom geography or segment scope
- Direct access to our analyst team
Converters with national sites and short runs compete
Competition centers on converters with national sites, food safety certification and short-run capacity. Opal runs carton plants in Sydney and Adelaide, holds FSSC 22000 and FSC chain of custody certifications, and is building a new Sydney greenfield site for 2025 and 2026. Graphic Packaging International entered Australia through its 2016 purchase of Colorpak, which brought plants in Melbourne and Sydney. IVE Group bought JacPak in 2023 and is adding a Sydney site that mirrors it. Detmold Group added local carton converting in Adelaide when it bought Custom Cartons in 2016. Platypus Print Packaging, a family-owned Queensland printer with about 100 staff, competes on print quality and finishing. Rivals compete on board choice, print quality, turnaround times and national delivery, while larger converters add automation to win brand owners that want fewer suppliers.
Companies profiled and their roles in this market
| Company | Type | Role in the market |
|---|---|---|
| Opal | Converter and board maker | Runs carton plants in Sydney and Adelaide with FSSC 22000 certification |
| Graphic Packaging International Australia | Converter | Operates Melbourne and Sydney plants acquired with Colorpak |
| IVE Group | Converter | Owns JacPak in Keysborough and is adding a Sydney carton site |
| Detmold Group | Paper packaging maker | Runs local carton converting in Adelaide through Custom Cartons |
| Platypus Print Packaging | Converter | Announced the first Rapida 106 X in Australia for Geebung |
Credence Research view on Australian carton demand
Credence Research's view is that Australian carton demand will grow steadily because grocery, health and personal care brands reorder packs throughout the year and replace some plastic formats with board. Recycled board keeps the largest share, while premium board and digital printing gain ground. New converting lines in Sydney and automated presses improve supply, but site consolidation can stretch lead times. Health care packs should grow fastest among end uses through 2035. However, board costs and uncertain reform timing will slow some switching. Converters with certified sites, short-run capacity and national delivery should gain share fastest.
Packaging data and converter news anchor the carton model
The report uses 2025 as the base year on a calendar basis, and market values come from the Credence Research model. That model combines packaging consumption and recovery data, government consultation results, population statistics, World Bank manufacturing data and converter announcements. Segment splits and regional growth rates are Credence Research estimates, while regional shares follow the client-defined split. Sources used are public reports, official statistics, trade press, government releases and company releases, and no interviews or surveys were used.
Fiber redesign and grocery demand carry growth to 2035
Carton sales are expected to reach USD 797.6 million by 2035, a 4.26% CAGR during 2026–2035, as grocery demand, fiber redesign and new converting capacity keep orders rising. Growth should hold firm through 2027 as brands prepare for producer responsibility and new Sydney lines start running. After that, national design rules and board costs will set the pace of change. A long delay in reform would lower this outlook, while earlier mandatory rules would raise it. Premium board and digital printing are expected to gain the most share over the period.
Frequently Asked Questions
How big is the Australia mono cartons market?
Which board type leads carton demand in Australia?
Which region leads the Australia mono cartons market?
Why does food and beverage packaging lead use?
How is packaging reform affecting carton demand?
Which printing technology grows fastest?
Who are the leading carton suppliers in Australia?
What are the main challenges for carton converters?
Table of Content
Chapter 1 Market Segmentation
- 1.1 Segmentation Framework
- 1.1.1 Product and Service Classification
- 1.1.2 Application and End-Use Classification
- 1.1.3 Technology and Solution Classification
- 1.1.4 Customer and Distribution Channel Classification
- 1.1.5 Geographic Segmentation
- 1.1.6 Market Segment Definitions and Boundaries
- 1.2 By Product Type
- 1.2.1 Coated Recycled Board Cartons
- 1.2.2 Solid Bleached Sulphate Cartons
- 1.2.3 White-Top Duplex Cartons
- 1.3 By End-Use Industry
- 1.3.1 Food and Beverage
- 1.3.2 Pharmaceutical and Healthcare
- 1.3.3 Personal Care and Cosmetics
- 1.3.4 Pet and Non-Food Consumer Products
- 1.4 By Application
- 1.4.1 Single-Product Retail Packaging
- 1.4.2 Multipack Packaging
- 1.4.3 Presentation and Promotional Packaging
- 1.5 By Technology
- 1.5.1 Offset Lithographic Printing
- 1.5.2 Flexographic Printing
- 1.5.3 Digital Printing
Chapter 2 Introduction
- 2.1 Report Objectives and Scope
- 2.2 Product Definition and Industry Terminology
- 2.3 Market Inclusions and Exclusions
- 2.4 Research Process
- 2.4.1 Primary Research and Expert Interviews
- 2.4.2 Secondary Research and Source Review
- 2.4.3 Top-Down and Bottom-Up Estimation
- 2.4.4 Data Triangulation and Verification
- 2.5 Market Size Measurement Basis
- 2.5.1 2025: USD 519.5 million → 2035: USD 797.6 million
- 2.6 Historical and Forecast Reference Periods
- 2.6.1 Historical Period: 2018-2025
- 2.6.2 Base Year: 2025
- 2.6.3 Forecast Period: 2025-2035
- 2.7 Research Assumptions and Limitations
Chapter 3 Executive Summary
- 3.1 Market Snapshot and Key Findings
- 3.2 Base-Year Market Size, 2025
- 3.3 Forecast Market Size, 2035
- 3.4 Revenue and Volume Growth Outlook
- 3.5 Key Demand and Supply Indicators
- 3.6 Leading Market Segments
- 3.7 Fastest-Growing Market Opportunities
- 3.8 Regional Performance Highlights
- 3.9 Technology and Industry Transformation
- 3.10 Competitive Landscape Summary
- 3.11 Analyst View and Strategic Implications
Chapter 4 Australia Mono Cartons Market Trends and Developments
- 4.1 Historical Industry Development, 2018-2025
- 4.2 Recent Market Trends and Developments
- 4.3 Demand and Customer Behavior Trends
- 4.4 Technology and Product Innovation
- 4.5 Artificial Intelligence, Automation and Digitalization
- 4.6 Local Manufacturing and Supply Chain Realignment
- 4.7 Industry Partnerships, Mergers and Acquisitions
- 4.8 Sustainability and Circular Economy Developments
- 4.9 Government and Private Sector Investment Trends
- 4.10 Emerging Business Models and Commercialization
- 4.11 Industry Developments and Announcements
Chapter 5 Australia Mono Cartons Market Production, Supply and Demand Analysis
- 5.1 Demand Trend and Consumption Analysis, 2018-2025
- 5.2 Demand Forecast, 2025-2035
- 5.3 Production and Output Trend, 2018-2025
- 5.4 Production and Output Forecast, 2025-2035
- 5.5 Installed Capacity and Capacity Utilization
- 5.6 Company-Wise Production Plants and Statistics
- 5.6.1 Installed Production Capacity
- 5.6.2 Actual Production
- 5.6.3 Planned Capacity and Expansion Targets
- 5.7 Supply Chain Structure and Procurement Trends
- 5.8 Supply-Demand Gap and Bottlenecks
- 5.9 Import Dependence and Sourcing Structure
- 5.10 Contract Manufacturing and Outsourcing
- 5.11 Regional Supply and Demand Concentration
Chapter 6 Australia Mono Cartons Market Pricing Analysis
- 6.1 Pricing Structure and Measurement
- 6.2 Historical Pricing Trends, 2018-2025
- 6.3 Pricing Outlook, 2025-2035
- 6.4 Average Selling Price and Unit Economics
- 6.5 Pricing by Product and Market Segment
- 6.6 Geographic Pricing Differences
- 6.7 Key Input, Energy, Labor and Logistics Costs
- 6.8 Contract Pricing and Purchasing Models
- 6.9 Pricing Sensitivity and Competitive Positioning
- 6.10 Price, Margin and Profitability Implications
Chapter 7 Australia Mono Cartons Market Dynamics
- 7.1 Market Growth Drivers
- 7.1.1 Demand-Side Drivers
- 7.1.2 Technology and Innovation Drivers
- 7.1.3 Infrastructure and Investment Drivers
- 7.1.4 Regulatory and Policy Drivers
- 7.2 Market Restraints
- 7.2.1 Cost and Affordability Constraints
- 7.2.2 Technology and Adoption Barriers
- 7.2.3 Supply Chain and Operational Constraints
- 7.3 Market Challenges
- 7.3.1 Competitive Pressure and Margin Erosion
- 7.3.2 Skills, Infrastructure and Implementation Gaps
- 7.4 Emerging Market Opportunities
- 7.5 Market Dynamics Impact and Time-Horizon Assessment
Chapter 8 Australia Mono Cartons Value Chain Analysis
- 8.1 Industry Value Chain Overview
- 8.2 Upstream Suppliers and Critical Inputs
- 8.3 Technology and Component Providers
- 8.4 Manufacturing or Service Delivery
- 8.5 Distribution, Channel Partners and Integrators
- 8.6 Downstream Applications and End Users
- 8.7 Value Addition and Profit Pools
- 8.8 Vertical Integration and Outsourcing
- 8.9 Supplier Concentration and Risk
- 8.10 Supply Chain Localization and Resilience
Chapter 9 Australia Mono Cartons Market Regulations and Policies
- 9.1 Relevant Laws, Standards and Compliance Frameworks
- 9.2 Product, Service, Safety and Quality Requirements
- 9.3 Government Policies, Incentives and Subsidies
- 9.4 Imports, Exports and Trade Barriers
- 9.5 Public Procurement and Local Content Requirements
- 9.6 Environmental and Sustainability Compliance
- 9.7 Upcoming Policy Changes and Market Implications
Chapter 10 Australia Mono Cartons Market Hotspots and Opportunities
- 10.1 Market Opportunity Mapping and Growth Hotspots
- 10.2 High-Growth Applications and Customer Groups
- 10.3 Underserved Markets and White-Space Opportunities
- 10.4 Emerging Technology and Product Opportunities
- 10.5 New Capacity and Investment Hotspots
- 10.6 Market Entry and Expansion Opportunities
- 10.7 Distribution and Partnership Opportunities
- 10.8 Near-Term and Long-Term Commercial Potential
- 10.9 Opportunity Attractiveness and Execution Risks
Chapter 11 Australia Mono Cartons Market Outlook, 2025-2035
- 11.1 Market Size and Analysis
- 11.1.1 Revenue (Market Measurement: 2025: USD 519.5 million → 2035: USD 797.6 million)
- 11.1.2 Market Volume and Quantity Sold
- 11.1.3 Historical Market Size, 2018-2025
- 11.1.4 Base-Year Market Size, 2025
- 11.2 Market Forecast, 2025-2035
- 11.2.1 Revenue Forecast to 2035
- 11.2.2 Volume Forecast to 2035
- 11.2.3 CAGR and Year-on-Year Growth
- 11.2.4 Incremental Revenue Opportunity
- 11.3 Forecast Assumptions and Scenario Analysis
- 11.3.1 Base-Case Forecast
- 11.3.2 Optimistic and Conservative Scenarios
- 11.3.3 Technology, Pricing and Policy Sensitivities
- 11.4 Market Attractiveness and Growth Outlook
Chapter 12 Australia Mono Cartons Market Segmentation and Outlook
- 12.1 Segmentation Summary and Market Shares, 2025
- 12.2 Largest and Fastest-Growing Segments
- 12.3 By Product Type - Market Size and Forecast, 2025-2035
- 12.3.1 Segment Definition and Scope
- 12.3.2 Historical Market Size, 2018-2025
- 12.3.3 Revenue Forecast, 2025-2035
- 12.3.4 Volume Forecast, 2025-2035
- 12.3.5 Base-Year Market Share, 2025
- 12.3.6 Segment CAGR and Growth Drivers
- 12.3.7 Subsegment Market Size and Forecast
- 12.3.7.1 Coated Recycled Board Cartons
- 12.3.7.2 Solid Bleached Sulphate Cartons
- 12.3.7.3 White-Top Duplex Cartons
- 12.3.8 Subsegment Pricing and Adoption Trends
- 12.3.9 Leading Suppliers and Competition
- 12.3.10 Regional Demand and Opportunities
- 12.4 By End-Use Industry - Market Size and Forecast, 2025-2035
- 12.4.1 Segment Definition and Scope
- 12.4.2 Historical Market Size, 2018-2025
- 12.4.3 Revenue Forecast, 2025-2035
- 12.4.4 Volume Forecast, 2025-2035
- 12.4.5 Base-Year Market Share, 2025
- 12.4.6 Segment CAGR and Growth Drivers
- 12.4.7 Subsegment Market Size and Forecast
- 12.4.7.1 Food and Beverage
- 12.4.7.2 Pharmaceutical and Healthcare
- 12.4.7.3 Personal Care and Cosmetics
- 12.4.7.4 Pet and Non-Food Consumer Products
- 12.4.8 Subsegment Pricing and Adoption Trends
- 12.4.9 Leading Suppliers and Competition
- 12.4.10 Regional Demand and Opportunities
- 12.5 By Application - Market Size and Forecast, 2025-2035
- 12.5.1 Segment Definition and Scope
- 12.5.2 Historical Market Size, 2018-2025
- 12.5.3 Revenue Forecast, 2025-2035
- 12.5.4 Volume Forecast, 2025-2035
- 12.5.5 Base-Year Market Share, 2025
- 12.5.6 Segment CAGR and Growth Drivers
- 12.5.7 Subsegment Market Size and Forecast
- 12.5.7.1 Single-Product Retail Packaging
- 12.5.7.2 Multipack Packaging
- 12.5.7.3 Presentation and Promotional Packaging
- 12.5.8 Subsegment Pricing and Adoption Trends
- 12.5.9 Leading Suppliers and Competition
- 12.5.10 Regional Demand and Opportunities
- 12.6 By Technology - Market Size and Forecast, 2025-2035
- 12.6.1 Segment Definition and Scope
- 12.6.2 Historical Market Size, 2018-2025
- 12.6.3 Revenue Forecast, 2025-2035
- 12.6.4 Volume Forecast, 2025-2035
- 12.6.5 Base-Year Market Share, 2025
- 12.6.6 Segment CAGR and Growth Drivers
- 12.6.7 Subsegment Market Size and Forecast
- 12.6.7.1 Offset Lithographic Printing
- 12.6.7.2 Flexographic Printing
- 12.6.7.3 Digital Printing
- 12.6.8 Subsegment Pricing and Adoption Trends
- 12.6.9 Leading Suppliers and Competition
- 12.6.10 Regional Demand and Opportunities
- 12.7 Segment Growth Comparison
- 12.8 Segment Attractiveness and Priority Matrix
Chapter 13 Australia Mono Cartons End-Use and Application Market Outlook
- 13.1 End-Use Industry and Customer Demand Structure
- 13.2 Leading Applications and Customer Groups
- 13.3 End-Use Market Size, Share and Forecast
- 13.4 Major End-Use Industry Deep Dives
- 13.4.1 Customer Requirements and Use Cases
- 13.4.2 Demand and Replacement Cycles
- 13.4.3 Technical and Regulatory Considerations
- 13.4.4 Purchasing and Procurement Models
- 13.4.5 Leading Vendors and Distribution Channels
- 13.4.6 Forecast and Commercial Opportunities
- 13.5 Emerging Applications and Cross-Segment Demand
- 13.6 End-Use Industry Investment Priorities
Chapter 14 Australia Mono Cartons Geographic Market Outlook, 2025-2035
- 14.1 Domestic Market Distribution and Demand Clusters
- 14.2 State- or Province-Wise Market Size and Forecast, 2025-2035
- 14.3 City and Metropolitan Market Outlook
- 14.4 Industrial, Manufacturing and Commercial Clusters
- 14.5 Geographic Concentration of Key End Users
- 14.6 Local Pricing and Purchasing Differences
- 14.7 Domestic Production Facilities and Capacity Map
- 14.8 Local Infrastructure and Project Pipeline
- 14.9 State-Level Policy and Incentive Differences
- 14.10 Subnational Investment Hotspots and Opportunities
- 14.11 Distribution and Logistics Networks
- 14.12 Domestic Competitive Footprint
Chapter 15 Australia Mono Cartons Technology, Innovation and Sustainability Outlook
- 15.1 Technology Landscape and Maturity
- 15.2 Product, Process and Service Innovation
- 15.3 AI, Automation and Digital Tools in the Industry
- 15.4 Technology Adoption and Performance Benchmarking
- 15.5 Innovation Pipeline and R&D Investment
- 15.6 Patent and Intellectual Property Trends
- 15.7 Energy Efficiency and Resource Management
- 15.8 Sustainability, Recycling and Circularity
- 15.9 Technology Roadmap, 2025-2035
- 15.10 Risks of Obsolescence and Technology Substitution
Chapter 16 Australia Mono Cartons Market Key Strategic Imperatives
- 16.1 Growth and Market Entry Priorities
- 16.2 High-Return Products and Segments
- 16.3 Pricing, Profitability and Cost Optimization
- 16.4 Technology Investment and Product Differentiation
- 16.5 Supply Chain Localization and Resilience
- 16.6 Distribution and Customer Acquisition
- 16.7 Partnership, Acquisition and Capacity Strategy
- 16.8 Regional Expansion Priorities
- 16.9 Short-, Medium- and Long-Term Actions
Chapter 17 Competition Outlook
- 17.1 Industry Competition Characteristics
- 17.2 Market Structure and Concentration
- 17.3 Market Share and Competitive Positioning, 2025
- 17.4 Company-Wise Revenue and Product Benchmarking
- 17.5 Production and Service Capacity Benchmarking
- 17.6 Technology, Pricing and Differentiation
- 17.7 Regional Footprint and Distribution Strength
- 17.8 Mergers, Acquisitions and Strategic Alliances
- 17.9 New Entrants and Competitive Threats
- 17.10 Porter's Five Forces and Industry Attractiveness
- 17.11 Competitive Outlook, 2025-2035
Chapter 18 Company Profiles
- 18.1 Company Coverage and Selection Criteria
- 18.2 Graphic Packaging International Australia
- 18.2.1 Business Description
- 18.2.2 Company Ownership and Geographic Presence
- 18.2.3 Product and Service Portfolio
- 18.2.4 Manufacturing and Operating Footprint
- 18.2.5 Production Capacity and Expansion Plans
- 18.2.6 Financial Performance and Investment
- 18.2.7 Market Share and Competitive Position
- 18.2.8 Technology and Innovation Capabilities
- 18.2.9 Strategic Alliances or Partnerships
- 18.2.10 Recent Developments
- 18.2.11 Growth Strategy and Outlook
- 18.3 Detmold Group
- 18.4 Opal
- 18.5 IVE Group
- 18.6 Platypus Print Packaging
- 18.7 Other Relevant Market Participants
Note: Every listed company is profiled on the structure shown under the first company. The company list is preliminary and may change based on research findings, market developments, data availability and client requirements.
Chapter 19 Disclaimer
- 19.1 Research and Forecast Disclaimer
- 19.2 Data Source and Estimation Limitations
Note: The depth of individual sections depends on data availability for this market. Volume, capacity, trade and other unit-based metrics are included where applicable.

