
Packaging reform and recycling claims shape label choices
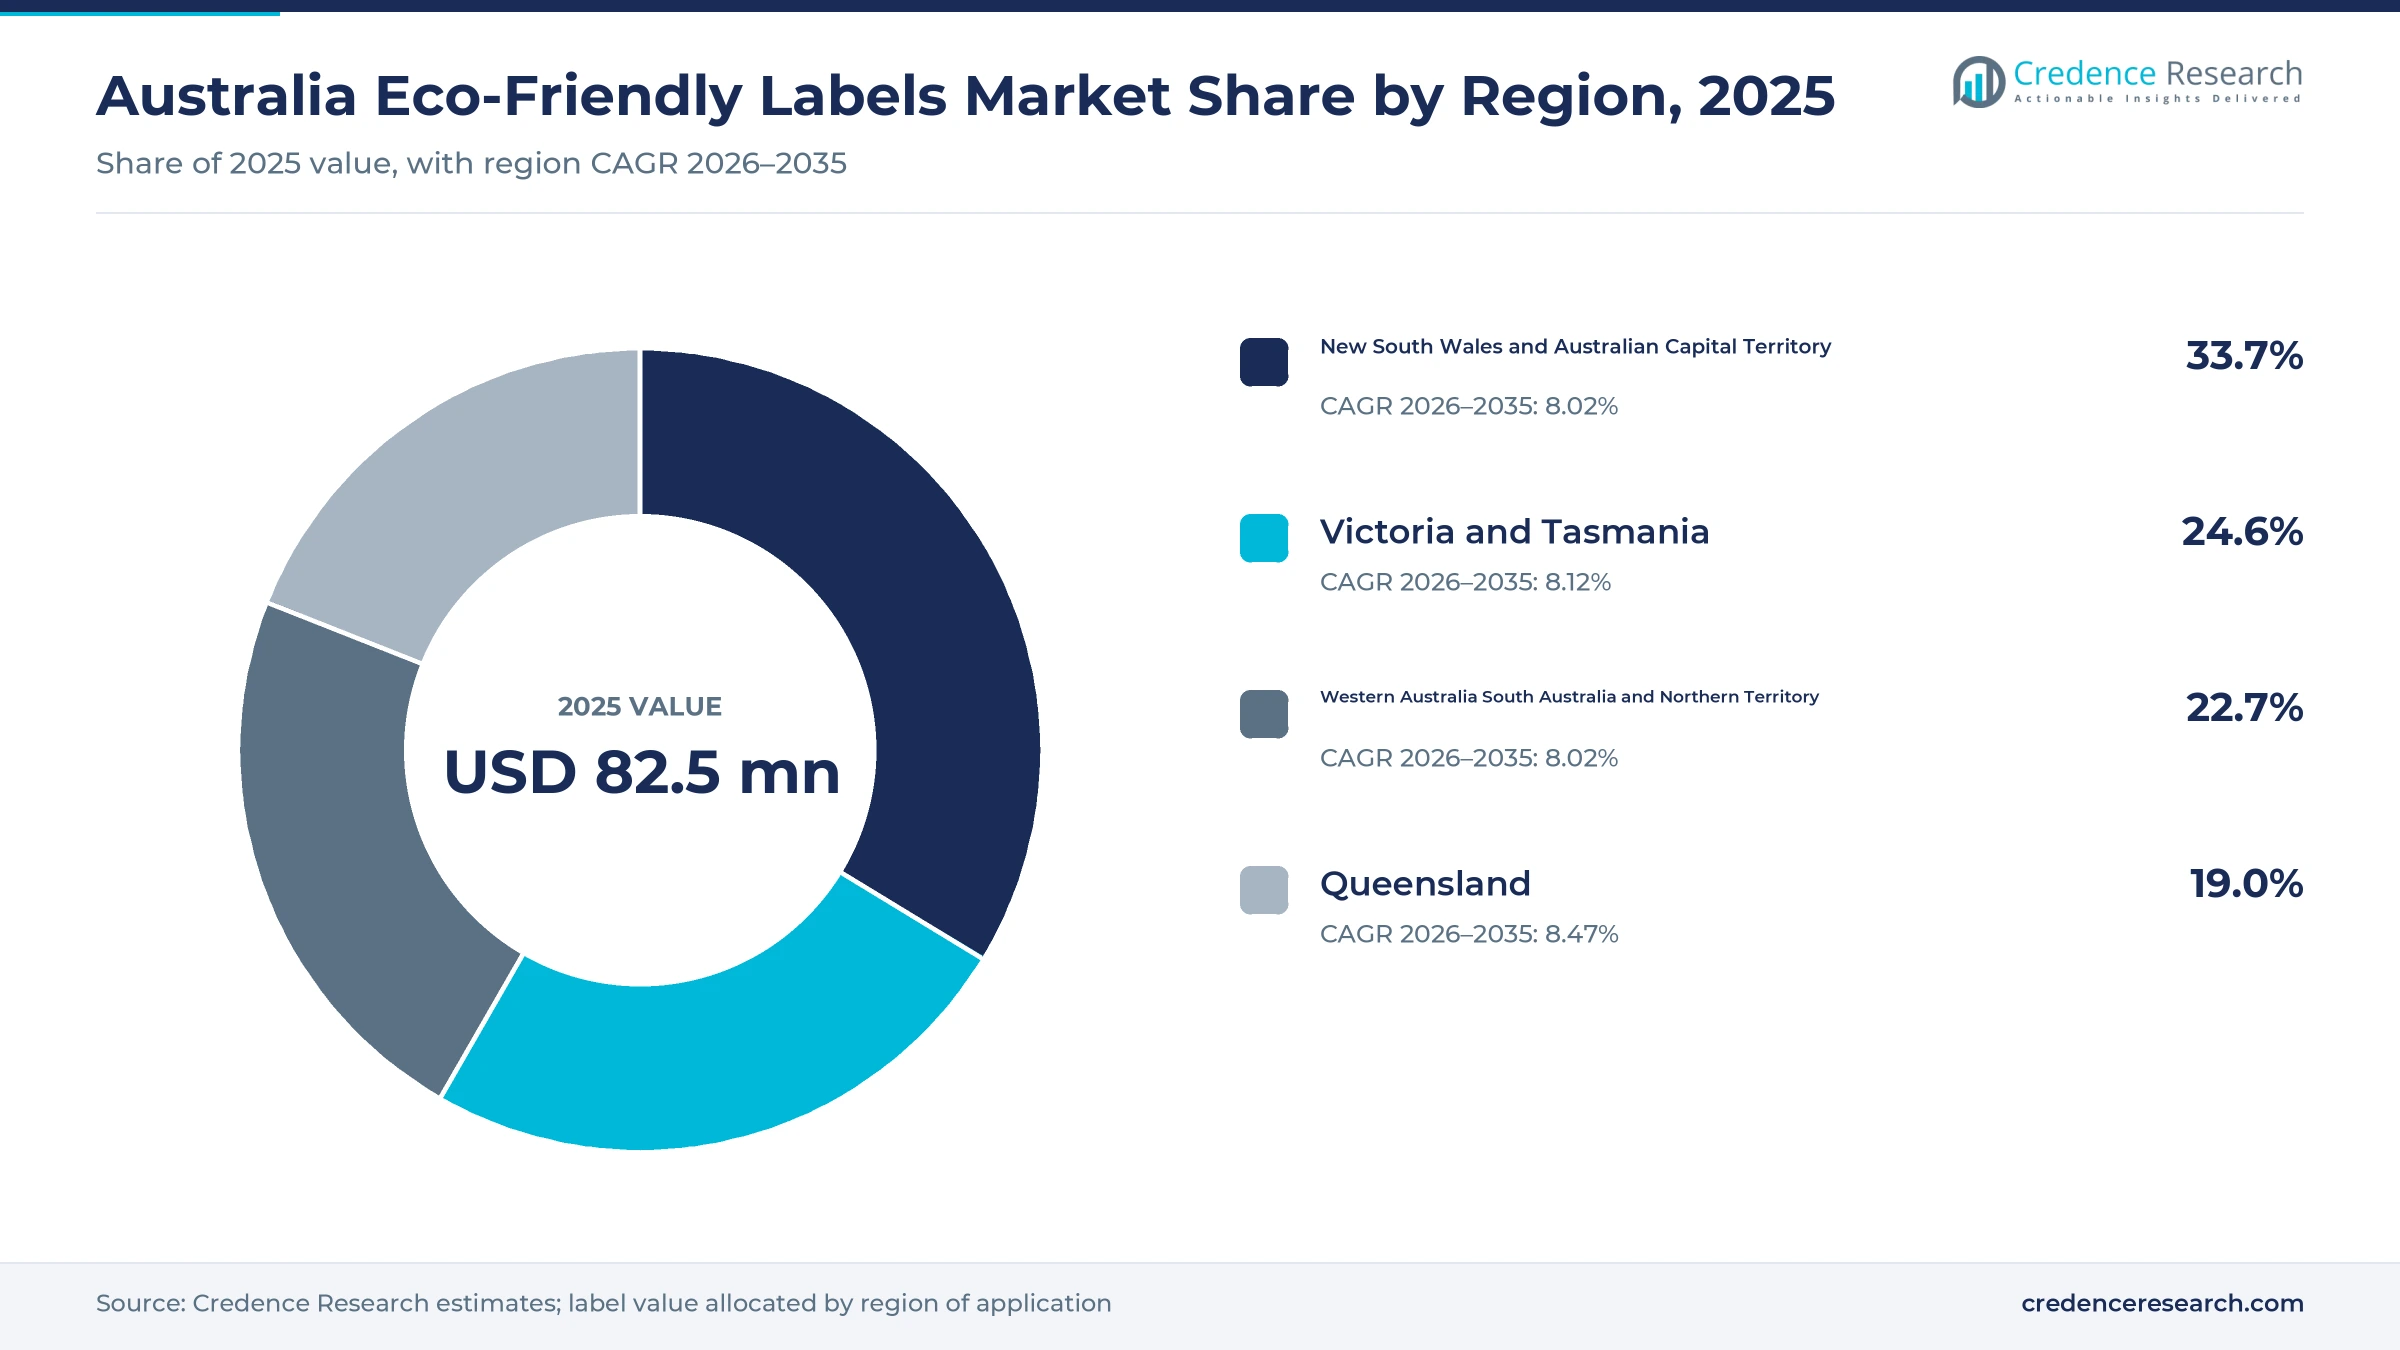
The Australia eco-friendly labels market was valued at USD 82.5 million in 2025 and is projected to increase from USD 95.0 million in 2026 to USD 192.0 million by 2035, registering a CAGR of 8.13% during 2026–2035. Demand comes from food, beverage, health care, personal care and retail brands that switch to paper, recycled film, linerless and low-impact adhesive labels as packaging rules and recycling claims face closer review. New South Wales and the Australian Capital Territory held the largest regional share, 33.7% in 2025, because the zone hosts the most brand owners, contract packers and retail head offices. Queensland is the fastest-growing zone at 8.47% a year, as population growth and local converter investment lift label volumes. The supply base also changed in July 2026, when Wedderburn agreed to sell linerless labeling machines and plans to coat linerless stock in Australia.
Which sustainable label types and buyers does the estimate cover?
The estimate measures the value of labels sold in Australia that use paper or recycled stocks, sustainable films and bioplastics, linerless constructions or low-impact adhesives, for primary and secondary packaging. Values are stated at converter and distributor selling prices that brand owners, contract packers, retailers and logistics operators pay.
The estimate excludes standard labels without a sustainability feature, label printing equipment sold on its own and packaging materials other than labels. The value chain runs from paper, film and adhesive suppliers through local converters and distributors to packing lines, warehouses and retail stores across the country.
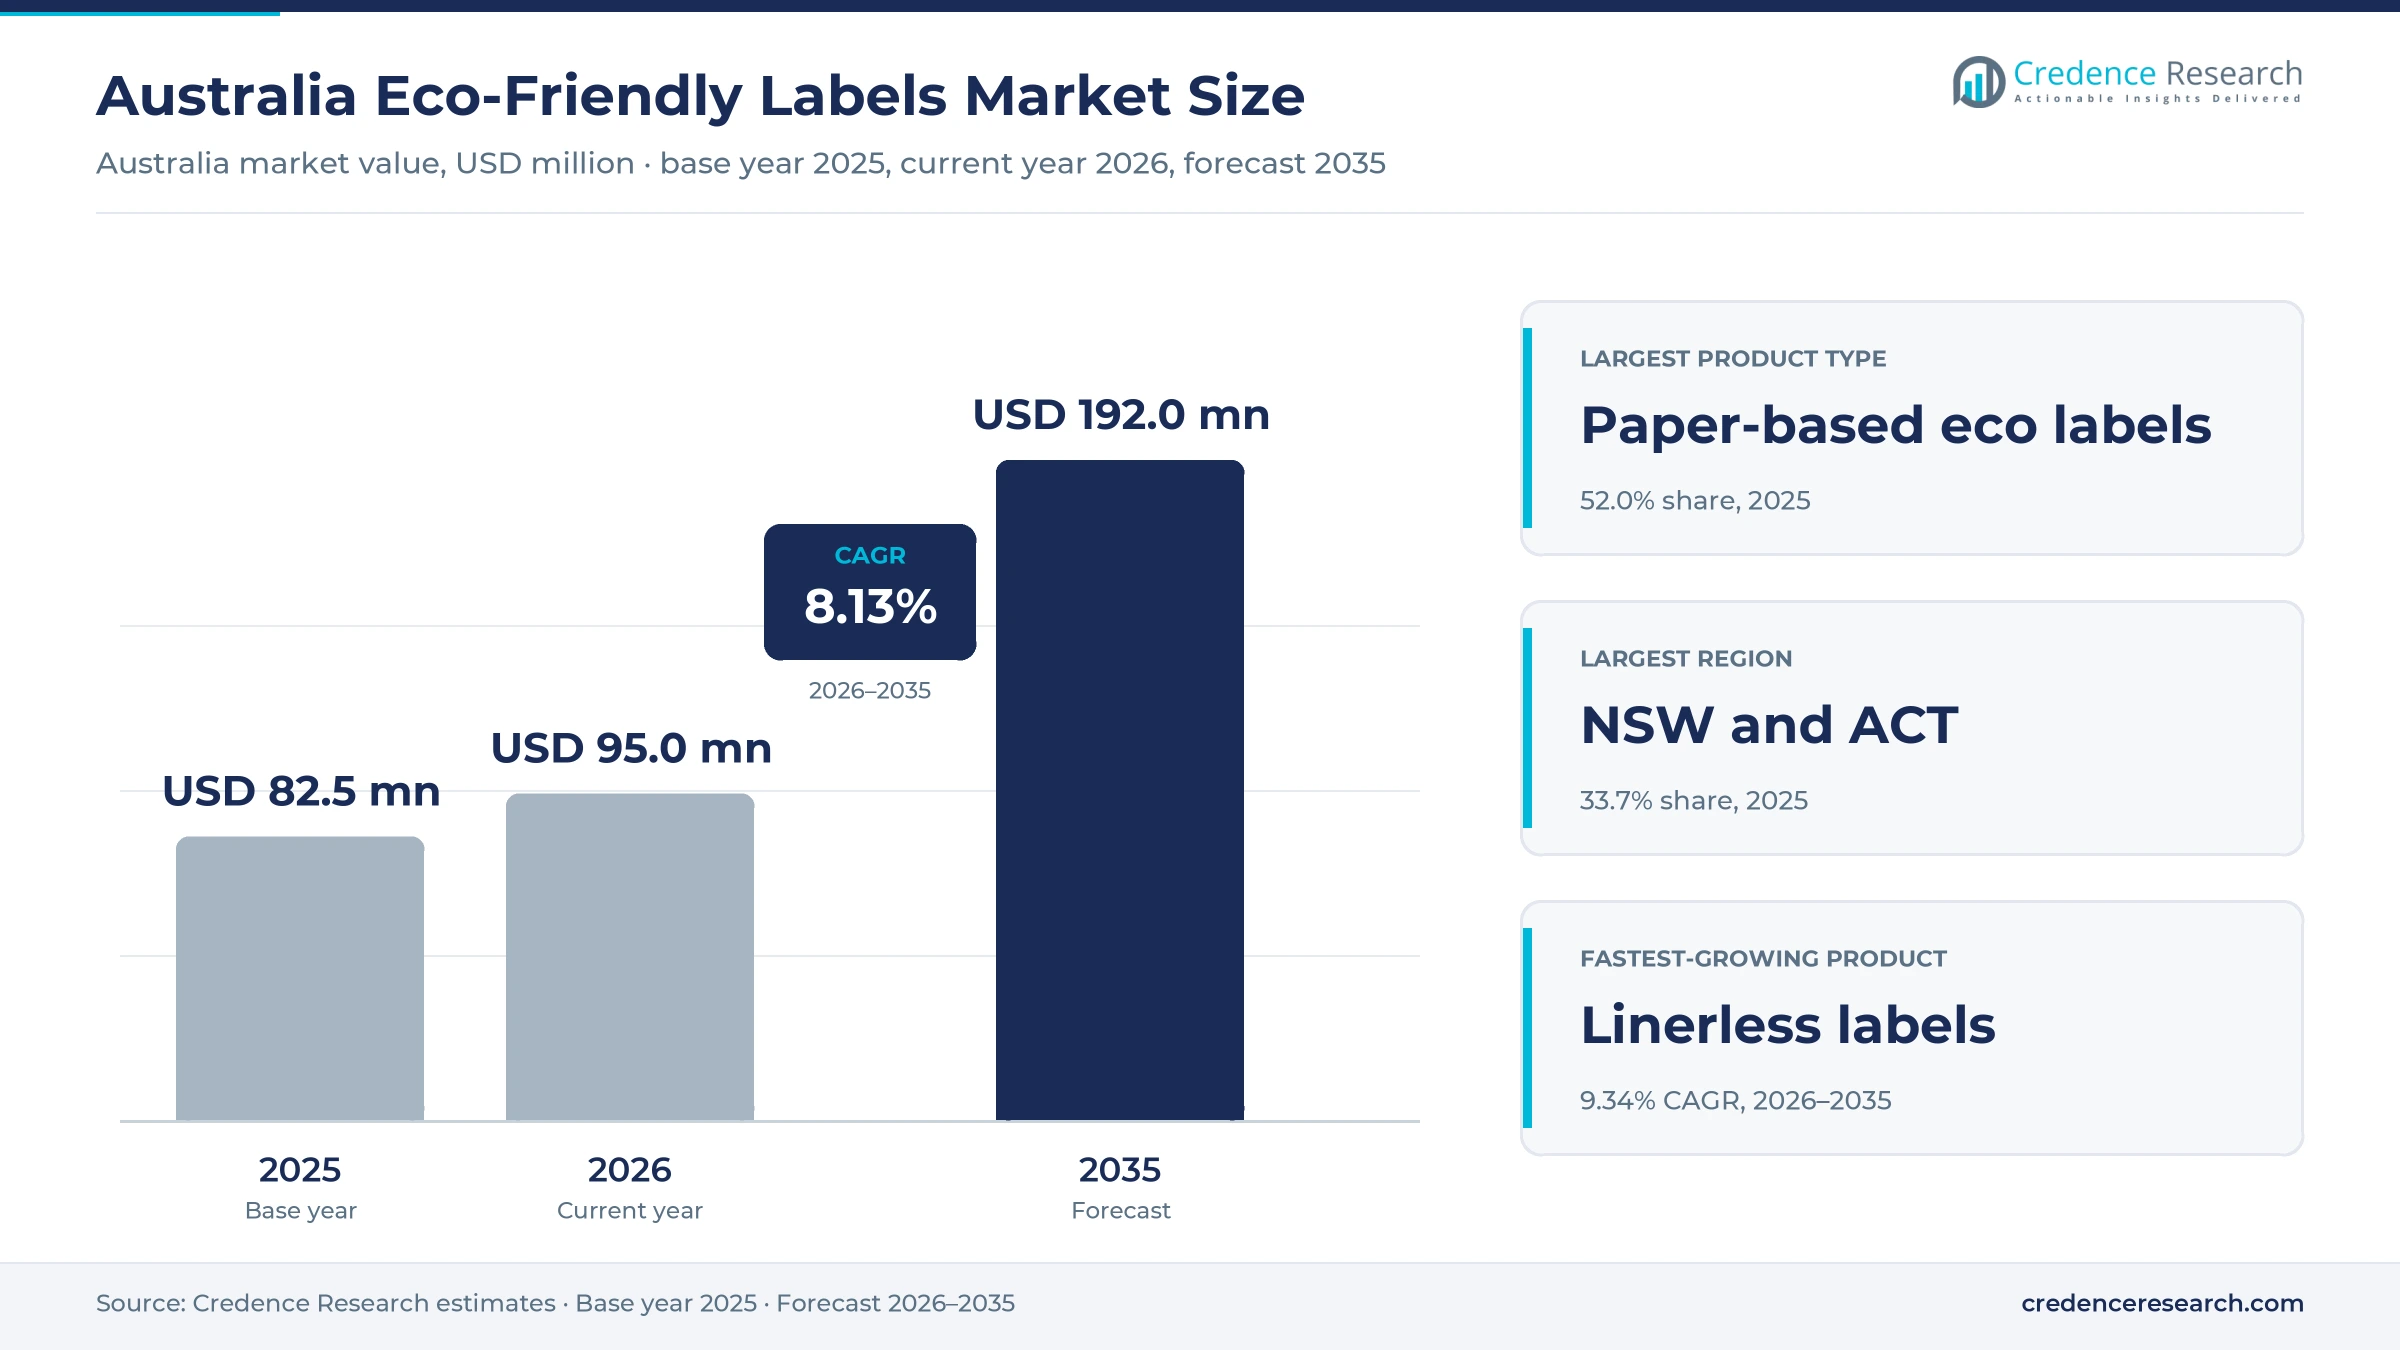
Australia Eco-Friendly Labels Market Insights
- The Australia eco-friendly labels market was valued at USD 82.5 million in 2025 and is projected to reach USD 192.0 million by 2035, registering a CAGR of 8.13% during 2026–2035.
- New South Wales and the Australian Capital Territory held a 33.7% share of 2025 value, because the zone hosts the most brand owners and contract packers.
- Paper-based eco labels led with a 52.0% share of 2025 value, because paper stocks suit most food, beverage and household packs and recycle with fiber streams.
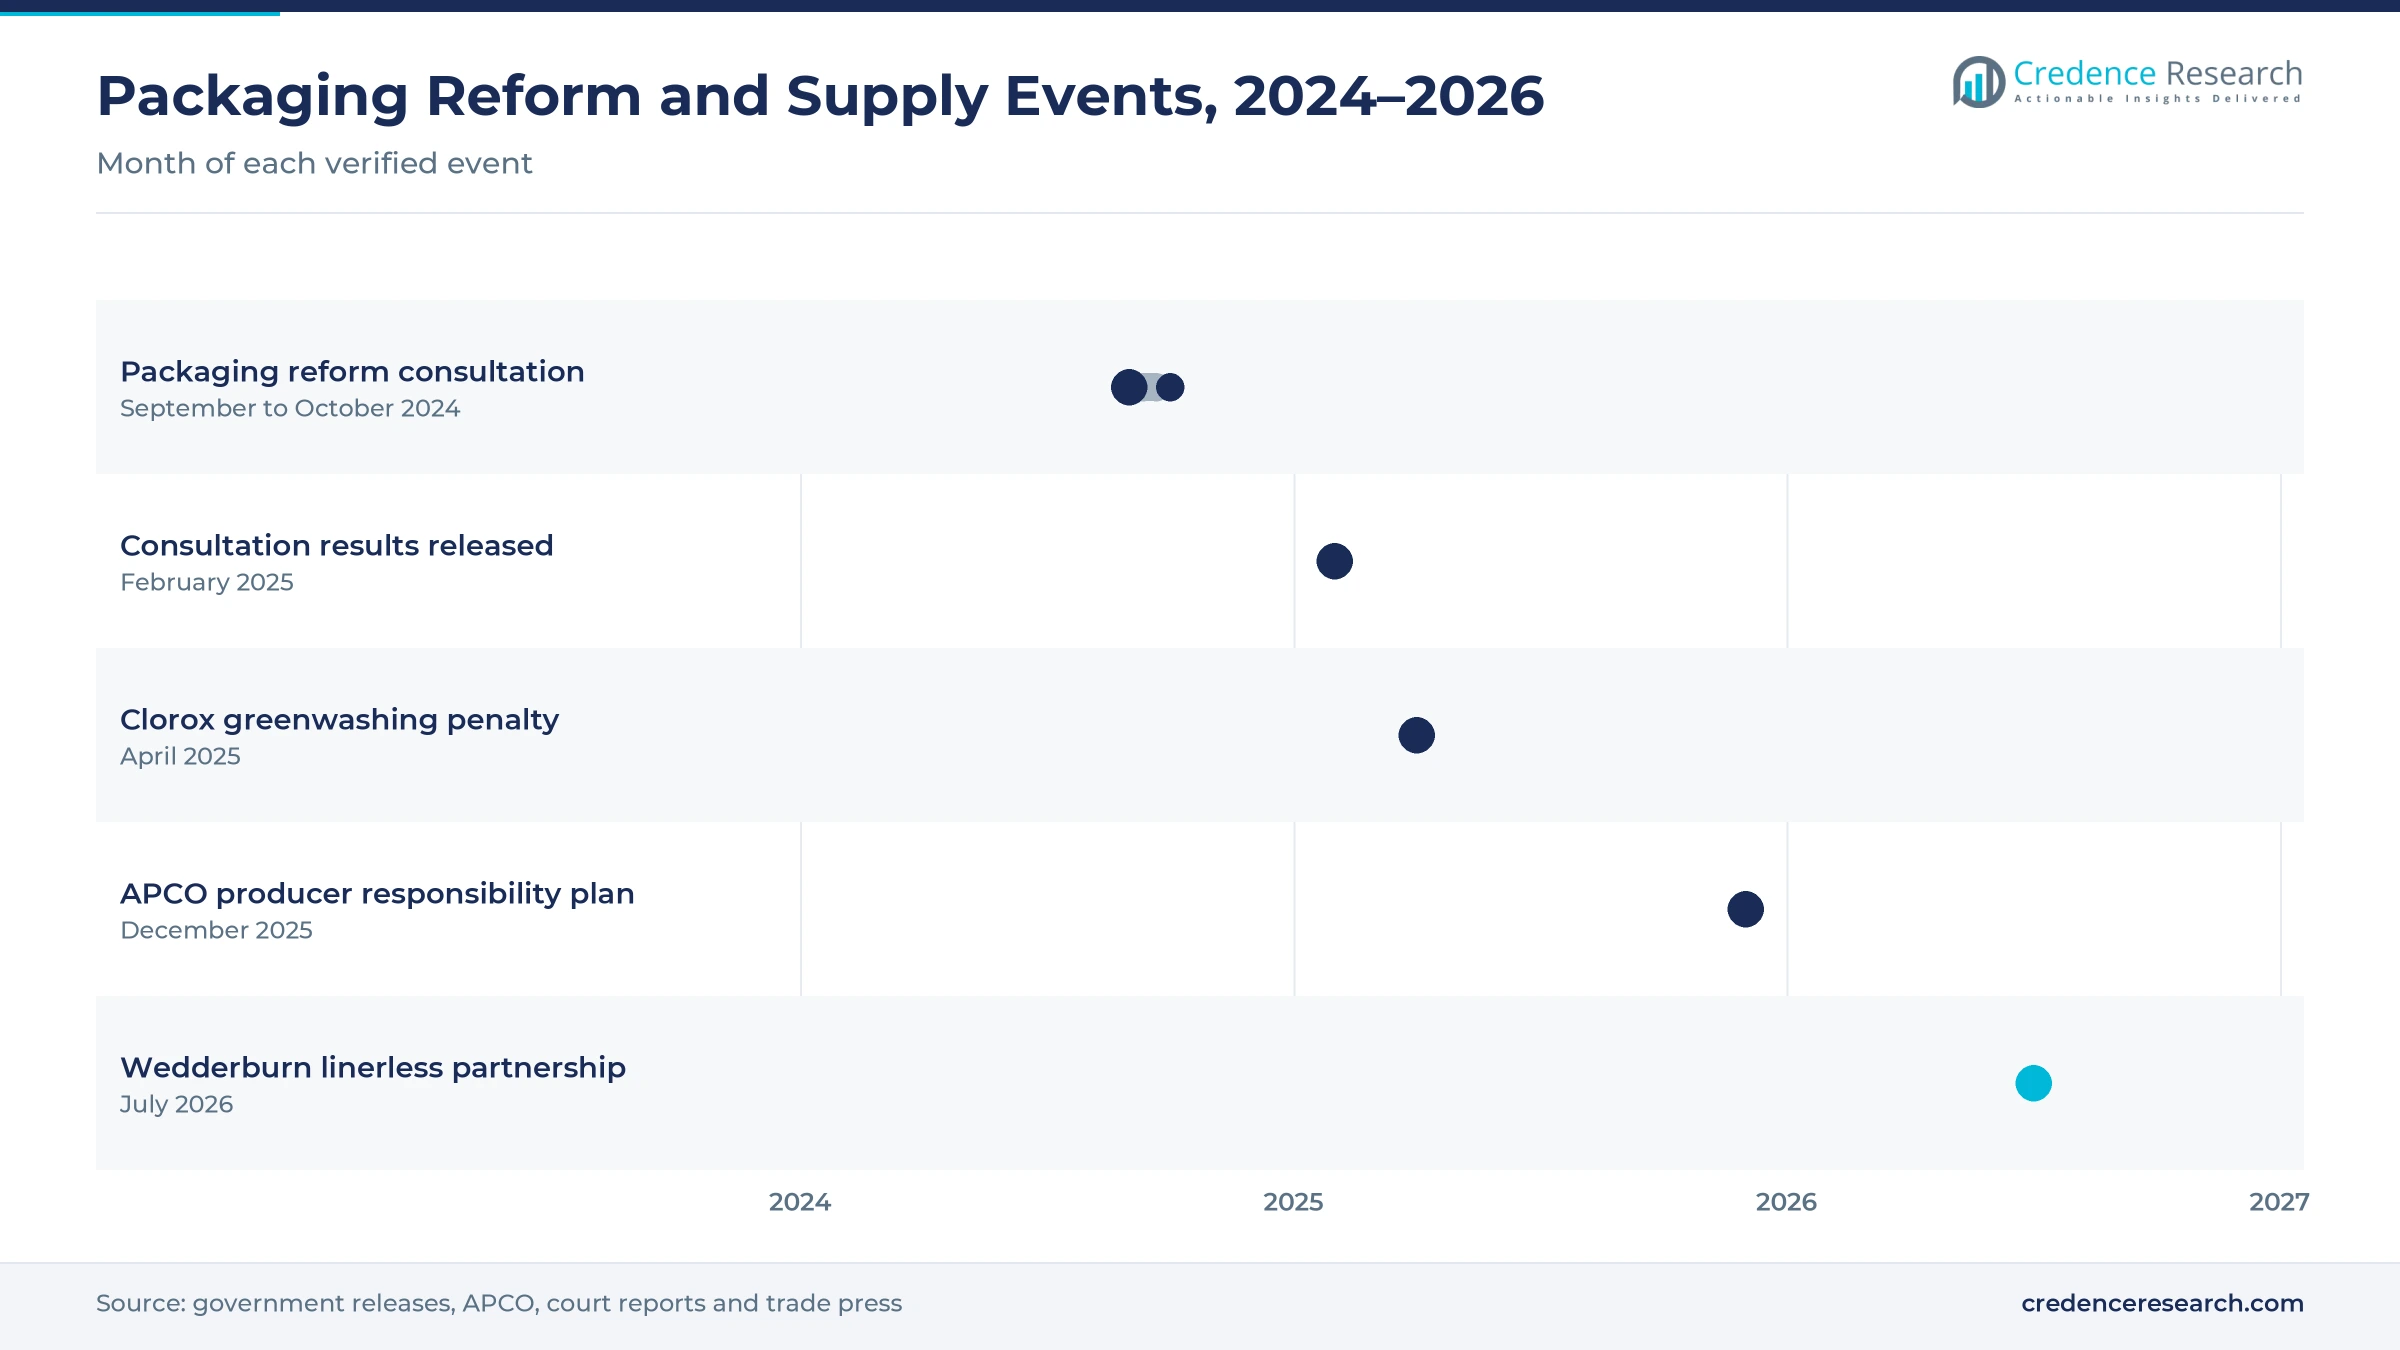
- The federal government opened consultation on packaging regulation reform on Sept. 27, 2024, and received 426 responses, with most favoring a producer responsibility scheme.
- Wedderburn agreed in July 2026 to sell Ravenwood linerless labeling machines and to install a coating system that produces linerless labels in Australia.
Paper stocks lead while linerless formats grow fastest
Why do paper-based labels lead product demand?
Based on product type, the market is categorized into paper-based eco labels, sustainable film and bioplastic labels, linerless and waste-reducing labels, and eco-adhesive and specialist labels. Paper-Based Eco Labels led with a 52.0% share of 2025 value, because paper suits most food and household packs. Linerless and Waste-Reducing Labels grow fastest at 9.34% a year, as packers remove release liner waste.
How does food and beverage packaging dominate use?
Based on end-use industry, the market is categorized into food and beverage packaging, pharmaceutical and health care packaging, personal and household care packaging, and retail logistics and technical packaging. Food and Beverage Packaging led with 50.0% of 2025 value, because grocery brands carry the most recycling labels. Retail Logistics and Technical Packaging grows fastest at 8.59% a year, as warehouses adopt linerless shipping labels.
Why does flexographic printing still lead production?
Based on technology, the market is categorized into flexographic printing, digital printing, thermal printing and offset and hybrid printing. Flexographic Printing led with 55.0% of 2025 value, because long runs for grocery brands remain cheapest on flexo presses. Digital Printing grows fastest at 9.32% a year, as brands order shorter runs with frequent design changes.
How do direct converter contracts reach buyers?
Based on sales channel, the market is categorized into direct converter contracts, specialist label distributors, online custom ordering and equipment-linked supply. Direct Converter Contracts led with 58.0% of 2025 value, because large brands sign supply contracts with converters. Online Custom Ordering grows fastest at 9.31% a year, as small brands order printed labels through web platforms.
| Segment Group | Leading Sub-segment | Share, 2025 | Fastest-growing Sub-segment | CAGR, 2026–2035 |
|---|---|---|---|---|
| By Product Type | Paper-Based Eco Labels | 52.0% | Linerless and Waste-Reducing Labels | 9.34% |
| By End-Use Industry | Food and Beverage Packaging | 50.0% | Retail Logistics and Technical Packaging | 8.59% |
| By Technology | Flexographic Printing | 55.0% | Digital Printing | 9.32% |
| By Sales Channel | Direct Converter Contracts | 58.0% | Online Custom Ordering | 9.31% |
Request a Free Sample
Fill in your details and we'll send you a free sample report.
- Sample data tables & charts
- Research methodology
Design rules, verified materials and short runs lift demand
How do packaging specification upgrades lift label demand?
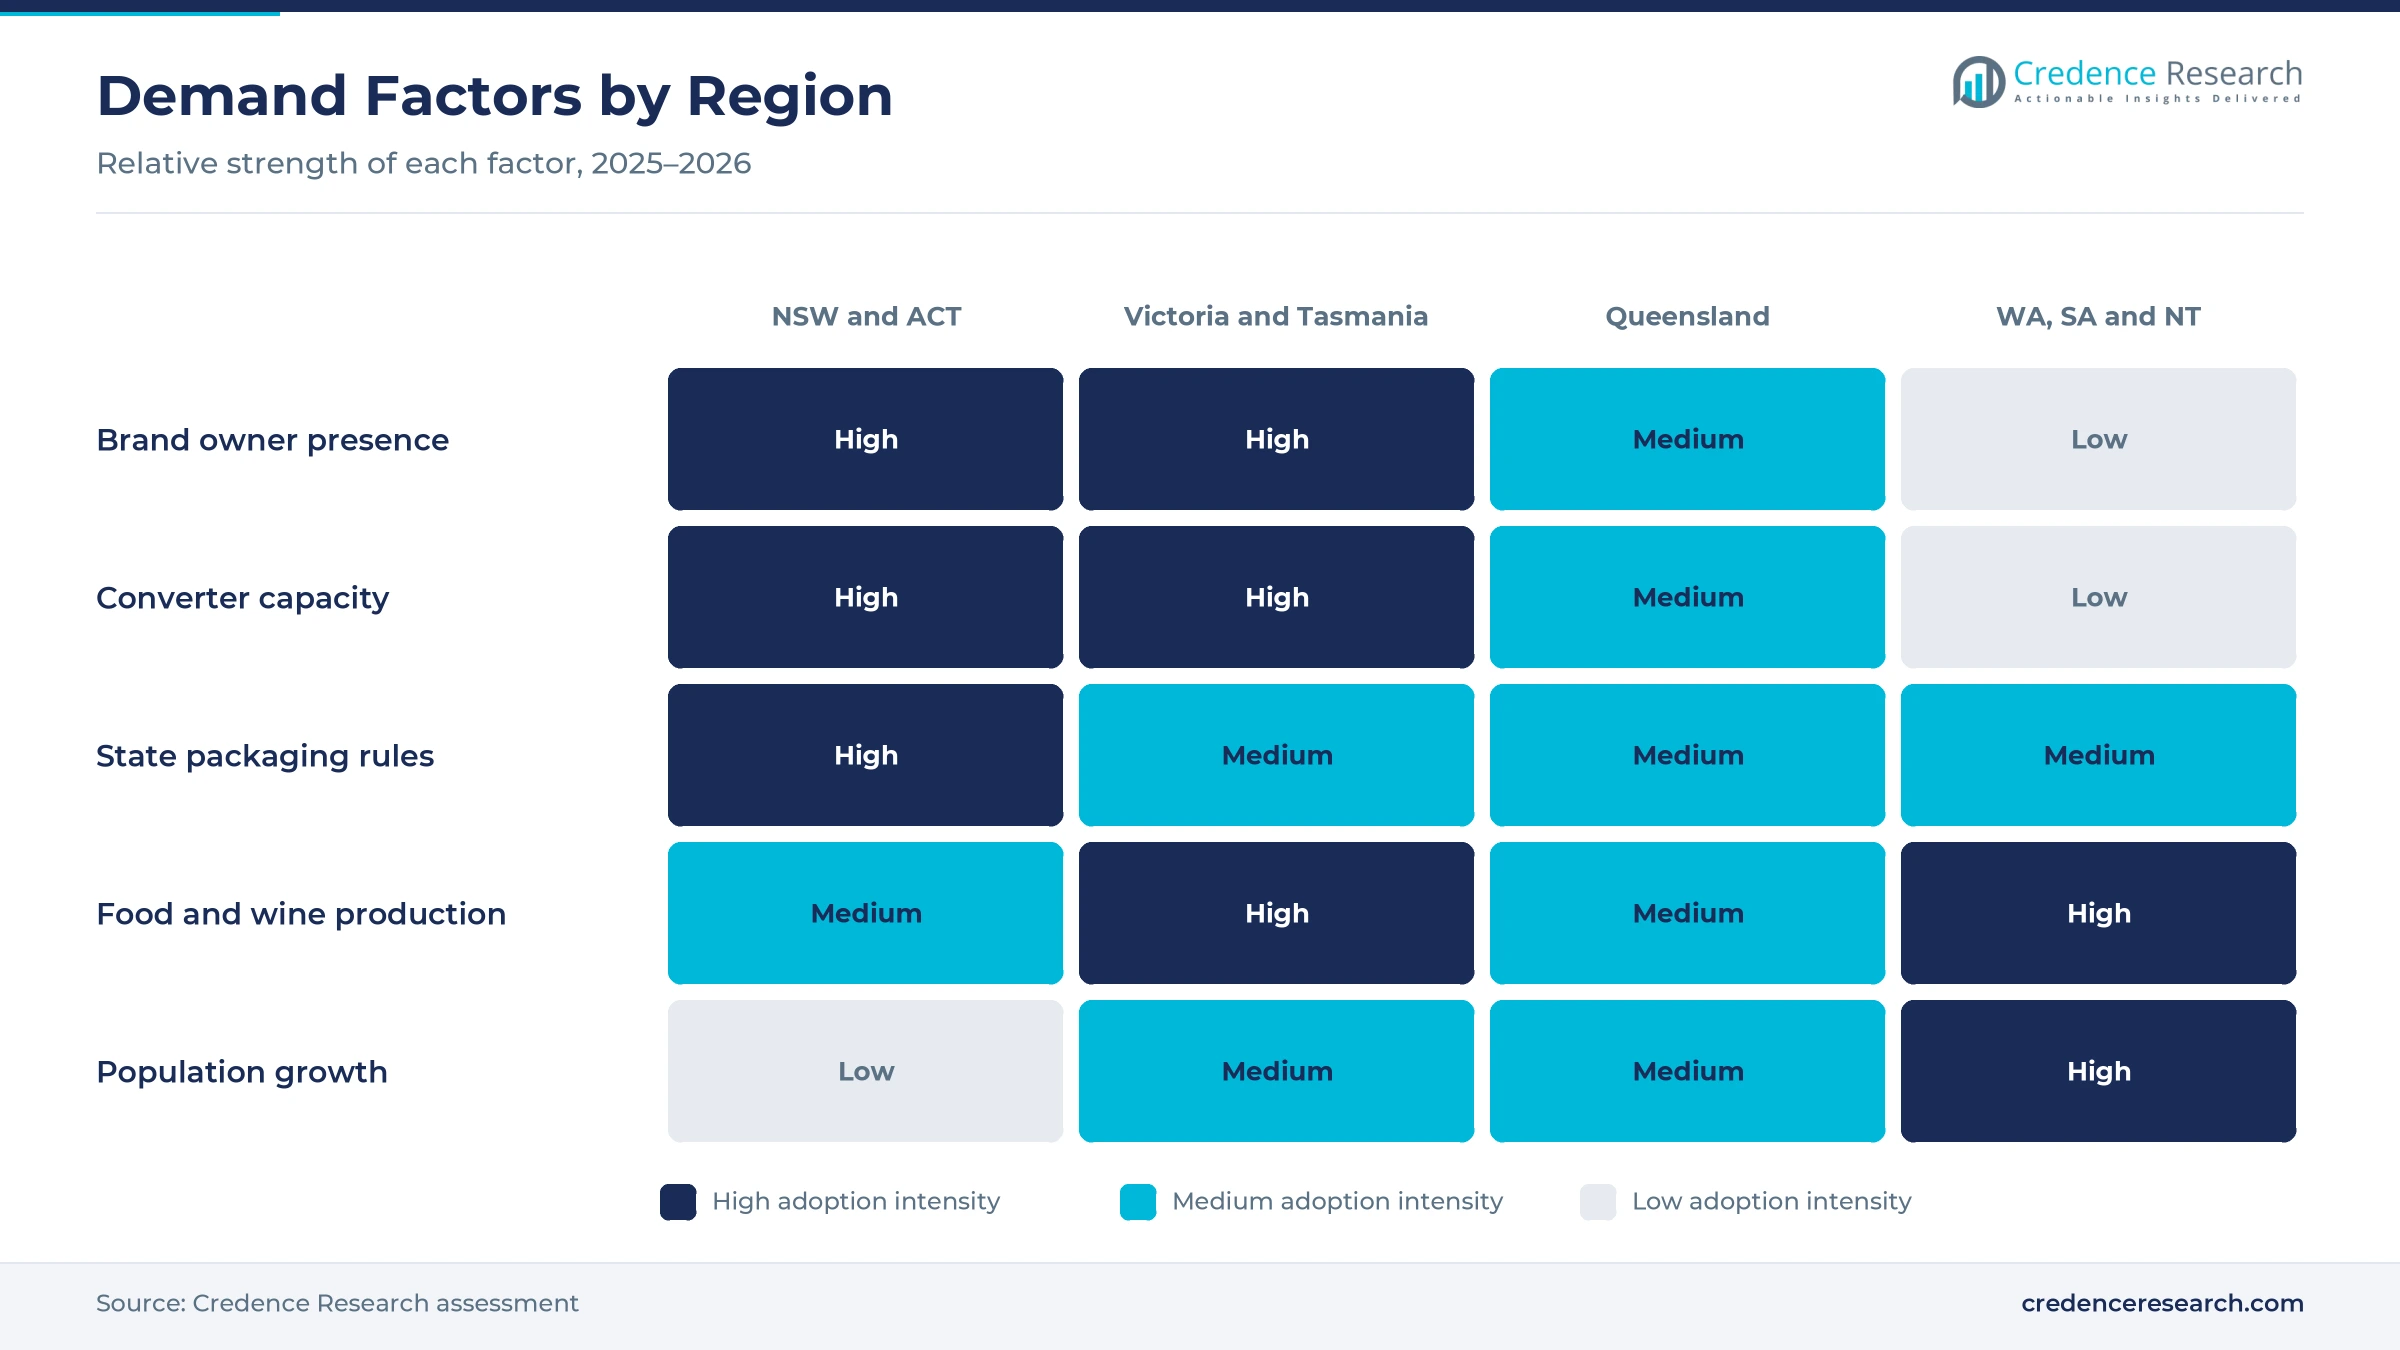
Packaging specification upgrades lift label demand, because brands must redesign packs and their labels to meet tighter recyclability and claim rules. Environment ministers agreed on June 9, 2023, to pursue mandatory packaging design standards and targets. The federal government then opened a consultation on Sept. 27, 2024, that set out three options, including national mandatory requirements and an extended producer responsibility scheme, and it received 426 responses. Proposed measures now include recyclability grading, mandatory design requirements and clearer rules for claims and labeling, according to an APCO statement from December 2025. As a result, food and beverage packaging holds 50.0% of 2025 value, as grocery brands redesign the most packs.
Why does verified material procurement favor certified stocks?
Verified material procurement favors certified label stocks, because brand owners now face penalties when environmental claims on packs cannot be proven. The Federal Court ordered Clorox Australia to pay $8.25 million in 2025 over a "made using 50% ocean plastic" claim on garbage bags, according to HWL Ebsworth. Post-consumer recycled content reached about 40% of total packaging in 2021-22, according to APCO data, which shows how much buyers track input materials. APCO is also reviewing the Australasian Recycling Label and running a national bin audit that may change its rules. In turn, paper-based eco labels hold a 52.0% share of 2025 value, as buyers prefer stocks with clear fiber recycling routes.
How does efficient short-run conversion widen access?
Efficient short-run conversion widens access to eco labels, because small brands can order recycled stocks without large minimum runs. QLM Label Makers spent $2.5 million on three Mark Andy flexo presses for its Brisbane headquarters and added in-line coating and digital finishing to an HP Indigo press in Melbourne. Its qlmflexibles division runs HP Indigo 20000 digital presses for flexible packaging and premium labels. Prime Labels describes itself as an online label manufacturer, which lets buyers upload artwork and order short runs directly. As a result, digital printing grows at 9.32% a year, the fastest technology rate, alongside wider digital printing for packaging adoption.
Why does recycling label adoption raise baseline volumes?
Recycling label adoption raises baseline volumes, because the national recycling symbol now appears across large parts of supermarket ranges. The Australasian Recycling Label launched in Melbourne in September 2018, and an audit found that 23% of supermarket products carried it after two years. Coles put the label on more than 2,200 of its own brand products during that period. Australia also placed about 6.98 million metric tons of packaging on the market in 2021-22, which sets a large base of packs needing compliant labels. Manufacturing value added held at about 5.3% of GDP in 2025, according to World Bank data. In turn, retailer private-label packs keep converters busy with sustainable plastic packaging projects.
Linerless supply and away-from-home rules reshape the market
How is the shift to linerless supply changing label formats?
The shift toward linerless supply is changing label formats, because removing the release liner cuts waste at packing lines and warehouses. Labelmakers agreed in August 2019 to buy Le Mac Australia, then described as the country's largest linerless label producer, which had introduced linerless self-adhesive labels in 2005. Ravenwood Packaging appointed Wedderburn in July 2026 to sell its Nobac linerless labeling machines, according to Packaging Gateway. Wedderburn, founded in 1896, also plans a Com500 coating system so linerless labels can be produced locally. As a result, linerless and waste-reducing labels grow at 9.34% a year, the fastest product rate, as meat, deli and logistics users adopt the format.
Why is the rise of away-from-home rules widening label needs?
The rise of away-from-home packaging rules is widening label needs, because states now regulate packs used outside the household recycling system. The NSW Plastics Plan 2.0 requires tethered caps on beverage containers by 2030 and labeling of away-from-home packaging. The ARL had already reached 23% of supermarket products within two years of its 2018 launch. APCO is exploring new recycling labels for away-from-home and alternate disposal settings in response. The Environment Protection Reform Act 2025 also allows the federal government to focus on packaging regulation reform in 2026, according to APCO, which set a 36-month planning horizon. In turn, New South Wales and the Australian Capital Territory keep the largest share of 2025 value, as brands based in Sydney update packs first.
Can producer responsibility readiness open premium demand?
Producer responsibility readiness opens premium demand, because brands that redesign packs early avoid rushed changes once rules apply. APCO expects industry to operate under a regulated extended producer responsibility framework by fiscal 2028, with a pathway that runs from fiscal 2026. About 84% of packaging had good recycling potential in 2021-22, down from 86%, because collection for flexible household plastics stopped. The plastic recycling rate also stood at only 20% that year, which leaves many film labels on plastic packs without a clear recycling route. As a result, sustainable film and bioplastic labels gain value, as brands seek pressure-sensitive film constructions that suit recycling streams.
Is there room to grow through online custom ordering?
Online custom ordering leaves room to grow, because small food, beverage and cosmetics brands want eco stocks in small quantities with quick turnaround. Prime Labels sells printed labels through an online ordering platform, while QLM added in-line digital finishing for foil, raised varnish, embossing and die-cutting in Melbourne. QLM's three flexo presses share a common width, which lets the company switch jobs between machines and shorten delivery times. QLM also formed its qlmflexibles division in December 2022 to serve digital and FMCG packaging buyers. Victoria added about 109,500 residents in the year to March 2026, which enlarges the base of local food and cosmetics brands. In turn, online custom ordering grows at 9.31% a year, the fastest channel rate, as commercial printing firms add label services.
Cost premiums and uncertain timing slow eco label switching
How do cost premiums slow switching to eco labels?
Cost premiums slow switching to eco labels, because certified paper, recycled film and linerless systems often cost more than standard stocks. Small brands with thin margins feel this most, especially when pack changes also need new artwork and approvals. As a result, some buyers delay changes until regulation forces them. Converters respond by offering standard eco constructions and shorter runs that spread costs across more customers. Over time, wider volumes should narrow the price gap with standard stocks.
Why does uncertain reform timing delay purchases?
Uncertain reform timing delays purchases, because brands do not want to redesign packs twice before final rules apply. APCO said in December 2025 that governments and industry agree on the need for clear rules, but that the timing remains uncertain. In turn, many buyers wait for national design requirements before switching materials. Converters respond by advising clients on recyclability grading and designs likely to remain compliant. APCO itself expects industry to be ready for a regulated framework only by fiscal 2028.
How does greenwashing liability raise compliance costs?
Greenwashing liability raises compliance costs, because every recycled content or recyclability claim on a label must be supported by evidence. The $8.25 million penalty against Clorox in 2025 showed the cost of an unsupported claim. As a result, brand owners now spend more on material testing, supplier certificates and legal review. Converters respond by supplying documented stock specifications and claim guidance with each order. APCO is also reviewing the recycling label rules, which may change the claims that brands can print.
Why do recycling gaps limit film label options?
Recycling gaps limit film label options, because flexible household plastics lost their collection and reprocessing route before 2021-22. That change cut the share of packaging with good recycling potential to 84%. In turn, film labels on plastic packs face doubts about whether the whole pack can be recycled. Suppliers respond with mono-material film constructions and wash-off adhesives that separate during reprocessing. The plastic recycling rate of 20% in 2021-22 shows how much ground remains.
New South Wales leads while Queensland grows fastest
| Region | Value, 2025 (USD million) | Share, 2025 | CAGR, 2026–2035 |
|---|---|---|---|
| New South Wales and Australian Capital Territory | 27.8 | 33.7% | 8.02% |
| Victoria and Tasmania | 20.3 | 24.6% | 8.12% |
| Western Australia South Australia and Northern Territory | 18.7 | 22.7% | 8.02% |
| Queensland | 15.7 | 19.0% | 8.47% |
Why do New South Wales and the ACT hold the largest share?
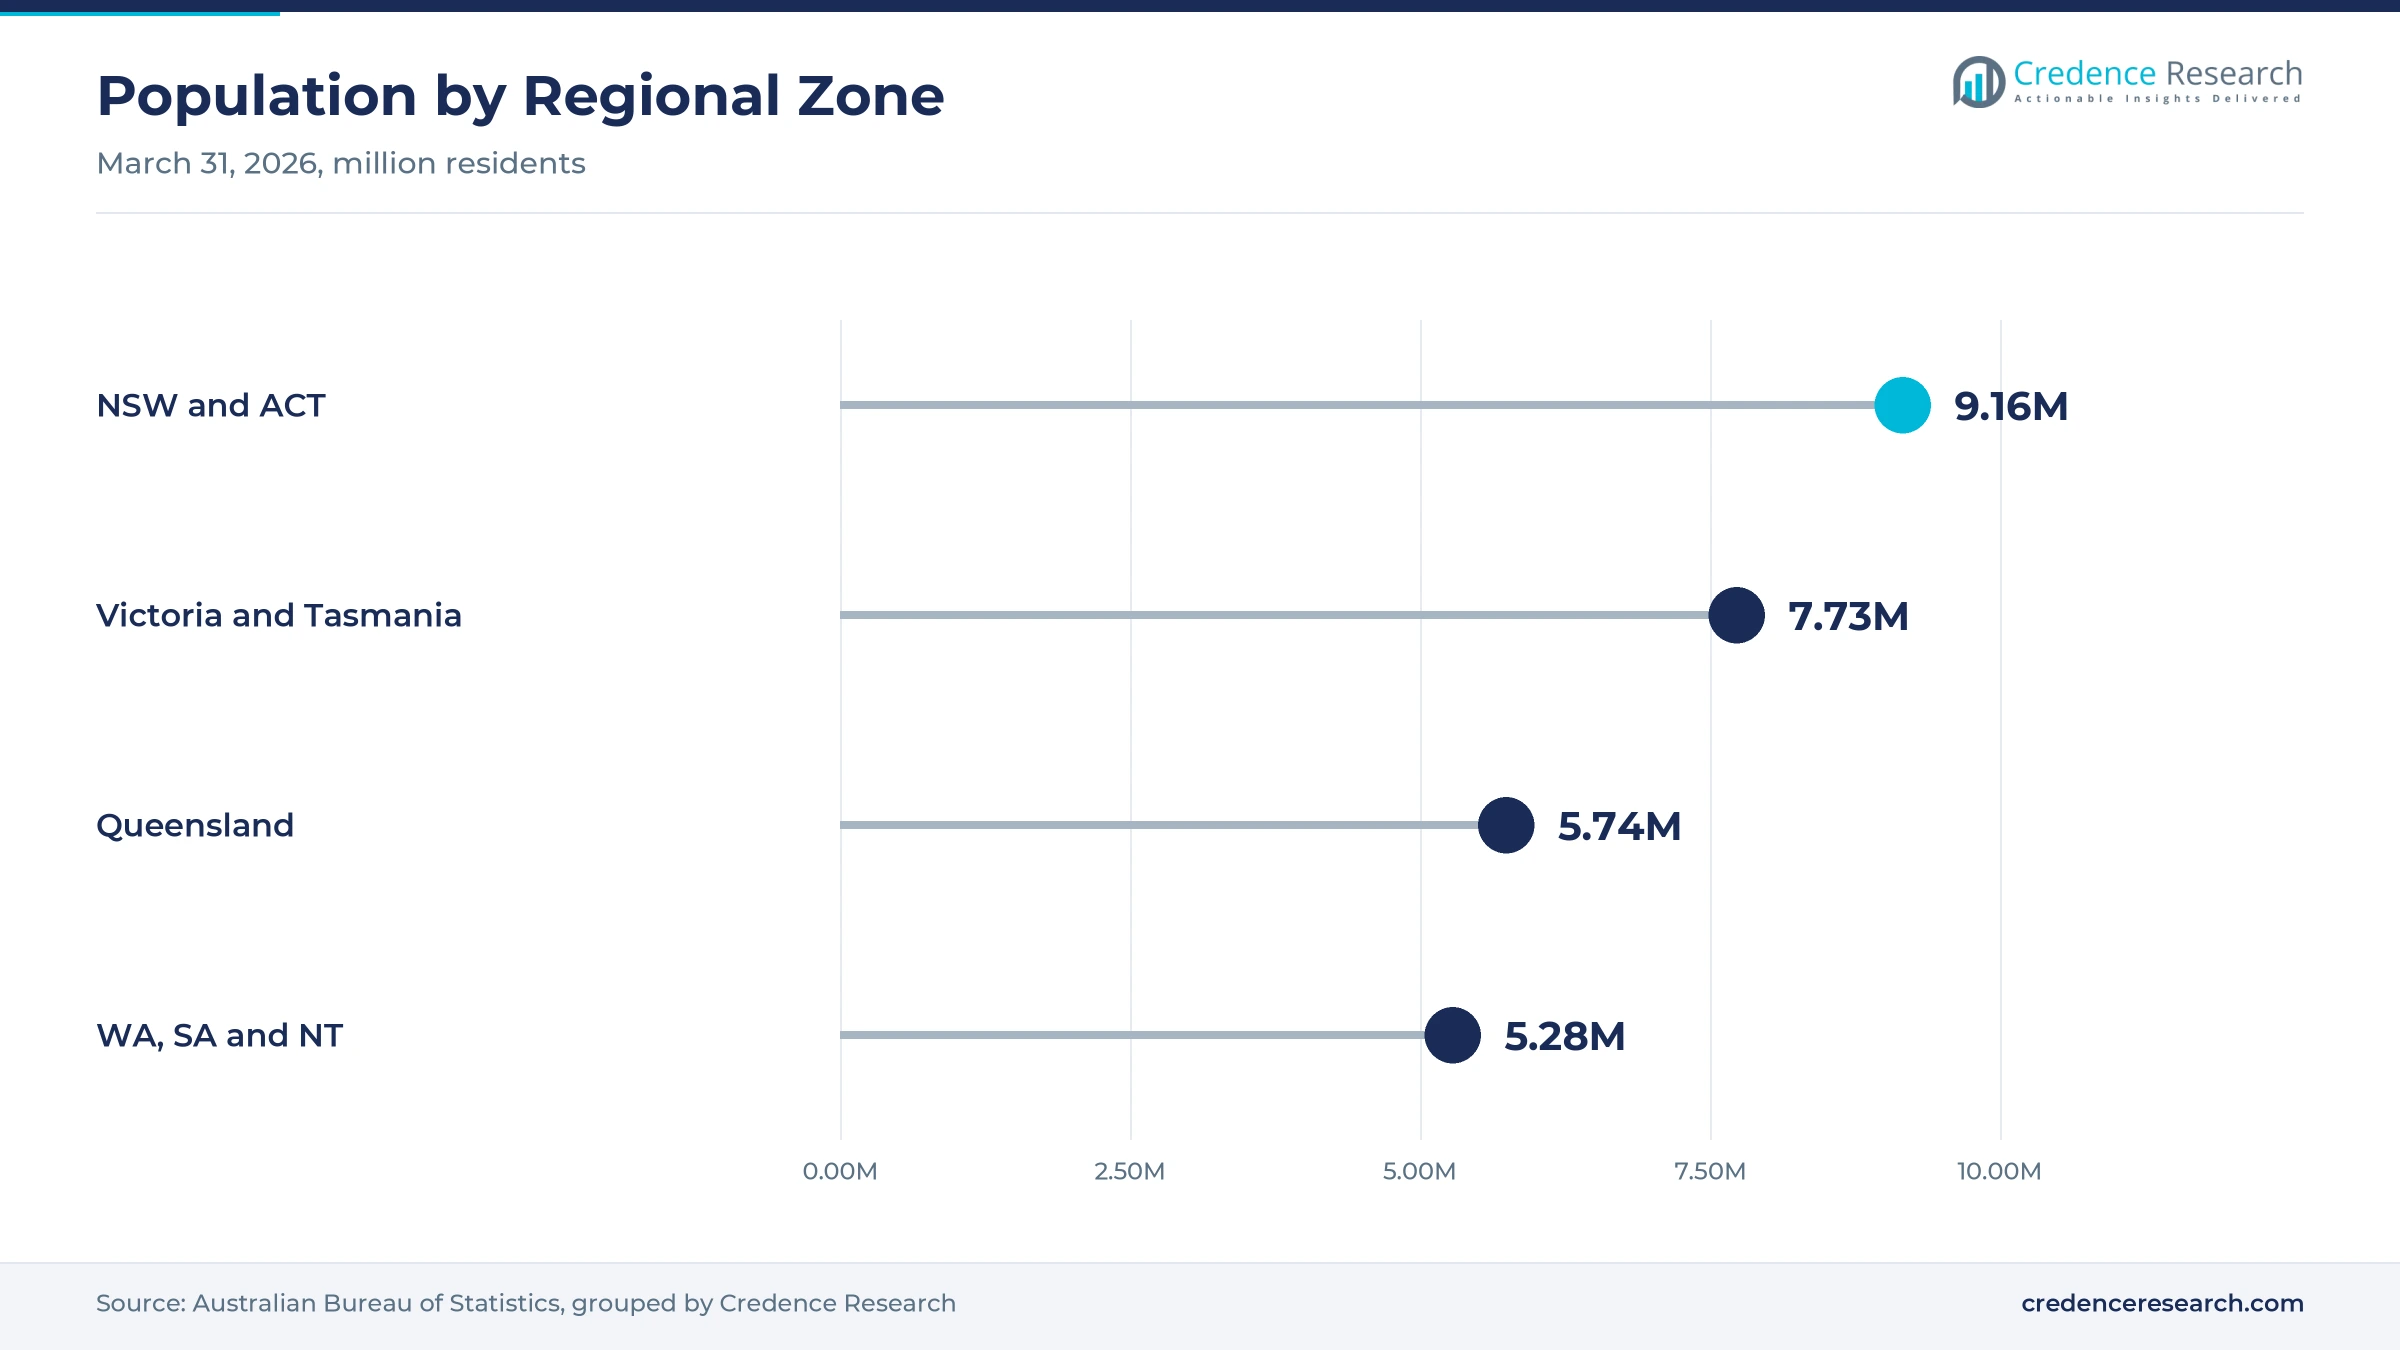
New South Wales and the Australian Capital Territory held 33.7% of 2025 value and grow at 8.02% a year, because the zone hosts many brand owners, contract packers and retail head offices. New South Wales had about 8.67 million residents at March 31, 2026, which supports label demand from grocery brands. The state also leads away-from-home packaging rules through its Plastics Plan 2.0. However, its population grew only 1.1% over the year, slower than most other states.
How do Victoria and Tasmania sustain converter demand?
Victoria and Tasmania held 24.6% of 2025 value and grow at 8.12% a year, because Melbourne hosts food processors, beverage makers and label converters. QLM runs a Melbourne platform with HP Indigo digital presses and in-line finishing. Victoria also added about 109,500 residents in the year to March 2026, the largest increase of any state, which lifts grocery volumes and label demand. As a result, demand for recycled label stocks keeps rising across the zone.
Why is Queensland the fastest-growing zone?
Queensland held 19.0% of 2025 value and grows fastest at 8.47% a year, because population growth and local converter investment raise label volumes. The state had about 5.74 million residents at March 31, 2026, after adding about 90,100 people over the year. QLM installed three new flexo presses at its Brisbane headquarters, which adds local capacity. In turn, Queensland brands can source eco labels without long freight routes.
How do the western and central states add demand?
Western Australia, South Australia and the Northern Territory held 22.7% of 2025 value and grow at 8.02% a year, because wine, food and resource supply chains need durable labels. Western Australia had the fastest population growth at 2.1% in the year to March 2026. South Australia had about 1.92 million residents, and its wine and food makers buy premium labels.
Reform steps and linerless supply marked 2024 to 2026
| Development | Status and market relevance |
|---|---|
| In September 2024, the federal government opened consultation on packaging regulation reform with three options. | Set the path toward mandatory design rules or producer responsibility |
| In February 2025, the government released consultation results showing 426 responses, with most favoring producer responsibility. | Signaled stronger obligations for packaging and labeling |
| In April 2025, the Federal Court ordered Clorox Australia to pay $8.25 million over ocean plastic claims. | Raised the evidence bar for environmental claims on packs |
| In December 2025, APCO released a plan to prepare industry for producer responsibility by fiscal 2028. | Includes a review of the Australasian Recycling Label |
| In July 2026, Ravenwood Packaging appointed Wedderburn to sell Nobac linerless labeling machines in Australia. | Brings local linerless coating and machine supply |
Digital presses and linerless coating shape supply
- Digital label presses print short runs without plates, which lets small brands order recycled stocks in small quantities.
- Linerless coating applies a release coating to the label face, which removes the backing liner and its waste at packing lines.
- Wash-off adhesives separate from containers during reprocessing, which helps glass and plastic packs keep their recycling value.
- In-line finishing adds foil, varnish, embossing and die-cutting in one pass, which reduces waste and setup time on short jobs.
Need a Custom Version of This Report?
Tailor the scope, geography, or segments to your exact requirements.
- Custom geography or segment scope
- Direct access to our analyst team
Converters with digital and linerless capacity compete
Competition centers on converters with digital and linerless capacity and on distributors that reach small brands. MCC expanded in Australia by acquiring the Hexagon label businesses in 2021, and its Herrods in-mold label unit began trading as MCC Verstraete Australia in June 2022. QLM Label Makers runs Brisbane, Melbourne and Sydney sites and invested $2.5 million in three new flexo presses. Labelmakers acquired Le Mac Australia, a linerless pioneer, in 2019. Wedderburn signed a linerless machine and coating partnership with Ravenwood Packaging in July 2026. Prime Labels serves buyers through online ordering, a platform that suits small brands needing short runs of printed labels. Rivals compete on certified stocks, recycling claim support, press flexibility, turnaround times and national delivery. Larger converters also add digital finishing and linerless coating to win brand owners that want fewer suppliers for their full label range.
Companies profiled and their roles in this market
| Company | Type | Role in the market |
|---|---|---|
| MCC Label | Converter | Owns Hexagon businesses and MCC Verstraete Australia |
| QLM Label Makers | Converter | Runs flexo and HP Indigo digital presses in Brisbane and Melbourne |
| Labelmakers | Converter | Acquired linerless producer Le Mac Australia |
| Wedderburn | Equipment and label supplier | Sells Ravenwood linerless machines and plans local coating |
| Prime Labels | Online converter | Sells printed labels through online ordering |
Credence Research view on Australian eco label demand
Credence Research's view is that Australian eco label demand will grow quickly because packaging reform, claim scrutiny and recycling labels push brands to change materials. Paper stocks keep the largest share, while linerless formats and digital printing gain ground. Local linerless coating and new presses improve supply, but reform timing remains uncertain. Linerless labels should grow fastest among product types through 2035, as packers cut liner waste. However, cost premiums and recycling gaps for flexible plastics will slow some switching. Converters with certified stocks, claim support and short-run capacity should gain share fastest.
Packaging data and converter news anchor the label model
The report uses 2025 as the base year on a calendar basis, and market values come from the Credence Research model. That model combines packaging consumption and recovery data, government consultation results, court decisions on environmental claims, population statistics, World Bank manufacturing data and converter announcements. Segment splits and regional growth rates are Credence Research estimates, while regional shares follow the client-defined split. Sources used are public reports, official statistics, trade press, government releases and company releases, and no interviews or surveys were used.
Reform and linerless supply carry eco label demand to 2035
Eco label sales are expected to reach USD 192.0 million by 2035, an 8.13% CAGR during 2026–2035, as packaging reform, claim scrutiny and short-run printing keep demand rising. Growth should hold firm through 2027 as brands prepare for producer responsibility and linerless supply expands. After that, national design rules and recyclability grading will set the pace of change. A long delay in reform would lower this outlook, while earlier mandatory rules would raise it. Linerless and digital formats are expected to gain the most share over the period.
Frequently Asked Questions
How big is the Australia eco-friendly labels market?
Which product type leads eco label demand in Australia?
Which region leads the Australia eco-friendly labels market?
Why does food and beverage packaging lead use?
How is packaging reform affecting label demand?
Which technology grows fastest?
Who are the leading eco label suppliers in Australia?
What are the main challenges for eco label suppliers?
Table of Content
Chapter 1 Market Segmentation
- 1.1 Segmentation Framework
- 1.1.1 Product and Service Classification
- 1.1.2 Application and End-Use Classification
- 1.1.3 Technology and Solution Classification
- 1.1.4 Customer and Distribution Channel Classification
- 1.1.5 Geographic Segmentation
- 1.1.6 Market Segment Definitions and Boundaries
- 1.2 By Product Type
- 1.2.1 Paper-Based Eco Labels
- 1.2.2 Sustainable Film and Bioplastic Labels
- 1.2.3 Linerless and Waste-Reducing Labels
- 1.2.4 Eco-Adhesive and Specialist Labels
- 1.3 By End-Use Industry
- 1.3.1 Food and Beverage Packaging
- 1.3.2 Pharmaceutical and Healthcare Packaging
- 1.3.3 Personal and Household Care Packaging
- 1.3.4 Retail Logistics and Technical Packaging
- 1.4 By Technology
- 1.4.1 Flexographic Printing
- 1.4.2 Digital Printing
- 1.4.3 Thermal Printing
- 1.4.4 Offset and Hybrid Printing
- 1.5 By Sales Channel
- 1.5.1 Direct Converter Contracts
- 1.5.2 Specialist Label Distributors
- 1.5.3 Online Custom Ordering
- 1.5.4 Equipment-Linked Supply
Chapter 2 Introduction
- 2.1 Report Objectives and Scope
- 2.2 Product Definition and Industry Terminology
- 2.3 Market Inclusions and Exclusions
- 2.4 Research Process
- 2.4.1 Primary Research and Expert Interviews
- 2.4.2 Secondary Research and Source Review
- 2.4.3 Top-Down and Bottom-Up Estimation
- 2.4.4 Data Triangulation and Verification
- 2.5 Market Size Measurement Basis
- 2.5.1 2025: USD 82.5 million → 2035: USD 192.0 million
- 2.6 Historical and Forecast Reference Periods
- 2.6.1 Historical Period: 2018-2025
- 2.6.2 Base Year: 2025
- 2.6.3 Forecast Period: 2025-2035
- 2.7 Research Assumptions and Limitations
Chapter 3 Executive Summary
- 3.1 Market Snapshot and Key Findings
- 3.2 Base-Year Market Size, 2025
- 3.3 Forecast Market Size, 2035
- 3.4 Revenue and Volume Growth Outlook
- 3.5 Key Demand and Supply Indicators
- 3.6 Leading Market Segments
- 3.7 Fastest-Growing Market Opportunities
- 3.8 Regional Performance Highlights
- 3.9 Technology and Industry Transformation
- 3.10 Competitive Landscape Summary
- 3.11 Analyst View and Strategic Implications
Chapter 4 Australia Eco-Friendly Labels Market Trends and Developments
- 4.1 Historical Industry Development, 2018-2025
- 4.2 Recent Market Trends and Developments
- 4.3 Demand and Customer Behavior Trends
- 4.4 Technology and Product Innovation
- 4.5 Artificial Intelligence, Automation and Digitalization
- 4.6 Local Manufacturing and Supply Chain Realignment
- 4.7 Industry Partnerships, Mergers and Acquisitions
- 4.8 Sustainability and Circular Economy Developments
- 4.9 Government and Private Sector Investment Trends
- 4.10 Emerging Business Models and Commercialization
- 4.11 Industry Developments and Announcements
Chapter 5 Australia Eco-Friendly Labels Market Production, Supply and Demand Analysis
- 5.1 Demand Trend and Consumption Analysis, 2018-2025
- 5.2 Demand Forecast, 2025-2035
- 5.3 Production and Output Trend, 2018-2025
- 5.4 Production and Output Forecast, 2025-2035
- 5.5 Installed Capacity and Capacity Utilization
- 5.6 Company-Wise Production Plants and Statistics
- 5.6.1 Installed Production Capacity
- 5.6.2 Actual Production
- 5.6.3 Planned Capacity and Expansion Targets
- 5.7 Supply Chain Structure and Procurement Trends
- 5.8 Supply-Demand Gap and Bottlenecks
- 5.9 Import Dependence and Sourcing Structure
- 5.10 Contract Manufacturing and Outsourcing
- 5.11 Regional Supply and Demand Concentration
Chapter 6 Australia Eco-Friendly Labels Market Pricing Analysis
- 6.1 Pricing Structure and Measurement
- 6.2 Historical Pricing Trends, 2018-2025
- 6.3 Pricing Outlook, 2025-2035
- 6.4 Average Selling Price and Unit Economics
- 6.5 Pricing by Product and Market Segment
- 6.6 Geographic Pricing Differences
- 6.7 Key Input, Energy, Labor and Logistics Costs
- 6.8 Contract Pricing and Purchasing Models
- 6.9 Pricing Sensitivity and Competitive Positioning
- 6.10 Price, Margin and Profitability Implications
Chapter 7 Australia Eco-Friendly Labels Market Dynamics
- 7.1 Market Growth Drivers
- 7.1.1 Demand-Side Drivers
- 7.1.2 Technology and Innovation Drivers
- 7.1.3 Infrastructure and Investment Drivers
- 7.1.4 Regulatory and Policy Drivers
- 7.2 Market Restraints
- 7.2.1 Cost and Affordability Constraints
- 7.2.2 Technology and Adoption Barriers
- 7.2.3 Supply Chain and Operational Constraints
- 7.3 Market Challenges
- 7.3.1 Competitive Pressure and Margin Erosion
- 7.3.2 Skills, Infrastructure and Implementation Gaps
- 7.4 Emerging Market Opportunities
- 7.5 Market Dynamics Impact and Time-Horizon Assessment
Chapter 8 Australia Eco-Friendly Labels Value Chain Analysis
- 8.1 Industry Value Chain Overview
- 8.2 Upstream Suppliers and Critical Inputs
- 8.3 Technology and Component Providers
- 8.4 Manufacturing or Service Delivery
- 8.5 Distribution, Channel Partners and Integrators
- 8.6 Downstream Applications and End Users
- 8.7 Value Addition and Profit Pools
- 8.8 Vertical Integration and Outsourcing
- 8.9 Supplier Concentration and Risk
- 8.10 Supply Chain Localization and Resilience
Chapter 9 Australia Eco-Friendly Labels Market Regulations and Policies
- 9.1 Relevant Laws, Standards and Compliance Frameworks
- 9.2 Product, Service, Safety and Quality Requirements
- 9.3 Government Policies, Incentives and Subsidies
- 9.4 Imports, Exports and Trade Barriers
- 9.5 Public Procurement and Local Content Requirements
- 9.6 Environmental and Sustainability Compliance
- 9.7 Upcoming Policy Changes and Market Implications
Chapter 10 Australia Eco-Friendly Labels Market Hotspots and Opportunities
- 10.1 Market Opportunity Mapping and Growth Hotspots
- 10.2 High-Growth Applications and Customer Groups
- 10.3 Underserved Markets and White-Space Opportunities
- 10.4 Emerging Technology and Product Opportunities
- 10.5 New Capacity and Investment Hotspots
- 10.6 Market Entry and Expansion Opportunities
- 10.7 Distribution and Partnership Opportunities
- 10.8 Near-Term and Long-Term Commercial Potential
- 10.9 Opportunity Attractiveness and Execution Risks
Chapter 11 Australia Eco-Friendly Labels Market Outlook, 2025-2035
- 11.1 Market Size and Analysis
- 11.1.1 Revenue (Market Measurement: 2025: USD 82.5 million → 2035: USD 192.0 million)
- 11.1.2 Market Volume and Quantity Sold
- 11.1.3 Historical Market Size, 2018-2025
- 11.1.4 Base-Year Market Size, 2025
- 11.2 Market Forecast, 2025-2035
- 11.2.1 Revenue Forecast to 2035
- 11.2.2 Volume Forecast to 2035
- 11.2.3 CAGR and Year-on-Year Growth
- 11.2.4 Incremental Revenue Opportunity
- 11.3 Forecast Assumptions and Scenario Analysis
- 11.3.1 Base-Case Forecast
- 11.3.2 Optimistic and Conservative Scenarios
- 11.3.3 Technology, Pricing and Policy Sensitivities
- 11.4 Market Attractiveness and Growth Outlook
Chapter 12 Australia Eco-Friendly Labels Market Segmentation and Outlook
- 12.1 Segmentation Summary and Market Shares, 2025
- 12.2 Largest and Fastest-Growing Segments
- 12.3 By Product Type - Market Size and Forecast, 2025-2035
- 12.3.1 Segment Definition and Scope
- 12.3.2 Historical Market Size, 2018-2025
- 12.3.3 Revenue Forecast, 2025-2035
- 12.3.4 Volume Forecast, 2025-2035
- 12.3.5 Base-Year Market Share, 2025
- 12.3.6 Segment CAGR and Growth Drivers
- 12.3.7 Subsegment Market Size and Forecast
- 12.3.7.1 Paper-Based Eco Labels
- 12.3.7.2 Sustainable Film and Bioplastic Labels
- 12.3.7.3 Linerless and Waste-Reducing Labels
- 12.3.7.4 Eco-Adhesive and Specialist Labels
- 12.3.8 Subsegment Pricing and Adoption Trends
- 12.3.9 Leading Suppliers and Competition
- 12.3.10 Regional Demand and Opportunities
- 12.4 By End-Use Industry - Market Size and Forecast, 2025-2035
- 12.4.1 Segment Definition and Scope
- 12.4.2 Historical Market Size, 2018-2025
- 12.4.3 Revenue Forecast, 2025-2035
- 12.4.4 Volume Forecast, 2025-2035
- 12.4.5 Base-Year Market Share, 2025
- 12.4.6 Segment CAGR and Growth Drivers
- 12.4.7 Subsegment Market Size and Forecast
- 12.4.7.1 Food and Beverage Packaging
- 12.4.7.2 Pharmaceutical and Healthcare Packaging
- 12.4.7.3 Personal and Household Care Packaging
- 12.4.7.4 Retail Logistics and Technical Packaging
- 12.4.8 Subsegment Pricing and Adoption Trends
- 12.4.9 Leading Suppliers and Competition
- 12.4.10 Regional Demand and Opportunities
- 12.5 By Technology - Market Size and Forecast, 2025-2035
- 12.5.1 Segment Definition and Scope
- 12.5.2 Historical Market Size, 2018-2025
- 12.5.3 Revenue Forecast, 2025-2035
- 12.5.4 Volume Forecast, 2025-2035
- 12.5.5 Base-Year Market Share, 2025
- 12.5.6 Segment CAGR and Growth Drivers
- 12.5.7 Subsegment Market Size and Forecast
- 12.5.7.1 Flexographic Printing
- 12.5.7.2 Digital Printing
- 12.5.7.3 Thermal Printing
- 12.5.7.4 Offset and Hybrid Printing
- 12.5.8 Subsegment Pricing and Adoption Trends
- 12.5.9 Leading Suppliers and Competition
- 12.5.10 Regional Demand and Opportunities
- 12.6 By Sales Channel - Market Size and Forecast, 2025-2035
- 12.6.1 Segment Definition and Scope
- 12.6.2 Historical Market Size, 2018-2025
- 12.6.3 Revenue Forecast, 2025-2035
- 12.6.4 Volume Forecast, 2025-2035
- 12.6.5 Base-Year Market Share, 2025
- 12.6.6 Segment CAGR and Growth Drivers
- 12.6.7 Subsegment Market Size and Forecast
- 12.6.7.1 Direct Converter Contracts
- 12.6.7.2 Specialist Label Distributors
- 12.6.7.3 Online Custom Ordering
- 12.6.7.4 Equipment-Linked Supply
- 12.6.8 Subsegment Pricing and Adoption Trends
- 12.6.9 Leading Suppliers and Competition
- 12.6.10 Regional Demand and Opportunities
- 12.7 Segment Growth Comparison
- 12.8 Segment Attractiveness and Priority Matrix
Chapter 13 Australia Eco-Friendly Labels End-Use and Application Market Outlook
- 13.1 End-Use Industry and Customer Demand Structure
- 13.2 Leading Applications and Customer Groups
- 13.3 End-Use Market Size, Share and Forecast
- 13.4 Major End-Use Industry Deep Dives
- 13.4.1 Customer Requirements and Use Cases
- 13.4.2 Demand and Replacement Cycles
- 13.4.3 Technical and Regulatory Considerations
- 13.4.4 Purchasing and Procurement Models
- 13.4.5 Leading Vendors and Distribution Channels
- 13.4.6 Forecast and Commercial Opportunities
- 13.5 Emerging Applications and Cross-Segment Demand
- 13.6 End-Use Industry Investment Priorities
Chapter 14 Australia Eco-Friendly Labels Geographic Market Outlook, 2025-2035
- 14.1 Domestic Market Distribution and Demand Clusters
- 14.2 State- or Province-Wise Market Size and Forecast, 2025-2035
- 14.3 City and Metropolitan Market Outlook
- 14.4 Industrial, Manufacturing and Commercial Clusters
- 14.5 Geographic Concentration of Key End Users
- 14.6 Local Pricing and Purchasing Differences
- 14.7 Domestic Production Facilities and Capacity Map
- 14.8 Local Infrastructure and Project Pipeline
- 14.9 State-Level Policy and Incentive Differences
- 14.10 Subnational Investment Hotspots and Opportunities
- 14.11 Distribution and Logistics Networks
- 14.12 Domestic Competitive Footprint
Chapter 15 Australia Eco-Friendly Labels Technology, Innovation and Sustainability Outlook
- 15.1 Technology Landscape and Maturity
- 15.2 Product, Process and Service Innovation
- 15.3 AI, Automation and Digital Tools in the Industry
- 15.4 Technology Adoption and Performance Benchmarking
- 15.5 Innovation Pipeline and R&D Investment
- 15.6 Patent and Intellectual Property Trends
- 15.7 Energy Efficiency and Resource Management
- 15.8 Sustainability, Recycling and Circularity
- 15.9 Technology Roadmap, 2025-2035
- 15.10 Risks of Obsolescence and Technology Substitution
Chapter 16 Australia Eco-Friendly Labels Market Key Strategic Imperatives
- 16.1 Growth and Market Entry Priorities
- 16.2 High-Return Products and Segments
- 16.3 Pricing, Profitability and Cost Optimization
- 16.4 Technology Investment and Product Differentiation
- 16.5 Supply Chain Localization and Resilience
- 16.6 Distribution and Customer Acquisition
- 16.7 Partnership, Acquisition and Capacity Strategy
- 16.8 Regional Expansion Priorities
- 16.9 Short-, Medium- and Long-Term Actions
Chapter 17 Competition Outlook
- 17.1 Industry Competition Characteristics
- 17.2 Market Structure and Concentration
- 17.3 Market Share and Competitive Positioning, 2025
- 17.4 Company-Wise Revenue and Product Benchmarking
- 17.5 Production and Service Capacity Benchmarking
- 17.6 Technology, Pricing and Differentiation
- 17.7 Regional Footprint and Distribution Strength
- 17.8 Mergers, Acquisitions and Strategic Alliances
- 17.9 New Entrants and Competitive Threats
- 17.10 Porter's Five Forces and Industry Attractiveness
- 17.11 Competitive Outlook, 2025-2035
Chapter 18 Company Profiles
- 18.1 Company Coverage and Selection Criteria
- 18.2 MCC Label
- 18.2.1 Business Description
- 18.2.2 Company Ownership and Geographic Presence
- 18.2.3 Product and Service Portfolio
- 18.2.4 Manufacturing and Operating Footprint
- 18.2.5 Production Capacity and Expansion Plans
- 18.2.6 Financial Performance and Investment
- 18.2.7 Market Share and Competitive Position
- 18.2.8 Technology and Innovation Capabilities
- 18.2.9 Strategic Alliances or Partnerships
- 18.2.10 Recent Developments
- 18.2.11 Growth Strategy and Outlook
- 18.3 CCL Label Australia
- 18.4 QLM Label Makers
- 18.5 Ultra Labels
- 18.6 Labelmakers
- 18.7 Labelhouse
- 18.8 insignia
- 18.9 Prime Labels
- 18.10 Guru Labels
- 18.11 Wedderburn
- 18.12 Other Relevant Market Participants
Note: Every listed company is profiled on the structure shown under the first company. The company list is preliminary and may change based on research findings, market developments, data availability and client requirements.
Chapter 19 Disclaimer
- 19.1 Research and Forecast Disclaimer
- 19.2 Data Source and Estimation Limitations
Note: The depth of individual sections depends on data availability for this market. Volume, capacity, trade and other unit-based metrics are included where applicable.

