
Skincare brands and importers shape Australian glass demand
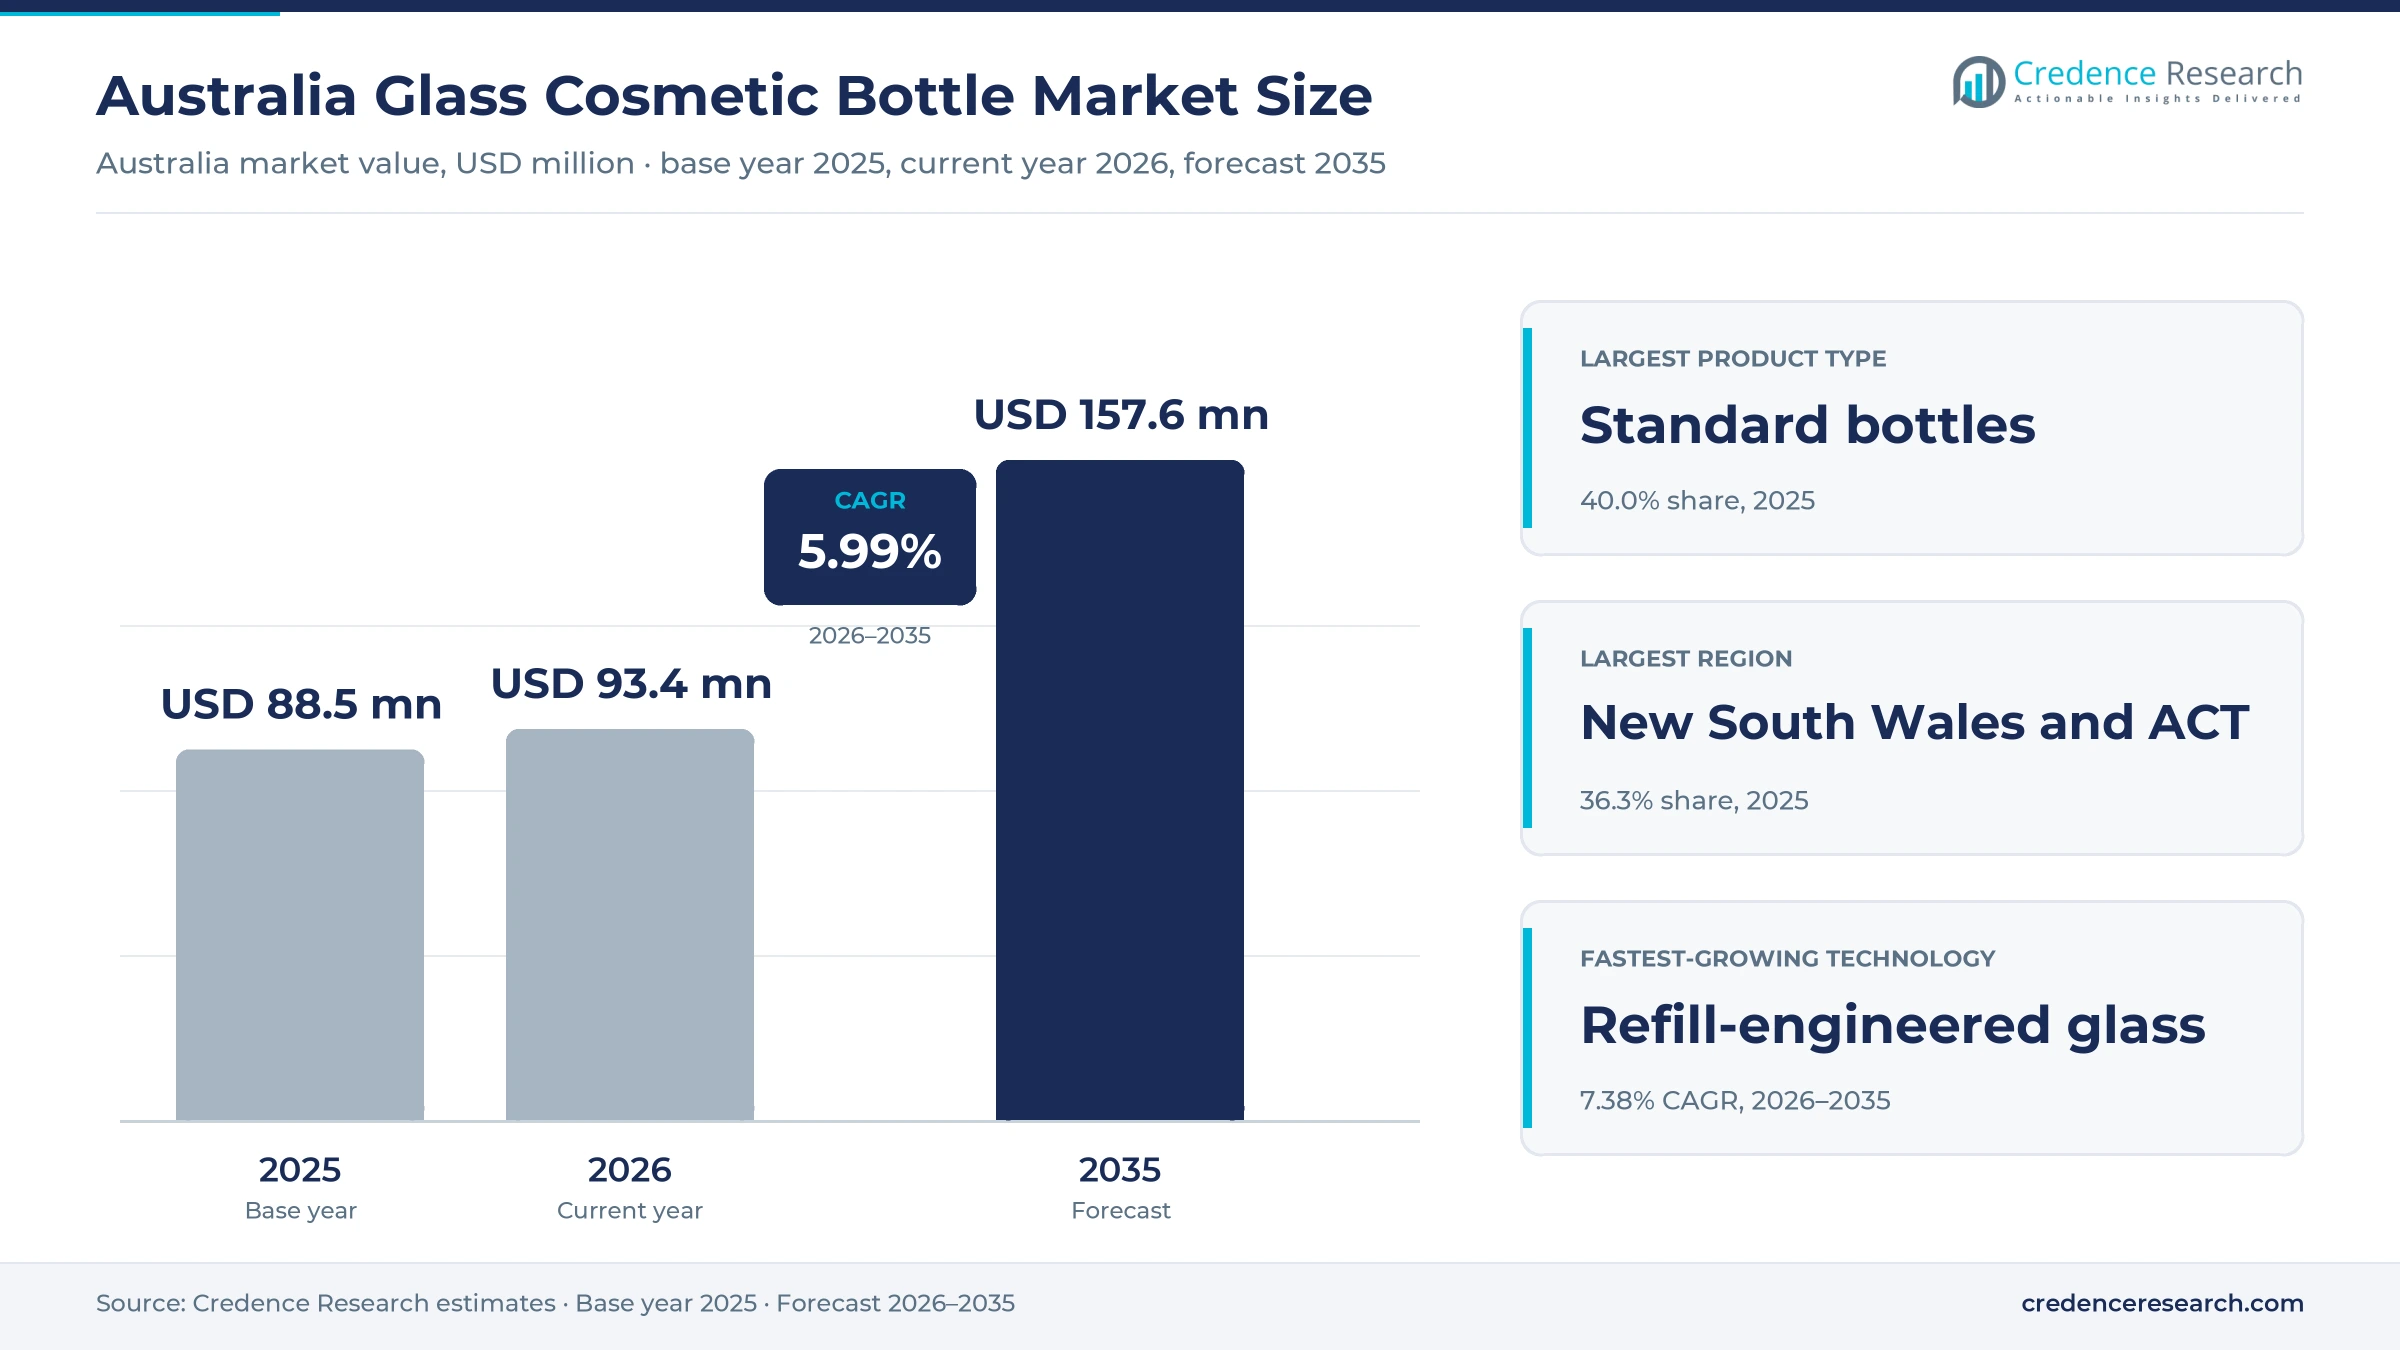
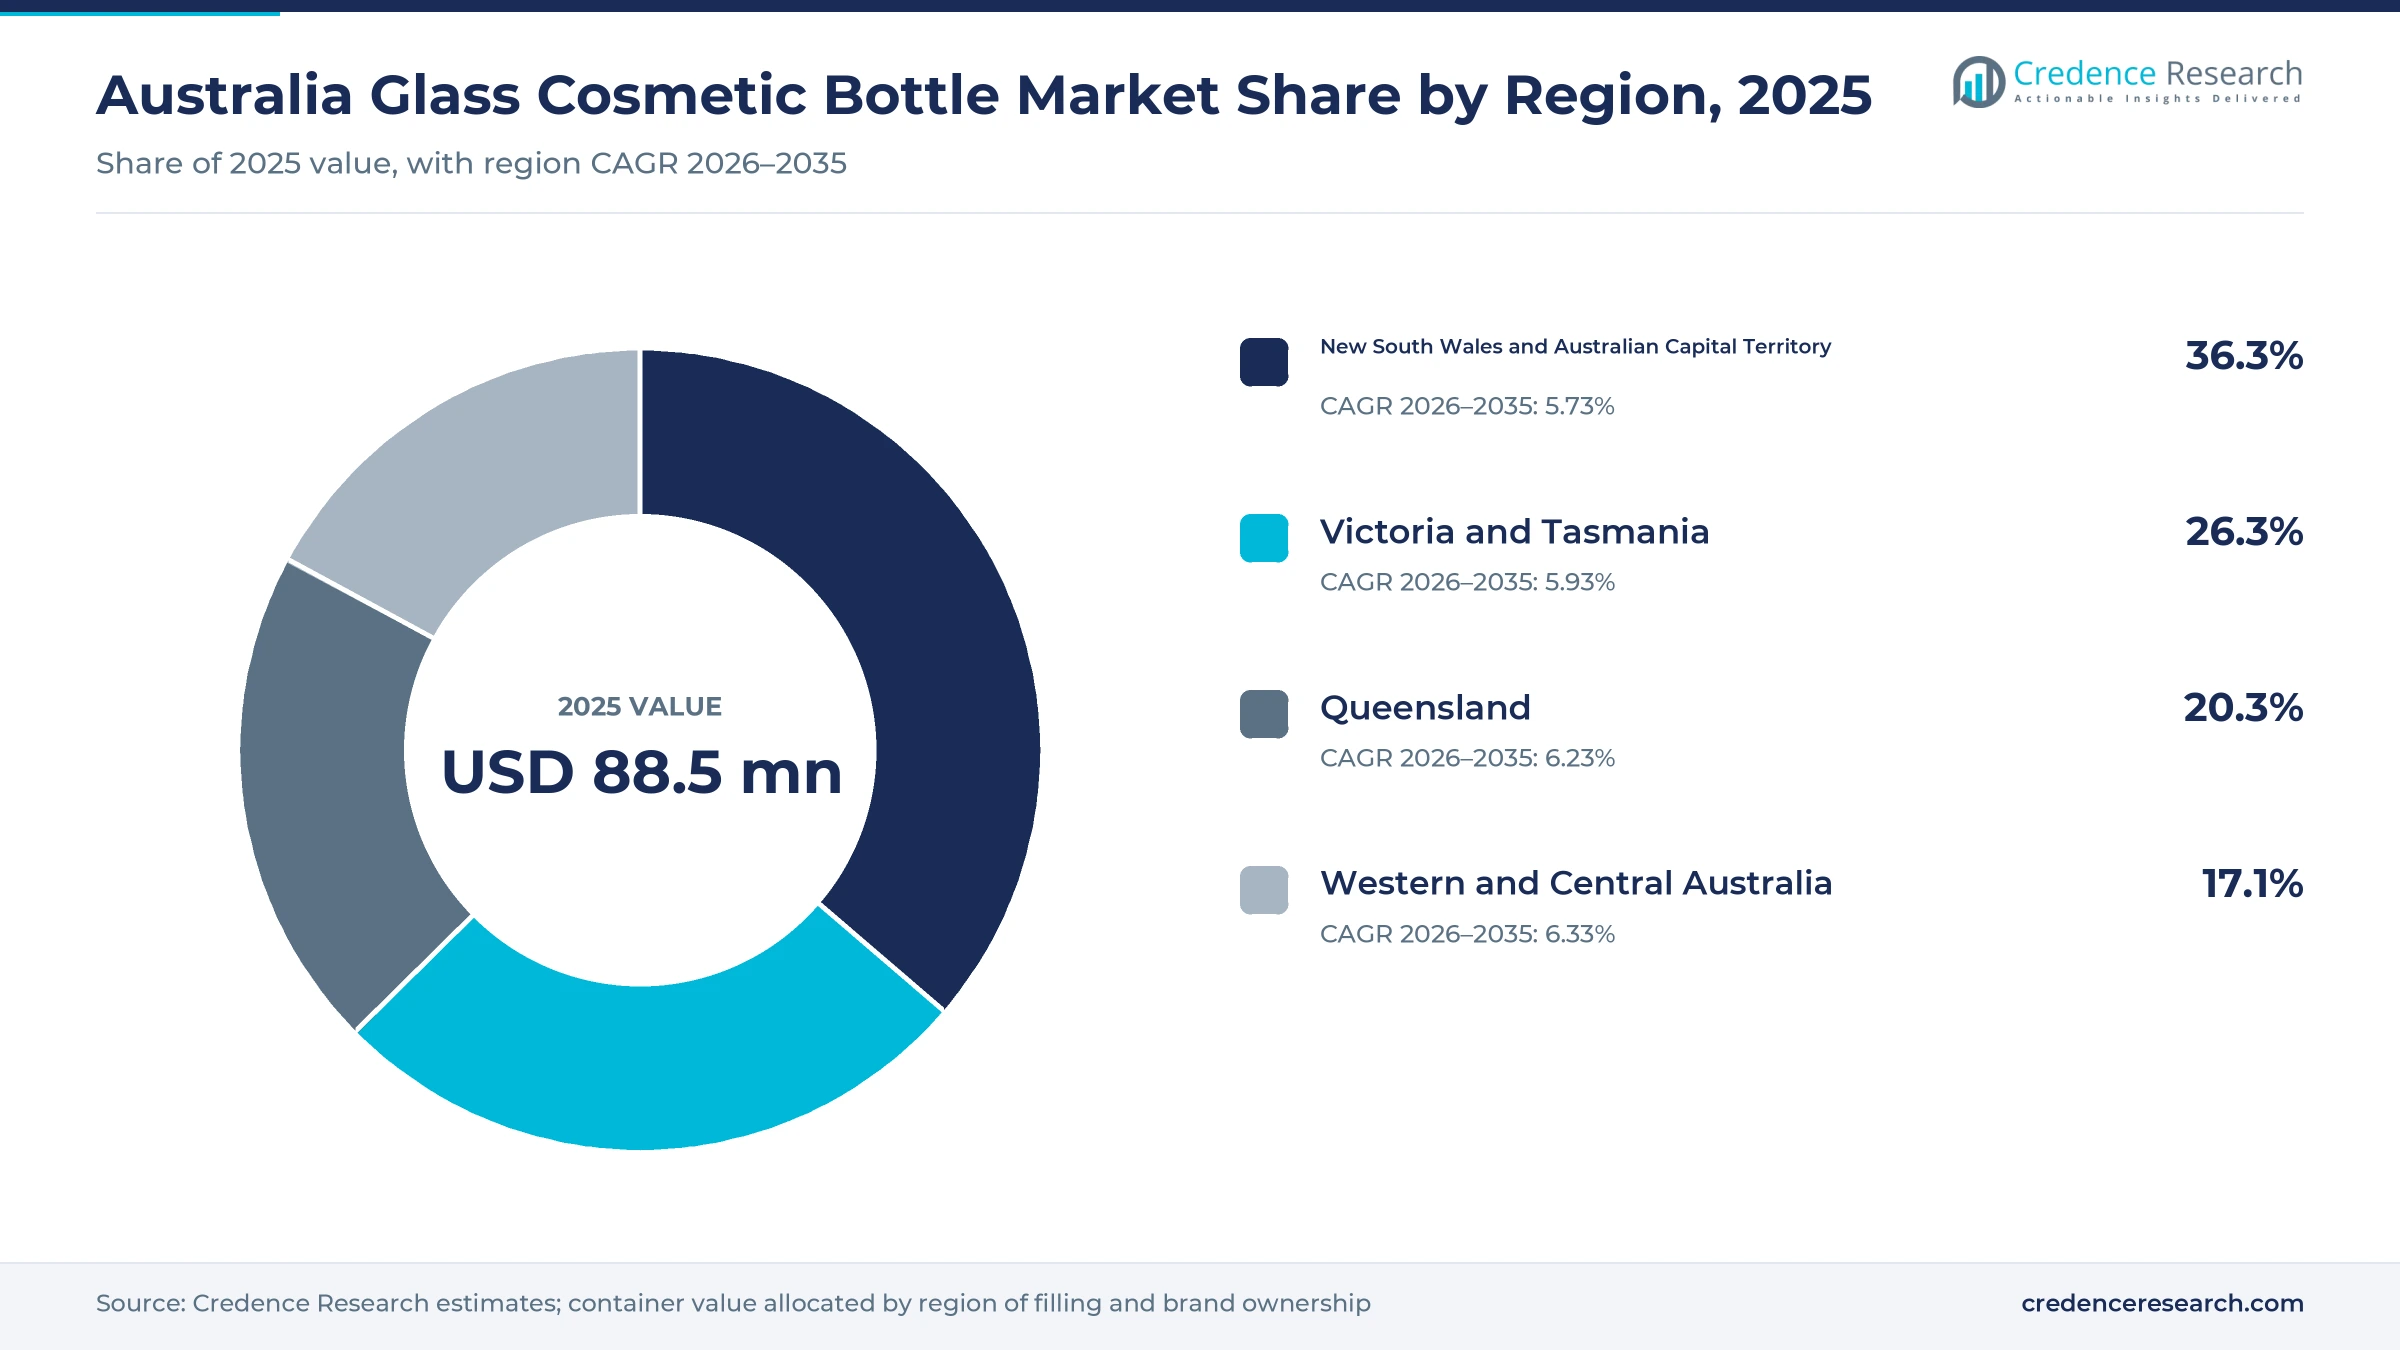
The Australia glass cosmetic bottle market was valued at USD 88.5 million in 2025 and is projected to increase from USD 93.4 million in 2026 to USD 157.6 million by 2035, registering a CAGR of 5.99% during 2026–2035. Demand comes from skincare, fragrance and body care brands that use glass bottles, droppers and jars to signal quality, protect active ingredients and meet recycling goals. New South Wales and the Australian Capital Territory held the largest regional share, 36.3% in 2025, because Sydney hosts most brand owners, contract fillers and packaging distributors. Western and Central Australia is the fastest-growing zone at 6.33% a year, as population growth in Perth lifts local brand activity. Most containers are imported from Asia and Europe and sold to brands through stockholding distributors. The closure of a glass furnace in South Australia in 2025 also reduced local container glass capacity, which keeps buyers dependent on imported stock.
Which glass containers for beauty products does the estimate cover?
The estimate measures the value of glass bottles, dropper bottles, wide-mouth jars and specialty glass containers sold to beauty and personal care brands in Australia. It covers containers used for fragrances, skincare, colour cosmetics and body and hair care, bought by brand owners, contract manufacturers and private-label developers. Values are stated at supplier selling prices and include imported stock sold through local distributors and online wholesalers.
The estimate excludes closures, pumps and droppers sold separately, plastic and aluminum containers, and glass bottles used for food, beverages or medicines. The value chain runs from overseas and local glass makers through importers, decorators and stockholding distributors to brand owners and contract fillers that pack finished products for retail.
Australia Glass Cosmetic Bottle Market Insights
- The Australia glass cosmetic bottle market was valued at USD 88.5 million in 2025 and is projected to reach USD 157.6 million by 2035, registering a CAGR of 5.99% during 2026–2035.
- New South Wales and the Australian Capital Territory held a 36.3% share of 2025 value, because Sydney hosts most beauty brands and fillers.
- Standard bottles led with a 40.0% share of 2025 value, because fragrances, toners and body oils mostly use narrow-neck glass bottles.
- Glass packaging in Australia reached 54% post-consumer recycled content in 2023-24, meeting its national target for a second year in a row.
- Orora announced in February 2025 the shutdown of one of three furnaces at Gawler, cutting site capacity by about 100,000 metric tons.
Standard bottles lead while dropper formats grow fastest
Why do standard bottles lead container demand?
Based on product type, the market is categorized into standard bottles, dropper bottles, wide-mouth jars and specialty containers. Standard bottles led with a 40.0% share of 2025 value, because fragrances, toners, body oils and hair serums mostly use narrow-neck bottles. Dropper bottles grow fastest at 6.74% a year, as facial serums and oils need precise doses and light protection.
How does skincare outpace fragrance in glass use?
Based on application, the market is categorized into fragrances, skincare, colour cosmetics and body and hair care. Skincare led with a 38.0% share of 2025 value, because serums, creams and face oils use dropper bottles and jars across many small brands. Skincare also grows fastest at 6.42% a year, as local brands add active-ingredient products that buyers expect in heavy glass.
Why is refill-engineered glass growing fastest?
Based on technology, the market is categorized into conventional moulded glass, lightweighted moulded glass and refill-engineered glass. Conventional moulded glass led with a 72.0% share of 2025 value, because most stock bottles and jars are standard moulded designs. Refill-engineered glass grows fastest at 7.38% a year, as brands test returnable bottles and refill stations that need thicker, reusable containers.
How do distributors and online wholesalers reach brands?
Based on sales channel, the market is categorized into stockholding distributors, manufacturer-direct supply and digital wholesale specialists. Stockholding distributors led with a 52.0% share of 2025 value, because most brands buy small runs from local warehouses. Digital wholesale specialists grow fastest at 6.86% a year, as indie brands order samples, small packs and matching closures online with fast delivery to their filling sites.
| Segment Group | Leading Sub-segment | Share, 2025 | Fastest-growing Sub-segment | CAGR, 2026–2035 |
|---|---|---|---|---|
| By Product Type | Standard bottles | 40.0% | Dropper bottles | 6.74% |
| By Application | Skincare | 38.0% | Skincare | 6.42% |
| By Technology | Conventional moulded glass | 72.0% | Refill-engineered glass | 7.38% |
| By Sales Channel | Stockholding distributors | 52.0% | Digital wholesale specialists | 6.86% |
Request a Free Sample
Fill in your details and we'll send you a free sample report.
- Sample data tables & charts
- Research methodology
Skincare formats, recycling rules and stock lift demand
How does skincare format diversification lift glass demand?
Skincare format diversification lifts glass demand, because serums, face oils and creams need dropper bottles and jars that protect active ingredients. Australian GDP per capita reached about $65,130 in 2025, according to World Bank data, which supports spending on premium beauty products. Craft 360, a supplier to small skincare makers since 2017, sells glass jars, glass bottles, droppers and serum pumps for these formats. Sunnypack also lists dropper bottles, cream jars, roll-on bottles and perfume bottles in its wholesale range. As a result, skincare holds a 38.0% share of 2025 value, while dropper bottles grow at 6.74% a year as brands add anti-aging serums and oils.
Why do circularity rules and material records raise demand?
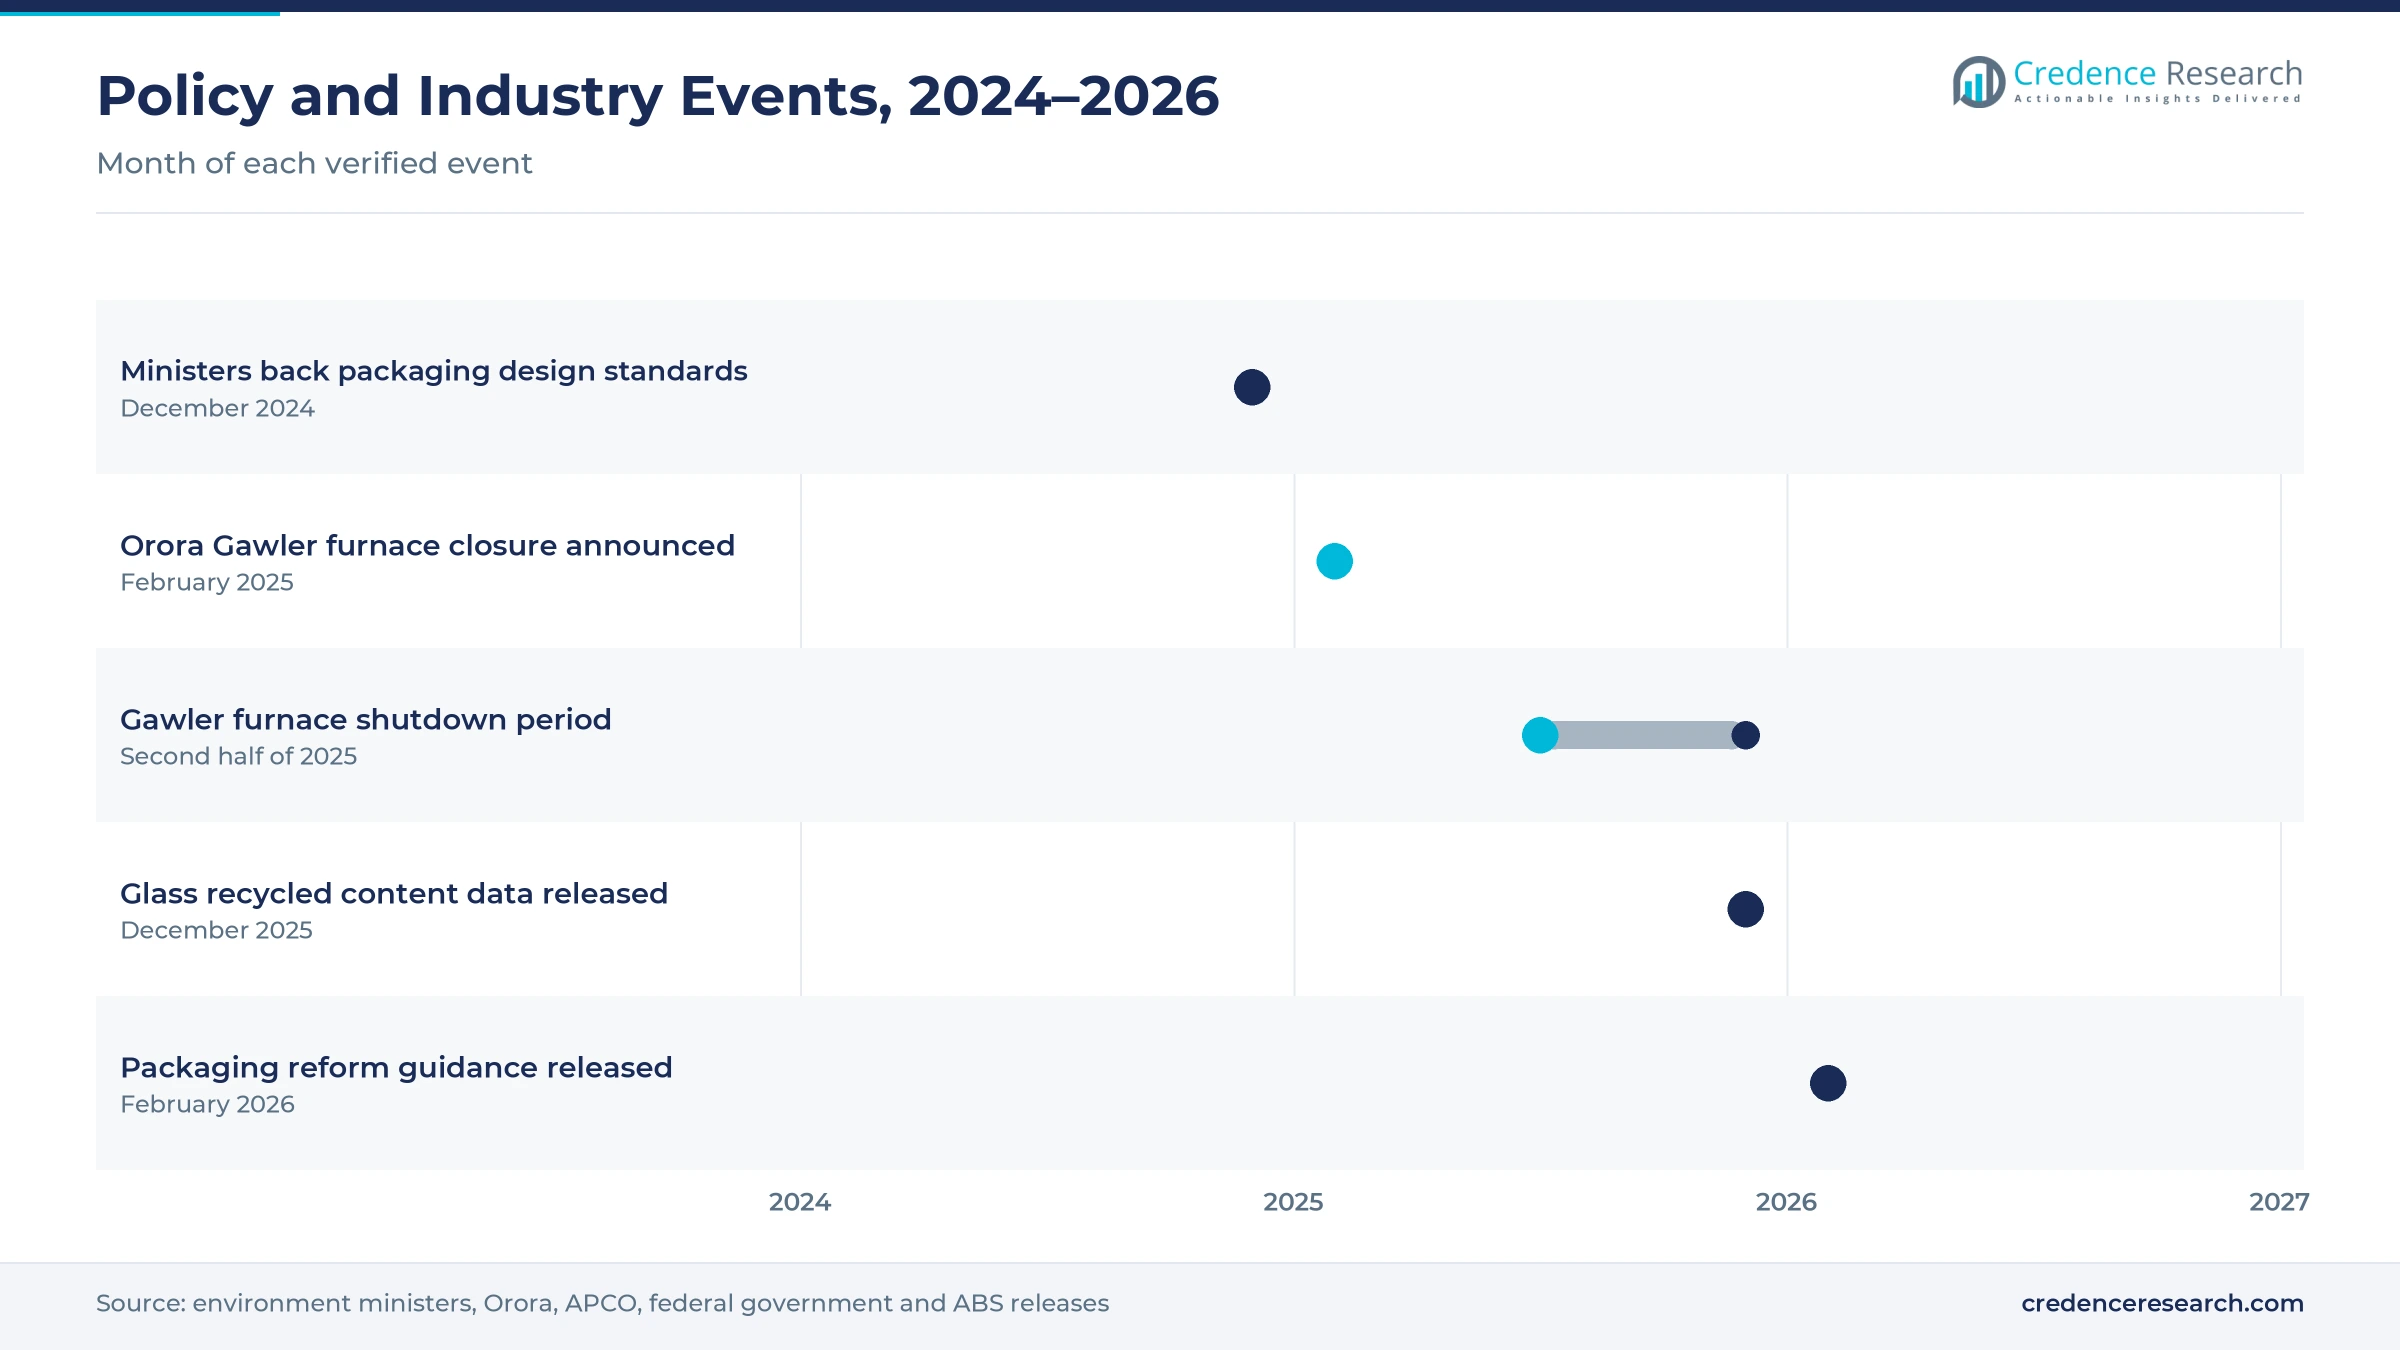
Packaging circularity and material documentation raise demand for glass, because brands must prove their packaging is recyclable and contains recycled material. Glass reached 54% post-consumer recycled content in 2023-24, up from 50%, and met its national target for a second year, according to APCO. However, only 86% of all packaging was reusable, recyclable or compostable, which missed the 2025 target of 100%. Environment ministers backed national packaging design standards on Dec. 10, 2024. In March 2023, a regulator review of 247 businesses found 57% made concerning environmental claims, with cosmetics among the worst sectors. In turn, brands that switch to documented glass gain cleaner recycling claims.
How do local stock and procurement support shape buying?
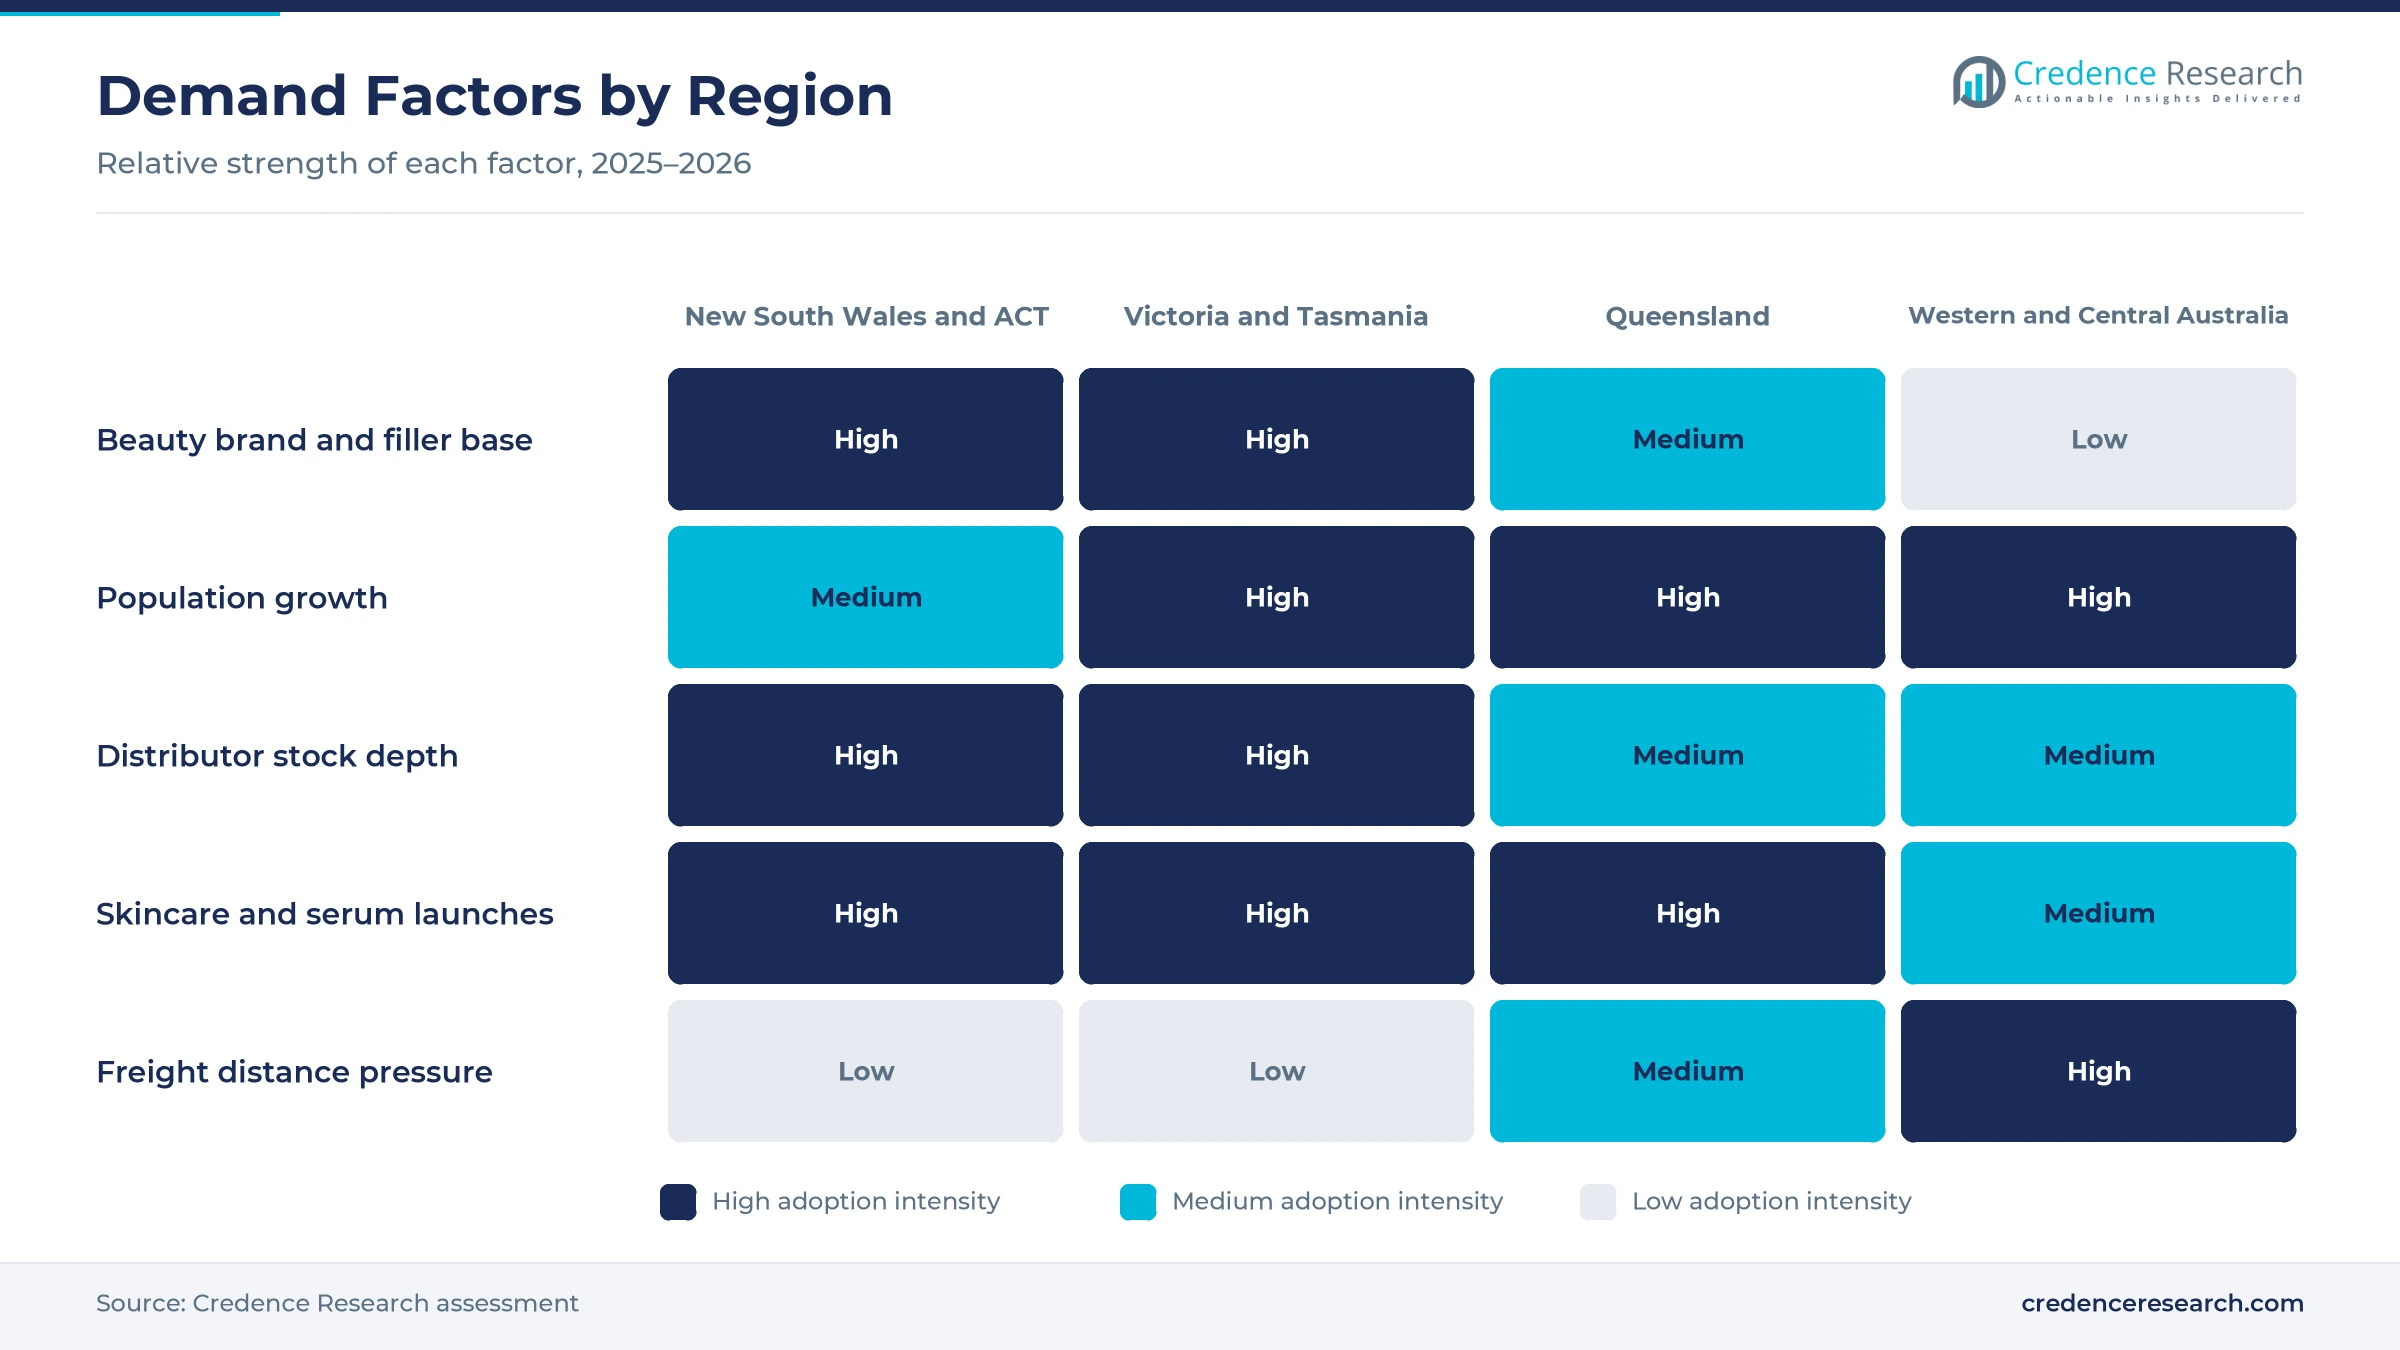
Local stock availability and procurement support shape buying, because most beauty brands order small runs that overseas glass makers will not supply directly. Orora announced in February 2025 that it would shut its oldest furnace at Gawler in the second half of 2025, cutting site capacity by about 100,000 metric tons, according to Glass International. Cospak imports glass bottles and jars into Australia and New Zealand from Asian suppliers and can arrange runs of about 100,000 pieces. Plasdene Glass-Pak runs branches in Sydney, Melbourne, Brisbane, Hobart, Adelaide, Perth and the Hunter region. As a result, stockholding distributors hold a 52.0% share of 2025 value.
Why does population growth expand the brand base?
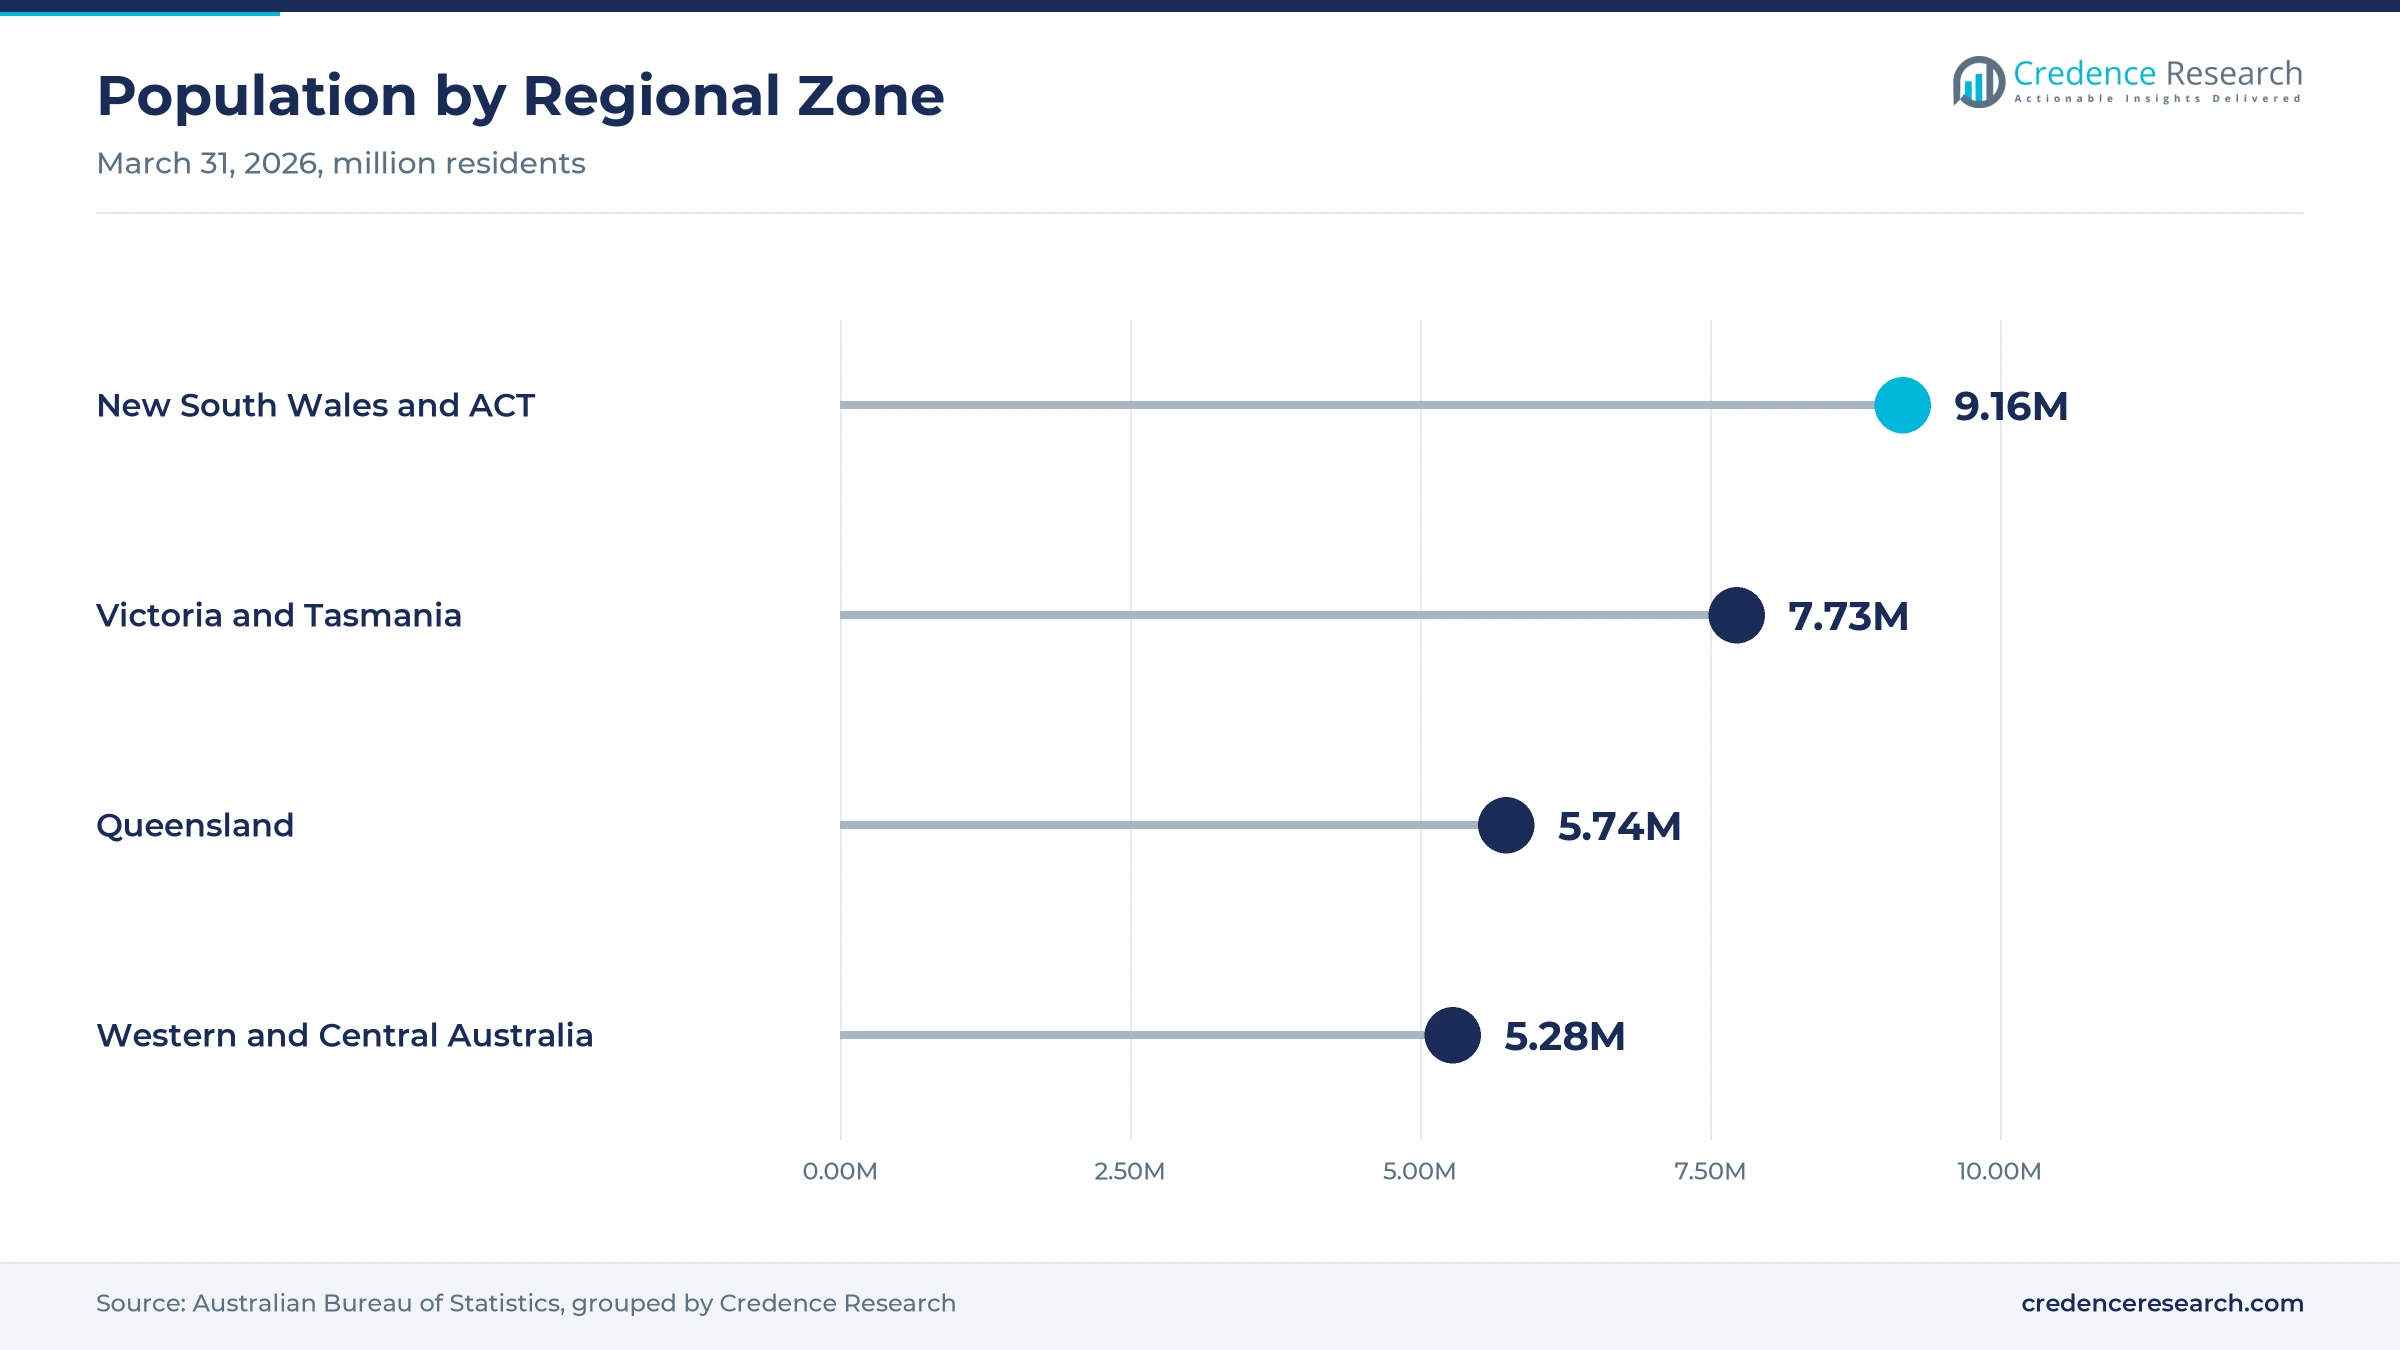
Population growth expands the brand base, because more consumers in growing cities support new skincare, fragrance and body care launches. Australia's population reached 27.92 million at March 31, 2026, growing 1.4% over the year, according to the Australian Bureau of Statistics. Western Australia grew fastest at 2.1%, while Victoria and Queensland each grew 1.6%, which widens demand in Perth, Melbourne and Brisbane. New South Wales still had the largest population at 8.67 million, which keeps Sydney the main base for brand owners and contract fillers. In turn, Western and Central Australia records the fastest regional growth in the forecast, as local brands and fillers expand outside Sydney.
Refill designs and lighter glass reshape beauty packaging
How is the rise of refill designs changing bottle specifications?
The rise of refill designs is changing bottle specifications, because returnable containers must survive repeated cleaning and filling. Aesop runs an in-store refill pilot at its South Yarra and QV stores in Melbourne, where select products are filled into reusable amber glass bottles. Customers return empty bottles, which the stores clean before putting them back into use, and the company plans to extend the program to more stores. National data also show that 86% of packaging was reusable, recyclable or compostable in 2023-24, which keeps pressure on brands to add reuse options. As a result, refill-engineered glass grows at 7.38% a year, the fastest technology rate in the forecast.
Why is the shift to lighter, recycled glass gaining ground?
The shift to lighter, recycled glass is gaining ground, because brands want lower freight weight and better recycled content results. Packaging use per person in Australia fell from 264 kilograms to 251 kilograms in 2023-24, as brands reduced material weight across formats. Glass recovery rose 11% compared with 2022-23, which improves the supply of cullet for new containers. Domestic reprocessing capacity also reached 52% of packaging placed on the market, up from 49%. In turn, lightweighted moulded glass grows faster than conventional containers, as brands balance a premium feel with lower shipping costs and smaller freight emissions on long routes from overseas glass makers.
Can digital wholesale specialists win more small brands?
Digital wholesale specialists can win more small brands, because indie skincare makers need low minimum orders, samples and fast delivery. Sunnypack sells glass bottles, cream jars, dropper bottles and perfume bottles online with matching screw caps, sprayers and pumps. The Packaging People offer glass bottles and jars online, run a showroom and supply custom jars, bottles, pumps and cosmetic tubes. Sunnypack lists 69 glass bottle and jar products, which gives small brands wide choice without custom molds. Craft 360 has supplied natural skincare ingredients since 2017 and now sells glass jars and bottles alongside them for small makers. As a result, digital wholesale specialists grow at 6.86% a year, the fastest channel rate, as suppliers bundle containers with dropper systems and closures.
Is there room for suppliers in national packaging reform?
National packaging reform creates room for suppliers with documented materials, because new rules may require brands to prove recyclability and recycled content. In February 2026, the federal government unveiled updated guidance on reforming packaging regulation, according to Packaging Gateway. The proposals include stronger rules on recyclable, reusable or compostable packaging and possible producer responsibility duties for brand owners and importers. They also bring closer scrutiny of packaging design, labeling and data reporting. Average recycled content across all packaging was 44% in 2023-24, below the 50% national target, while glass already exceeded it. In turn, distributors that supply glass with recycled content records and lighter designs can win contracts from brands preparing for these duties.
Import reliance, freight and breakage weigh on suppliers
How does import reliance expose buyers to supply risk?
Import reliance exposes buyers to supply risk, because most decorative and cosmetic glass is made in Asia and Europe. Long lead times mean brands must order months ahead, which ties up cash for small companies. As a result, a delayed shipment can stall a product launch or reorder. Distributors respond by holding more local stock, offering standard shapes and using several overseas glass makers for key designs, which spreads the risk of delays from any one plant.
Why do freight costs and breakage raise landed prices?
Freight costs and breakage raise landed prices, because glass is heavy and fragile compared with plastic containers. Sea freight swings and local trucking costs add to the price of each unit before filling. In turn, brands with low volumes pay the most per bottle. Suppliers respond with lighter designs, better pallet packing and regional warehouses that shorten final delivery distances to fillers in Perth, Adelaide, Brisbane and regional towns.
How do plastic and aluminum alternatives compete?
Plastic and aluminum alternatives compete with glass, because they weigh less and resist breakage in travel and gym products. Recycled plastic bottles also help some brands meet recycled content goals at lower cost. As a result, glass loses share in body wash, shampoo and travel sizes. Glass suppliers respond by focusing on serums, fragrance packaging and premium creams where weight matters less and the feel of heavy glass supports a higher shelf price.
Why do decoration minimums limit small brands?
Decoration minimums limit small brands, because screen printing, coating and custom molds require large orders that many local brands cannot fund. Stock bottles with labels are cheaper but make products look similar on shelves. In turn, brands that want custom glass face higher upfront costs and longer lead times. Suppliers respond with short-run decoration, stock colors and frosted finishes that give smaller runs a distinct look without the cost of a custom mold.
New South Wales leads while the west grows fastest
| Region | Value, 2025 (USD million) | Share, 2025 | CAGR, 2026–2035 |
|---|---|---|---|
| New South Wales and Australian Capital Territory | 32.1 | 36.3% | 5.73% |
| Victoria and Tasmania | 23.3 | 26.3% | 5.93% |
| Queensland | 18.0 | 20.3% | 6.23% |
| Western and Central Australia | 15.1 | 17.1% | 6.33% |
Why does new South Wales hold the largest share?
New South Wales and the Australian Capital Territory held a 36.3% share of 2025 value and grow at 5.73% a year, because Sydney hosts most beauty brand owners, contract fillers and packaging distributors. The two jurisdictions had about 9.16 million residents in March 2026. However, growth is slower than in the west because the brand base is already mature and many large brands already source glass directly from overseas makers, which limits gains for local distributors.
How do Victoria and Tasmania support fragrance and skincare?
Victoria and Tasmania held a 26.3% share of 2025 value and grow at 5.93% a year, because Melbourne hosts many skincare, fragrance and natural beauty brands. Victoria's population grew 1.6% in the year to March 2026, which supports new product launches. As a result, distributors with Melbourne warehouses supply a steady flow of bottles and jars to local fillers. Hobart also hosts a Plasdene Glass-Pak branch that serves Tasmanian skincare and gin makers.
Why is Queensland gaining share?
Queensland held a 20.3% share of 2025 value and grows at 6.23% a year, because Brisbane and the Gold Coast host a growing group of skincare and sun care brands. Queensland had about 5.74 million residents in March 2026, and a Brisbane distributor branch shortens delivery times for local fillers. In turn, local brands add face oils and serums, which lifts demand for dropper bottles and amber glass that protect active ingredients from strong sunlight and heat.
What drives growth in Western and Central Australia?
Western and Central Australia held a 17.1% share of 2025 value and grows fastest at 6.33% a year, because Western Australia had the fastest population growth at 2.1%. Perth and Adelaide support natural skincare and fragrance brands, while long freight distances favor local stock. As a result, distributors with branches in Perth and Adelaide gain orders from brands that need short delivery times.
Furnace cuts and packaging reform marked 2024 to 2026
| Development | Status and market relevance |
|---|---|
| In December 2024, environment ministers backed national packaging design standards at a meeting in Melbourne. | Set the base for a new national packaging framework |
| In February 2025, Orora announced the shutdown of one of three glass furnaces at Gawler in South Australia. | Cut site capacity by about 100,000 metric tons from the second half of 2025 |
| In December 2025, APCO announced that glass reached 54% post-consumer recycled content in 2023-24. | Glass met its recycled content target for a second year |
| In February 2026, the federal government unveiled updated guidance on packaging regulation reform. | Proposals include producer responsibility and design rules |
Refill, lighter glass and decoration change bottle design
- Refill-engineered bottles use thicker walls and standard necks that survive repeated washing, which supports in-store refill programs.
- Lightweighted moulding reduces glass weight while keeping strength, which lowers freight costs and material use per unit.
- Amber and violet glass filters light that can degrade active ingredients, which suits serums, face oils and natural products.
- Short-run decoration applies printing, frosting and coating to small batches, which helps indie brands stand out on shelves.
Need a Custom Version of This Report?
Tailor the scope, geography, or segments to your exact requirements.
- Custom geography or segment scope
- Direct access to our analyst team
Distributors and online sellers compete for beauty brands
Competition is led by stockholding distributors and importers that buy from overseas glass makers and sell small runs to local beauty brands. Plasdene Glass-Pak, founded in 1987, supplies glass and plastic containers from branches in Sydney, Melbourne, Brisbane, Hobart, Adelaide, Perth and the Hunter region, and lists cosmetics among its served sectors. Cospak imports glass bottles and jars from Asian suppliers into Australia and New Zealand. Sunnypack sells glass bottles, cream jars and dropper bottles through its online store, while The Packaging People offer glass containers and custom cosmetic packaging with a showroom. Craft 360 serves small skincare makers with containers and ingredients. Rivals compete on stock depth, minimum order size, delivery speed, decoration services and price, while local furnace cuts keep imported supply central.
Companies profiled and their roles in this market
| Company | Type | Role in the market |
|---|---|---|
| Plasdene Glass-Pak | Stockholding distributor | Supplies glass containers from branches in seven locations |
| Cospak | Glass importer | Imports glass bottles and jars into Australia and New Zealand |
| Sunnypack | Online wholesaler | Sells glass bottles, cream jars and dropper bottles online |
| The Packaging People | Packaging supplier | Offers glass bottles, jars and custom cosmetic packaging |
| Craft 360 | Supplier to small makers | Combines glass containers with skincare ingredients since 2017 |
Credence Research view on Australian beauty glass demand
Credence Research's view is that Australian demand for beauty glass will grow steadily because skincare brands keep adding serums, oils and premium creams that suit glass. Standard bottles remain the base of the market, while dropper bottles and refill-engineered glass gain share. Glass reached 54% recycled content in 2023-24, which gives brands a credible recycling message. However, import reliance, freight costs and competition from plastic and aluminum will keep prices under pressure. Suppliers that hold local stock, offer short-run decoration and document recycled content should gain share fastest.
How the Australian beauty glass estimate was built
The report uses 2025 as the base year on a calendar basis, and market values come from the Credence Research model. That model combines national packaging consumption and recovery data, population statistics, World Bank income data, industry news on glass manufacturing capacity and company information on product ranges and branch networks. Segment splits and regional growth rates are Credence Research estimates, while regional shares follow the client-defined split. Sources used are public reports, official statistics, trade press and company websites, and no interviews or surveys were used.
Skincare and refill formats carry glass demand to 2035
Sales of glass bottles and jars for beauty products are expected to reach USD 157.6 million by 2035, a 5.99% CAGR during 2026–2035, as skincare formats, refill programs and recycling goals keep demand rising. Growth should stay steady through 2028 while national packaging reform takes shape and brands document recycled content. After that, refill-engineered and lightweighted glass will carry more growth as standard bottle demand matures. Higher freight costs would lower this outlook, while faster adoption of refill programs would raise it. Distributors with deep local stock and decoration services are expected to gain the most.
Frequently Asked Questions
How big is the Australia glass cosmetic bottle market?
Which product type leads glass beauty containers in Australia?
Which region leads the Australia glass cosmetic bottle market?
Which technology is growing fastest?
What drives demand for glass beauty containers in Australia?
How does recycling affect glass use in beauty packaging?
Who are the leading suppliers of glass beauty containers in Australia?
What are the main challenges for glass container suppliers?
Table of Content
Chapter 1 Market Segmentation
- 1.1 Segmentation Framework
- 1.1.1 Product and Service Classification
- 1.1.2 Application and End-Use Classification
- 1.1.3 Technology and Solution Classification
- 1.1.4 Customer and Distribution Channel Classification
- 1.1.5 Geographic Segmentation
- 1.1.6 Market Segment Definitions and Boundaries
- 1.2 By Product Type
- 1.2.1 Standard bottles
- 1.2.2 Dropper bottles
- 1.2.3 Wide-mouth jars
- 1.2.4 Specialty containers
- 1.3 By Application
- 1.3.1 Fragrances
- 1.3.2 Skincare
- 1.3.3 Colour cosmetics
- 1.3.4 Body and hair care
- 1.4 By Technology
- 1.4.1 Conventional moulded glass
- 1.4.2 Lightweighted moulded glass
- 1.4.3 Refill-engineered glass
- 1.5 By Sales Channel
- 1.5.1 Stockholding distributors
- 1.5.2 Manufacturer-direct supply
- 1.5.3 Digital wholesale specialists
Chapter 2 Introduction
- 2.1 Report Objectives and Scope
- 2.2 Product Definition and Industry Terminology
- 2.3 Market Inclusions and Exclusions
- 2.4 Research Process
- 2.4.1 Primary Research and Expert Interviews
- 2.4.2 Secondary Research and Source Review
- 2.4.3 Top-Down and Bottom-Up Estimation
- 2.4.4 Data Triangulation and Verification
- 2.5 Market Size Measurement Basis
- 2.5.1 2025: USD 88.5 million → 2035: USD 157.6 million
- 2.6 Historical and Forecast Reference Periods
- 2.6.1 Historical Period: 2018-2025
- 2.6.2 Base Year: 2025
- 2.6.3 Forecast Period: 2025-2035
- 2.7 Research Assumptions and Limitations
Chapter 3 Executive Summary
- 3.1 Market Snapshot and Key Findings
- 3.2 Base-Year Market Size, 2025
- 3.3 Forecast Market Size, 2035
- 3.4 Revenue and Volume Growth Outlook
- 3.5 Key Demand and Supply Indicators
- 3.6 Leading Market Segments
- 3.7 Fastest-Growing Market Opportunities
- 3.8 Regional Performance Highlights
- 3.9 Technology and Industry Transformation
- 3.10 Competitive Landscape Summary
- 3.11 Analyst View and Strategic Implications
Chapter 4 Australia Glass Cosmetic Bottle Market Trends and Developments
- 4.1 Historical Industry Development, 2018-2025
- 4.2 Recent Market Trends and Developments
- 4.3 Demand and Customer Behavior Trends
- 4.4 Technology and Product Innovation
- 4.5 Artificial Intelligence, Automation and Digitalization
- 4.6 Local Manufacturing and Supply Chain Realignment
- 4.7 Industry Partnerships, Mergers and Acquisitions
- 4.8 Sustainability and Circular Economy Developments
- 4.9 Government and Private Sector Investment Trends
- 4.10 Emerging Business Models and Commercialization
- 4.11 Industry Developments and Announcements
Chapter 5 Australia Glass Cosmetic Bottle Market Production, Supply and Demand Analysis
- 5.1 Demand Trend and Consumption Analysis, 2018-2025
- 5.2 Demand Forecast, 2025-2035
- 5.3 Production and Output Trend, 2018-2025
- 5.4 Production and Output Forecast, 2025-2035
- 5.5 Installed Capacity and Capacity Utilization
- 5.6 Company-Wise Production Plants and Statistics
- 5.6.1 Installed Production Capacity
- 5.6.2 Actual Production
- 5.6.3 Planned Capacity and Expansion Targets
- 5.7 Supply Chain Structure and Procurement Trends
- 5.8 Supply-Demand Gap and Bottlenecks
- 5.9 Import Dependence and Sourcing Structure
- 5.10 Contract Manufacturing and Outsourcing
- 5.11 Regional Supply and Demand Concentration
Chapter 6 Australia Glass Cosmetic Bottle Market Pricing Analysis
- 6.1 Pricing Structure and Measurement
- 6.2 Historical Pricing Trends, 2018-2025
- 6.3 Pricing Outlook, 2025-2035
- 6.4 Average Selling Price and Unit Economics
- 6.5 Pricing by Product and Market Segment
- 6.6 Geographic Pricing Differences
- 6.7 Key Input, Energy, Labor and Logistics Costs
- 6.8 Contract Pricing and Purchasing Models
- 6.9 Pricing Sensitivity and Competitive Positioning
- 6.10 Price, Margin and Profitability Implications
Chapter 7 Australia Glass Cosmetic Bottle Market Dynamics
- 7.1 Market Growth Drivers
- 7.1.1 Demand-Side Drivers
- 7.1.2 Technology and Innovation Drivers
- 7.1.3 Infrastructure and Investment Drivers
- 7.1.4 Regulatory and Policy Drivers
- 7.2 Market Restraints
- 7.2.1 Cost and Affordability Constraints
- 7.2.2 Technology and Adoption Barriers
- 7.2.3 Supply Chain and Operational Constraints
- 7.3 Market Challenges
- 7.3.1 Competitive Pressure and Margin Erosion
- 7.3.2 Skills, Infrastructure and Implementation Gaps
- 7.4 Emerging Market Opportunities
- 7.5 Market Dynamics Impact and Time-Horizon Assessment
Chapter 8 Australia Glass Cosmetic Bottle Value Chain Analysis
- 8.1 Industry Value Chain Overview
- 8.2 Upstream Suppliers and Critical Inputs
- 8.3 Technology and Component Providers
- 8.4 Manufacturing or Service Delivery
- 8.5 Distribution, Channel Partners and Integrators
- 8.6 Downstream Applications and End Users
- 8.7 Value Addition and Profit Pools
- 8.8 Vertical Integration and Outsourcing
- 8.9 Supplier Concentration and Risk
- 8.10 Supply Chain Localization and Resilience
Chapter 9 Australia Glass Cosmetic Bottle Market Regulations and Policies
- 9.1 Relevant Laws, Standards and Compliance Frameworks
- 9.2 Product, Service, Safety and Quality Requirements
- 9.3 Government Policies, Incentives and Subsidies
- 9.4 Imports, Exports and Trade Barriers
- 9.5 Public Procurement and Local Content Requirements
- 9.6 Environmental and Sustainability Compliance
- 9.7 Upcoming Policy Changes and Market Implications
Chapter 10 Australia Glass Cosmetic Bottle Market Hotspots and Opportunities
- 10.1 Market Opportunity Mapping and Growth Hotspots
- 10.2 High-Growth Applications and Customer Groups
- 10.3 Underserved Markets and White-Space Opportunities
- 10.4 Emerging Technology and Product Opportunities
- 10.5 New Capacity and Investment Hotspots
- 10.6 Market Entry and Expansion Opportunities
- 10.7 Distribution and Partnership Opportunities
- 10.8 Near-Term and Long-Term Commercial Potential
- 10.9 Opportunity Attractiveness and Execution Risks
Chapter 11 Australia Glass Cosmetic Bottle Market Outlook, 2025-2035
- 11.1 Market Size and Analysis
- 11.1.1 Revenue (Market Measurement: 2025: USD 88.5 million → 2035: USD 157.6 million)
- 11.1.2 Market Volume and Quantity Sold
- 11.1.3 Historical Market Size, 2018-2025
- 11.1.4 Base-Year Market Size, 2025
- 11.2 Market Forecast, 2025-2035
- 11.2.1 Revenue Forecast to 2035
- 11.2.2 Volume Forecast to 2035
- 11.2.3 CAGR and Year-on-Year Growth
- 11.2.4 Incremental Revenue Opportunity
- 11.3 Forecast Assumptions and Scenario Analysis
- 11.3.1 Base-Case Forecast
- 11.3.2 Optimistic and Conservative Scenarios
- 11.3.3 Technology, Pricing and Policy Sensitivities
- 11.4 Market Attractiveness and Growth Outlook
Chapter 12 Australia Glass Cosmetic Bottle Market Segmentation and Outlook
- 12.1 Segmentation Summary and Market Shares, 2025
- 12.2 Largest and Fastest-Growing Segments
- 12.3 By Product Type - Market Size and Forecast, 2025-2035
- 12.3.1 Segment Definition and Scope
- 12.3.2 Historical Market Size, 2018-2025
- 12.3.3 Revenue Forecast, 2025-2035
- 12.3.4 Volume Forecast, 2025-2035
- 12.3.5 Base-Year Market Share, 2025
- 12.3.6 Segment CAGR and Growth Drivers
- 12.3.7 Subsegment Market Size and Forecast
- 12.3.7.1 Standard bottles
- 12.3.7.2 Dropper bottles
- 12.3.7.3 Wide-mouth jars
- 12.3.7.4 Specialty containers
- 12.3.8 Subsegment Pricing and Adoption Trends
- 12.3.9 Leading Suppliers and Competition
- 12.3.10 Regional Demand and Opportunities
- 12.4 By Application - Market Size and Forecast, 2025-2035
- 12.4.1 Segment Definition and Scope
- 12.4.2 Historical Market Size, 2018-2025
- 12.4.3 Revenue Forecast, 2025-2035
- 12.4.4 Volume Forecast, 2025-2035
- 12.4.5 Base-Year Market Share, 2025
- 12.4.6 Segment CAGR and Growth Drivers
- 12.4.7 Subsegment Market Size and Forecast
- 12.4.7.1 Fragrances
- 12.4.7.2 Skincare
- 12.4.7.3 Colour cosmetics
- 12.4.7.4 Body and hair care
- 12.4.8 Subsegment Pricing and Adoption Trends
- 12.4.9 Leading Suppliers and Competition
- 12.4.10 Regional Demand and Opportunities
- 12.5 By Technology - Market Size and Forecast, 2025-2035
- 12.5.1 Segment Definition and Scope
- 12.5.2 Historical Market Size, 2018-2025
- 12.5.3 Revenue Forecast, 2025-2035
- 12.5.4 Volume Forecast, 2025-2035
- 12.5.5 Base-Year Market Share, 2025
- 12.5.6 Segment CAGR and Growth Drivers
- 12.5.7 Subsegment Market Size and Forecast
- 12.5.7.1 Conventional moulded glass
- 12.5.7.2 Lightweighted moulded glass
- 12.5.7.3 Refill-engineered glass
- 12.5.8 Subsegment Pricing and Adoption Trends
- 12.5.9 Leading Suppliers and Competition
- 12.5.10 Regional Demand and Opportunities
- 12.6 By Sales Channel - Market Size and Forecast, 2025-2035
- 12.6.1 Segment Definition and Scope
- 12.6.2 Historical Market Size, 2018-2025
- 12.6.3 Revenue Forecast, 2025-2035
- 12.6.4 Volume Forecast, 2025-2035
- 12.6.5 Base-Year Market Share, 2025
- 12.6.6 Segment CAGR and Growth Drivers
- 12.6.7 Subsegment Market Size and Forecast
- 12.6.7.1 Stockholding distributors
- 12.6.7.2 Manufacturer-direct supply
- 12.6.7.3 Digital wholesale specialists
- 12.6.8 Subsegment Pricing and Adoption Trends
- 12.6.9 Leading Suppliers and Competition
- 12.6.10 Regional Demand and Opportunities
- 12.7 Segment Growth Comparison
- 12.8 Segment Attractiveness and Priority Matrix
Chapter 13 Australia Glass Cosmetic Bottle End-Use and Application Market Outlook
- 13.1 End-Use Industry and Customer Demand Structure
- 13.2 Leading Applications and Customer Groups
- 13.3 End-Use Market Size, Share and Forecast
- 13.4 Major End-Use Industry Deep Dives
- 13.4.1 Customer Requirements and Use Cases
- 13.4.2 Demand and Replacement Cycles
- 13.4.3 Technical and Regulatory Considerations
- 13.4.4 Purchasing and Procurement Models
- 13.4.5 Leading Vendors and Distribution Channels
- 13.4.6 Forecast and Commercial Opportunities
- 13.5 Emerging Applications and Cross-Segment Demand
- 13.6 End-Use Industry Investment Priorities
Chapter 14 Australia Glass Cosmetic Bottle Geographic Market Outlook, 2025-2035
- 14.1 Domestic Market Distribution and Demand Clusters
- 14.2 State- or Province-Wise Market Size and Forecast, 2025-2035
- 14.3 City and Metropolitan Market Outlook
- 14.4 Industrial, Manufacturing and Commercial Clusters
- 14.5 Geographic Concentration of Key End Users
- 14.6 Local Pricing and Purchasing Differences
- 14.7 Domestic Production Facilities and Capacity Map
- 14.8 Local Infrastructure and Project Pipeline
- 14.9 State-Level Policy and Incentive Differences
- 14.10 Subnational Investment Hotspots and Opportunities
- 14.11 Distribution and Logistics Networks
- 14.12 Domestic Competitive Footprint
Chapter 15 Australia Glass Cosmetic Bottle Technology, Innovation and Sustainability Outlook
- 15.1 Technology Landscape and Maturity
- 15.2 Product, Process and Service Innovation
- 15.3 AI, Automation and Digital Tools in the Industry
- 15.4 Technology Adoption and Performance Benchmarking
- 15.5 Innovation Pipeline and R&D Investment
- 15.6 Patent and Intellectual Property Trends
- 15.7 Energy Efficiency and Resource Management
- 15.8 Sustainability, Recycling and Circularity
- 15.9 Technology Roadmap, 2025-2035
- 15.10 Risks of Obsolescence and Technology Substitution
Chapter 16 Australia Glass Cosmetic Bottle Market Key Strategic Imperatives
- 16.1 Growth and Market Entry Priorities
- 16.2 High-Return Products and Segments
- 16.3 Pricing, Profitability and Cost Optimization
- 16.4 Technology Investment and Product Differentiation
- 16.5 Supply Chain Localization and Resilience
- 16.6 Distribution and Customer Acquisition
- 16.7 Partnership, Acquisition and Capacity Strategy
- 16.8 Regional Expansion Priorities
- 16.9 Short-, Medium- and Long-Term Actions
Chapter 17 Competition Outlook
- 17.1 Industry Competition Characteristics
- 17.2 Market Structure and Concentration
- 17.3 Market Share and Competitive Positioning, 2025
- 17.4 Company-Wise Revenue and Product Benchmarking
- 17.5 Production and Service Capacity Benchmarking
- 17.6 Technology, Pricing and Differentiation
- 17.7 Regional Footprint and Distribution Strength
- 17.8 Mergers, Acquisitions and Strategic Alliances
- 17.9 New Entrants and Competitive Threats
- 17.10 Porter's Five Forces and Industry Attractiveness
- 17.11 Competitive Outlook, 2025-2035
Chapter 18 Company Profiles
- 18.1 Company Coverage and Selection Criteria
- 18.2 Plasdene Glass-Pak
- 18.2.1 Business Description
- 18.2.2 Company Ownership and Geographic Presence
- 18.2.3 Product and Service Portfolio
- 18.2.4 Manufacturing and Operating Footprint
- 18.2.5 Production Capacity and Expansion Plans
- 18.2.6 Financial Performance and Investment
- 18.2.7 Market Share and Competitive Position
- 18.2.8 Technology and Innovation Capabilities
- 18.2.9 Strategic Alliances or Partnerships
- 18.2.10 Recent Developments
- 18.2.11 Growth Strategy and Outlook
- 18.3 Cospak
- 18.4 New Directions Australia
- 18.5 Weltrade Packaging
- 18.6 Sunnypack
- 18.7 Continental Purchasing Group
- 18.8 Techpack
- 18.9 The Packaging People
- 18.10 Glass Bottles Direct Australia
- 18.11 Craft 360
- 18.12 Other Relevant Market Participants
Note: Every listed company is profiled on the structure shown under the first company. The company list is preliminary and may change based on research findings, market developments, data availability and client requirements.
Chapter 19 Disclaimer
- 19.1 Research and Forecast Disclaimer
- 19.2 Data Source and Estimation Limitations
Note: The depth of individual sections depends on data availability for this market. Volume, capacity, trade and other unit-based metrics are included where applicable.

