
Rack growth and PUE rules set cooling unit demand in China
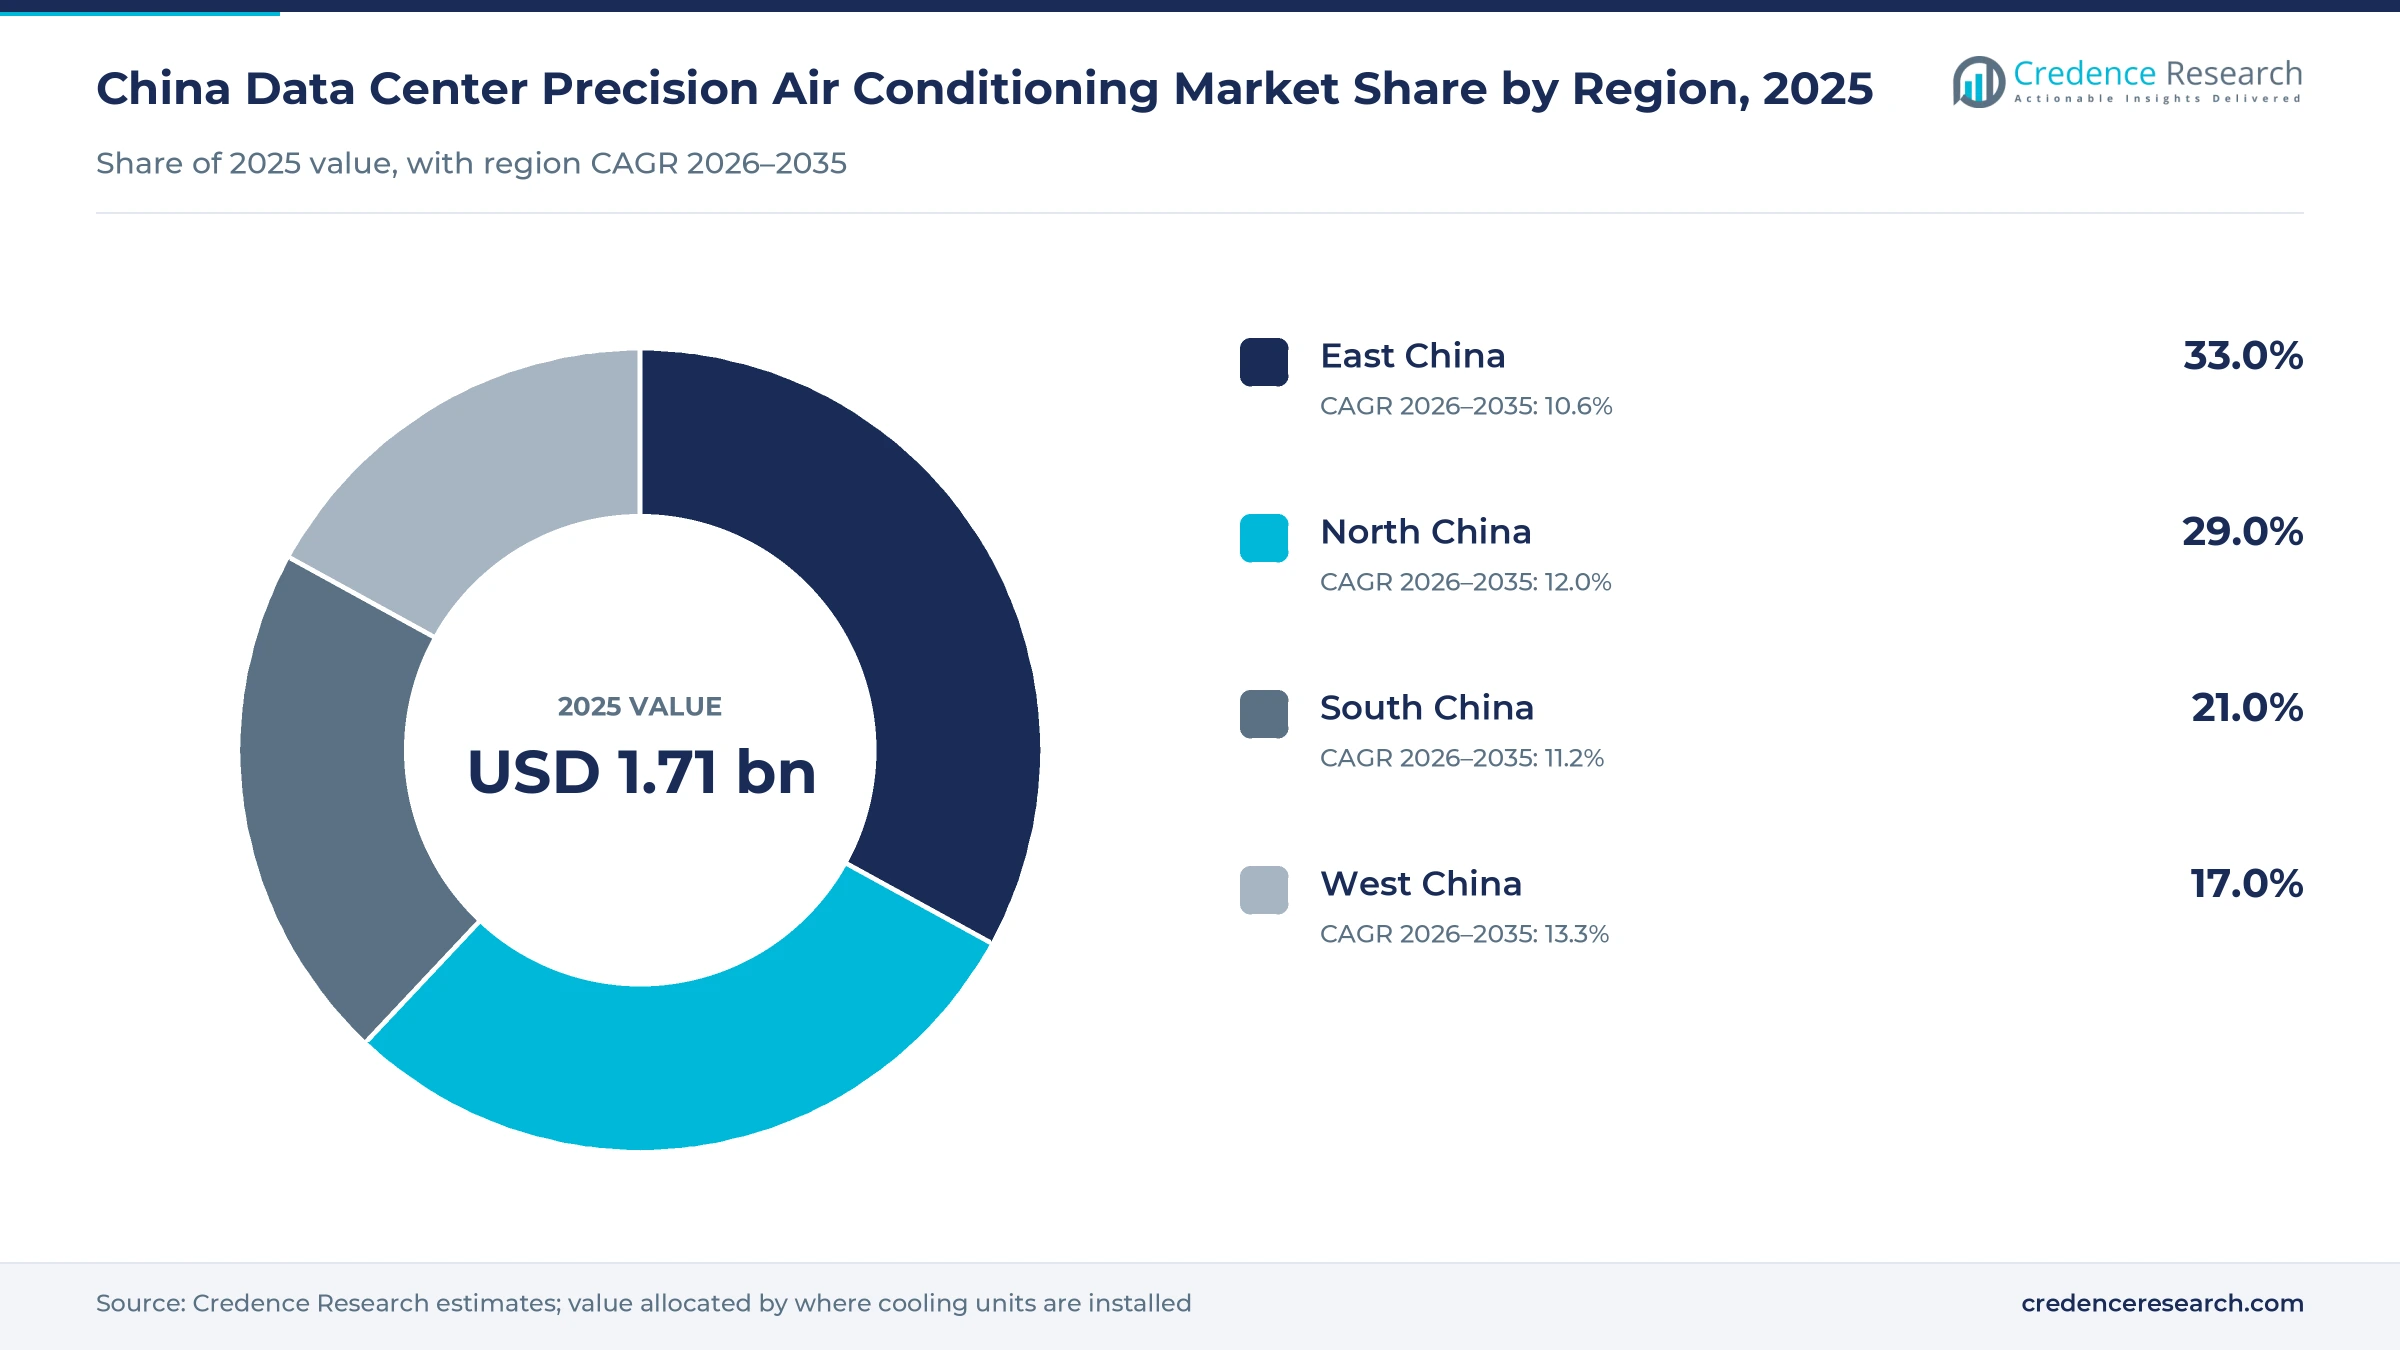
The China data center precision air conditioning market was valued at USD 1.71 billion in 2025 and is projected to increase from USD 1.91 billion in 2026 to USD 5.13 billion by 2035, registering a CAGR of 11.60% during 2026–2035. Demand comes from cloud providers, telecom operators and colocation firms that fit out new halls, and from banks, government agencies and manufacturers that run their own server rooms. East China held the largest regional share, 33.0% in 2025, because the Yangtze River Delta hosts dense colocation campuses close to financial and internet users. West China is the fastest-growing region at 13.3% a year, as national computing hubs in Guizhou, Gansu, Ningxia and Chengdu-Chongqing add halls. National rules that cap power usage effectiveness are pushing buyers away from fixed-speed direct-expansion units toward variable-speed, pumped-refrigerant and indirect evaporative designs, while AI halls pair air units with liquid loops.
Which cooling units fall inside this market in China?
The market counts the value of precision air conditioning units installed in mainland Chinese data centers, enterprise server rooms and telecom equipment rooms. It covers room-level computer room air conditioners with direct-expansion or chilled-water coils, close-coupled in-row and rack units, and indirect evaporative and pumped-refrigerant air handlers built to hold temperature and humidity within tight limits.
Chillers, cooling towers, pumps, coolant distribution units and cold plates are excluded, although they decide how much heat the air side must carry. Installation labor and multiyear service contracts are also outside the count. Value flows from compressor, fan and controls suppliers through domestic and foreign unit makers and design institutes to telecom operators, cloud providers, colocation firms and enterprises.
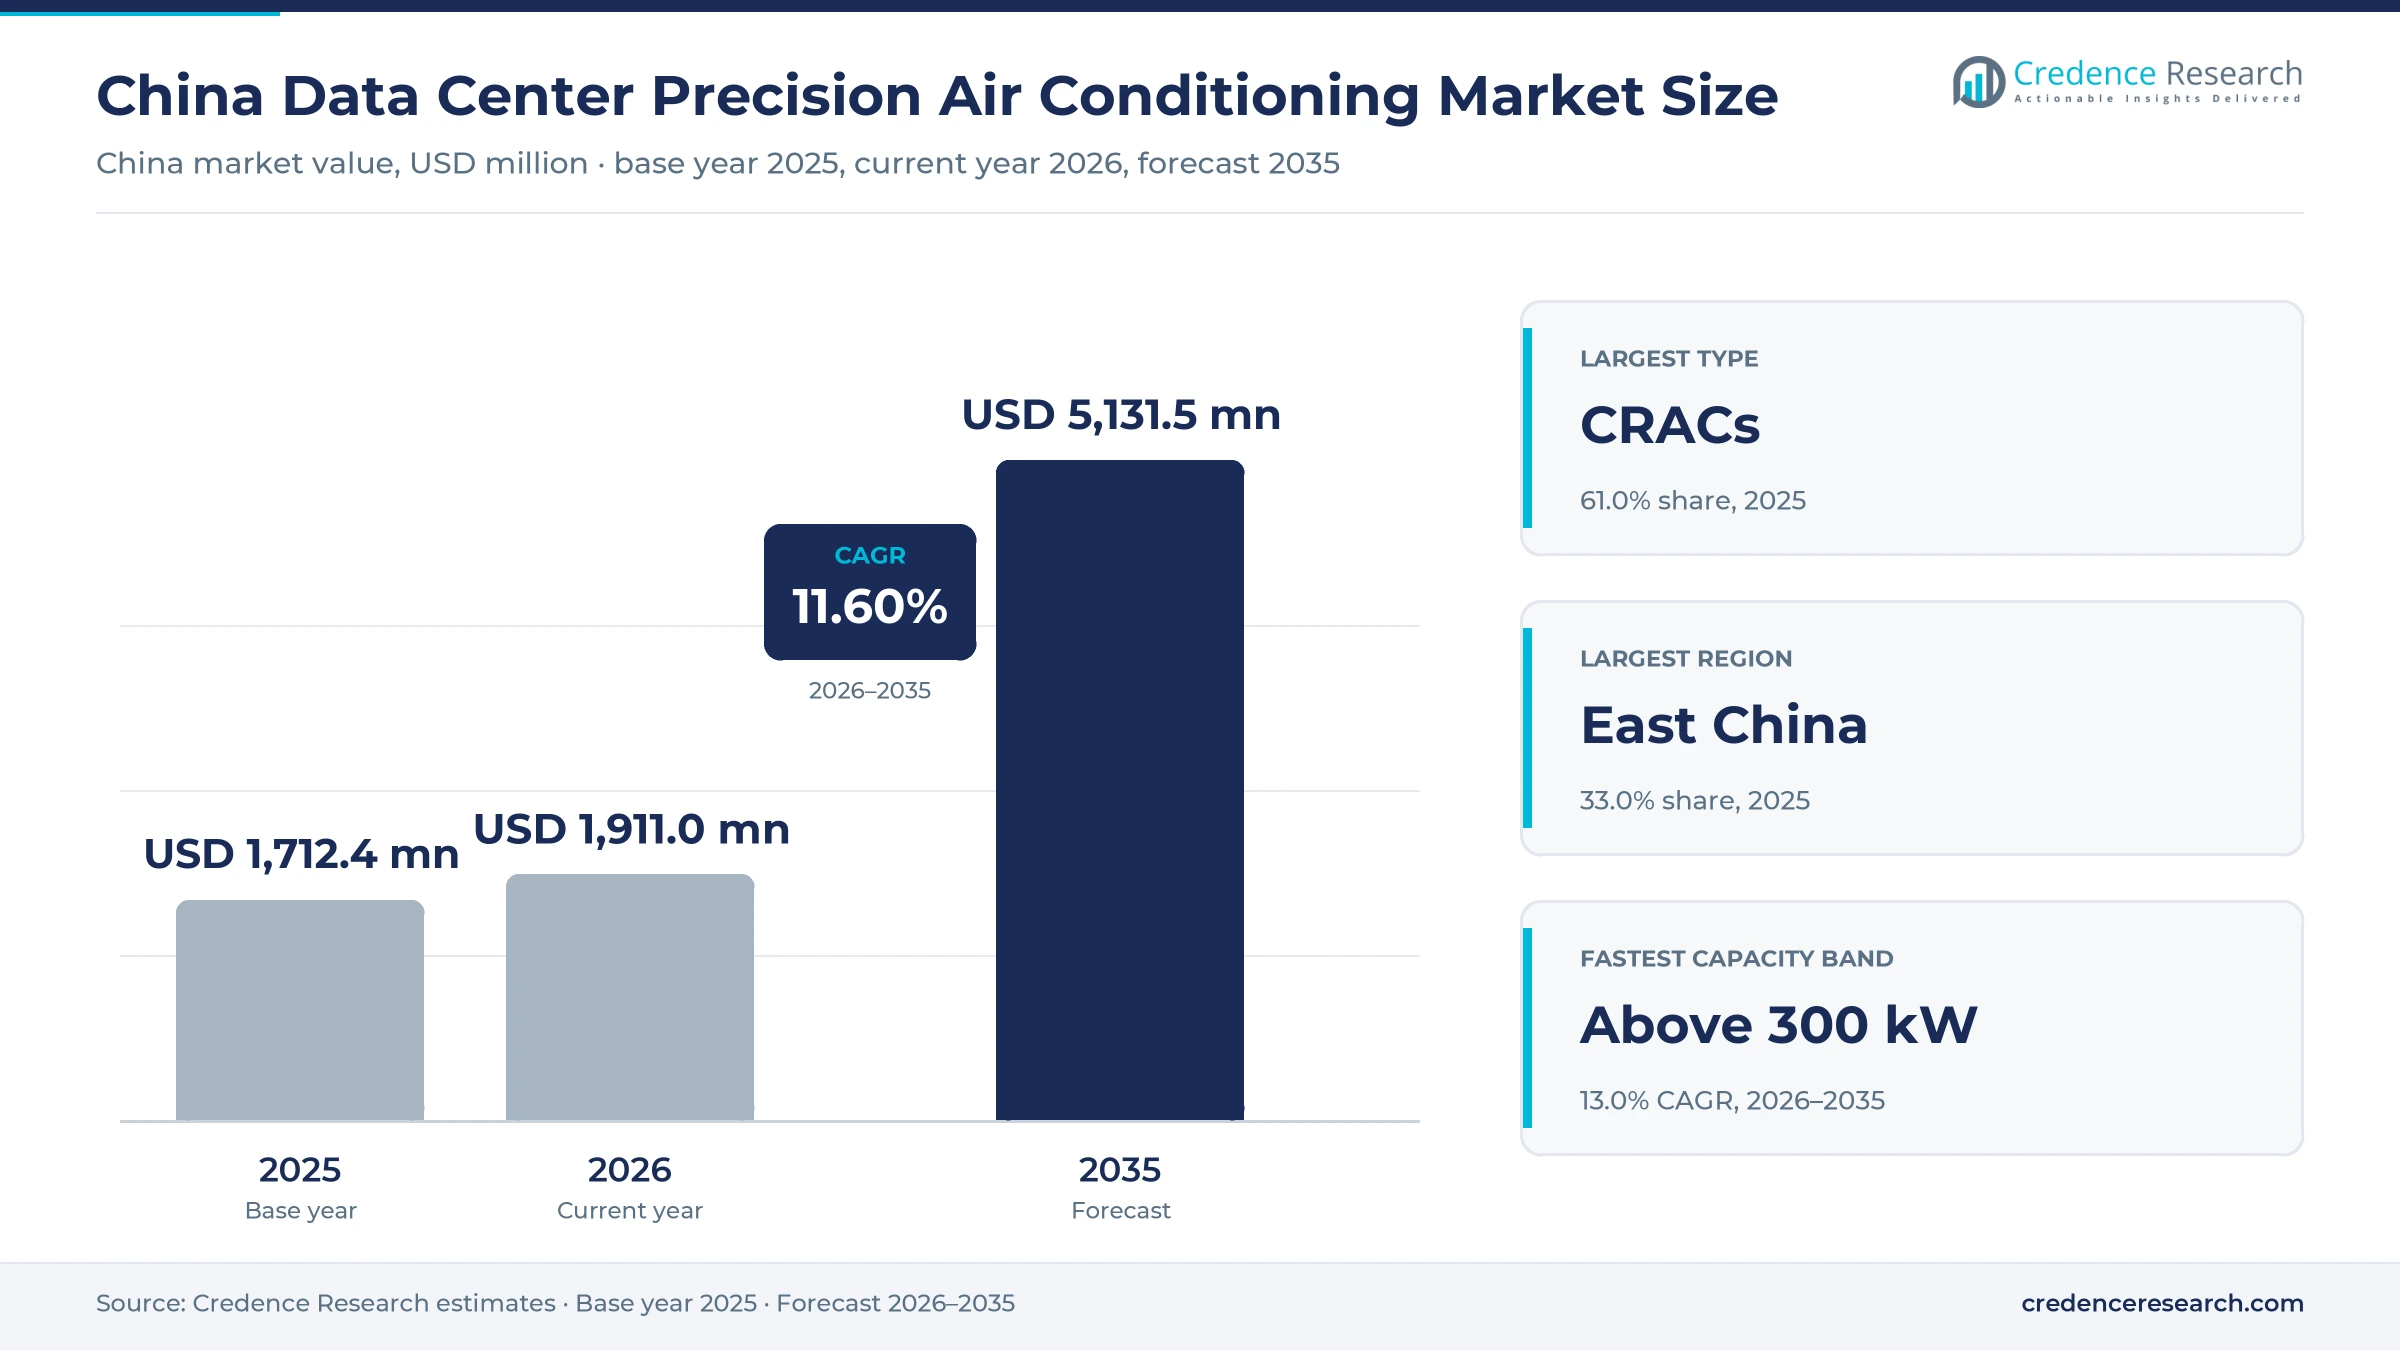
China Data Center Precision Air Conditioning Market Insights
- The China data center precision air conditioning market rises from USD 1.71 billion in 2025 to USD 5.13 billion by 2035, an 11.60% CAGR during 2026–2035, as rack counts and retrofit orders grow.
- East China held 33.0% of 2025 value, because the Yangtze River Delta concentrates colocation halls that serve finance, e-commerce and internet users.
- Computer Room Air Conditioners (CRACs) led with 61.0% of 2025 value, because room-level units remain the default in standard-density halls and server rooms.
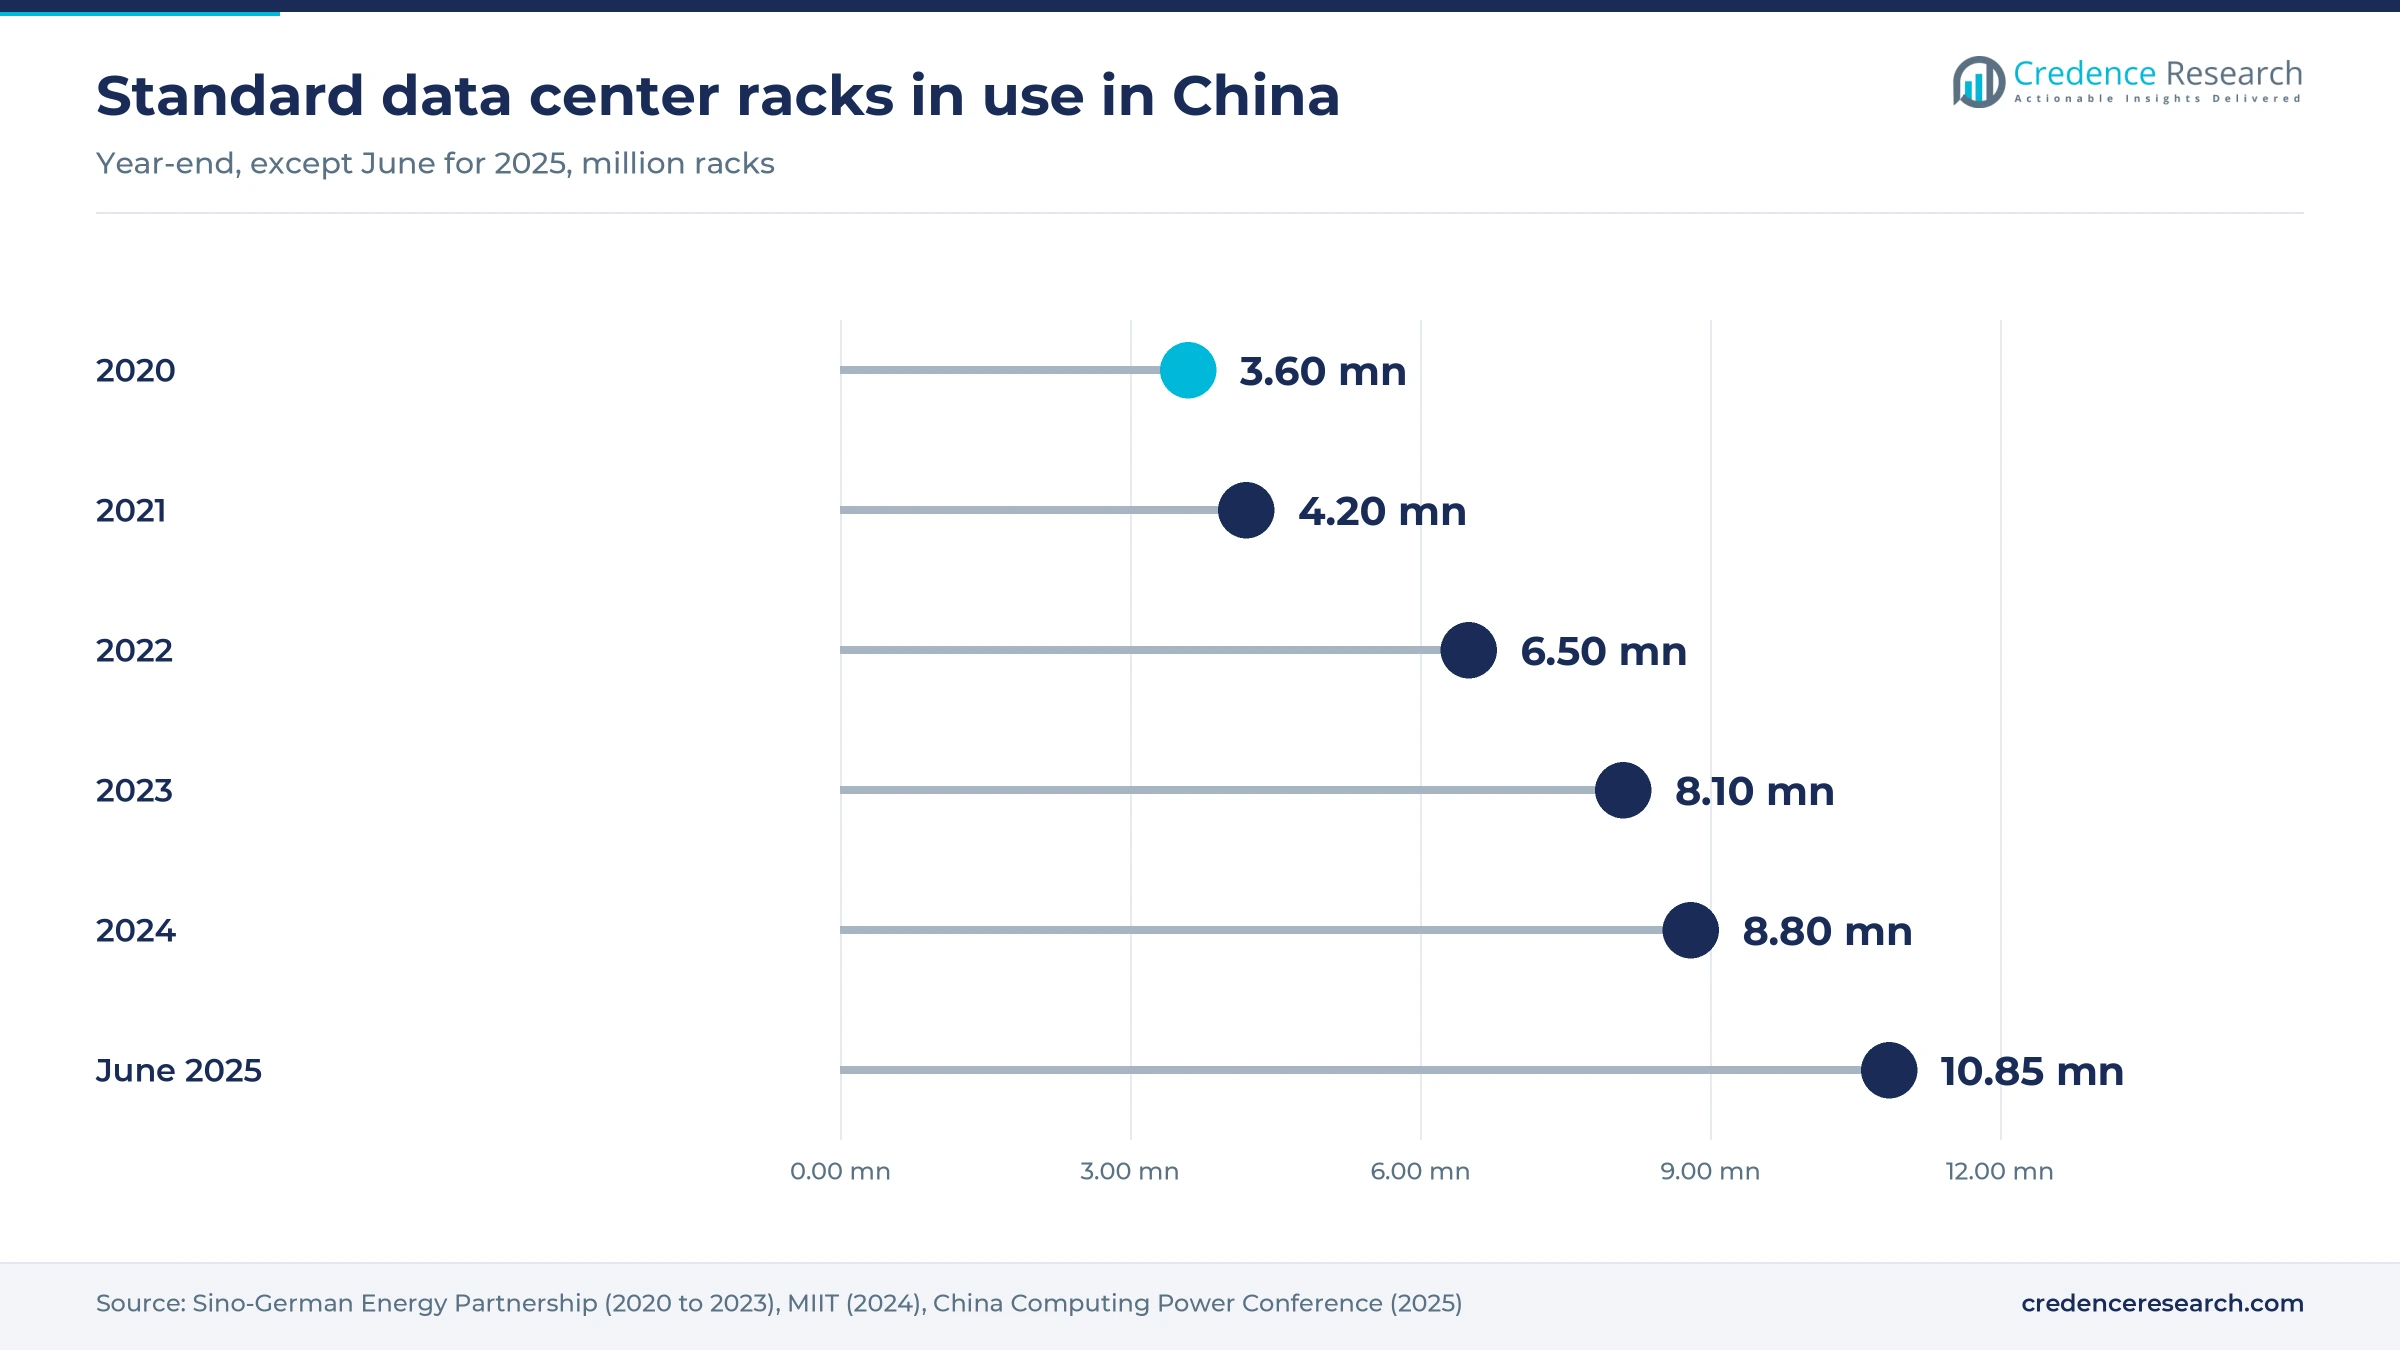
- Standard racks in use reached 10.85 million by the end of June 2025, according to data released at the 2025 China Computing Power Conference.
- The national average PUE fell to 1.42 by mid-2025 against a target below 1.5, which pushes buyers toward variable-speed and economizer air units.
Room units lead as close-coupled and large units gain
Room-level units lead while close-coupled units gain
Based on type, the market is categorized into computer room air conditioners (CRACs) and close coupled computer room air handlers (CCRAHs). Computer Room Air Conditioners (CRACs) led with 61.0% of 2025 value because most halls still cool standard-density rows from the room perimeter, and telecom operators keep buying them, as Canatal installed integrated fluorinated-pump room units for a new China Mobile data center in 2024, Copeland said in December 2025. Close Coupled Computer Room Air Handlers (CCRAHs) grow fastest at 12.5% a year, as the Ministry of Industry and Information Technology counts 42 intelligent computing clusters of 10,000 accelerator cards, whose hot rows need cooling placed beside the racks.
Small room units lead while large air handlers grow
Based on capacity, the market is categorized into four cooling capacity classes, from the smallest room units to the largest hub air handlers. Below 100 kW led with 36.0% of 2025 value because most installed halls are older eastern sites built around many small units, while the eight national hubs held only about 1.95 million racks by mid-2024, Xinhua reported. Above 300 kW grows fastest at 13.0% a year, as hub campuses buy large indirect evaporative air handlers, and Huawei lists a 400 kW version of its FusionCol range for cloud and carrier halls that need fewer, bigger units.
New halls lead while retrofits of old sites grow fastest
Based on deployment, the market is categorized into new installations, retrofits and upgrades. New Installations led with 66.0% of 2025 value because operators added roughly two million standard racks between the end of 2024 and June 2025, and every new hall needs a full cooling fit-out. Retrofits grow fastest at 12.5% a year, as Beijing, Ningxia and Gansu are phasing out low-efficiency facilities, Carbon Brief reported in 2025, which forces owners of older halls to replace fixed-speed units or close sites.
Data center halls lead and also add the most value
Based on application, the market is categorized into data centers, server rooms and telecommunication facilities. Data Centers led with 73.0% of 2025 value because cloud, colocation and AI halls carry the heaviest heat loads, and national computing power reached 280 EFLOPS at the end of 2024, 90 EFLOPS of it intelligent computing, China Daily reported from ministry data. Data Centers also grow fastest at 12.0% a year, as Inner Mongolia alone reported 94,000 petaflops of green computing capacity in 2024, which shifts new orders toward hub-scale halls rather than enterprise rooms.
| Segment Group | Leading Sub-segment | Share, 2025 | Fastest-growing Sub-segment | CAGR, 2026–2035 |
|---|---|---|---|---|
| By Type | Computer Room Air Conditioners (CRACs) | 61.0% | Close Coupled Computer Room Air Handlers (CCRAHs) | 12.5% |
| By Capacity | Below 100 kW | 36.0% | Above 300 kW | 13.0% |
| By Deployment | New Installations | 66.0% | Retrofits | 12.5% |
| By Application | Data Centers | 73.0% | Data Centers | 12.0% |
Cooling capacity and economizer mode set unit prices
Precision cooling units in China are priced per kilowatt of cooling capacity, with installation, piping and service contracts quoted separately. No supplier publishes list prices for these units in China, so the per-kilowatt ranges below are Credence Research estimates and carry wide error bands. Room units for standard halls are bought in large tenders where domestic makers press prices, while in-row units cost more per kilowatt because each unit is smaller and carries its own controls. Indirect evaporative air handlers cost less per kilowatt at scale but need water treatment and outdoor space. Power price matters as much as purchase price, because cheap western electricity lowers the payback on premium efficiency features.
| Offer or input | Typical price or fee | Basis |
|---|---|---|
| Room-level CRAC, 20 kW to 100 kW, direct expansion or chilled water | RMB 1,800 to RMB 3,000 per kW of cooling | Credence Research estimate; no public list price, wide error band |
| Close-coupled in-row unit, 20 kW to 60 kW | RMB 2,500 to RMB 4,000 per kW of cooling | Credence Research estimate; smaller units carry own controls |
| Indirect evaporative air handler, 200 kW to 400 kW | RMB 1,200 to RMB 2,000 per kW of cooling | Credence Research estimate; unit sizes per Huawei FusionCol range |
| Electricity at a Horinger computing center, Inner Mongolia | RMB 0.32 per kWh | China Daily, May 2025 |
Request a Free Sample
Fill in your details and we'll send you a free sample report.
- Sample data tables & charts
- Research methodology
Rack additions and efficiency targets lift unit orders
Rack additions keep cooling unit order books full
The number of racks in service keeps climbing by more than a million a year, and each new hall needs perimeter or in-row units before servers can run. The National Development and Reform Commission said racks in use exceeded 8.1 million at the end of 2023. The count passed 8.8 million in 2024, while computing capacity grew 16.5% from the end of 2023, the Ministry of Industry and Information Technology reported in January 2025. Data released at the 2025 China Computing Power Conference showed 10.85 million standard racks by the end of June 2025. These additions give unit makers multiyear volume, although the share of heat carried by air in each new hall is starting to fall.
PUE ceilings push buyers toward efficient air units
Energy efficiency rules now decide which cooling units operators can install, because cooling is the largest load after IT equipment. The green and low-carbon action plan issued in July 2024 targets an average power usage effectiveness below 1.5 by the end of 2025 and a 10% yearly rise in renewable use, the State Council said. Ventilation and cooling account for about 35% of energy use in sampled facilities, according to a Sino-German Energy Partnership presentation. The national average fell to 1.42 by mid-2025, conference data showed. Owners therefore pay more for variable-speed compressors, EC fans and economizer modes that cut operating hours of mechanical cooling.
AI computing targets raise heat loads in each hall
Intelligent computing is the fastest-growing source of heat in Chinese halls, and it raises the cooling capacity buyers specify per row. Total computing power reached 280 EFLOPS at the end of 2024, with a 2025 target of 300 EFLOPS and AI computing expected to reach 35% of the total, China Daily reported from ministry data in May 2025. Intelligent computing reached 788 EFLOPS (FP16) by June 2025, conference data showed. The ministry counts 42 clusters of 10,000 accelerator cards, Tom's Hardware reported in February 2026. AI halls move the hottest racks to liquid loops, yet they still need air units for memory, storage, network gear and room heat.
East Data West Computing funds new hub campuses
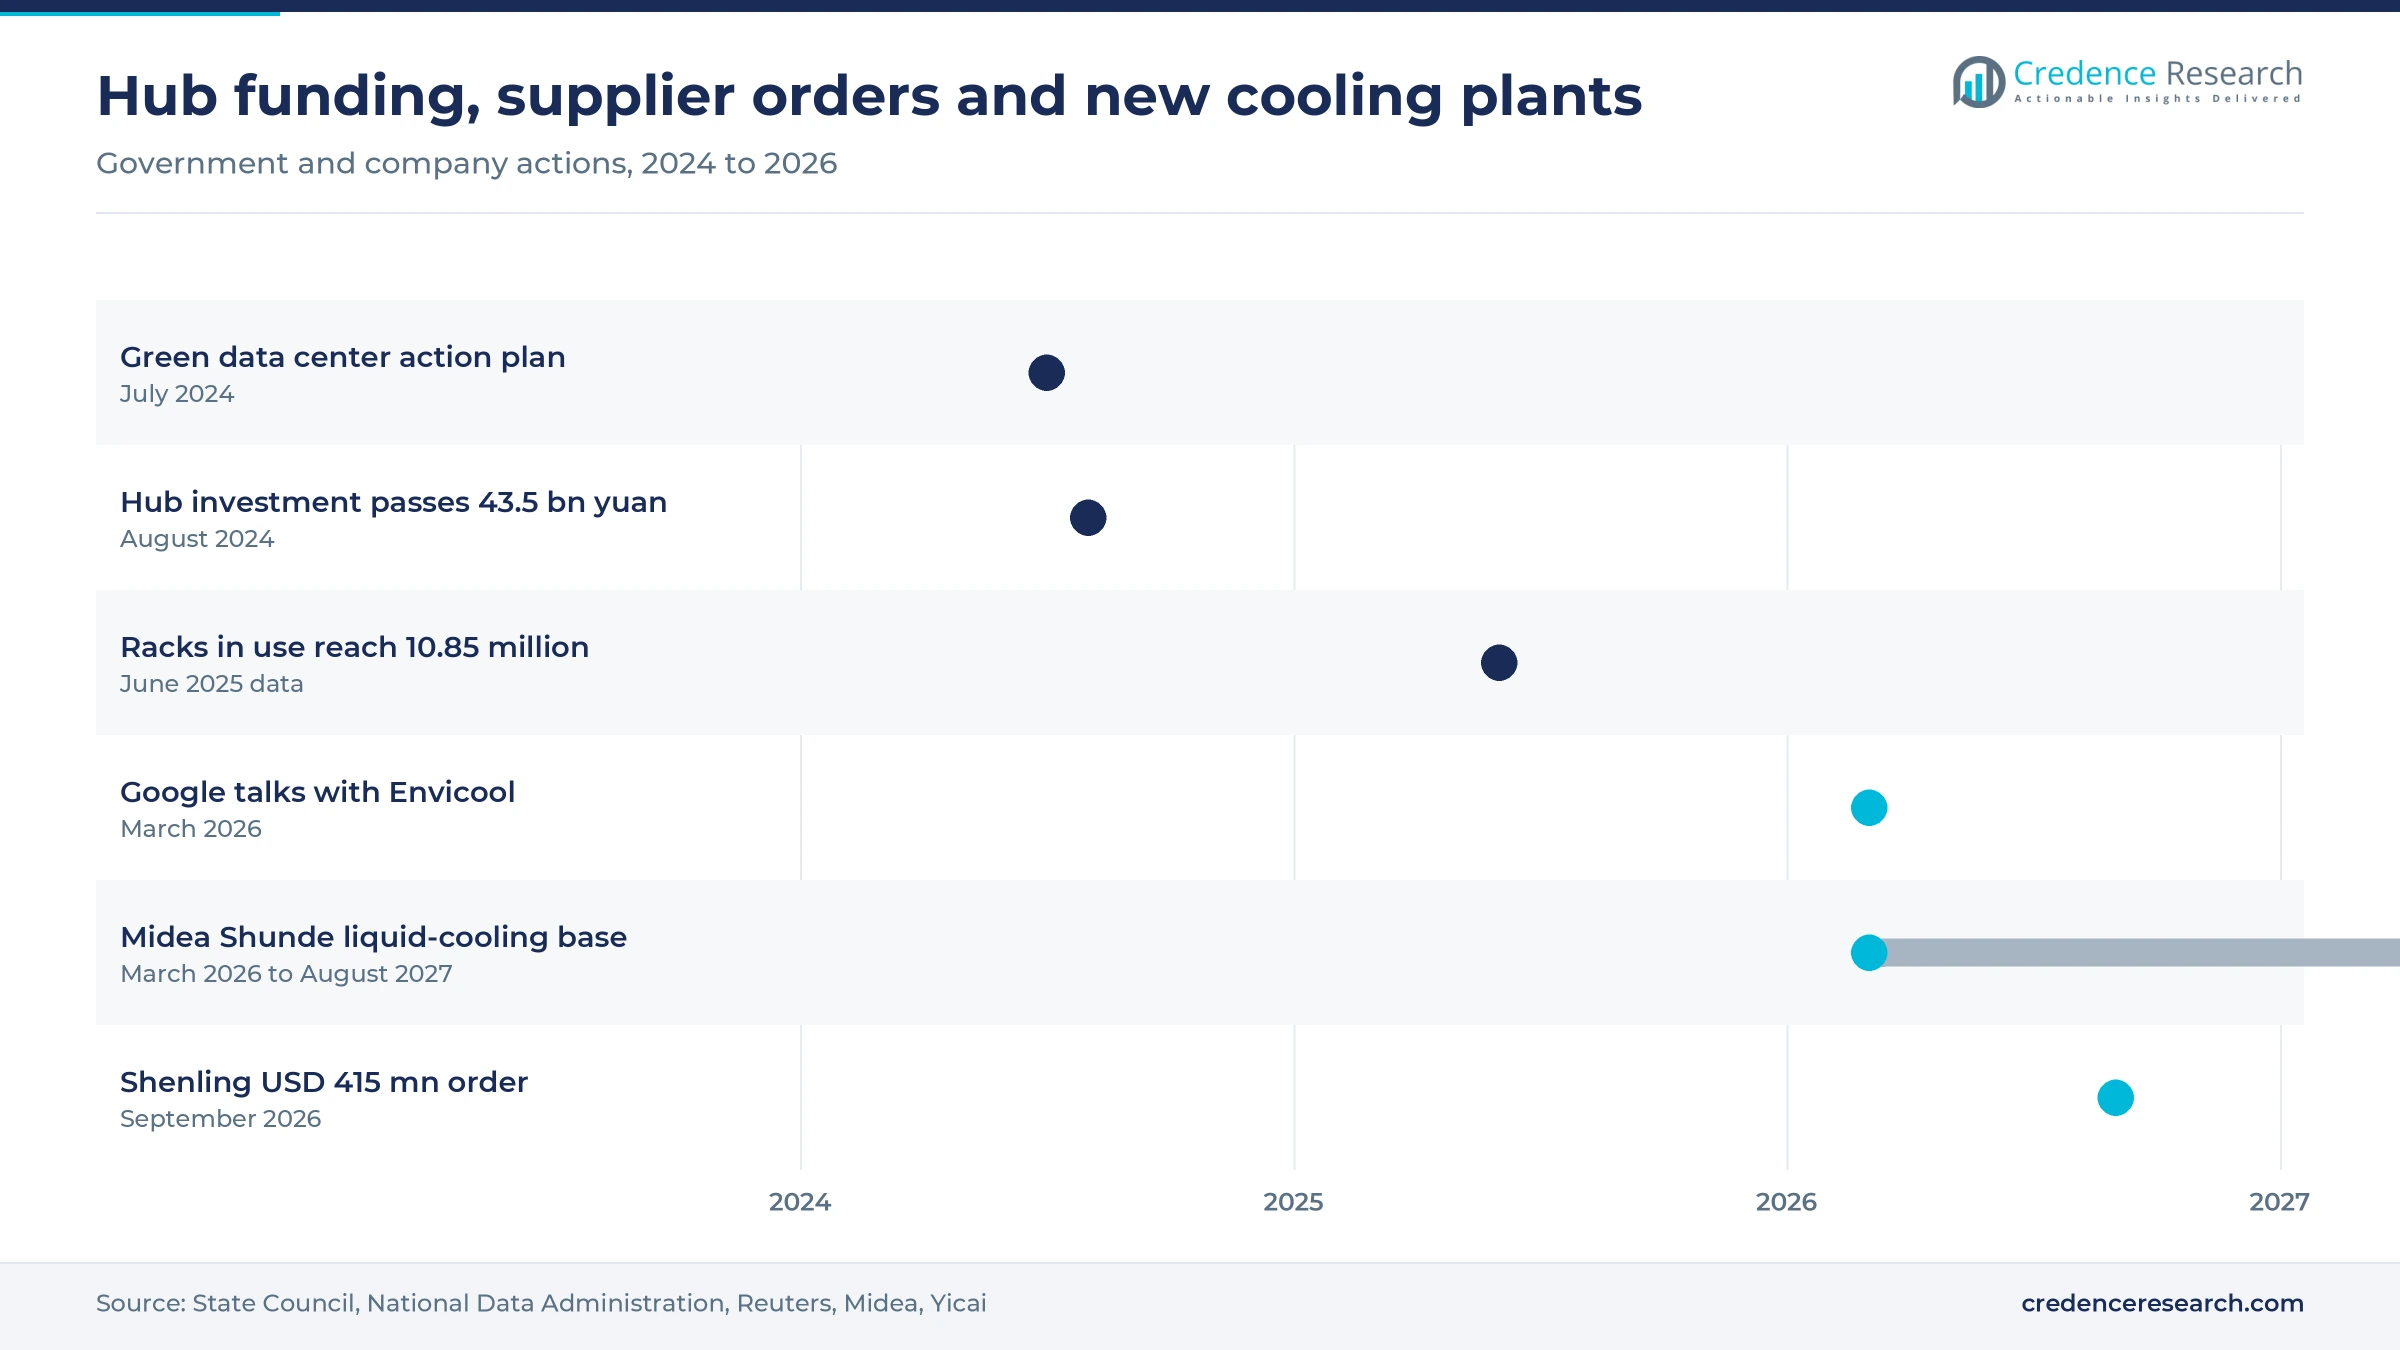
The national hub program is moving new capacity into regions with cheap power and cool climates, which changes what type of air unit buyers order. By the end of June 2024, the state had invested more than 43.5 billion yuan directly in eight computing hubs, Xinhua reported, citing National Data Administration head Liu Liehong. Total investment driven by the hubs passed 200 billion yuan, and hub racks exceeded 1.95 million. Network latency between eastern and western hubs has generally met the 20-millisecond requirement, Liu said. Hub campuses favor large indirect evaporative and free-cooling air handlers, which rewards suppliers with high-capacity designs.
Liquid loops and pumped refrigerant reshape air units
Liquid loops shift air units to a supporting role
AI hall designers are shifting the hottest racks to liquid cooling, which leaves precision air units to remove residual heat rather than the full load. China's first national standard for cold-plate liquid cooling, GB/T 48023-2026, takes effect on Feb. 1, 2027, and the main base of the Guizhou national hub already runs liquid-cooled cabinets at 12 kW to 24 kW with a system PUE below 1.1, Economic Daily reported in September 2026. Google's procurement team held talks with Envicool about liquid cooling equipment in March 2026, Reuters reported. Shenling holds a leading position in coolant distribution units for AI computing, Yicai reported. Suppliers that sell air units, distribution units and controls as one package gain, while pure room-unit makers lose value per rack.
Pumped refrigerant and evaporative designs replace DX
Operators are shifting from fixed-speed direct-expansion units toward pumped-refrigerant economizers and indirect evaporative air handlers that use outdoor air for more hours each year. Canatal fitted Copeland variable-speed scroll compressors to its ECS integrated fluorinated-pump air conditioners for a China Mobile data center in Suzhou, the compressor maker said in December 2025. Huawei claims a PUE below 1.25 and water use effectiveness below 1.1 for its FusionCol8000-E indirect evaporative units, and says their EC fans move 45% more air than a traditional fan. Ventilation and cooling already take about a third of energy in the sampled facilities noted above, so each extra hour on economizer mode removes a large share of compressor load. Domestic makers that already sell economizer designs, such as Canatal and Huawei, are best placed in these tenders.
Eastern legacy halls open a retrofit replacement cycle
Older halls in eastern cities give suppliers a replacement opening, because their cooling plants predate current efficiency rules. The national average PUE was 1.48 at the end of the 2021 three-year action plan, Carbon Brief reported, citing the China Academy of Information and Communications Technology. Efficient hyperscale sites spend about 7% of power on cooling, against more than 30% in less-efficient enterprise facilities, according to the International Energy Agency. Much of the installed rack base counted above sits in these older eastern halls, where enterprise-style cooling shares persist. Suppliers offering staged unit swaps without downtime can win banks, carriers and government sites that cannot move their workloads west.
Western hub campuses create demand for large air handlers
New hub campuses in Inner Mongolia and the west create an opening for high-capacity air handlers that run on outdoor air for most of the year. China Datang is building a three-phase data center in Ulanqab that will house 6,400 racks, China Daily reported in May 2025. China Mobile's Hohhot intelligent computing center runs at 6,700 petaflops, the largest single telecom-operated site of its kind, China Daily added. Inner Mongolia's green computing capacity reached 94,000 petaflops in 2024. Suppliers with stock and service crews near Horinger and Ulanqab can win phased orders, because hub operators add halls in stages and reward fast commissioning of each new phase.
Liquid substitution, HFC quotas and water limits bite
Liquid cooling cuts air unit value in AI halls
Liquid cooling becomes critical above about 20 kW per rack, Midea Building Technologies said in May 2026, and AI halls in China now exceed that level routinely. Each cold-plate rack moves most of its heat into a liquid loop, so the air side shrinks to residual load. Room-unit specialists without distribution units or rear-door products are most exposed, because their value per new rack falls even as rack counts rise. Hybrid packages that combine air and liquid limit the loss.
HFC quotas tighten refrigerant supply and costs
The Ministry of Ecology and Environment set 2024 hydrofluorocarbon quotas at 1.853 billion tons of CO2 equivalent for production and 0.895 billion tons for domestic use, under the Kigali Amendment phase-down. Direct-expansion units depend on these refrigerant gases, so tighter quotas raise charging and service costs. Makers of smaller room units and service firms with large installed fleets are most exposed. Lower-charge pumped-refrigerant and evaporative designs reduce that exposure for both groups.
Eastern power limits slow new hall approvals
Data center power use in China is set to rise by around 175 TWh, or 170%, by 2030 in the base case, the International Energy Agency projects, while the July 2024 plan expects demand growth of about 15% a year. Eastern grids draw about 70% of their electricity from coal, Carbon Brief reported, citing the agency, which makes energy-use approvals for new halls in Shanghai and Beijing harder to obtain. Unit makers that depend on eastern colocation orders are most exposed, while suppliers with hub-campus designs can follow capacity west.
Water rules limit evaporative cooling in dry regions
Beijing, Ningxia and Gansu are mandating higher water-use efficiency for data centers, Carbon Brief reported in 2025, and evaporative designs consume water when outdoor air is too warm for dry operation, which is why Huawei advertises a water use effectiveness below 1.1 for its FusionCol units. Ningxia and Gansu host national hubs, so the rule hits the regions where large evaporative air handlers would otherwise grow fastest. Operators may choose dry coolers or pumped refrigerant instead, which favors suppliers that offer several economizer types.
Eastern halls buy most while western hubs grow fastest
Credence Research groups mainland China into four zones, East China (Shanghai, Jiangsu, Zhejiang, Anhui, Shandong and Fujian), North China (Beijing, Tianjin, Hebei, Shanxi, Inner Mongolia and the northeast), South China (Guangdong, Guangxi and Hainan), and West China (Sichuan, Chongqing, Guizhou, Gansu, Ningxia and the rest of the west). Regional shares are Credence Research estimates based on rack locations and hub build-out.
| Region | Value, 2025 (USD billion) | Share, 2025 | CAGR, 2026–2035 |
|---|---|---|---|
| East China | 0.57 | 33.0% | 10.6% |
| North China | 0.50 | 29.0% | 12.0% |
| South China | 0.36 | 21.0% | 11.2% |
| West China | 0.29 | 17.0% | 13.3% |
East China leads on dense colocation near users
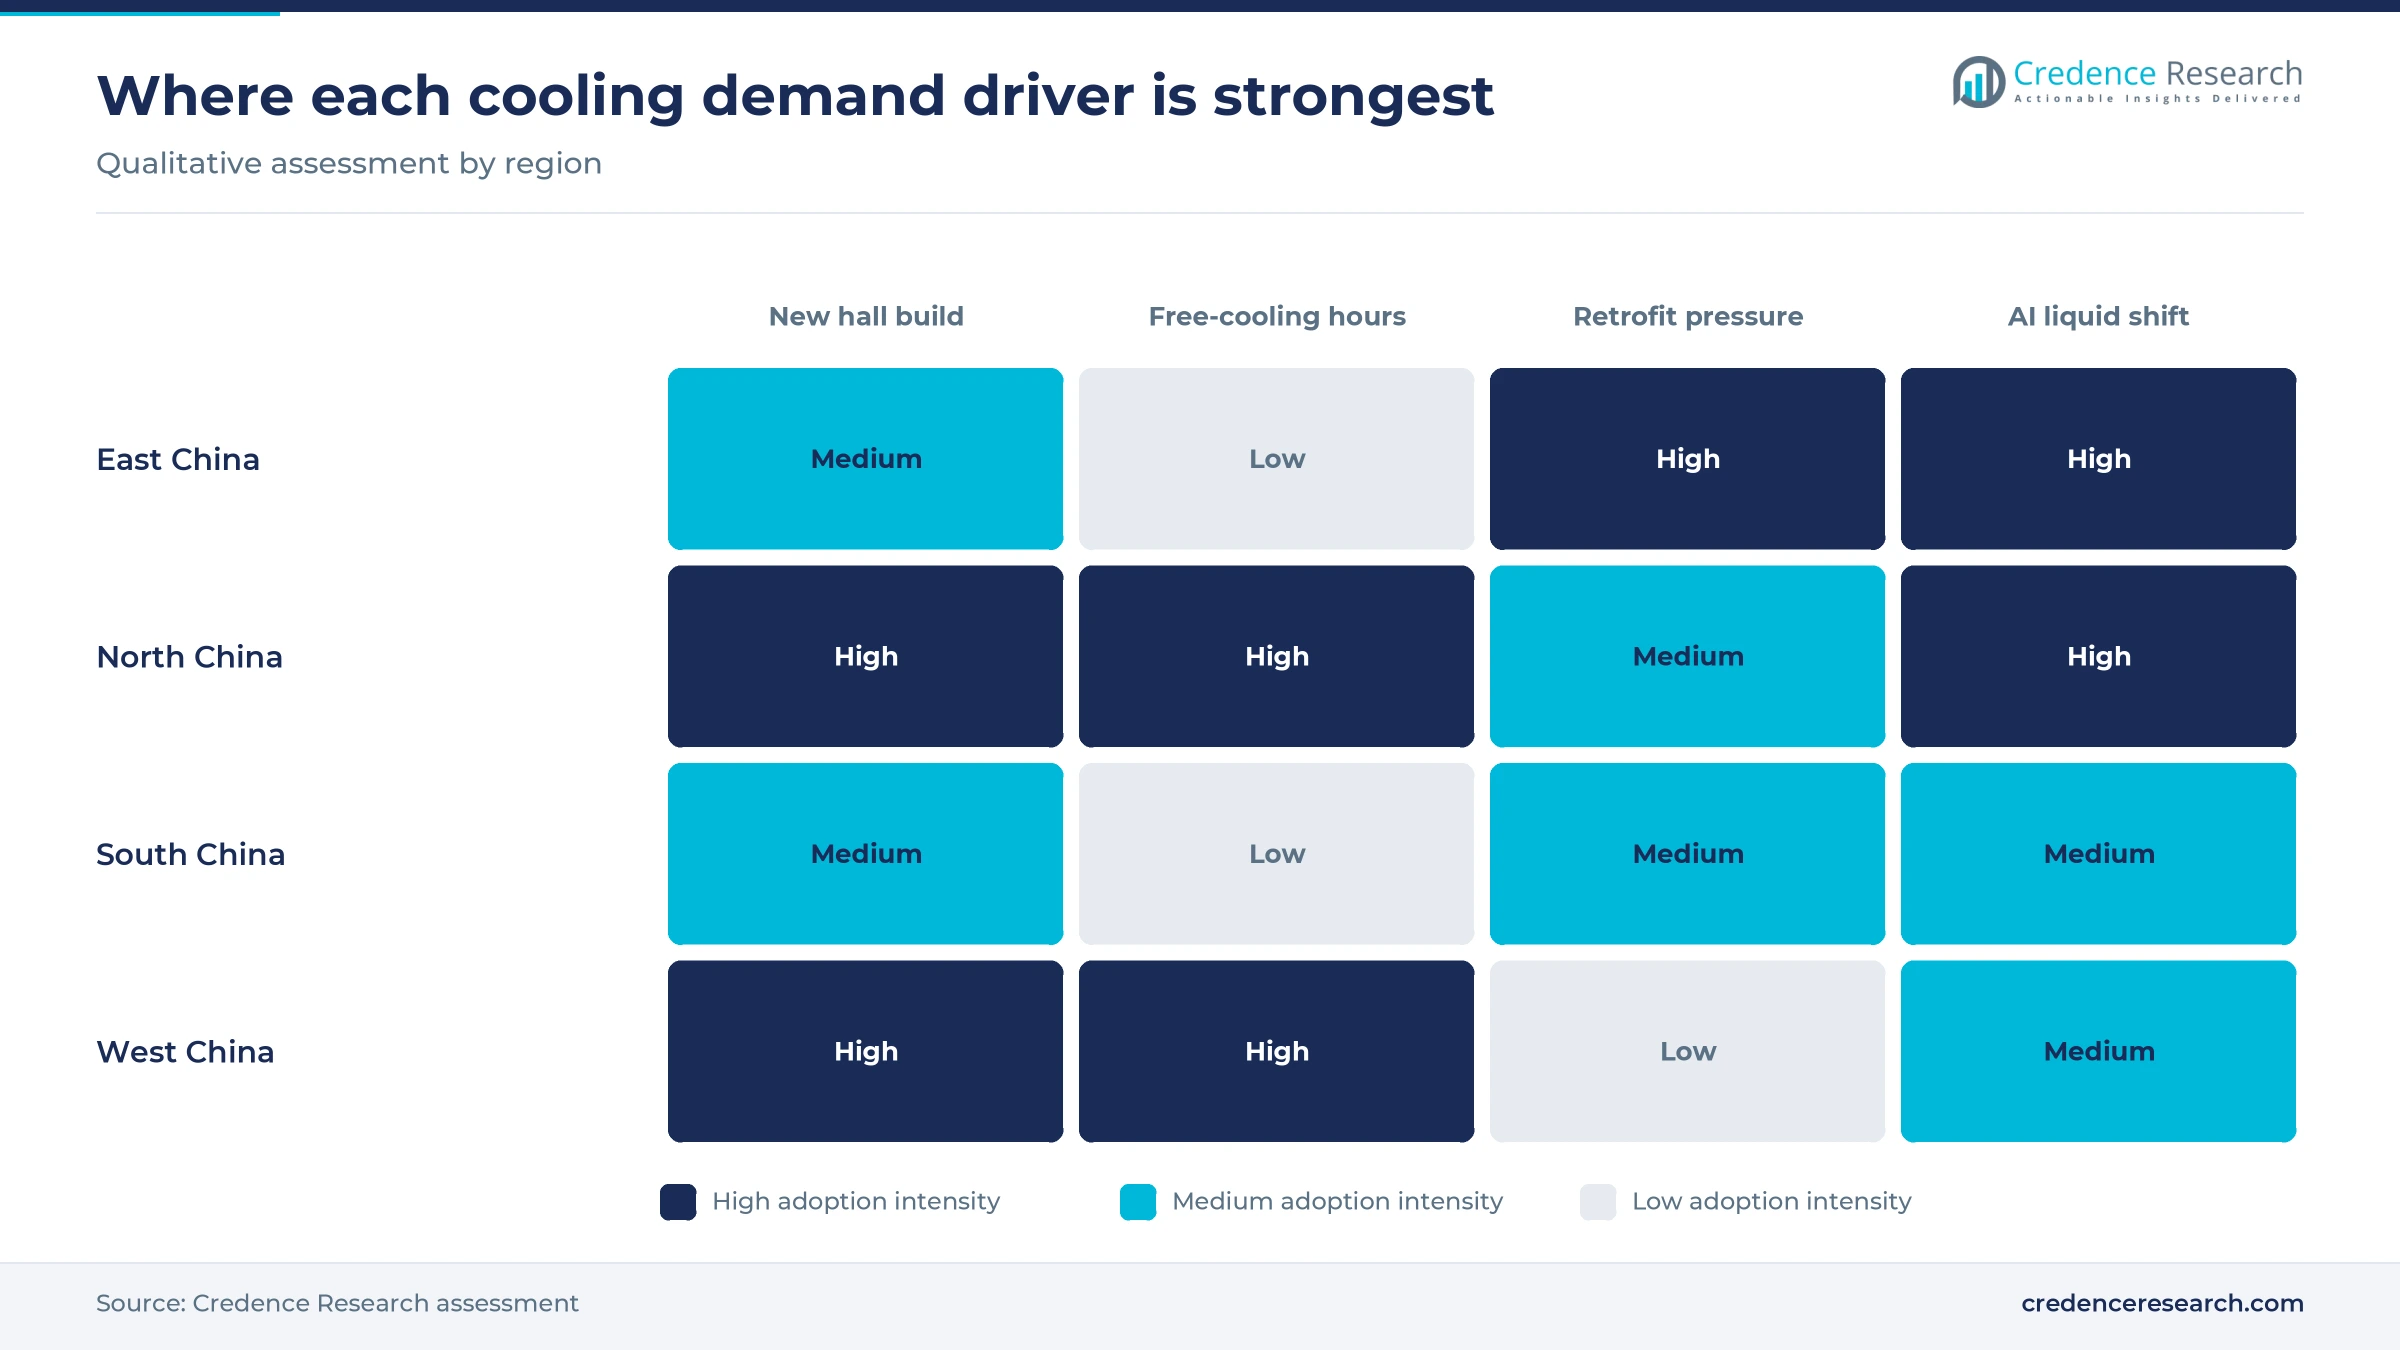
East China held a 33.0% share of 2025 value and grows at 10.6% a year. The Yangtze River Delta is one of three eastern demand clusters named in the Sino-German Energy Partnership presentation, and campuses in Shanghai, Suzhou and Hangzhou concentrate the zone's orders. Telecom operators here are moving to room units with pumped-refrigerant modes, the shift described in the trends section. Tight power quotas and high land costs slow new halls, so retrofits and upgrades form a larger part of eastern spending than elsewhere.
North China gains from cold Inner Mongolia campuses
North China held a 29.0% share of 2025 value and grows at 12.0% a year. Beijing remains a large buyer of retrofit units, while new capacity moves to Inner Mongolia. A Horinger operator cited an average annual temperature of 7 C and power at 0.32 yuan per kilowatt-hour, with operating costs two-thirds lower than similar centers in Beijing, China Daily reported in May 2025. Cold air allows free cooling for much of the year, which favors indirect evaporative and air-side economizer units over compressor-heavy designs.
South China pairs hyperscale halls with local makers
South China held a 21.0% share of 2025 value and grows at 11.2% a year. Guangdong hosts the Shaoguan hub cluster and the home bases of Envicool in Shenzhen and Shenling and Midea in Shunde, which shortens delivery and service routes. Midea broke ground on a Shunde liquid-cooling base worth more than 1 billion yuan in March 2026, due to operate in August 2027. Hot, humid summers limit free-cooling hours, so southern halls keep more mechanical cooling than northern sites.
West China grows fastest on national hub build-out
West China held a 17.0% share of 2025 value and grows at 13.3% a year, the fastest rate of the four zones. Guizhou, Gansu, Ningxia and Chengdu-Chongqing host national hubs, and newly built hub data centers have reached a PUE as low as 1.04, the National Data Administration said in August 2024. These campuses buy large air handlers in phased lots as each hall opens. Water rules in Ningxia and Gansu shape the design mix, and long distances raise service costs for suppliers without local crews.
Hub funding, supplier orders and new cooling plants
| Development | Status and market relevance |
|---|---|
| In July 2024, the NDRC, MIIT and two other central agencies issued a green data center action plan targeting an average PUE below 1.5 by the end of 2025. | Policy issued; targets apply nationally through 2025, with 2030 goals to follow. |
| In August 2024, the National Data Administration said direct investment in the eight computing hubs had passed 43.5 billion yuan. | Progress report; hub construction continues under the East Data West Computing program. |
| In March 2026, a Google procurement team held talks with Envicool and other Chinese firms about buying liquid cooling equipment, Reuters reported. | Negotiation; no order announced. |
| In March 2026, Midea broke ground on a Shunde liquid-cooling manufacturing base worth more than 1 billion yuan. | Under construction; operations expected in August 2027. |
| In September 2026, Shenling signed a USD 415 million air cooling equipment order with an overseas client. | Order signed; delivery due within 120 days. |
Evaporative, pumped refrigerant and in-row designs
- Indirect evaporative air handlers cool hall air through a heat exchanger with outdoor air and water spray, which keeps compressors off for most hours in northern hubs.
- Pumped-refrigerant economizers circulate refrigerant with a pump instead of a compressor in cold weather, which cuts energy use in room units.
- Variable-speed compressors and EC fans match cooling output to IT load, which lowers power draw in halls that run below design capacity.
- In-row and rear-door units place cooling beside dense racks, which shortens airflow paths in halls that mix air and liquid cooling.
Need a Custom Version of This Report?
Tailor the scope, geography, or segments to your exact requirements.
- Custom geography or segment scope
- Direct access to our analyst team
Domestic thermal makers challenge global cooling brands
Competition in the China data center precision air conditioning market splits between domestic thermal makers and global cooling brands. Envicool, Shenling and Canatal supply room, in-row and pumped-refrigerant units to operators and internet firms, and Shenling counts Huawei, ByteDance, Tencent, Alibaba and JD among its clients, Yicai reported. Huawei sells FusionCol indirect evaporative units with its power systems. Vertiv, Schneider Electric and STULZ compete on high-specification halls, while Midea brings chillers and distribution units. Rittal and Daikin serve smaller rooms and rack-level needs through their enclosure and HVAC channels. Buyers judge suppliers on partial-load efficiency, qualification on telecom operator vendor lists, delivery lead times and national service coverage, because a failed unit can stop a hall. Price pressure is strongest in large operator tenders, where domestic makers compete hardest, and Vertiv's worldwide room-level cooling scale supports its position with multinational buyers.
How is the supply side organized?
The supply side serving Chinese buyers runs in three distinct tiers. Domestic thermal specialists, led by Envicool, Shenling and Canatal, compete for operator and internet tenders on price, delivery and local service, and Huawei sells indirect evaporative units inside its digital power offer. Global brands, led by Vertiv, Schneider Electric and STULZ, keep strong positions in banks, multinational colocation and high-specification halls. Appliance groups such as Midea are entering with chillers and distribution units. Entry barriers sit in operator qualification lists and national service networks, while margins sit in controls and service.
Cooling unit suppliers that buyers in China shortlist
| Company | Type | Role in the market |
|---|---|---|
| Vertiv | Full-line supplier | Sells Liebert room, in-row and chilled-water cooling units for data centers in China |
| Huawei Digital Power (Huawei) | Digital power supplier | Sells FusionCol indirect evaporative units for cloud and carrier halls |
| Shenzhen Envicool Technology | Domestic thermal specialist | Makes room, in-row and liquid cooling products for data centers |
| Guangdong Shenling Environmental Systems | Domestic thermal specialist | Supplies air cooling units and coolant distribution units to internet firms |
| Nanjing Canatal Data-Centre Environmental Tech | Domestic precision specialist | Makes room precision air conditioners and fluorinated-pump units for operators |
| Schneider Electric | Full-line supplier | Sells Uniflair room and in-row cooling units for data centers |
| Midea Building Technologies (Midea Group) | Diversified HVAC maker | Sells data center chillers, distribution units and cooling systems |
| STULZ | Precision cooling specialist | Sells CyberAir room units and in-row cooling for data centers |
| Daikin | Diversified HVAC maker | Sells data center air conditioning and chillers through its HVAC business |
| Rittal | Enclosure and rack cooling supplier | Sells rack-based cooling units and enclosures for IT rooms |
Air units keep a role as liquid takes the hottest racks
Credence Research's view is that precision air units keep a central role in Chinese facilities even as liquid cooling takes the hottest racks. Room-level units lead today because most installed halls run standard densities, yet new spending is moving toward large economizer air handlers on hub campuses and close-coupled units beside AI rows. Eastern retrofits under efficiency rules give a steady base of orders through 2030, while western hub campuses add large air handlers in phases as each hall opens. Suppliers that pair air units with distribution units, controls and national service crews should gain the most share.
Estimates rest on rack counts, unit prices and retrofits
The report uses 2025 as the base year and 2026 to 2035 as the forecast period. The 2025 value is a new Credence Research estimate that replaces the earlier estimate for 2023, because a check against rack counts, rack additions, cooling capacity per rack, prices per kilowatt and replacement cycles gave a lower value. Market values come from the Credence Research model, and the regional, type, capacity, deployment and application splits are Credence Research estimates informed by public data. Sources include ministry and State Council releases, National Data Administration statements, the International Energy Agency, company announcements and business publishers. No interviews or surveys were used to build these estimates.
AI hall mix and eastern power limits shape value to 2035
Credence Research expects precision cooling value to reach USD 5.13 billion by 2035 as hub campuses fill, eastern halls retrofit and AI halls settle on hybrid air and liquid designs. Growth slows after 2030 as liquid loops carry more heat per rack, but rack counts and efficiency rules keep demand rising. Close-coupled units and large hub air handlers add the most value, as dense AI rows need cooling beside the racks, while small room units for enterprise rooms grow slowly. Refrigerant quotas, water rules and eastern power limits are the main risks to that path.
Liquid uptake and hub timing set the range
The range to 2035 depends mainly on how quickly liquid cooling takes heat away from air units in AI halls and on how fast western hubs fill their racks. Eastern retrofits support every case, because older halls must meet efficiency rules. Faster hub occupancy adds large air handler orders, while a sharp shift to immersion cooling would cut air value per rack in every new hall.
| Scenario | CAGR, 2026–2035 | Value, 2035 | What has to hold |
|---|---|---|---|
| Downside | 9.6% | USD 4.36 billion | Liquid cooling takes most new AI heat and eastern power quotas stall new halls |
| Base | 11.60% | USD 5.13 billion | Rack additions continue near the 2024 to 2025 pace with hybrid air and liquid halls |
| Upside | 13.4% | USD 5.93 billion | Western hubs fill quickly and eastern retrofits accelerate under stricter PUE rules |
Frequently Asked Questions
How big is the China data center precision air conditioning market?
How many data center racks are in use in China?
Which region leads demand for precision cooling in China?
Which unit type leads the market?
Will liquid cooling replace precision air conditioning in China?
What PUE targets apply to Chinese data centers?
Who are the main suppliers in this market?
What limits growth of precision cooling in China?
Table of Content
Chapter 1 Market Segmentation
- 1.1 Segmentation Framework
- 1.1.1 Product and Service Classification
- 1.1.2 Application and End-Use Classification
- 1.1.3 Technology and Solution Classification
- 1.1.4 Customer and Distribution Channel Classification
- 1.1.5 Geographic Segmentation
- 1.1.6 Market Segment Definitions and Boundaries
- 1.2 By Type
- 1.2.1 Computer Room Air Conditioners (CRACs)
- 1.2.2 Close Coupled Computer Room Air Handlers (CCRAHs)
- 1.3 By Capacity
- 1.3.1 Below 100 kW
- 1.3.2 100-200 kW
- 1.3.3 200-300 kW
- 1.3.4 Above 300 kW
- 1.4 By Deployment
- 1.4.1 New Installations
- 1.4.2 Retrofits
- 1.4.3 Upgrades
- 1.5 By Application
- 1.5.1 Data Centers
- 1.5.2 Server Rooms
- 1.5.3 Telecommunication Facilities
Chapter 2 Introduction
- 2.1 Report Objectives and Scope
- 2.2 Product Definition and Industry Terminology
- 2.3 Market Inclusions and Exclusions
- 2.4 Research Process
- 2.4.1 Primary Research and Expert Interviews
- 2.4.2 Secondary Research and Source Review
- 2.4.3 Top-Down and Bottom-Up Estimation
- 2.4.4 Data Triangulation and Verification
- 2.5 Market Size Measurement Basis
- 2.5.1 2025: USD 1.71 billion → 2035: USD 5.13 billion
- 2.6 Historical and Forecast Reference Periods
- 2.6.1 Historical Period: 2018-2025
- 2.6.2 Base Year: 2025
- 2.6.3 Forecast Period: 2025-2035
- 2.7 Research Assumptions and Limitations
Chapter 3 Executive Summary
- 3.1 Market Snapshot and Key Findings
- 3.2 Base-Year Market Size, 2025
- 3.3 Forecast Market Size, 2035
- 3.4 Revenue and Volume Growth Outlook
- 3.5 Key Demand and Supply Indicators
- 3.6 Leading Market Segments
- 3.7 Fastest-Growing Market Opportunities
- 3.8 Regional Performance Highlights
- 3.9 Technology and Industry Transformation
- 3.10 Competitive Landscape Summary
- 3.11 Analyst View and Strategic Implications
Chapter 4 China Data Center Precision Air Conditioning Market Trends and Developments
- 4.1 Historical Industry Development, 2018-2025
- 4.2 Recent Market Trends and Developments
- 4.3 Demand and Customer Behavior Trends
- 4.4 Technology and Product Innovation
- 4.5 Artificial Intelligence, Automation and Digitalization
- 4.6 Local Manufacturing and Supply Chain Realignment
- 4.7 Industry Partnerships, Mergers and Acquisitions
- 4.8 Sustainability and Circular Economy Developments
- 4.9 Government and Private Sector Investment Trends
- 4.10 Emerging Business Models and Commercialization
- 4.11 Industry Developments and Announcements
Chapter 5 China Data Center Precision Air Conditioning Market Production, Supply and Demand Analysis
- 5.1 Demand Trend and Consumption Analysis, 2018-2025
- 5.2 Demand Forecast, 2025-2035
- 5.3 Production and Output Trend, 2018-2025
- 5.4 Production and Output Forecast, 2025-2035
- 5.5 Installed Capacity and Capacity Utilization
- 5.6 Company-Wise Production Plants and Statistics
- 5.6.1 Installed Production Capacity
- 5.6.2 Actual Production
- 5.6.3 Planned Capacity and Expansion Targets
- 5.7 Supply Chain Structure and Procurement Trends
- 5.8 Supply-Demand Gap and Bottlenecks
- 5.9 Import Dependence and Sourcing Structure
- 5.10 Contract Manufacturing and Outsourcing
- 5.11 Regional Supply and Demand Concentration
Chapter 6 China Data Center Precision Air Conditioning Market Pricing Analysis
- 6.1 Pricing Structure and Measurement
- 6.2 Historical Pricing Trends, 2018-2025
- 6.3 Pricing Outlook, 2025-2035
- 6.4 Average Selling Price and Unit Economics
- 6.5 Pricing by Product and Market Segment
- 6.6 Geographic Pricing Differences
- 6.7 Key Input, Energy, Labor and Logistics Costs
- 6.8 Contract Pricing and Purchasing Models
- 6.9 Pricing Sensitivity and Competitive Positioning
- 6.10 Price, Margin and Profitability Implications
Chapter 7 China Data Center Precision Air Conditioning Market Dynamics
- 7.1 Market Growth Drivers
- 7.1.1 Demand-Side Drivers
- 7.1.2 Technology and Innovation Drivers
- 7.1.3 Infrastructure and Investment Drivers
- 7.1.4 Regulatory and Policy Drivers
- 7.2 Market Restraints
- 7.2.1 Cost and Affordability Constraints
- 7.2.2 Technology and Adoption Barriers
- 7.2.3 Supply Chain and Operational Constraints
- 7.3 Market Challenges
- 7.3.1 Competitive Pressure and Margin Erosion
- 7.3.2 Skills, Infrastructure and Implementation Gaps
- 7.4 Emerging Market Opportunities
- 7.5 Market Dynamics Impact and Time-Horizon Assessment
Chapter 8 China Data Center Precision Air Conditioning Value Chain Analysis
- 8.1 Industry Value Chain Overview
- 8.2 Upstream Suppliers and Critical Inputs
- 8.3 Technology and Component Providers
- 8.4 Manufacturing or Service Delivery
- 8.5 Distribution, Channel Partners and Integrators
- 8.6 Downstream Applications and End Users
- 8.7 Value Addition and Profit Pools
- 8.8 Vertical Integration and Outsourcing
- 8.9 Supplier Concentration and Risk
- 8.10 Supply Chain Localization and Resilience
Chapter 9 China Data Center Precision Air Conditioning Market Regulations and Policies
- 9.1 Relevant Laws, Standards and Compliance Frameworks
- 9.2 Product, Service, Safety and Quality Requirements
- 9.3 Government Policies, Incentives and Subsidies
- 9.4 Imports, Exports and Trade Barriers
- 9.5 Public Procurement and Local Content Requirements
- 9.6 Environmental and Sustainability Compliance
- 9.7 Data Protection, AI and Cybersecurity Compliance
- 9.8 Upcoming Policy Changes and Market Implications
Chapter 10 China Data Center Precision Air Conditioning Market Hotspots and Opportunities
- 10.1 Market Opportunity Mapping and Growth Hotspots
- 10.2 High-Growth Applications and Customer Groups
- 10.3 Underserved Markets and White-Space Opportunities
- 10.4 Emerging Technology and Product Opportunities
- 10.5 New Capacity and Investment Hotspots
- 10.6 Market Entry and Expansion Opportunities
- 10.7 Distribution and Partnership Opportunities
- 10.8 Near-Term and Long-Term Commercial Potential
- 10.9 Opportunity Attractiveness and Execution Risks
Chapter 11 China Data Center Precision Air Conditioning Market Outlook, 2025-2035
- 11.1 Market Size and Analysis
- 11.1.1 Revenue (Market Measurement: 2025: USD 1.71 billion → 2035: USD 5.13 billion)
- 11.1.2 Market Volume and Quantity Sold
- 11.1.3 Historical Market Size, 2018-2025
- 11.1.4 Base-Year Market Size, 2025
- 11.2 Market Forecast, 2025-2035
- 11.2.1 Revenue Forecast to 2035
- 11.2.2 Volume Forecast to 2035
- 11.2.3 CAGR and Year-on-Year Growth
- 11.2.4 Incremental Revenue Opportunity
- 11.3 Forecast Assumptions and Scenario Analysis
- 11.3.1 Base-Case Forecast
- 11.3.2 Optimistic and Conservative Scenarios
- 11.3.3 Technology, Pricing and Policy Sensitivities
- 11.4 Market Attractiveness and Growth Outlook
Chapter 12 China Data Center Precision Air Conditioning Market Segmentation and Outlook
- 12.1 Segmentation Summary and Market Shares, 2025
- 12.2 Largest and Fastest-Growing Segments
- 12.3 By Type - Market Size and Forecast, 2025-2035
- 12.3.1 Segment Definition and Scope
- 12.3.2 Historical Market Size, 2018-2025
- 12.3.3 Revenue Forecast, 2025-2035
- 12.3.4 Volume Forecast, 2025-2035
- 12.3.5 Base-Year Market Share, 2025
- 12.3.6 Segment CAGR and Growth Drivers
- 12.3.7 Subsegment Market Size and Forecast
- 12.3.7.1 Computer Room Air Conditioners (CRACs)
- 12.3.7.2 Close Coupled Computer Room Air Handlers (CCRAHs)
- 12.3.8 Subsegment Pricing and Adoption Trends
- 12.3.9 Leading Suppliers and Competition
- 12.3.10 Regional Demand and Opportunities
- 12.4 By Capacity - Market Size and Forecast, 2025-2035
- 12.4.1 Segment Definition and Scope
- 12.4.2 Historical Market Size, 2018-2025
- 12.4.3 Revenue Forecast, 2025-2035
- 12.4.4 Volume Forecast, 2025-2035
- 12.4.5 Base-Year Market Share, 2025
- 12.4.6 Segment CAGR and Growth Drivers
- 12.4.7 Subsegment Market Size and Forecast
- 12.4.7.1 Below 100 kW
- 12.4.7.2 100-200 kW
- 12.4.7.3 200-300 kW
- 12.4.7.4 Above 300 kW
- 12.4.8 Subsegment Pricing and Adoption Trends
- 12.4.9 Leading Suppliers and Competition
- 12.4.10 Regional Demand and Opportunities
- 12.5 By Deployment - Market Size and Forecast, 2025-2035
- 12.5.1 Segment Definition and Scope
- 12.5.2 Historical Market Size, 2018-2025
- 12.5.3 Revenue Forecast, 2025-2035
- 12.5.4 Volume Forecast, 2025-2035
- 12.5.5 Base-Year Market Share, 2025
- 12.5.6 Segment CAGR and Growth Drivers
- 12.5.7 Subsegment Market Size and Forecast
- 12.5.7.1 New Installations
- 12.5.7.2 Retrofits
- 12.5.7.3 Upgrades
- 12.5.8 Subsegment Pricing and Adoption Trends
- 12.5.9 Leading Suppliers and Competition
- 12.5.10 Regional Demand and Opportunities
- 12.6 By Application - Market Size and Forecast, 2025-2035
- 12.6.1 Segment Definition and Scope
- 12.6.2 Historical Market Size, 2018-2025
- 12.6.3 Revenue Forecast, 2025-2035
- 12.6.4 Volume Forecast, 2025-2035
- 12.6.5 Base-Year Market Share, 2025
- 12.6.6 Segment CAGR and Growth Drivers
- 12.6.7 Subsegment Market Size and Forecast
- 12.6.7.1 Data Centers
- 12.6.7.2 Server Rooms
- 12.6.7.3 Telecommunication Facilities
- 12.6.8 Subsegment Pricing and Adoption Trends
- 12.6.9 Leading Suppliers and Competition
- 12.6.10 Regional Demand and Opportunities
- 12.7 Segment Growth Comparison
- 12.8 Segment Attractiveness and Priority Matrix
Chapter 13 China Data Center Precision Air Conditioning End-Use and Application Market Outlook
- 13.1 End-Use Industry and Customer Demand Structure
- 13.2 Leading Applications and Customer Groups
- 13.3 End-Use Market Size, Share and Forecast
- 13.4 Major End-Use Industry Deep Dives
- 13.4.1 Customer Requirements and Use Cases
- 13.4.2 Demand and Replacement Cycles
- 13.4.3 Technical and Regulatory Considerations
- 13.4.4 Purchasing and Procurement Models
- 13.4.5 Leading Vendors and Distribution Channels
- 13.4.6 Forecast and Commercial Opportunities
- 13.5 Emerging Applications and Cross-Segment Demand
- 13.6 End-Use Industry Investment Priorities
Chapter 14 China Data Center Precision Air Conditioning Geographic Market Outlook, 2025-2035
- 14.1 Domestic Market Distribution and Demand Clusters
- 14.2 State- or Province-Wise Market Size and Forecast, 2025-2035
- 14.3 City and Metropolitan Market Outlook
- 14.4 Industrial, Manufacturing and Commercial Clusters
- 14.5 Geographic Concentration of Key End Users
- 14.6 Local Pricing and Purchasing Differences
- 14.7 Domestic Production Facilities and Capacity Map
- 14.8 Local Infrastructure and Project Pipeline
- 14.9 State-Level Policy and Incentive Differences
- 14.10 Subnational Investment Hotspots and Opportunities
- 14.11 Distribution and Logistics Networks
- 14.12 Domestic Competitive Footprint
Chapter 15 China Data Center Precision Air Conditioning Technology, Innovation and Sustainability Outlook
- 15.1 Technology Landscape and Maturity
- 15.2 Product, Process and Service Innovation
- 15.3 AI, Automation and Digital Tools in the Industry
- 15.4 Technology Adoption and Performance Benchmarking
- 15.5 Innovation Pipeline and R&D Investment
- 15.6 Patent and Intellectual Property Trends
- 15.7 Energy Efficiency and Resource Management
- 15.8 Sustainability, Recycling and Circularity
- 15.9 Technology Roadmap, 2025-2035
- 15.10 Risks of Obsolescence and Technology Substitution
Chapter 16 China Data Center Precision Air Conditioning Market Key Strategic Imperatives
- 16.1 Growth and Market Entry Priorities
- 16.2 High-Return Products and Segments
- 16.3 Pricing, Profitability and Cost Optimization
- 16.4 Technology Investment and Product Differentiation
- 16.5 Supply Chain Localization and Resilience
- 16.6 Distribution and Customer Acquisition
- 16.7 Partnership, Acquisition and Capacity Strategy
- 16.8 Regional Expansion Priorities
- 16.9 Short-, Medium- and Long-Term Actions
Chapter 17 Competition Outlook
- 17.1 Industry Competition Characteristics
- 17.2 Market Structure and Concentration
- 17.3 Market Share and Competitive Positioning, 2025
- 17.4 Company-Wise Revenue and Product Benchmarking
- 17.5 Production and Service Capacity Benchmarking
- 17.6 Technology, Pricing and Differentiation
- 17.7 Regional Footprint and Distribution Strength
- 17.8 Mergers, Acquisitions and Strategic Alliances
- 17.9 New Entrants and Competitive Threats
- 17.10 Porter's Five Forces and Industry Attractiveness
- 17.11 Competitive Outlook, 2025-2035
Chapter 18 Company Profiles
- 18.1 Company Coverage and Selection Criteria
- 18.2 Vertiv
- 18.2.1 Business Description
- 18.2.2 Company Ownership and Geographic Presence
- 18.2.3 Product and Service Portfolio
- 18.2.4 Manufacturing and Operating Footprint
- 18.2.5 Production Capacity and Expansion Plans
- 18.2.6 Financial Performance and Investment
- 18.2.7 Market Share and Competitive Position
- 18.2.8 Technology and Innovation Capabilities
- 18.2.9 Strategic Alliances or Partnerships
- 18.2.10 Recent Developments
- 18.2.11 Growth Strategy and Outlook
- 18.3 Huawei Digital Power (Huawei)
- 18.4 Shenzhen Envicool Technology
- 18.5 Guangdong Shenling Environmental Systems
- 18.6 Nanjing Canatal Data-Centre Environmental Tech
- 18.7 Schneider Electric
- 18.8 Midea Building Technologies (Midea Group)
- 18.9 STULZ
- 18.10 Daikin
- 18.11 Rittal
- 18.12 Other Relevant Market Participants
Note: Every listed company is profiled on the structure shown under the first company. The company list is preliminary and may change based on research findings, market developments, data availability and client requirements.
Chapter 19 Disclaimer
- 19.1 Research and Forecast Disclaimer
- 19.2 Data Source and Estimation Limitations
Note: The depth of individual sections depends on data availability for this market. Volume, capacity, trade and other unit-based metrics are included where applicable.

