
Plant data layers are turning into AI decision tools
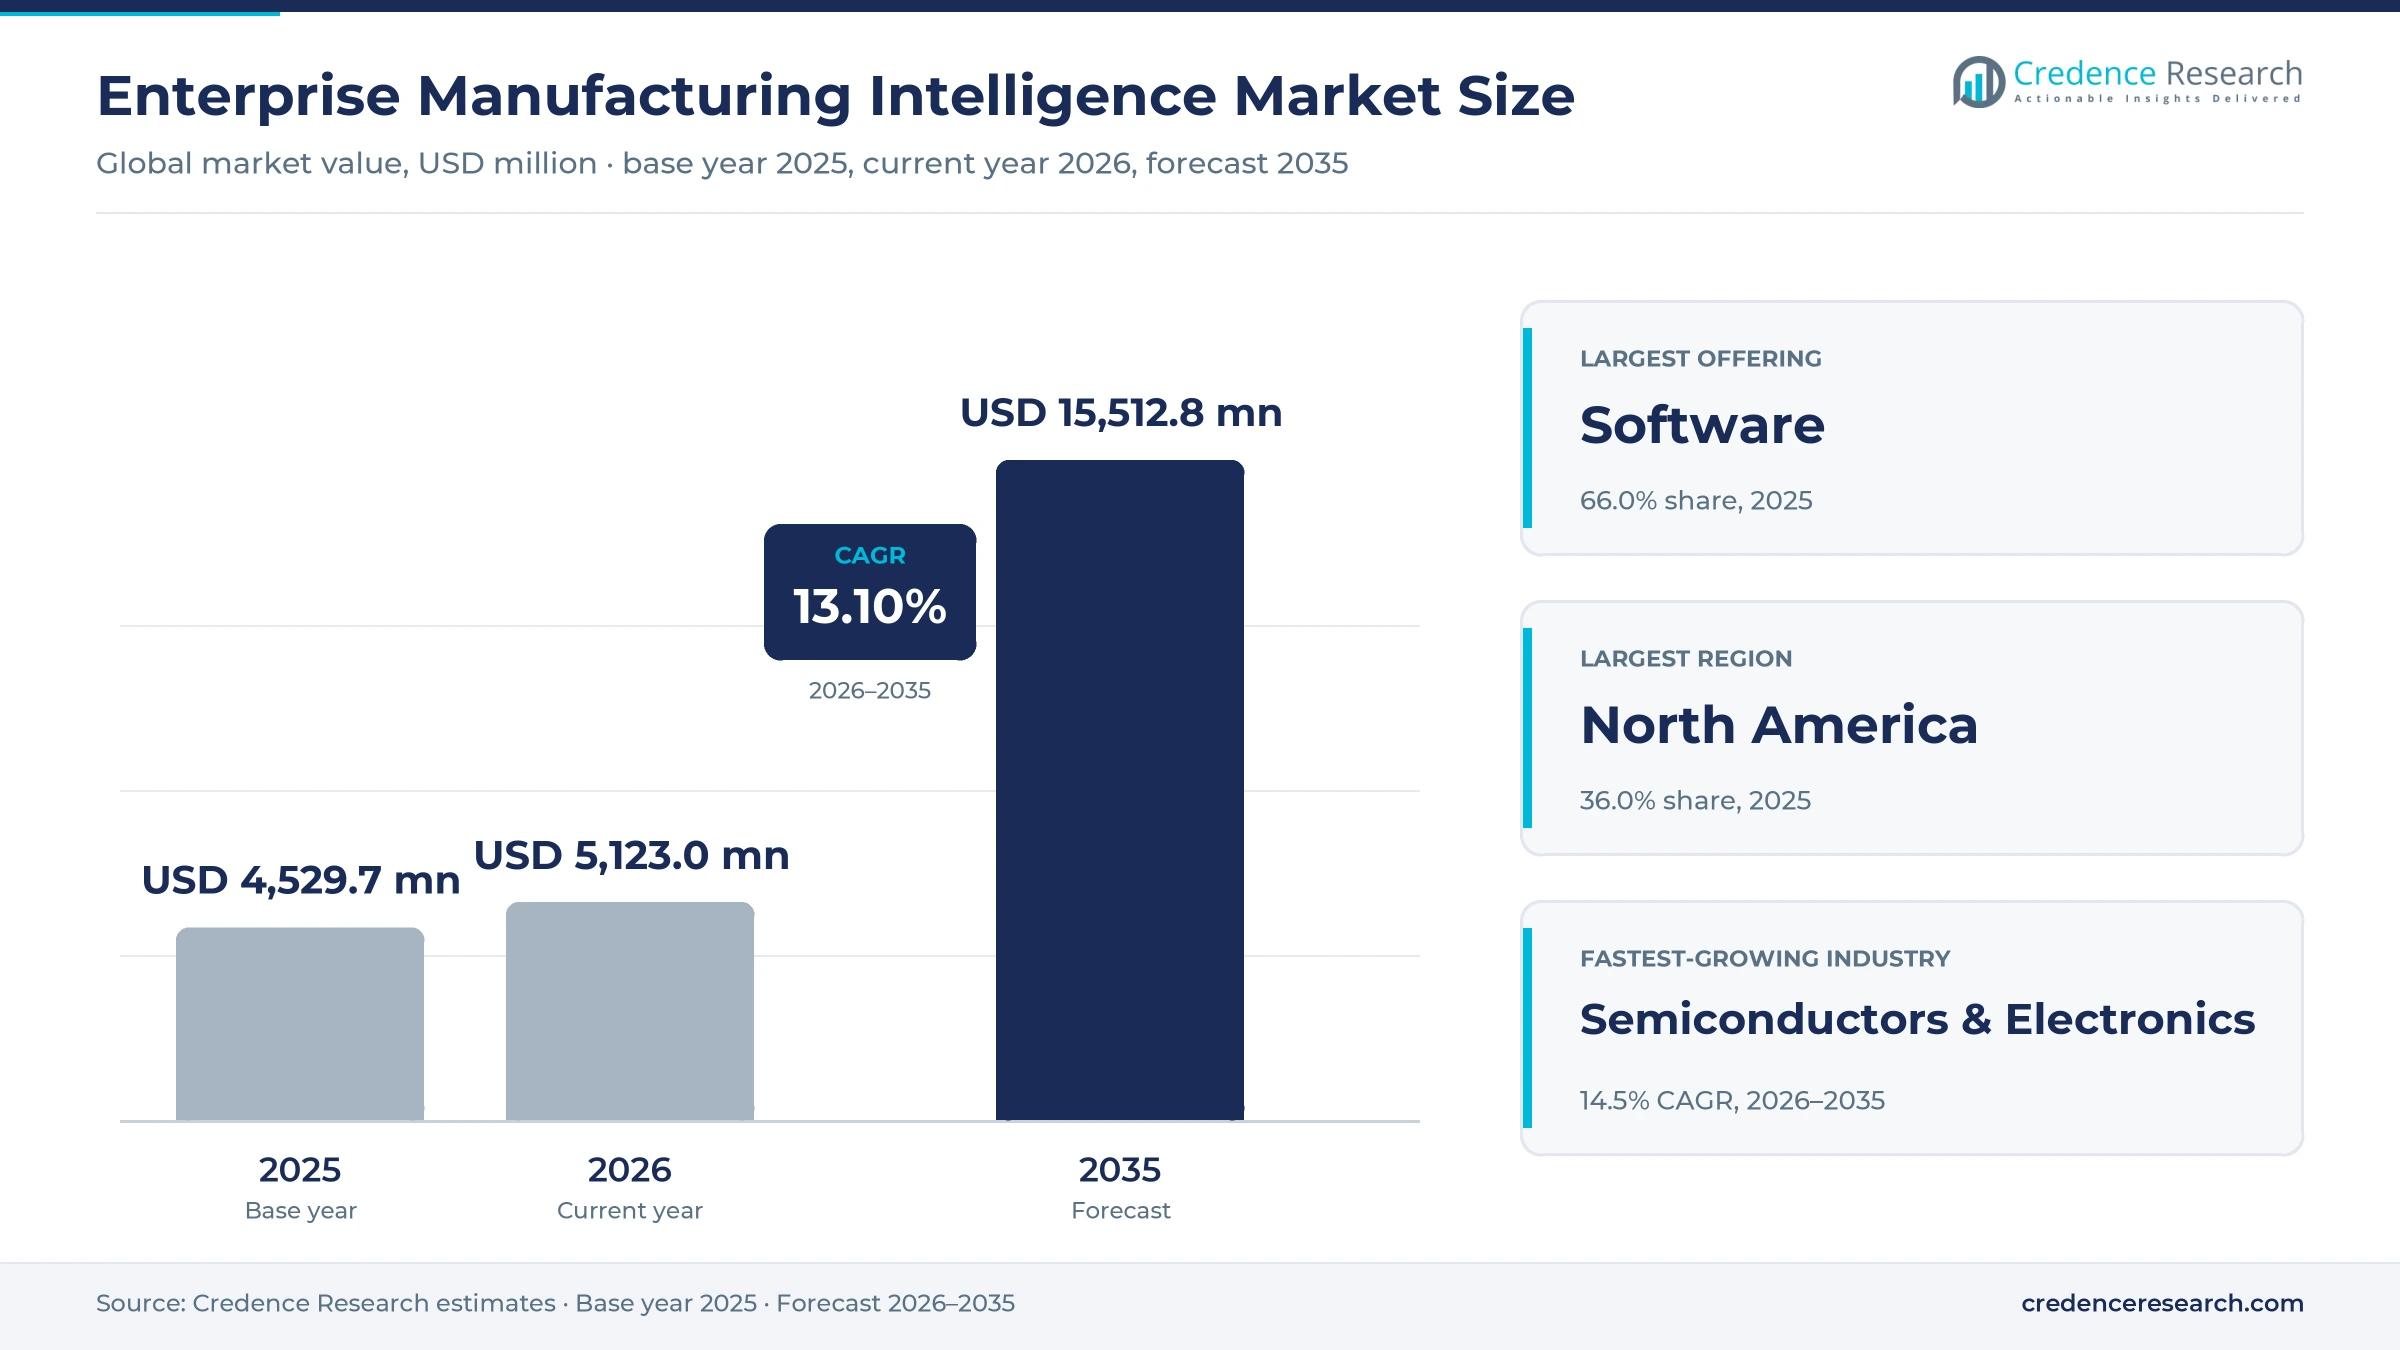
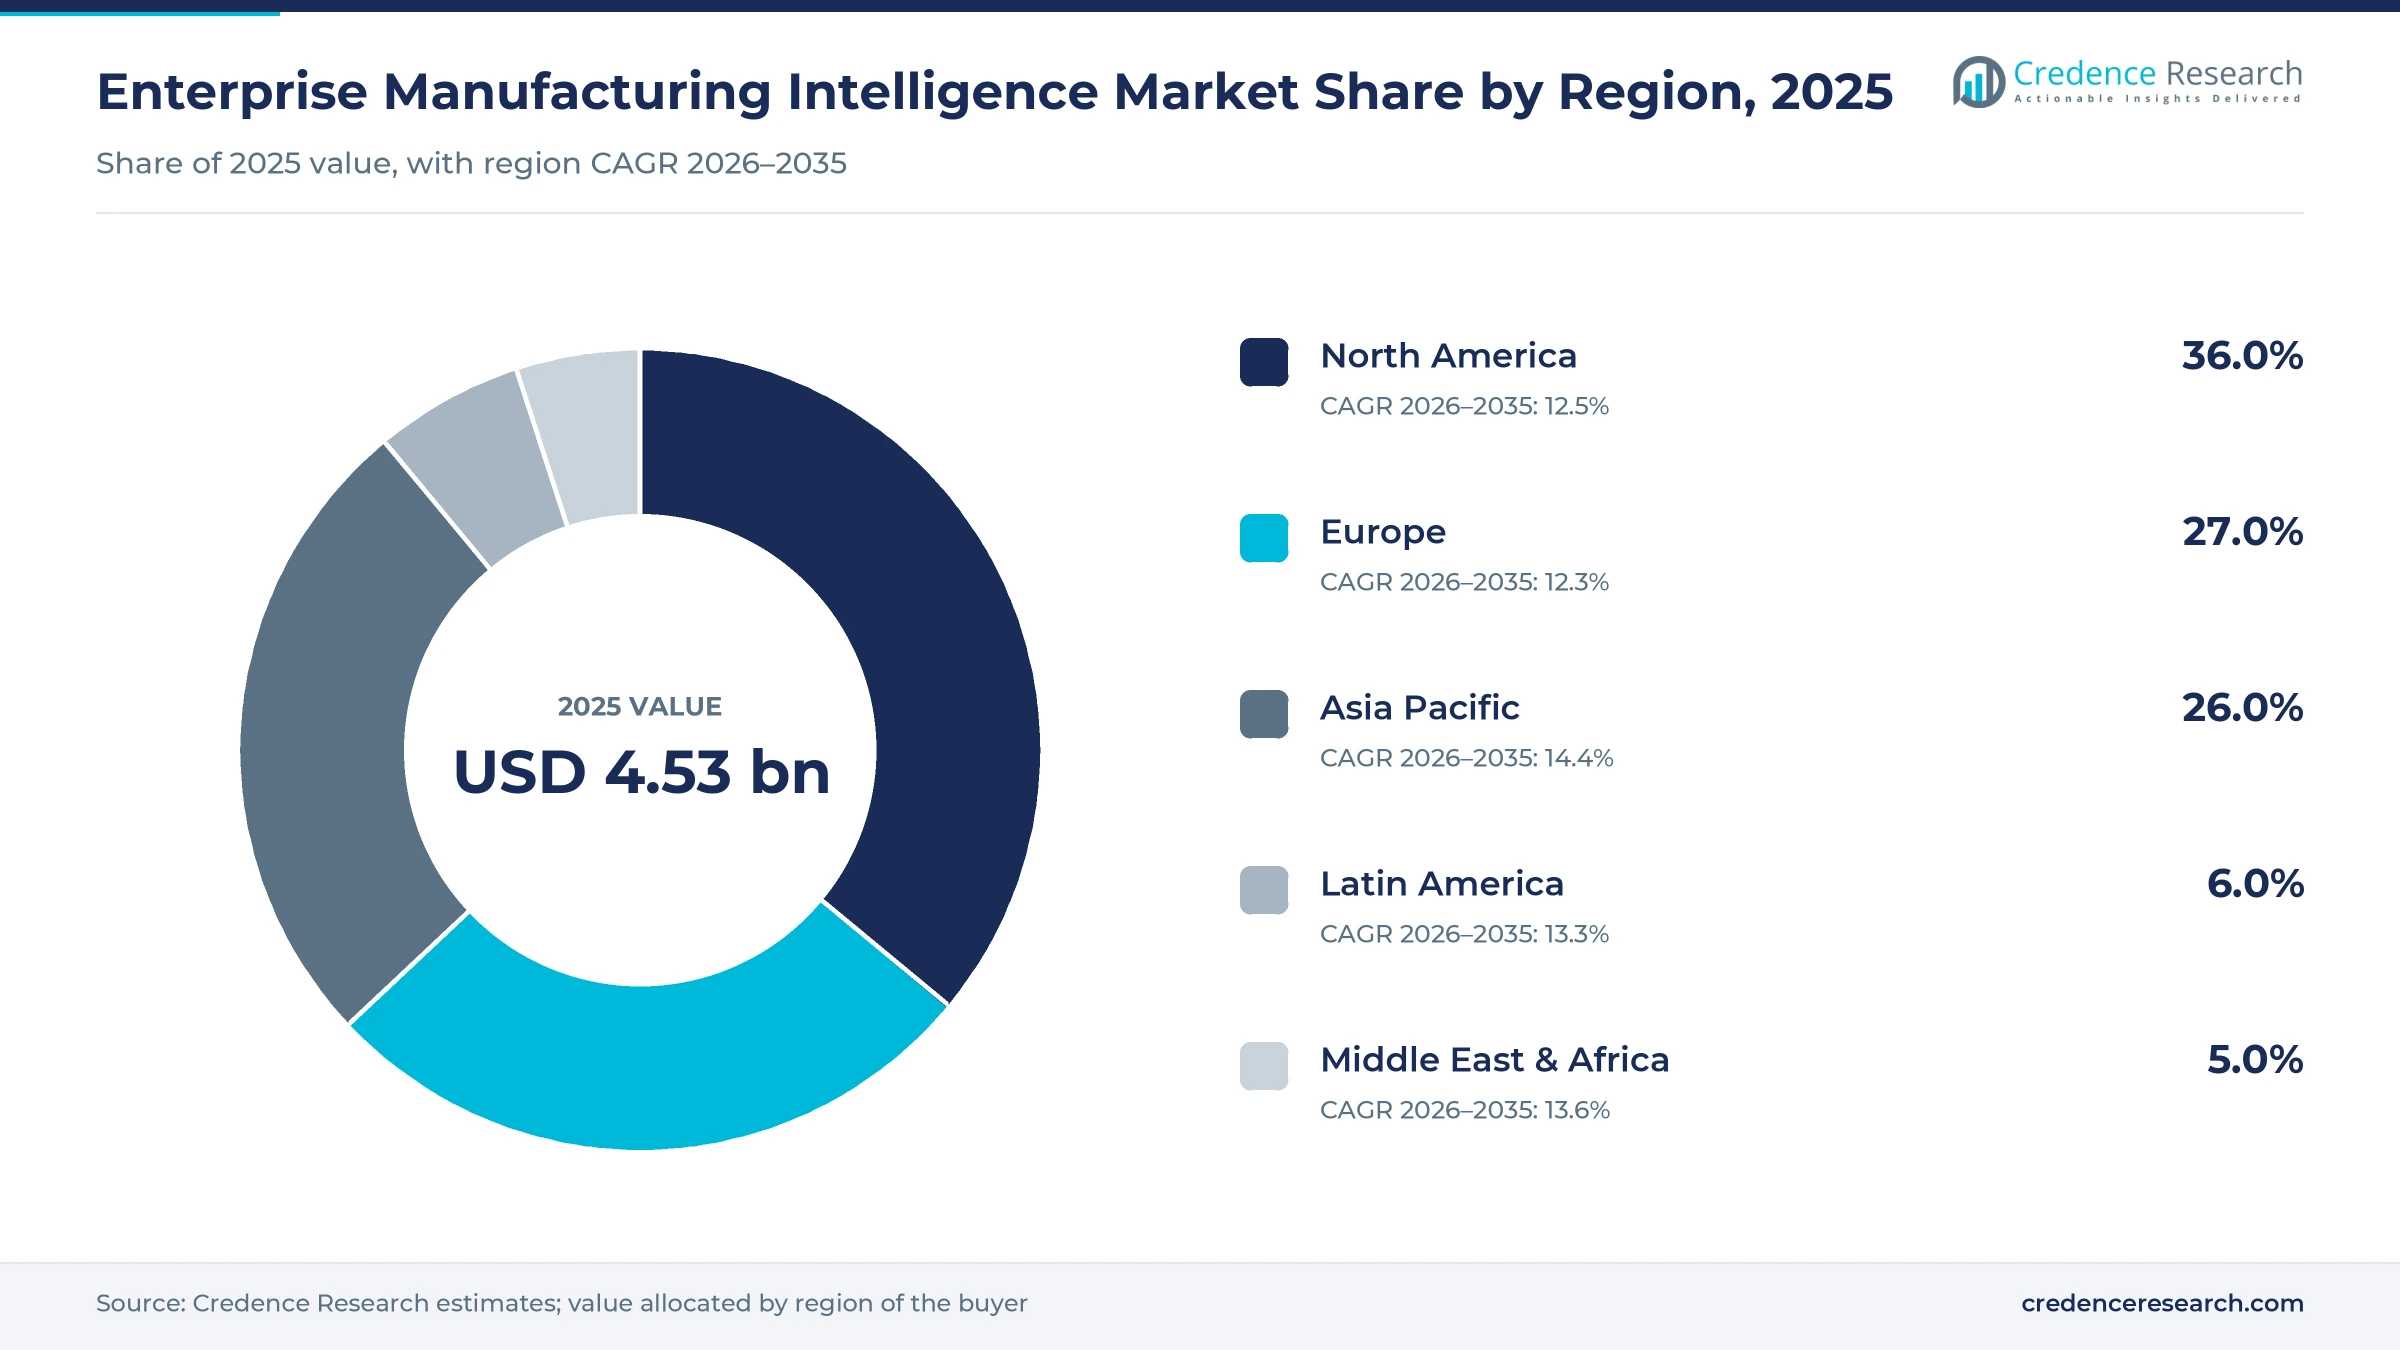
The global enterprise manufacturing intelligence market was valued at USD 4.53 billion in 2025 and is projected to increase from USD 5.12 billion in 2026 to USD 15.51 billion by 2035, registering a CAGR of 13.10% during 2026–2035. Demand comes from discrete and process plants that need one view of production, quality and asset data across sites, as AI inspection, operator copilots and edge data fabrics move from pilots into plant budgets. North America held the largest regional share, 36.0% in 2025, supported by automotive, aerospace and life sciences plants that already run execution and quality systems from domestic suppliers. Asia Pacific is the fastest-growing region at 14.4% a year, as Chinese and Indian manufacturers move basic smart factories toward plant-wide analytics. Vendor ownership is also shifting, with automation groups absorbing software specialists and private equity taking standalone platforms, which changes the roadmaps and contract terms that buyers negotiate.
What does EMI software do inside a plant?
Enterprise manufacturing intelligence (EMI) software collects data from controllers, historians, execution systems, quality systems and ERP, places it in one plant data model, and turns it into dashboards, KPIs, alerts and analytics for plant and corporate teams. Buyers usually purchase it as a license or subscription per server, site, user or interface, often inside an execution or quality suite, and add integration services to connect older equipment.
The market counts EMI software and the services to deploy and run it, whether embedded in a larger suite or sold as a standalone platform. It excludes control hardware, sensors, general business intelligence tools not tied to production data and ERP licenses, although these systems feed the data that the analytics layer uses.
Enterprise Manufacturing Intelligence Market Insights
- The market is valued at USD 4.53 billion in 2025 and is projected to reach USD 15.51 billion by 2035, growing at a 13.10% CAGR as plants move AI inspection and copilots into production.
- North America led with 36.0% of 2025 value, because automotive, aerospace and life sciences plants there already run execution and quality systems that feed analytics.
- Software held 66.0% of 2025 value, while Semiconductors & Electronics grows fastest at 14.5% a year as new chip fab capacity comes online.
- China counted more than 7,000 advanced and over 500 excellence-level smart factories by January 2026, according to its industry ministry.
- Emerson, Siemens and TPG closed software deals between March 2025 and March 2026, changing who owns several leading plant data platforms.
Automotive lines and embedded suites hold most spending
Why does embedded software lead while standalone platforms grow faster?
Based on deployment type, the market is categorized into embedded and standalone. Embedded led with 58.0% of 2025 value because most plants add analytics inside the execution, quality or ERP suite they already run. Siemens sells Insights Hub analytics beside its Opcenter execution suite and SAP links Digital Manufacturing analytics to its ERP, so plants on those suites add analytics without a new vendor contract. Standalone platforms grow fastest at 13.8% a year as multi-vendor plants want one view across suites. GE Vernova completed the USD 600 million sale of Proficy to TPG on March 2, 2026, creating an independent vendor with more than 20,000 customers.
Why does software lead while services grow faster?
Based on offering, the market is categorized into software and services. Software led with 66.0% of 2025 value because licenses and subscriptions are sold per server, site or interface, as the pricing table shows, and each new line adds a recurring fee. Services grow fastest at 13.9% a year because plants lack staff to connect legacy equipment and build data models. Inductive Automation charges 16% to 24% of retail license value a year for support plans and 65% of retail for a major upgrade without upgrade protection, which shows how much lifetime value sits after the first sale.
Why does automotive lead while semiconductors grow fastest?
Based on end-use industry, the market is categorized into automotive, semiconductors & electronics, aerospace & defense, medical devices, pharmaceutical, chemical, food & beverage, oil & gas, energy & power and others. Automotive led with 22.0% of 2025 value because high-volume body, paint and assembly lines generate dense machine data. Vehicle plants also run mature execution and traceability systems for recall and warranty reporting, so analytics can sit on data they already collect. Semiconductors & Electronics grows fastest at 14.5% a year as fabs add capacity, with SEMI projecting 300mm fab equipment spending of USD 133 billion in 2026 and USD 151 billion in 2027.
| Segment Group | Leading Sub-segment | Share, 2025 | Fastest-growing Sub-segment | CAGR, 2026–2035 |
|---|---|---|---|---|
| By Deployment Type | Embedded | 58.0% | Standalone | 13.8% |
| By Offering | Software | 66.0% | Services | 13.9% |
| By End-Use Industry | Automotive | 22.0% | Semiconductors & Electronics | 14.5% |
Per-server licenses and per-interface fees set prices
Pricing in this market follows two models that buyers often compare directly. Platform vendors such as Inductive Automation sell perpetual licenses per server, with historian, visualization and reporting modules added separately and yearly support charged as a share of list price. Cloud vendors such as Tulip charge a monthly fee per interface, usually a station or tablet on the floor, with a minimum commitment. Large automation and ERP vendors rarely publish prices and quote multi-site agreements instead. Integration work often exceeds the license cost at older plants, so buyers compare total cost per connected line rather than the license price alone.
| Offer or plan | Typical price or fee | Basis |
|---|---|---|
| Ignition platform license, per server | USD 1,200 one-time | Inductive Automation price list, November 2026 |
| Ignition Industrial Historian suite, per server | USD 3,500 one-time | Inductive Automation price list, November 2026 |
| Ignition Perspective visualization module, per server | USD 11,225 one-time | Inductive Automation price list, November 2026 |
| Tulip Essentials plan | USD 100 per interface a month, billed yearly, 10-interface minimum | Tulip plans page, November 2026 |
| Tulip Professional plan | USD 250 per interface a month, billed yearly, 10-interface minimum | Tulip plans page, November 2026 |
| Multi-site suite rollout, software and integration | USD 0.5-3 million over the first two years | Credence Research estimate from list prices, site counts and integration scope |
Request a Free Sample
Fill in your details and we'll send you a free sample report.
- Sample data tables & charts
- Research methodology
Defect costs and labor gaps push analytics budgets
Defect costs push plants toward AI-based quality analytics
Quality analytics is the most direct budget line for this software because a defect caught at the station costs far less than one found by a customer. China's industry ministry reported in February 2025 that its 230 excellence-level smart factories cut defect rates by 50.2% on average and raised production efficiency by 22.3%. Rockwell Automation connected its Plex quality management system with FactoryTalk Analytics VisionAI in August 2026, logging AI inspection results with serialization and traceability records. Plants that already run machine vision cameras gain fastest, since inspection data then flows straight into dashboards and root-cause analysis. Automotive body, paint and assembly lines, where escaped defects trigger costly recalls, are the largest users of this quality analytics.
FDA guidance lowers the validation burden for plant software
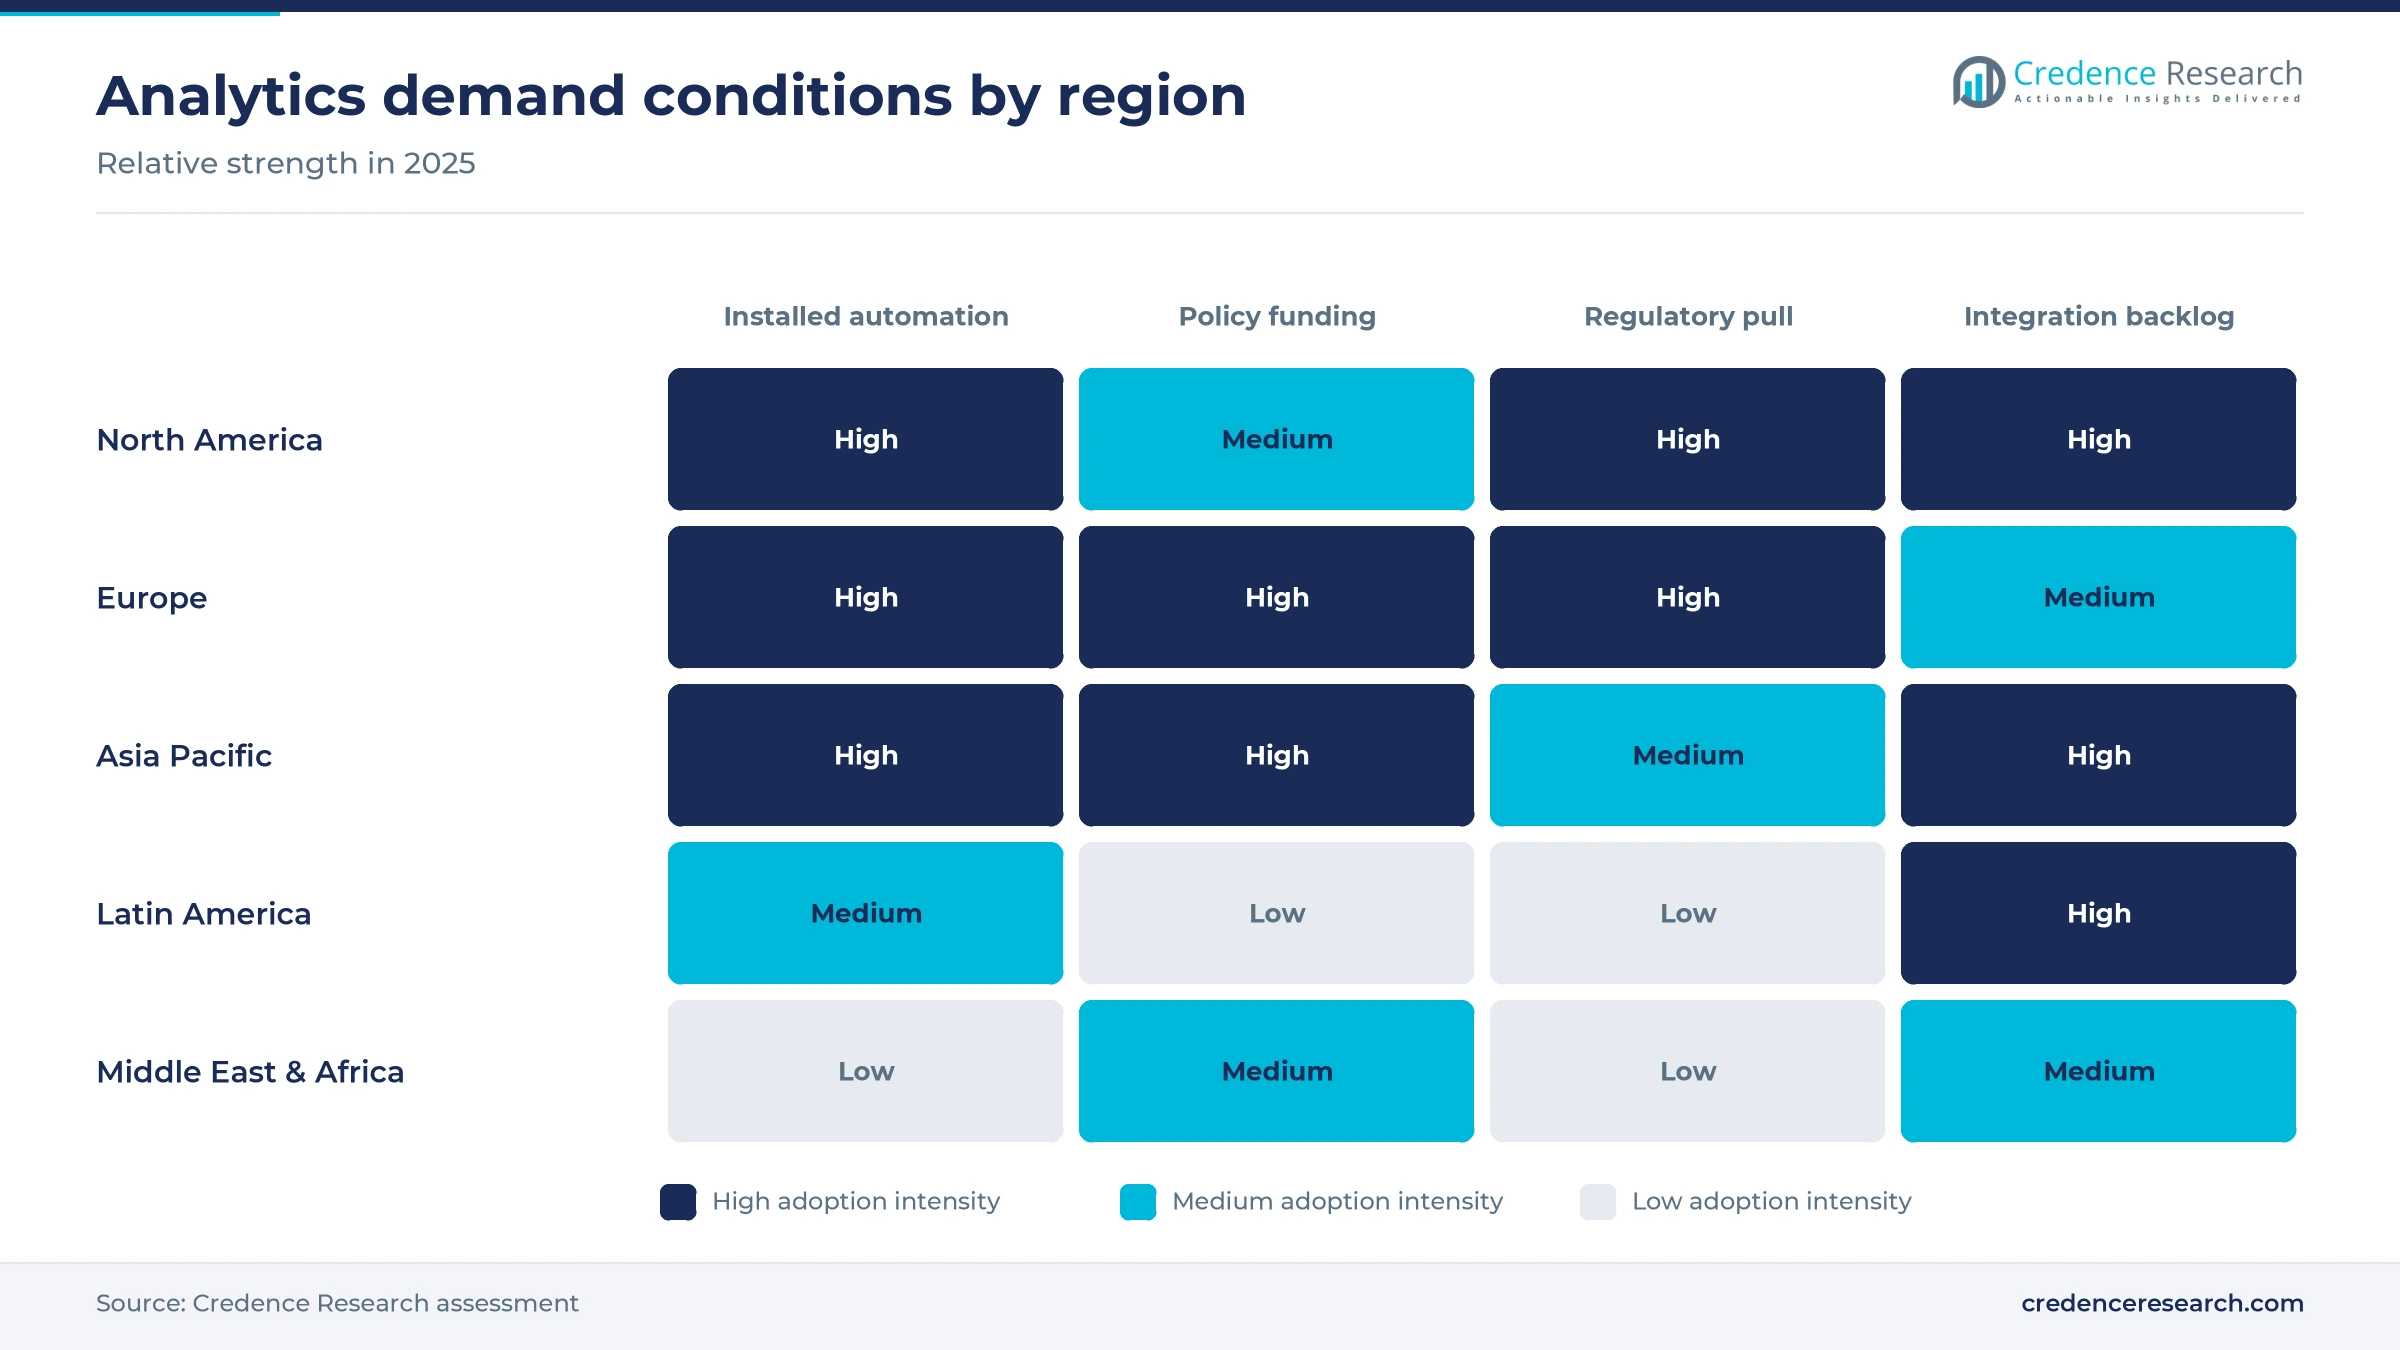
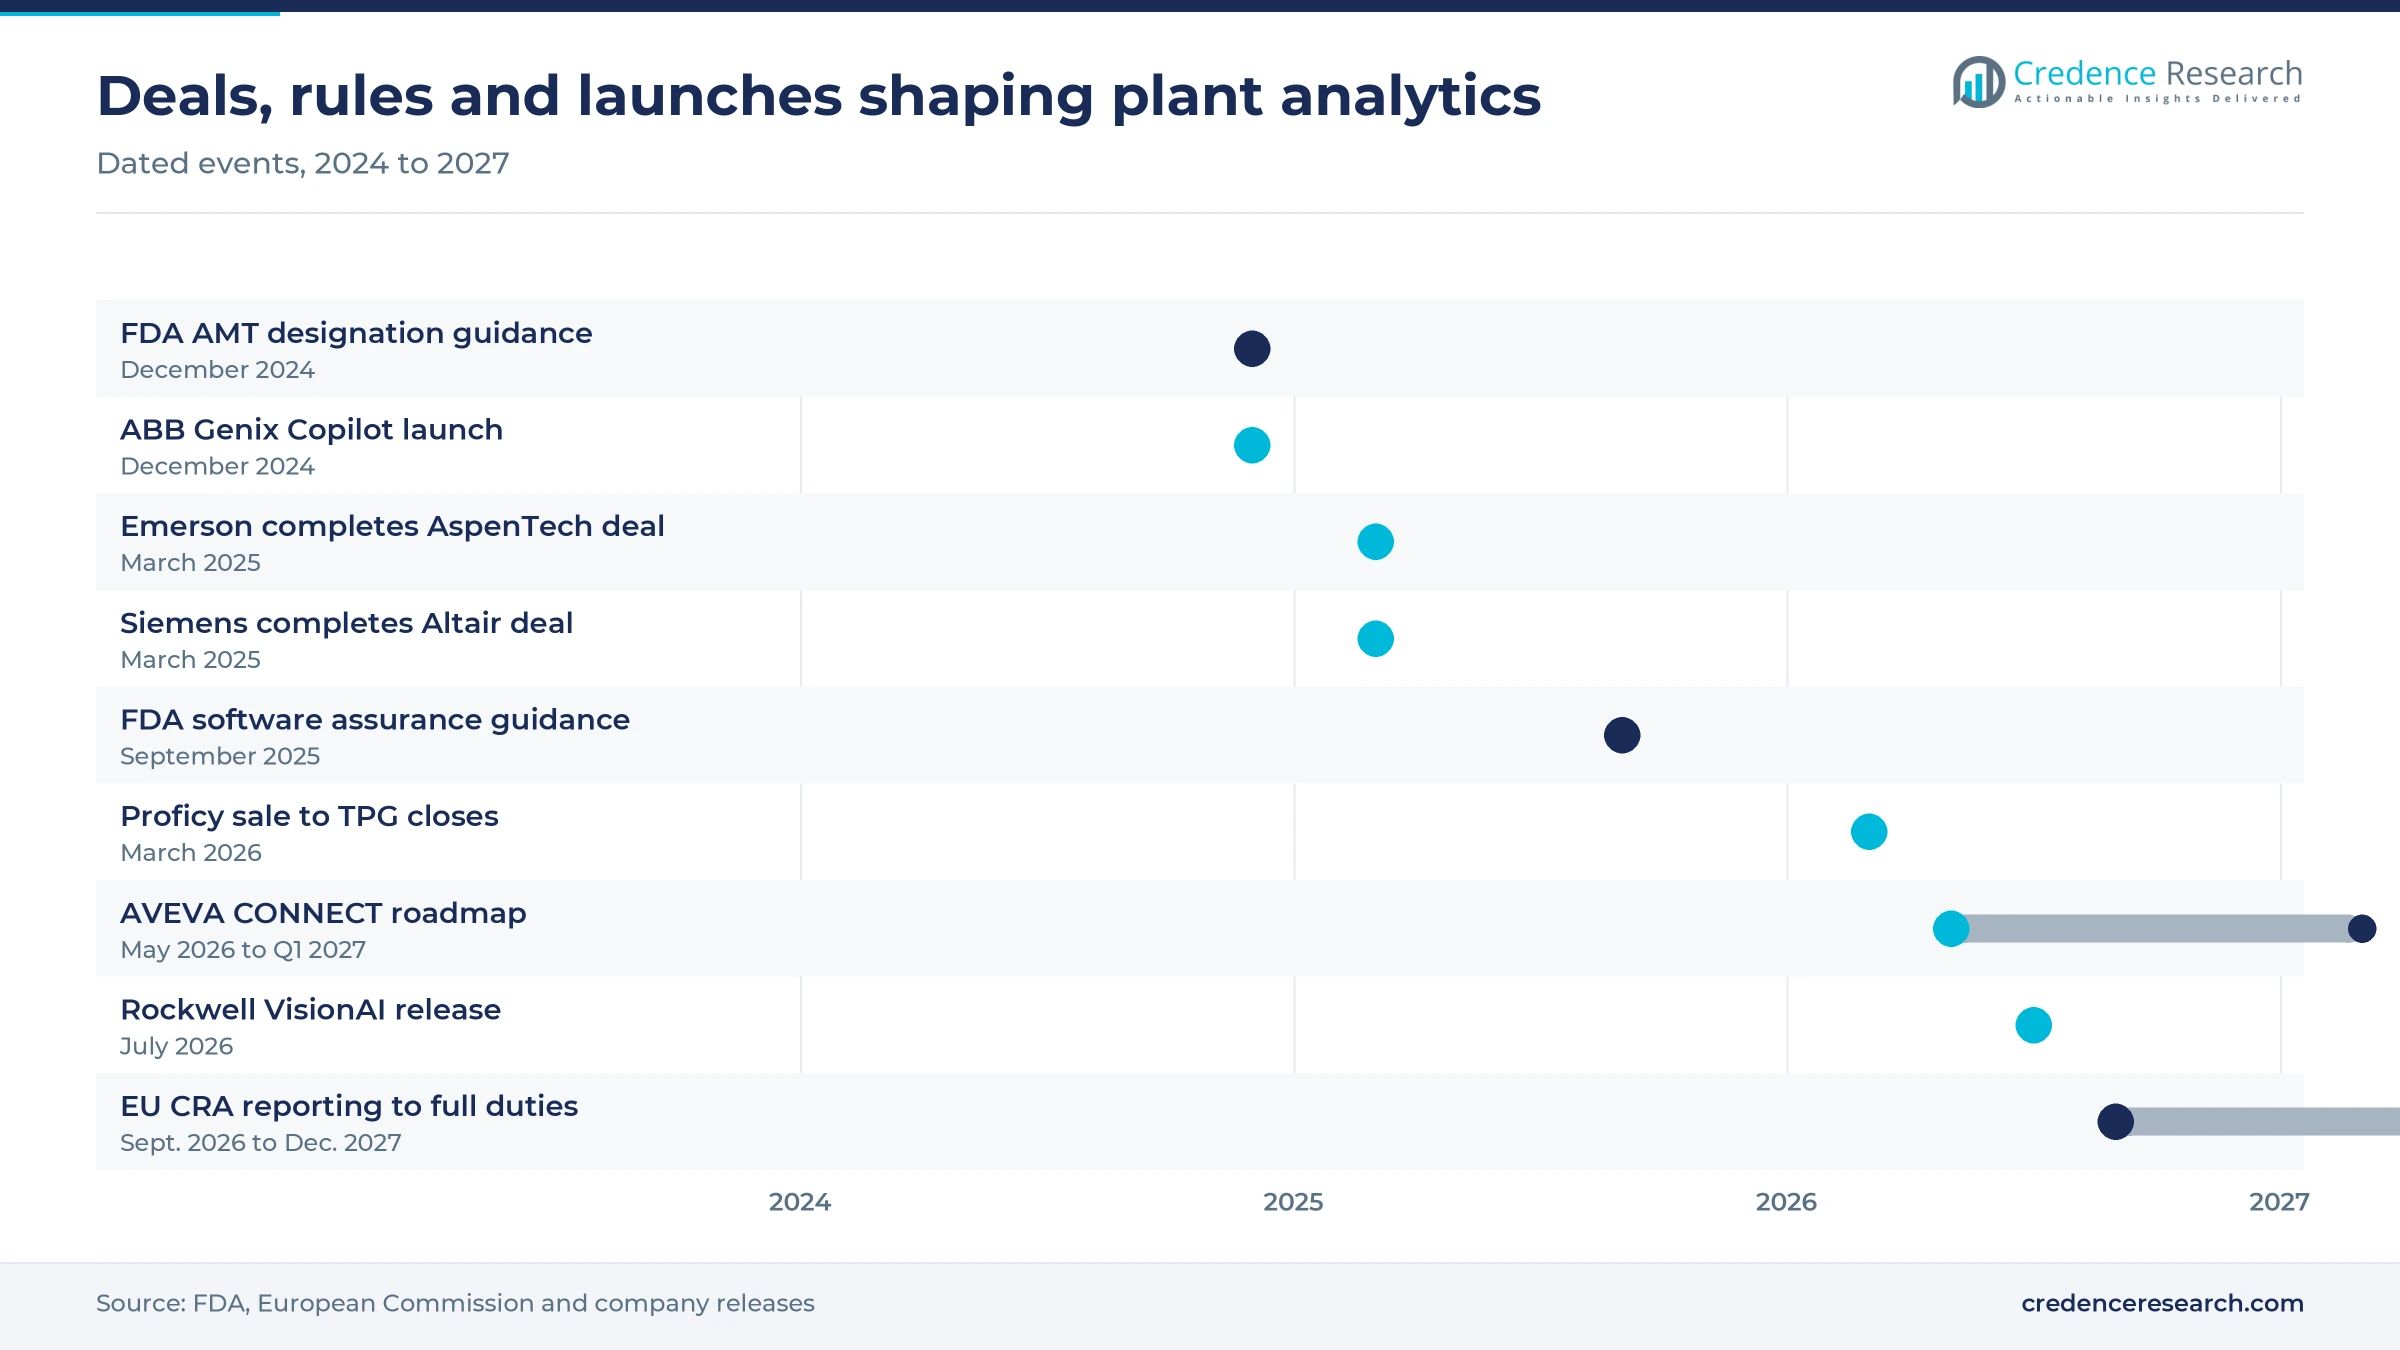
Regulated manufacturers have long delayed analytics projects because every software change triggered heavy validation work. The FDA issued final computer software assurance guidance in September 2025, setting a risk-based approach for software used in medical device production and quality systems and replacing the older validation section for that software. In December 2024 the agency also finalized guidance for its Advanced Manufacturing Technologies Designation Program, which gives drug makers a route to have new production technologies designated. Both documents reduce the testing cost of each software release, so device plants can update dashboards and models more often while staying within the Quality System regulation in 21 CFR Part 820. Pharmaceutical and medical device lines benefit most, and vendors with pre-validated templates gain an edge in these accounts.
Labor shortages raise the value of operator copilots
Manufacturers are buying analytics that guide less experienced staff because hiring cannot keep pace with retirements and new plants. The Manufacturing Institute estimated in April 2024 that U.S. manufacturers could need 3.8 million new employees by 2033, with about 1.9 million roles at risk of staying unfilled. Siemens made its Operations Copilot available for Insights Hub in 2025 and said pilots of its Senseye maintenance copilot cut reactive maintenance time by 25% on average. These assistants let a technician query asset history in plain language instead of building reports. Plants that already run predictive maintenance programs adopt them first, while sites with poor data tagging see smaller gains.
Robot density multiplies the data plants must analyze
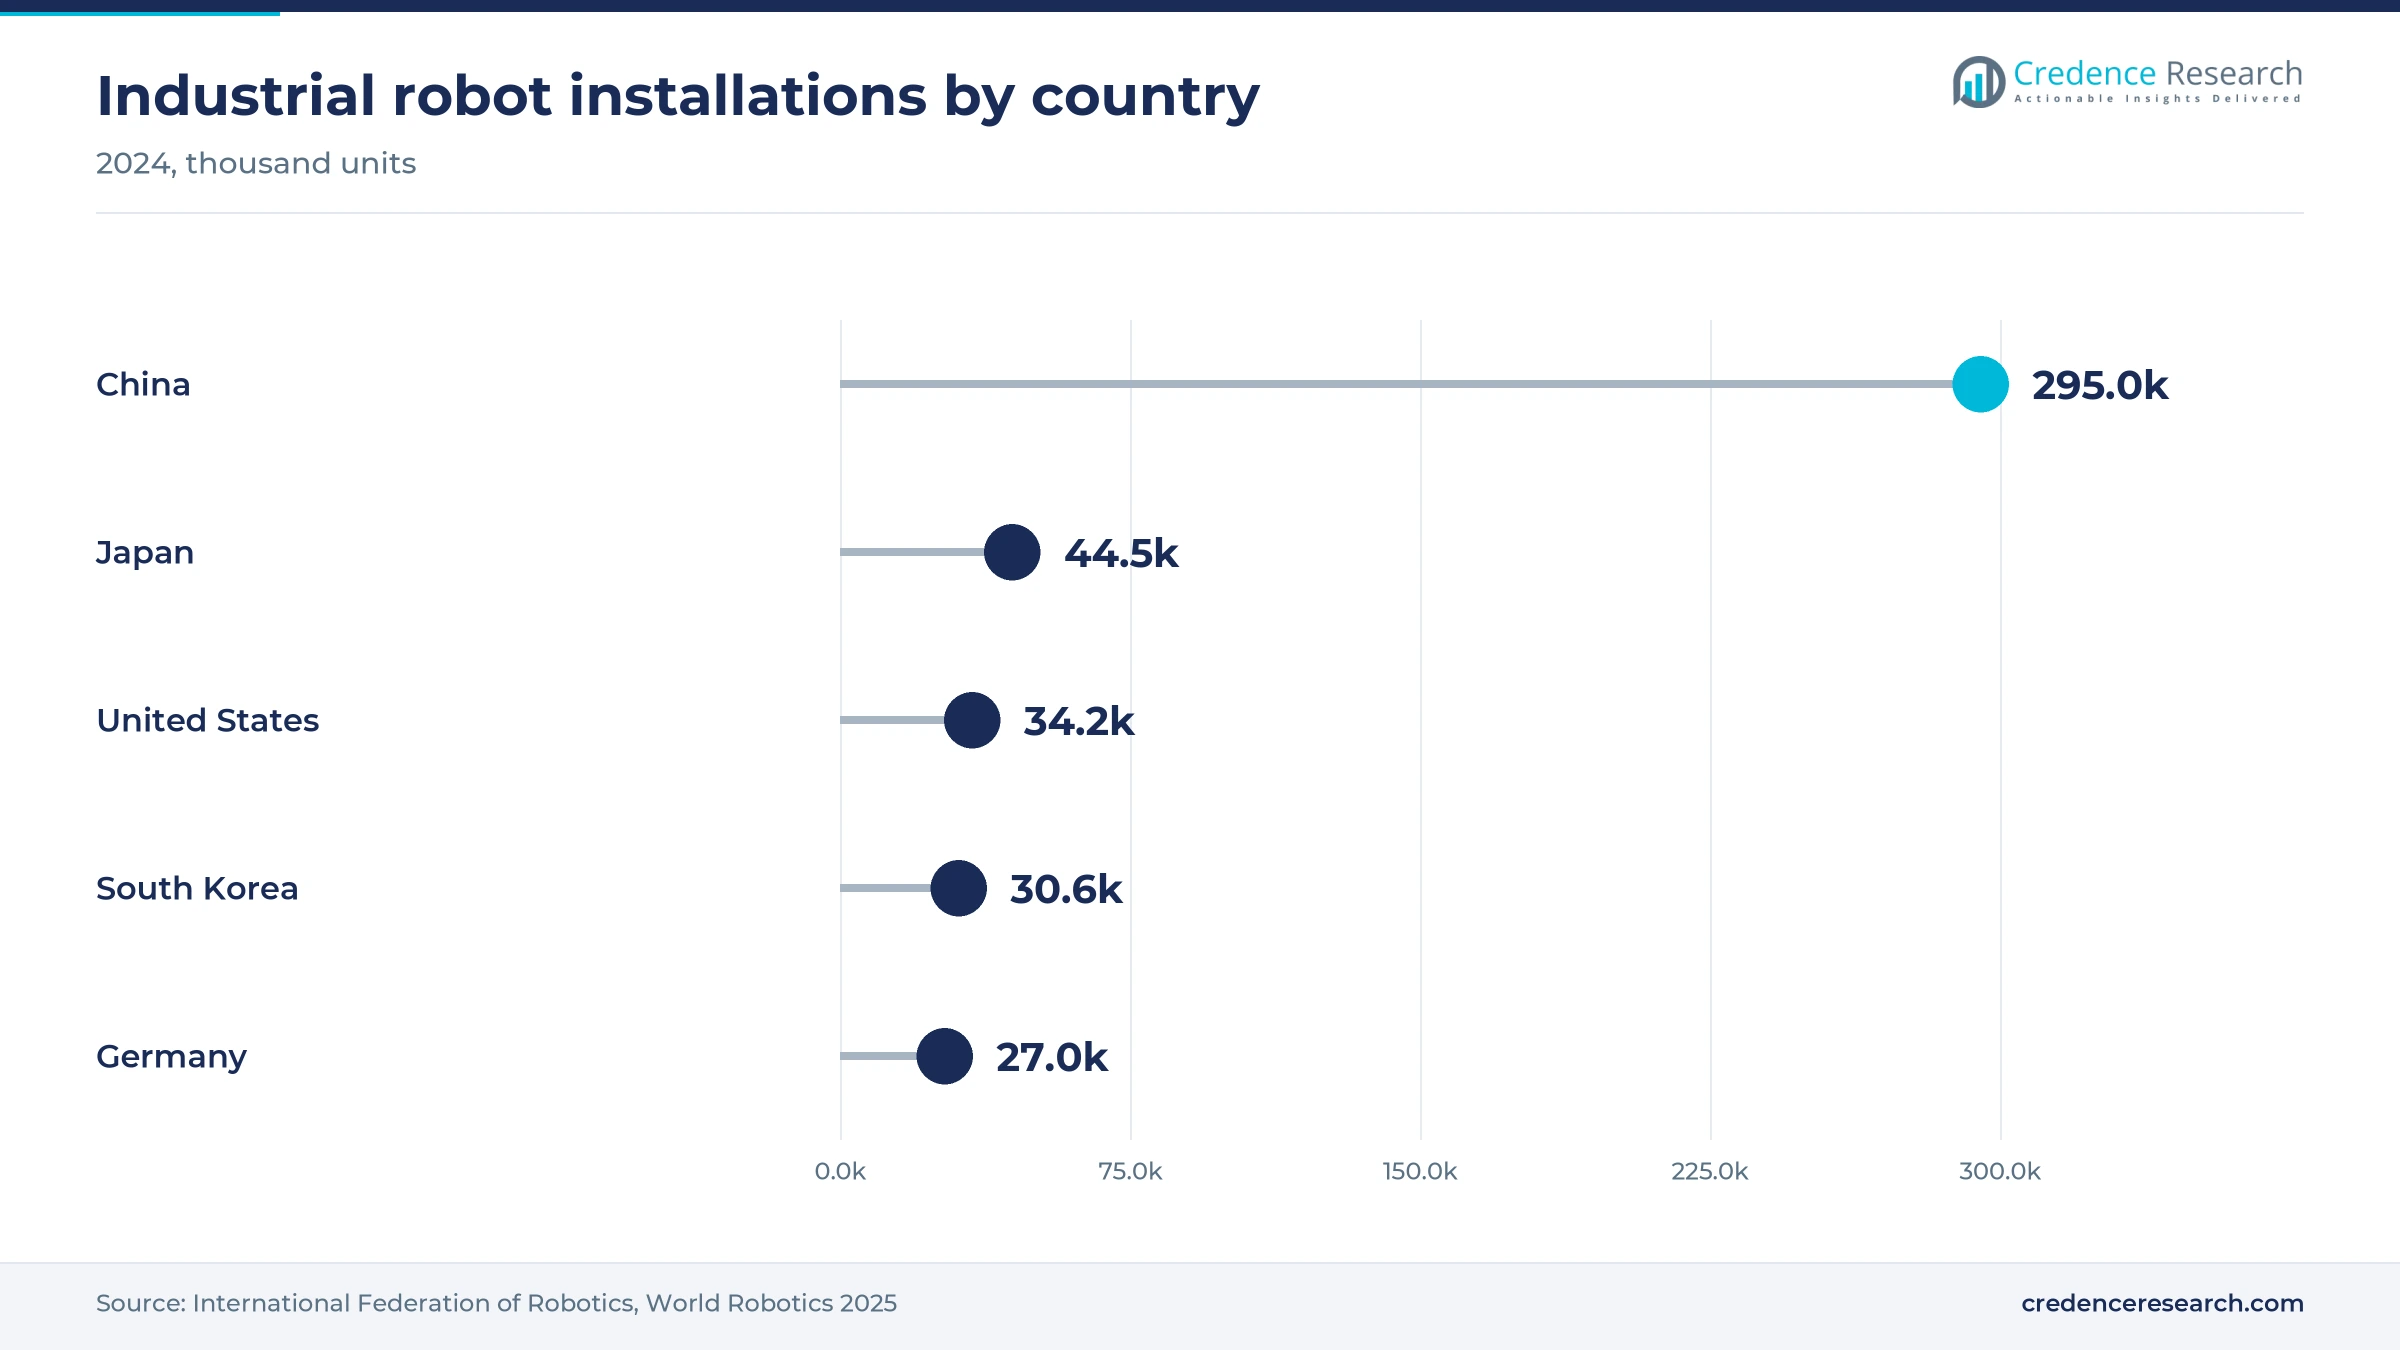
Each robot cell, vision station and connected machine adds data streams that plants cannot manage with spreadsheets and isolated HMI screens. The International Federation of Robotics counted 542,000 industrial robots installed worldwide in 2024, more than double the number ten years earlier, and expects 575,000 installations in 2025, which widens demand for line analytics. China alone installed 295,000 units in 2024, more than half of global robot demand. As fleets grow, plant managers need fleet-wide availability, cycle time and quality views, which is the core use of this software. Linking these assets through industrial IoT gateways gives vendors a recurring license base per connected line, and Asia Pacific gains most from this growth in connected assets.
Data fabrics and AI agents reshape plant software
Plants shift toward vendor-neutral OT data fabrics
Manufacturers are shifting from point-to-point integrations toward shared data layers that any analytics tool can read. AVEVA said in May 2026 that its Flows service, built on the Crosser acquisition, brings more than 800 connectors for data pipelines, and it plans a major CONNECT release with an industrial knowledge graph in the first quarter of 2027. Emerson released a rebuilt AspenTech Inmation OT data fabric on May 13, 2026, with edge-to-cloud deployment on Windows and Linux. Inductive Automation licenses its Ignition SCADA and integration platform per server with unlimited tags, so plants add data sources without new license fees, which lowers the cost of a shared data layer. This shift favors vendors that own the data layer and weakens suppliers that rely on proprietary connectors.
Agentic AI is emerging on top of plant data
Vendors are moving from dashboards toward AI agents that recommend or carry out actions for scarce plant engineers. Emerson launched its AspenTech AVA platform on May 11, 2026, with four decision-support advisors available at release. ABB introduced Genix Copilot with Microsoft in December 2024 as part of its Genix industrial analytics and AI suite, answering asset health and fault questions in plain language. Siemens unveiled AI agents for its Industrial Copilots in May 2025 and set a target of up to 50% productivity gains, a goal rather than a measured result. Buyers should expect pricing tied to agents and outcomes, while independent evidence on real productivity remains limited. Standalone platforms, growing at 13.8% a year, are where many of these agents reach plants first.
Shared data spaces create a cross-company analytics opening
Cross-company data exchange is creating openings for analytics vendors that can work with supplier and customer data, not just the data of one plant. Germany has approved EUR 140 million for Manufacturing-X, and its Factory-X flagship, led by Siemens and SAP with 47 partners, is building an open data ecosystem for equipment suppliers and factory operators. Ministers from 17 EU member states signed the Berlin Declaration on Nov. 3, 2025, backing the approach. Equipment makers gain a route to sell performance analytics on installed machines, and plant operators gain shared data for carbon and quality reporting. Suppliers in machinery and automotive stand to benefit first, since the program already involves 124 companies and research institutions across 12 industries.
Upgrading China's basic smart factories is a large opening
The upgrade path inside China's smart factory program offers vendors a large, identifiable pool of buyers. The industry ministry said in February 2025 that more than 30,000 basic-level smart factories had been built, and by January 2026 it counted more than 7,000 advanced and over 500 excellence-level plants. It also put the scale of intelligent manufacturing equipment, industrial software and system solutions above 4.5 trillion yuan. Moving a basic plant to the advanced tier requires plant-wide data integration and KPI management, the functions this software provides. Domestic Chinese suppliers are likely to win most of these upgrades on price and local support, although public data on vendor shares in China are not available.
Cyber risk and vendor churn slow multi-site rollouts
Cyberattacks on plants slow cloud connections
Connecting plant systems to cloud analytics widens the attack surface that buyers must defend. IBM X-Force reported in February 2026 that manufacturing took 27.7% of the attacks it observed in 2025, the fifth straight year the industry ranked first. Plants with flat networks and older Windows-based HMIs are most exposed, and security reviews often add months to analytics rollouts. Vendors that offer edge processing, outbound-only connections and certified industrial security components shorten these reviews and win approvals sooner.
EU product security rules add vendor compliance costs
The EU Cyber Resilience Act requires software vendors selling into Europe to report actively exploited vulnerabilities and severe incidents from Sept. 11, 2026. The European Commission asks for an early warning within 24 hours and a fuller notification within 72 hours, while the main security obligations apply from Dec. 11, 2027. Smaller software vendors and integrators with their own add-ons carry the heaviest relative cost, since they need new vulnerability handling processes. Buyers may see slower feature releases as engineering time moves to compliance.
Vendor ownership changes raise roadmap risk for buyers
Buyers sign multi-year contracts, so changes in vendor ownership can strand investments in integrations and training. Emerson completed its purchase of the remaining AspenTech shares on March 12, 2025, at USD 265 a share, and Honeywell completed the spin-off of Honeywell Aerospace on June 29, 2026, leaving its automation and industrial software units in the renamed Honeywell Technologies. Customers of acquired or separated units are most exposed to product rationalization and price changes. Contracts with roadmap commitments, data export rights and price caps reduce this risk.
Entry prices deter small and mid-sized plants
Subscription minimums and module pricing keep many small plants out of the market despite falling cloud costs. Tulip sets a 10-interface minimum, so its Essentials plan starts at about USD 12,000 a year, and Inductive Automation lists its Perspective visualization module at USD 11,225 per server. Job shops with a handful of machines and thin margins are most exposed, since integration work often costs more than the software itself. Vendors that offer per-machine pricing and prebuilt templates are best placed to reach these buyers.
North America leads as Asia Pacific grows fastest
| Region | Value, 2025 (USD billion) | Share, 2025 | CAGR, 2026–2035 |
|---|---|---|---|
| North America | 1.63 | 36.0% | 12.5% |
| Europe | 1.22 | 27.0% | 12.3% |
| Asia Pacific | 1.18 | 26.0% | 14.4% |
| Latin America | 0.27 | 6.0% | 13.3% |
| Middle East & Africa | 0.23 | 5.0% | 13.6% |
North America leads on installed execution systems
North America held 36.0% of 2025 value and grows at 12.5% a year. U.S. plants installed 34,200 industrial robots in 2024, according to the International Federation of Robotics, adding connected cells that create demand for line-level analytics in automotive, electronics and food plants. Rockwell Automation, Emerson, Honeywell Technologies, Inductive Automation and Tulip are headquartered in the region, so U.S. plants buy execution, historian and frontline apps from local vendors with their own integrator networks. The FDA software assurance guidance noted above lowers validation costs for device and drug plants, so life sciences remains a strong buyer group.
Europe grows on data-space programs and strict product rules
Europe held 27.0% of 2025 value and grows at 12.3% a year. Germany installed 26,982 industrial robots in 2024, the fifth-largest total worldwide according to the International Federation of Robotics, which sustains demand at automotive and machinery plants. Siemens, SAP, Dassault Systèmes, ABB and Schneider Electric through AVEVA are headquartered in the region, giving European plants wide local supplier choice. The Manufacturing-X program described above favors analytics that share data across companies, while the Cyber Resilience Act adds compliance work that slows smaller vendors.
Asia Pacific grows fastest on smart factory programs
Asia Pacific held 26.0% of 2025 value and grows fastest at 14.4% a year. Japan installed 44,500 industrial robots in 2024 and South Korea 30,600, according to the International Federation of Robotics. India set a record of 9,100 robot installations in the same year, up 7%, which lifts regional demand for line analytics. China's smart factory tiers, noted in the opportunities above, create a policy-backed upgrade pipeline. Local vendors compete hard on price in China, so foreign suppliers rely more on multinational automotive, electronics and chemical plants across the region.
Latin America follows automotive investment in Mexico
Latin America held 6.0% of 2025 value and grows at 13.3% a year. The automotive industry accounted for 63% of Mexico's industrial robot installations in 2024, according to the International Federation of Robotics, tying analytics demand to vehicle and parts plants that serve the U.S. market. Brazil's food, mining and chemical plants form the second buyer group, although public data on their software spending are limited. Most projects run through global vendors and local system integrators.
Middle East & Africa grows on Saudi factory upgrades
Middle East & Africa held 5.0% of 2025 value and grows at 13.6% a year. Saudi Arabia's Ministry of Industry and Mineral Resources said in October 2025 that its Future Factories Program aims to turn 4,000 traditional facilities into smart factories, a pipeline that adds demand for plant data platforms. Oil, gas, petrochemical and metals plants in the Gulf already run historians and process analytics, so they lead regional demand. Public data for Africa are thin, and estimates there rest on Credence Research assumptions.
Software deals and AI launches reshape the vendor field
| Development | Status and market relevance |
|---|---|
| In March 2025, Emerson completed its acquisition of the remaining AspenTech shares, making AspenTech a wholly owned business unit. | Completed acquisition; brings AspenTech process optimization and data software fully under Emerson control systems. |
| In March 2025, Siemens completed its acquisition of Altair Engineering at an enterprise value of about USD 10 billion. | Completed acquisition; adds simulation, data science and AI tools to the Siemens Xcelerator software portfolio. |
| In February 2026, Dassault Systèmes and NVIDIA announced a long-term partnership that includes DELMIA production virtual twins. | Partnership announced; most capabilities are described as planned, with no delivery dates given. |
| In March 2026, GE Vernova completed the sale of its Proficy software business to TPG for USD 600 million. | Completed divestment; Proficy now operates as an independent HMI/SCADA, MES and analytics vendor. |
| In July 2026, Rockwell Automation released an enhanced FactoryTalk Analytics VisionAI with VisionStream and VisionLink. | Product release announced; adds label-free defect learning and support for third-party cameras, with no pricing disclosed. |
Edge data and AI inspection change plant analytics
- OT data fabrics collect data from controllers, historians and execution systems into one model at the edge, so analytics tools no longer need a separate interface for each machine.
- Edge AI inspection runs trained vision models on hardware next to the line, flagging defects in real time and sending results to quality records.
- Industrial copilots let operators and engineers query asset history, alarms and procedures in plain language, cutting the time spent building reports.
- Production virtual twins simulate line changes and schedules before they reach the floor, which reduces trial runs and changeover losses.
Need a Custom Version of This Report?
Tailor the scope, geography, or segments to your exact requirements.
- Custom geography or segment scope
- Direct access to our analyst team
Control of plant data decides competitive position
Competition turns on who owns the plant data layer and who can sell analytics into it across sites. Siemens, Rockwell Automation, ABB, Emerson and Honeywell Technologies sell analytics alongside control systems, which gives them access to plant engineers and large installed bases. Siemens added simulation and data science through its Altair purchase, and Emerson now owns all of AspenTech. Schneider Electric competes through AVEVA and its PI System historian, a common record of process plant data. SAP and Dassault Systèmes approach from enterprise planning and product lifecycle software, linking shop-floor data to orders and digital twin models. Proficy, now owned by TPG, Inductive Automation and Tulip compete as independent platforms on price, openness and speed of deployment. The main shift is that buyers now favor vendors whose data layer works with other suppliers' equipment.
How is the supply side organized and where do margins sit?
The supply side splits into three groups of vendors with different economics and buyers. Automation suppliers bundle analytics with controllers, drives and historians, so their software sales benefit from hardware relationships and long service contracts. Enterprise software vendors such as SAP and Dassault Systèmes sell analytics as part of larger suites, where switching costs are high once orders and quality data run through them. Independent platforms compete on openness and published prices, which keeps entry barriers lower but limits deal sizes. System integrators capture a large share of project value, because each plant needs connectors, data models and training. Margins are highest in recurring software subscriptions and lowest in one-off integration work.
Companies profiled and their roles in this market
| Company | Type | Role in the market |
|---|---|---|
| Siemens AG | Automation and software supplier | Opcenter execution, Insights Hub analytics and Industrial Copilot for discrete and process plants |
| Rockwell Automation, Inc. | Automation and software supplier | FactoryTalk analytics, VisionAI inspection and Plex cloud execution and quality software |
| Emerson Electric Co. (AspenTech) | Process automation and software | AspenTech Inmation data platform and AVA AI advisors for process plants |
| Schneider Electric SE (AVEVA) | Industrial software supplier | AVEVA PI System historian and CONNECT industrial intelligence platform |
| ABB Ltd. | Automation and software supplier | Genix industrial analytics and AI suite with Genix Copilot |
| Honeywell Technologies (formerly Honeywell International) | Automation and software supplier | Honeywell Forge Production Intelligence and Performance+ for Industrials analytics for process plants |
| Dassault Systèmes SE | Enterprise software vendor | DELMIA manufacturing operations and production virtual twin software |
| SAP SE | Enterprise software vendor | SAP Digital Manufacturing execution and shop-floor analytics linked to ERP |
| Proficy (TPG) | Independent platform | HMI/SCADA, MES, industrial data management and analytics for discrete and process plants |
| Inductive Automation, LLC | Independent platform | Ignition integration platform with historian, visualization and reporting modules per server |
| Tulip Interfaces, Inc. | Independent platform | No-code frontline operations apps priced per interface for plant floors |
Data-layer control matters more than dashboards
Credence Research's view is that control of the plant data layer, not the dashboard, will decide vendor positions in this market to 2035. Software still holds 66.0% of 2025 value, yet buyers increasingly judge suppliers on how quickly they connect mixed equipment and how well AI tools work on that data. Automation groups hold the strongest installed bases, while independent platforms win on openness and published prices. Evidence on copilot productivity is still thin, so buyers should require measured pilots before signing multi-site agreements, and vendors able to show audited savings will gain share.
Estimates rebased to 2025 with public plant data
The report uses 2025 as the base year and forecasts the market to 2035, with market values from the Credence Research model. The 2025 value updates the earlier Credence Research estimate with its own growth rate and was checked against public list prices, vendor disclosures and automation statistics. Regional and segment shares are Credence Research estimates built from public plant, robot and policy data. Sources include regulators such as the FDA and the European Commission, government ministries, the International Federation of Robotics, SEMI, industry associations and company releases. No interviews or surveys were used to build these estimates.
Multi-site AI rollouts set the growth path to 2035
Through 2035, the market is set to grow from USD 5.12 billion in 2026 to USD 15.51 billion, as analytics moves from single-plant dashboards to multi-site data layers with AI agents. Automotive keeps the largest share, while chip fabs and drug manufacturing add the fastest new demand. Asia Pacific gains share on China's smart factory tiers and India's expanding production base. Security reporting under European rules and ownership changes among vendors will shape contract terms. The main uncertainty is whether AI tools deliver savings large enough to justify enterprise-wide rollouts across plant networks.
AI results and plant spending set the range of outcomes
The forecast range depends on whether AI inspection and copilot projects deliver measurable savings and on how much manufacturers spend on new capacity. Weak returns from early AI pilots, combined with delays to plant investment, would keep many buyers at single-site deployments. Strong proof of defect and downtime savings, together with continued chip fab construction, would push more multi-site contracts.
| Scenario | CAGR, 2026–2035 | Value, 2035 | What has to hold |
|---|---|---|---|
| Downside | 11.1% | USD 13.21 billion | AI pilots stall, plant capital spending slows and buyers keep single-site deployments |
| Base | 13.10% | USD 15.51 billion | Inspection and copilot projects scale gradually alongside current fab and plant investment |
| Upside | 14.9% | USD 17.88 billion | Proven AI savings drive multi-site contracts across automotive, electronics and life sciences |
Frequently Asked Questions
How big is the enterprise manufacturing intelligence market?
What is enterprise manufacturing intelligence (EMI)?
Which region leads the market?
Which end-use industry leads and which grows fastest?
How is EMI software priced?
What is ABB Ability Genix used for?
What are the main challenges for buyers?
Who are the leading enterprise manufacturing intelligence companies?
Table of Content
Chapter 1 Market Segmentation
- 1.1 Segmentation Framework
- 1.1.1 Product and Service Classification
- 1.1.2 Application and End-Use Classification
- 1.1.3 Technology and Solution Classification
- 1.1.4 Customer and Distribution Channel Classification
- 1.1.5 Geographic Segmentation
- 1.1.6 Market Segment Definitions and Boundaries
- 1.2 By Deployment Type
- 1.2.1 Embedded
- 1.2.2 Standalone
- 1.3 By Offering
- 1.3.1 Software
- 1.3.2 Services
- 1.4 By End-Use Industry
- 1.4.1 Automotive
- 1.4.2 Semiconductors & Electronics
- 1.4.3 Aerospace & Defense
- 1.4.4 Medical Devices
- 1.4.5 Pharmaceutical
- 1.4.6 Chemical
- 1.4.7 Food & Beverage
- 1.4.8 Oil & Gas
- 1.4.9 Energy & Power
- 1.4.10 Others
Chapter 2 Introduction
- 2.1 Report Objectives and Scope
- 2.2 Product Definition and Industry Terminology
- 2.3 Market Inclusions and Exclusions
- 2.4 Research Process
- 2.4.1 Primary Research and Expert Interviews
- 2.4.2 Secondary Research and Source Review
- 2.4.3 Top-Down and Bottom-Up Estimation
- 2.4.4 Data Triangulation and Verification
- 2.5 Market Size Measurement Basis
- 2.5.1 2025: USD 4.53 billion → 2035: USD 15.51 billion
- 2.6 Historical and Forecast Reference Periods
- 2.6.1 Historical Period: 2018-2025
- 2.6.2 Base Year: 2025
- 2.6.3 Forecast Period: 2025-2035
- 2.7 Research Assumptions and Limitations
Chapter 3 Executive Summary
- 3.1 Market Snapshot and Key Findings
- 3.2 Base-Year Market Size, 2025
- 3.3 Forecast Market Size, 2035
- 3.4 Revenue and Volume Growth Outlook
- 3.5 Key Demand and Supply Indicators
- 3.6 Leading Market Segments
- 3.7 Fastest-Growing Market Opportunities
- 3.8 Regional Performance Highlights
- 3.9 Technology and Industry Transformation
- 3.10 Competitive Landscape Summary
- 3.11 Analyst View and Strategic Implications
Chapter 4 Global Enterprise Manufacturing Intelligence Market Trends and Developments
- 4.1 Historical Industry Development, 2018-2025
- 4.2 Recent Market Trends and Developments
- 4.3 Demand and Customer Behavior Trends
- 4.4 Technology and Product Innovation
- 4.5 Artificial Intelligence, Automation and Digitalization
- 4.6 Local Manufacturing and Supply Chain Realignment
- 4.7 Industry Partnerships, Mergers and Acquisitions
- 4.8 Sustainability and Circular Economy Developments
- 4.9 Government and Private Sector Investment Trends
- 4.10 Emerging Business Models and Commercialization
- 4.11 Industry Developments and Announcements
Chapter 5 Global Enterprise Manufacturing Intelligence Market Production, Supply and Demand Analysis
- 5.1 Demand Trend and Consumption Analysis, 2018-2025
- 5.2 Demand Forecast, 2025-2035
- 5.3 Production and Output Trend, 2018-2025
- 5.4 Production and Output Forecast, 2025-2035
- 5.5 Installed Capacity and Capacity Utilization
- 5.6 Company-Wise Production Plants and Statistics
- 5.6.1 Installed Production Capacity
- 5.6.2 Actual Production
- 5.6.3 Planned Capacity and Expansion Targets
- 5.7 Supply Chain Structure and Procurement Trends
- 5.8 Supply-Demand Gap and Bottlenecks
- 5.9 Import Dependence and Sourcing Structure
- 5.10 Contract Manufacturing and Outsourcing
- 5.11 Regional Supply and Demand Concentration
Chapter 6 Global Enterprise Manufacturing Intelligence Market Pricing Analysis
- 6.1 Pricing Structure and Measurement
- 6.2 Historical Pricing Trends, 2018-2025
- 6.3 Pricing Outlook, 2025-2035
- 6.4 Average Selling Price and Unit Economics
- 6.5 Pricing by Product and Market Segment
- 6.6 Geographic Pricing Differences
- 6.7 Key Input, Energy, Labor and Logistics Costs
- 6.8 Contract Pricing and Purchasing Models
- 6.9 Pricing Sensitivity and Competitive Positioning
- 6.10 Price, Margin and Profitability Implications
Chapter 7 Global Enterprise Manufacturing Intelligence Market Dynamics
- 7.1 Market Growth Drivers
- 7.1.1 Demand-Side Drivers
- 7.1.2 Technology and Innovation Drivers
- 7.1.3 Infrastructure and Investment Drivers
- 7.1.4 Regulatory and Policy Drivers
- 7.2 Market Restraints
- 7.2.1 Cost and Affordability Constraints
- 7.2.2 Technology and Adoption Barriers
- 7.2.3 Supply Chain and Operational Constraints
- 7.3 Market Challenges
- 7.3.1 Competitive Pressure and Margin Erosion
- 7.3.2 Skills, Infrastructure and Implementation Gaps
- 7.4 Emerging Market Opportunities
- 7.5 Market Dynamics Impact and Time-Horizon Assessment
Chapter 8 Global Enterprise Manufacturing Intelligence Value Chain Analysis
- 8.1 Industry Value Chain Overview
- 8.2 Upstream Suppliers and Critical Inputs
- 8.3 Technology and Component Providers
- 8.4 Manufacturing or Service Delivery
- 8.5 Distribution, Channel Partners and Integrators
- 8.6 Downstream Applications and End Users
- 8.7 Value Addition and Profit Pools
- 8.8 Vertical Integration and Outsourcing
- 8.9 Supplier Concentration and Risk
- 8.10 Supply Chain Localization and Resilience
Chapter 9 Global Enterprise Manufacturing Intelligence Market Regulations and Policies
- 9.1 Relevant Laws, Standards and Compliance Frameworks
- 9.2 Product, Service, Safety and Quality Requirements
- 9.3 Government Policies, Incentives and Subsidies
- 9.4 Imports, Exports and Trade Barriers
- 9.5 Public Procurement and Local Content Requirements
- 9.6 Environmental and Sustainability Compliance
- 9.7 Data Protection, AI and Cybersecurity Compliance
- 9.8 Upcoming Policy Changes and Market Implications
Chapter 10 Global Enterprise Manufacturing Intelligence Market Hotspots and Opportunities
- 10.1 Market Opportunity Mapping and Growth Hotspots
- 10.2 High-Growth Applications and Customer Groups
- 10.3 Underserved Markets and White-Space Opportunities
- 10.4 Emerging Technology and Product Opportunities
- 10.5 New Capacity and Investment Hotspots
- 10.6 Market Entry and Expansion Opportunities
- 10.7 Distribution and Partnership Opportunities
- 10.8 Near-Term and Long-Term Commercial Potential
- 10.9 Opportunity Attractiveness and Execution Risks
Chapter 11 Global Enterprise Manufacturing Intelligence Market Outlook, 2025-2035
- 11.1 Market Size and Analysis
- 11.1.1 Revenue (Market Measurement: 2025: USD 4.53 billion → 2035: USD 15.51 billion)
- 11.1.2 Market Volume and Quantity Sold
- 11.1.3 Historical Market Size, 2018-2025
- 11.1.4 Base-Year Market Size, 2025
- 11.2 Market Forecast, 2025-2035
- 11.2.1 Revenue Forecast to 2035
- 11.2.2 Volume Forecast to 2035
- 11.2.3 CAGR and Year-on-Year Growth
- 11.2.4 Incremental Revenue Opportunity
- 11.3 Forecast Assumptions and Scenario Analysis
- 11.3.1 Base-Case Forecast
- 11.3.2 Optimistic and Conservative Scenarios
- 11.3.3 Technology, Pricing and Policy Sensitivities
- 11.4 Market Attractiveness and Growth Outlook
Chapter 12 Global Enterprise Manufacturing Intelligence Market Segmentation and Outlook
- 12.1 Segmentation Summary and Market Shares, 2025
- 12.2 Largest and Fastest-Growing Segments
- 12.3 By Deployment Type - Market Size and Forecast, 2025-2035
- 12.3.1 Segment Definition and Scope
- 12.3.2 Historical Market Size, 2018-2025
- 12.3.3 Revenue Forecast, 2025-2035
- 12.3.4 Volume Forecast, 2025-2035
- 12.3.5 Base-Year Market Share, 2025
- 12.3.6 Segment CAGR and Growth Drivers
- 12.3.7 Subsegment Market Size and Forecast
- 12.3.7.1 Embedded
- 12.3.7.2 Standalone
- 12.3.8 Subsegment Pricing and Adoption Trends
- 12.3.9 Leading Suppliers and Competition
- 12.3.10 Regional Demand and Opportunities
- 12.4 By Offering - Market Size and Forecast, 2025-2035
- 12.4.1 Segment Definition and Scope
- 12.4.2 Historical Market Size, 2018-2025
- 12.4.3 Revenue Forecast, 2025-2035
- 12.4.4 Volume Forecast, 2025-2035
- 12.4.5 Base-Year Market Share, 2025
- 12.4.6 Segment CAGR and Growth Drivers
- 12.4.7 Subsegment Market Size and Forecast
- 12.4.7.1 Software
- 12.4.7.2 Services
- 12.4.8 Subsegment Pricing and Adoption Trends
- 12.4.9 Leading Suppliers and Competition
- 12.4.10 Regional Demand and Opportunities
- 12.5 By End-Use Industry - Market Size and Forecast, 2025-2035
- 12.5.1 Segment Definition and Scope
- 12.5.2 Historical Market Size, 2018-2025
- 12.5.3 Revenue Forecast, 2025-2035
- 12.5.4 Volume Forecast, 2025-2035
- 12.5.5 Base-Year Market Share, 2025
- 12.5.6 Segment CAGR and Growth Drivers
- 12.5.7 Subsegment Market Size and Forecast
- 12.5.7.1 Automotive
- 12.5.7.2 Semiconductors & Electronics
- 12.5.7.3 Aerospace & Defense
- 12.5.7.4 Medical Devices
- 12.5.7.5 Pharmaceutical
- 12.5.7.6 Chemical
- 12.5.7.7 Food & Beverage
- 12.5.7.8 Oil & Gas
- 12.5.7.9 Energy & Power
- 12.5.7.10 Others
- 12.5.8 Subsegment Pricing and Adoption Trends
- 12.5.9 Leading Suppliers and Competition
- 12.5.10 Regional Demand and Opportunities
- 12.6 Segment Growth Comparison
- 12.7 Segment Attractiveness and Priority Matrix
Chapter 13 Global Enterprise Manufacturing Intelligence End-Use and Application Market Outlook
- 13.1 End-Use Industry and Customer Demand Structure
- 13.2 Leading Applications and Customer Groups
- 13.3 End-Use Market Size, Share and Forecast
- 13.4 Major End-Use Industry Deep Dives
- 13.4.1 Customer Requirements and Use Cases
- 13.4.2 Demand and Replacement Cycles
- 13.4.3 Technical and Regulatory Considerations
- 13.4.4 Purchasing and Procurement Models
- 13.4.5 Leading Vendors and Distribution Channels
- 13.4.6 Forecast and Commercial Opportunities
- 13.5 Emerging Applications and Cross-Segment Demand
- 13.6 End-Use Industry Investment Priorities
Chapter 14 Global Enterprise Manufacturing Intelligence Geographic Market Outlook, 2025-2035
- 14.1 Regional Market Size and Share, 2025
- 14.2 Regional Market Forecast, 2025-2035
- 14.3 Regional Pricing, Production and Demand Differences
- 14.4 North America
- 14.4.1 United States
- 14.4.2 Canada
- 14.4.3 Mexico
- 14.5 Europe
- 14.5.1 Germany
- 14.5.2 France
- 14.5.3 Italy
- 14.5.4 United Kingdom
- 14.5.5 Spain
- 14.5.6 Poland
- 14.5.7 Russia
- 14.5.8 Netherlands
- 14.5.9 Belgium
- 14.5.10 Sweden
- 14.5.11 Denmark
- 14.5.12 Norway
- 14.5.13 Rest of Europe
- 14.6 Asia Pacific
- 14.6.1 China
- 14.6.2 India
- 14.6.3 Japan
- 14.6.4 South Korea
- 14.6.5 Thailand
- 14.6.6 Indonesia
- 14.6.7 Vietnam
- 14.6.8 Malaysia
- 14.6.9 Australia
- 14.6.10 Rest of Asia Pacific
- 14.7 Latin America
- 14.7.1 Brazil
- 14.7.2 Argentina
- 14.7.3 Colombia
- 14.7.4 Chile
- 14.7.5 Rest of Latin America
- 14.8 Middle East
- 14.8.1 Saudi Arabia
- 14.8.2 United Arab Emirates
- 14.8.3 Turkey
- 14.8.4 Israel
- 14.8.5 Iran
- 14.8.6 Rest of the Middle East
- 14.9 Africa
- 14.9.1 South Africa
- 14.9.2 Egypt
- 14.9.3 Nigeria
- 14.9.4 Morocco
- 14.9.5 Rest of Africa
- 14.10 Regional Investment, Policy and Supply Chain Differences
- 14.11 Regional Competitive Landscape
- 14.12 Geographic Growth Hotspots
Chapter 15 Global Enterprise Manufacturing Intelligence Technology, Innovation and Sustainability Outlook
- 15.1 Technology Landscape and Maturity
- 15.2 Product, Process and Service Innovation
- 15.3 AI, Automation and Digital Tools in the Industry
- 15.4 Technology Adoption and Performance Benchmarking
- 15.5 Innovation Pipeline and R&D Investment
- 15.6 Patent and Intellectual Property Trends
- 15.7 Energy Efficiency and Resource Management
- 15.8 Sustainability, Recycling and Circularity
- 15.9 Technology Roadmap, 2025-2035
- 15.10 Risks of Obsolescence and Technology Substitution
Chapter 16 Global Enterprise Manufacturing Intelligence Market Key Strategic Imperatives
- 16.1 Growth and Market Entry Priorities
- 16.2 High-Return Products and Segments
- 16.3 Pricing, Profitability and Cost Optimization
- 16.4 Technology Investment and Product Differentiation
- 16.5 Supply Chain Localization and Resilience
- 16.6 Distribution and Customer Acquisition
- 16.7 Partnership, Acquisition and Capacity Strategy
- 16.8 Regional Expansion Priorities
- 16.9 Short-, Medium- and Long-Term Actions
Chapter 17 Competition Outlook
- 17.1 Industry Competition Characteristics
- 17.2 Market Structure and Concentration
- 17.3 Market Share and Competitive Positioning, 2025
- 17.4 Company-Wise Revenue and Product Benchmarking
- 17.5 Production and Service Capacity Benchmarking
- 17.6 Technology, Pricing and Differentiation
- 17.7 Regional Footprint and Distribution Strength
- 17.8 Mergers, Acquisitions and Strategic Alliances
- 17.9 New Entrants and Competitive Threats
- 17.10 Porter's Five Forces and Industry Attractiveness
- 17.11 Competitive Outlook, 2025-2035
Chapter 18 Company Profiles
- 18.1 Company Coverage and Selection Criteria
- 18.2 Siemens AG
- 18.2.1 Business Description
- 18.2.2 Company Ownership and Geographic Presence
- 18.2.3 Product and Service Portfolio
- 18.2.4 Manufacturing and Operating Footprint
- 18.2.5 Production Capacity and Expansion Plans
- 18.2.6 Financial Performance and Investment
- 18.2.7 Market Share and Competitive Position
- 18.2.8 Technology and Innovation Capabilities
- 18.2.9 Strategic Alliances or Partnerships
- 18.2.10 Recent Developments
- 18.2.11 Growth Strategy and Outlook
- 18.3 Rockwell Automation, Inc.
- 18.4 Emerson Electric Co. (AspenTech)
- 18.5 Schneider Electric SE (AVEVA)
- 18.6 ABB Ltd.
- 18.7 Honeywell Technologies (formerly Honeywell International)
- 18.8 Dassault Systèmes SE
- 18.9 SAP SE
- 18.10 Proficy (TPG)
- 18.11 Inductive Automation, LLC
- 18.12 Tulip Interfaces, Inc.
- 18.13 Other Relevant Market Participants
Note: Every listed company is profiled on the structure shown under the first company. The company list is preliminary and may change based on research findings, market developments, data availability and client requirements.
Chapter 19 Disclaimer
- 19.1 Research and Forecast Disclaimer
- 19.2 Data Source and Estimation Limitations
Note: The depth of individual sections depends on data availability for this market. Volume, capacity, trade and other unit-based metrics are included where applicable.

