
Audited climate data now drives digital spending
The global green technology and sustainability market was valued at USD 25.55 billion in 2025 and is projected to increase from USD 30.60 billion in 2026 to USD 155.56 billion by 2035, registering a CAGR of 19.80% during 2026–2035. Spending comes from companies that must measure emissions, energy and water use across sites and suppliers, from building owners that automate energy control, and from utilities, city agencies and farms that monitor air, water, weather and soil with connected sensors and analytics. North America held the largest regional share, 36.0% in 2025, supported by large enterprise software buyers and state climate disclosure rules in California. Asia Pacific is the fastest-growing region at 21.6% a year, as carbon markets in China, Japan and India place thousands of industrial emitters under verified reporting. The commercial picture changed in 2025 and 2026, because the EU narrowed its corporate reporting scope while carbon prices, border levies and AI-driven power demand widened the need for measured, auditable data.
Which digital tools turn climate targets into measured data?
The market counts the sensors, connectivity, cloud platforms, analytics, digital twins and security tools that companies, utilities and public agencies buy to measure and reduce environmental impact. Buyers usually pay annual software subscriptions, plus integration, data collection and assurance support services, and often add field sensors for buildings, water networks and farms.
Solar panels, wind turbines, batteries and other energy hardware sit outside the scope, although the software that monitors and optimizes them is counted. Consulting that does not include a software or data service is also excluded, which keeps the value focused on the digital layer between physical assets and reported results.
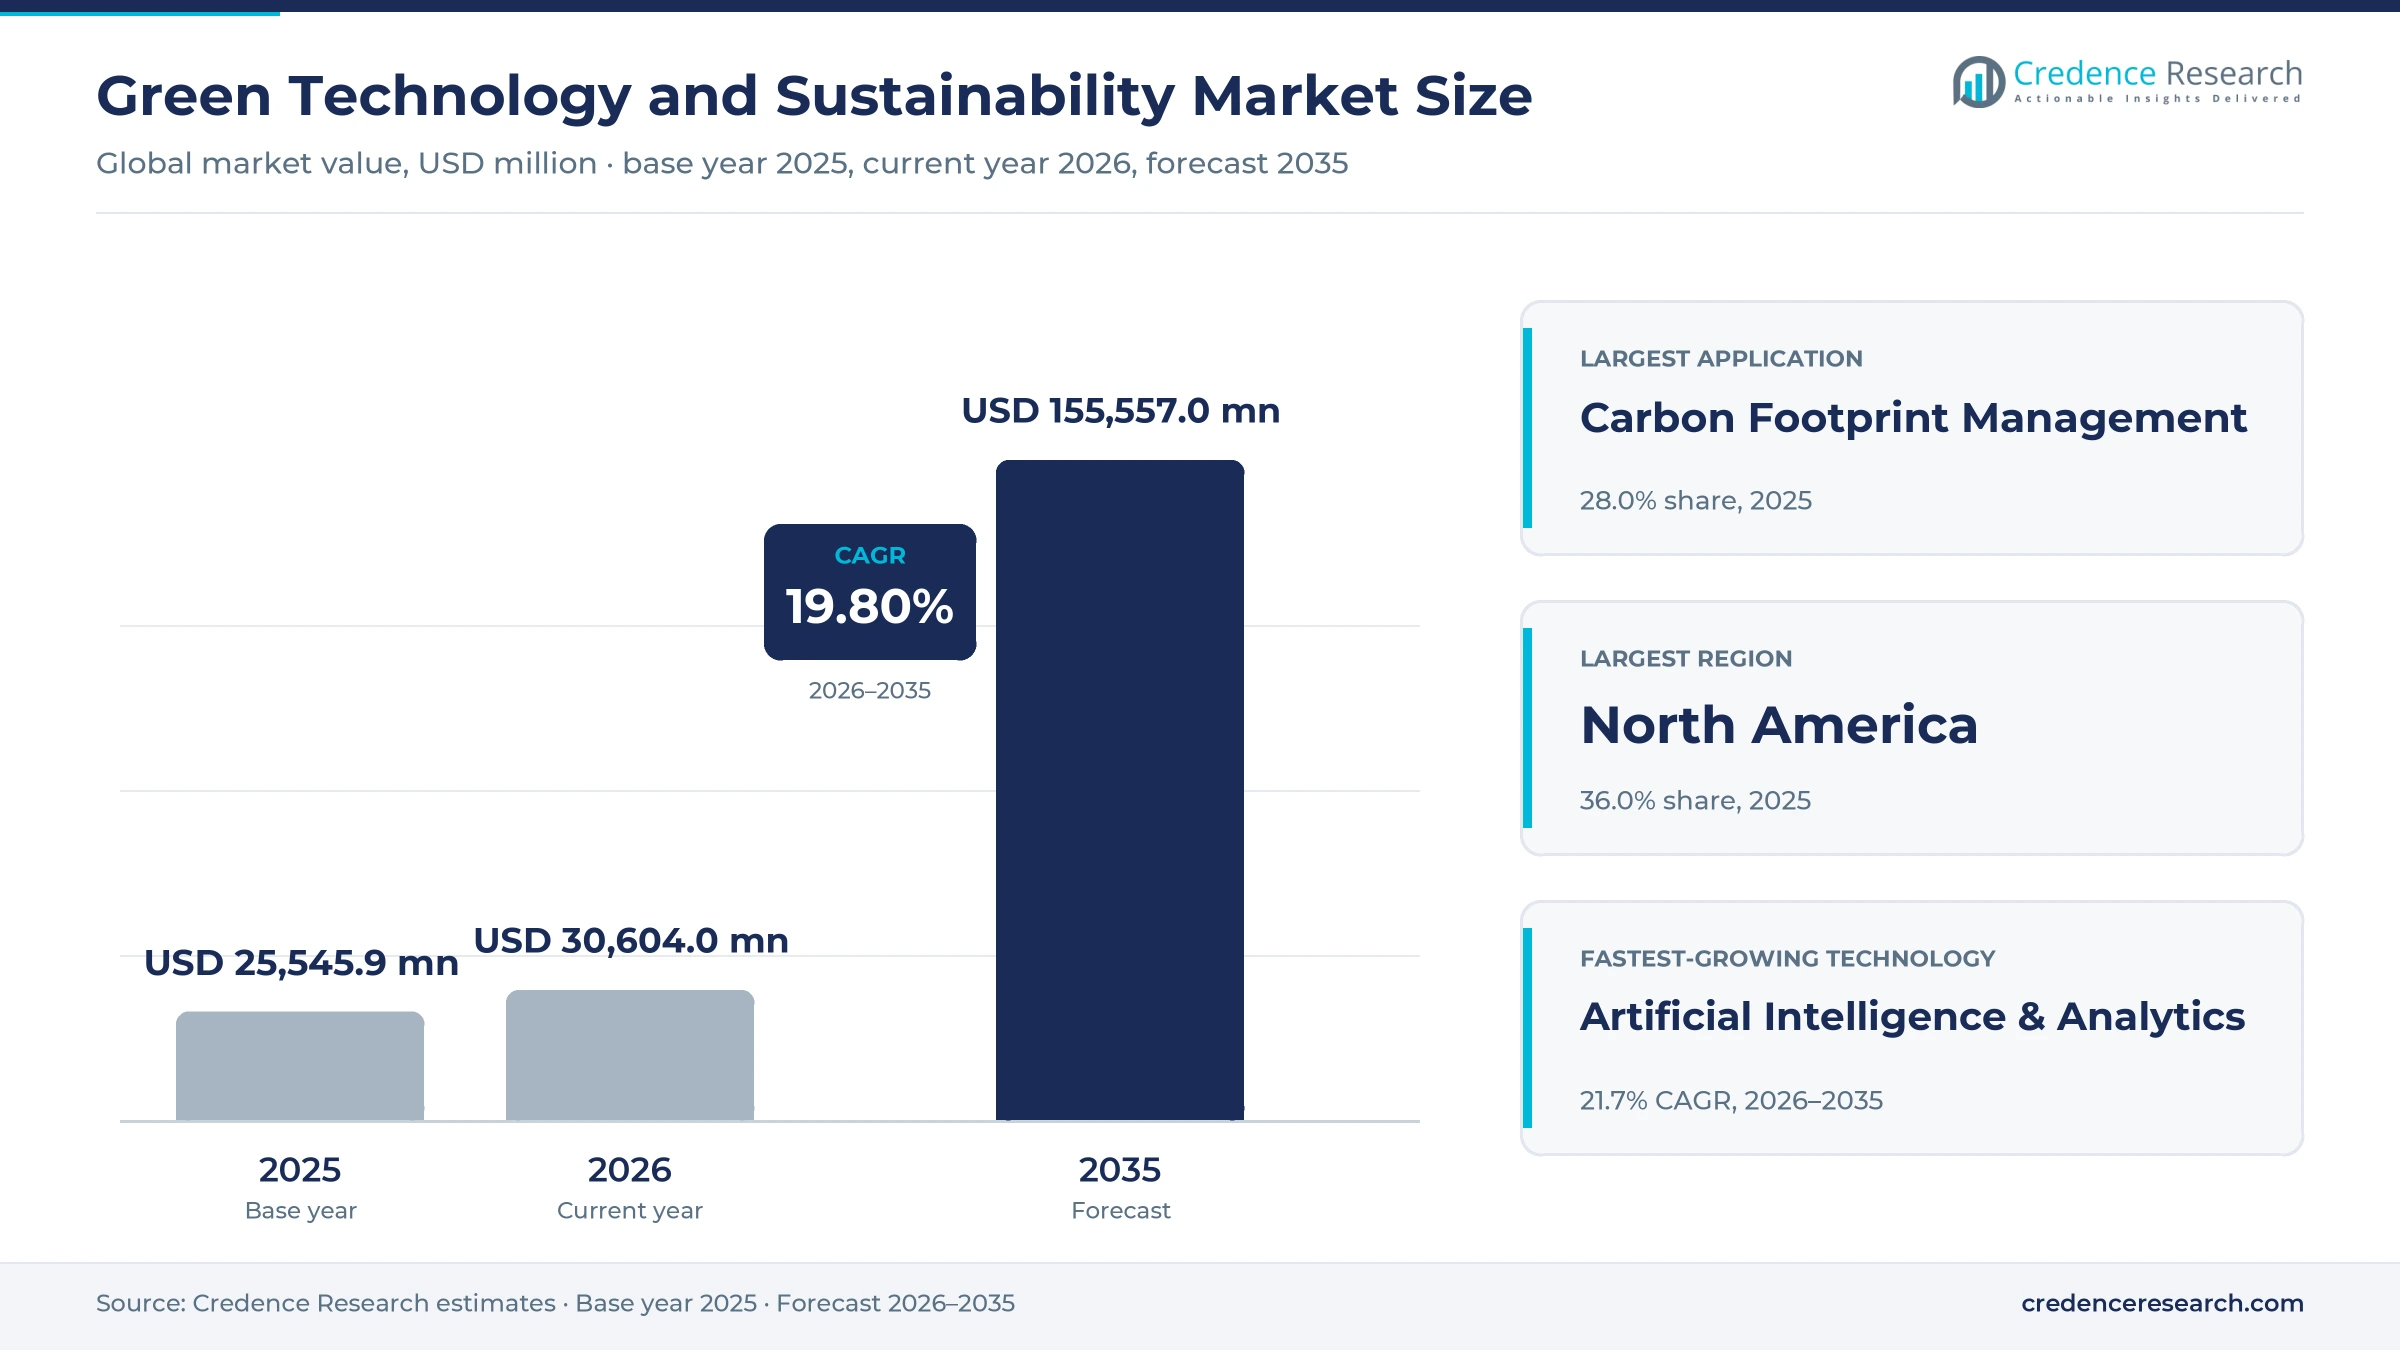
Green Technology and Sustainability Market Insights
- The market is valued at USD 25.55 billion in 2025 and should reach USD 155.56 billion by 2035, growing at a 19.80% CAGR as carbon data moves into audited filings.
- North America led with 36.0% of 2025 value, as large software buyers and California emissions rules keep demand concentrated there.
- Carbon Footprint Management held 28.0% of 2025 value, while Artificial Intelligence & Analytics grows fastest at 21.7% a year.
- The EU agreed on Dec. 9, 2025, to limit corporate sustainability reporting to companies with more than 1,000 employees and EUR 450 million turnover.
- Arcadia completed its purchase of ENGIE Impact on April 29, 2026, combining energy data software with bill management across 4.5 million utility meters.
Sensors and carbon tracking hold the largest shares
Why do IoT sensors lead while AI analytics grows faster?
Based on technology, the market is categorized into Internet of Things (IoT), artificial intelligence & analytics, cloud computing, digital twin, cyber security and blockchain. Internet of Things (IoT) led with 30.0% of 2025 value because meters, sensors and building controllers produce the raw readings every other layer depends on. Ericsson counted about 4.5 billion cellular IoT connections at the end of 2025 and expects 7.8 billion by 2031. Artificial Intelligence & Analytics grows fastest at 21.7% a year as vendors automate the slowest reporting tasks. IBM said in June 2026 that AI categorization of spend-based Scope 3 data in Envizi reached 90% accuracy, up from 20%, which cuts manual mapping of large supplier ledgers.
Why does carbon tracking lead while pollution monitoring grows faster?
Based on application, the market is categorized into carbon footprint management, green building, air and water pollution monitoring, crop & soil monitoring, weather monitoring & forecasting and others. Carbon Footprint Management led with 28.0% of 2025 value because data requests now reach far beyond regulated firms. CDP reported that more than 22,100 companies disclosed environmental data in 2025, while more than 270 large buyers asked about 45,000 suppliers to report. Air and Water Pollution Monitoring grows fastest at 21.3% a year as tighter limits require denser networks. The revised EU Ambient Air Quality Directive took effect on Dec. 10, 2024, and cuts the annual PM2.5 limit by more than half by 2030.
Why do software solutions lead while services grow faster?
Based on component, the market is categorized into solutions and services. Solutions led with 67.0% of 2025 value because buyers increasingly want emissions recorded inside the systems that already hold financial transactions. SAP made its Green Ledger carbon accounting system generally available on Dec. 16, 2024, linking emissions to ERP records, with Covestro named as a pilot user. Services grow fastest at 20.8% a year as reported data must now pass verification. The UAE requires annual Scope 1 and Scope 2 reports from entities above 0.5 million metric tons to be checked by an ISO 14065-accredited verifier, creating recurring assurance and data-preparation work.
| Segment Group | Leading Sub-segment | Share, 2025 | Fastest-growing Sub-segment | CAGR, 2026–2035 |
|---|---|---|---|---|
| By Technology | Internet of Things (IoT) | 30.0% | Artificial Intelligence & Analytics | 21.7% |
| By Application | Carbon Footprint Management | 28.0% | Air and Water Pollution Monitoring | 21.3% |
| By Component | Solutions | 67.0% | Services | 20.8% |
Annual subscriptions set the entry price for carbon data
Enterprise carbon and ESG software is sold as annual subscriptions priced per tenant, per organization or per user, so published list prices fall between tens of thousands and low hundreds of thousands of dollars a year before integration. Microsoft charges three times as much for its Premium tier as for Essentials, and the step up buys Scope 3 coverage across all 15 categories plus AI credits. Free entry tiers such as Persefoni Pro push basic footprinting toward zero price, which moves vendor margins into audit-grade data, supplier engagement and integrations. Buyers weigh these license prices against data collection, integration and assurance work, which public price lists do not show.
| Offer or plan | Typical price or fee | Basis |
|---|---|---|
| Microsoft Dynamics 365 Sustainability Essentials | USD 4,000 per tenant per month, paid yearly | Microsoft price list, November 2026 |
| Microsoft Dynamics 365 Sustainability Premium | USD 12,000 per tenant per month, paid yearly | Microsoft price list, November 2026 |
| Salesforce Net Zero Cloud user pack, 500 users | USD 60,000 per org per year | Salesforce add-ons price list, November 2026 |
| CRM Analytics for Net Zero Cloud | USD 165 per user per month, billed annually | Salesforce add-ons price list, November 2026 |
| Persefoni Pro carbon accounting, one user | USD 0 for one user, with paid report and support add-ons | Persefoni pricing page, November 2026 |
Request a Free Sample
Fill in your details and we'll send you a free sample report.
- Sample data tables & charts
- Research methodology
Disclosure rules and carbon prices lift data spending
Mandatory disclosure turns emissions into audited filings
Mandatory disclosure turns emissions data from a communications exercise into a regulated filing, which requires systems that keep every figure traceable to its source. The IFRS Foundation said in June 2025 that 36 jurisdictions had adopted or were finalizing steps to use ISSB standards. In California, companies with more than USD 1 billion in revenue must file Scope 1 and Scope 2 emissions under SB 253, and the state air board set Nov. 10, 2026, as the first reporting deadline, Greenberg Traurig noted in October 2026. The Shanghai Stock Exchange called 2026 the first assessment year of its listed companies' ESG disclosure. Each rule adds filers that spreadsheets cannot serve at audit grade, which favors carbon accounting vendors with assurance-ready data trails.
Carbon prices and border levies put a price on each metric ton
Carbon prices convert measured emissions into a cost line, so producers and importers invest in meters and software that defend every reported metric ton. The EU ETS auction price averaged EUR 73.43 a metric ton in 2025, according to ICAP. The EU carbon border adjustment entered its definitive period on Jan. 1, 2026, and importers above a 50-metric-ton annual threshold must register as authorized declarants and pay for embedded emissions. China added about 1,500 steel, cement and aluminum entities to its national market, lifting coverage to about 8 billion metric tons, with the first compliance deadline at the end of 2025. Steel, cement and aluminum exporters gain most from installation-level carbon data, because verified values can replace default values in border declarations.
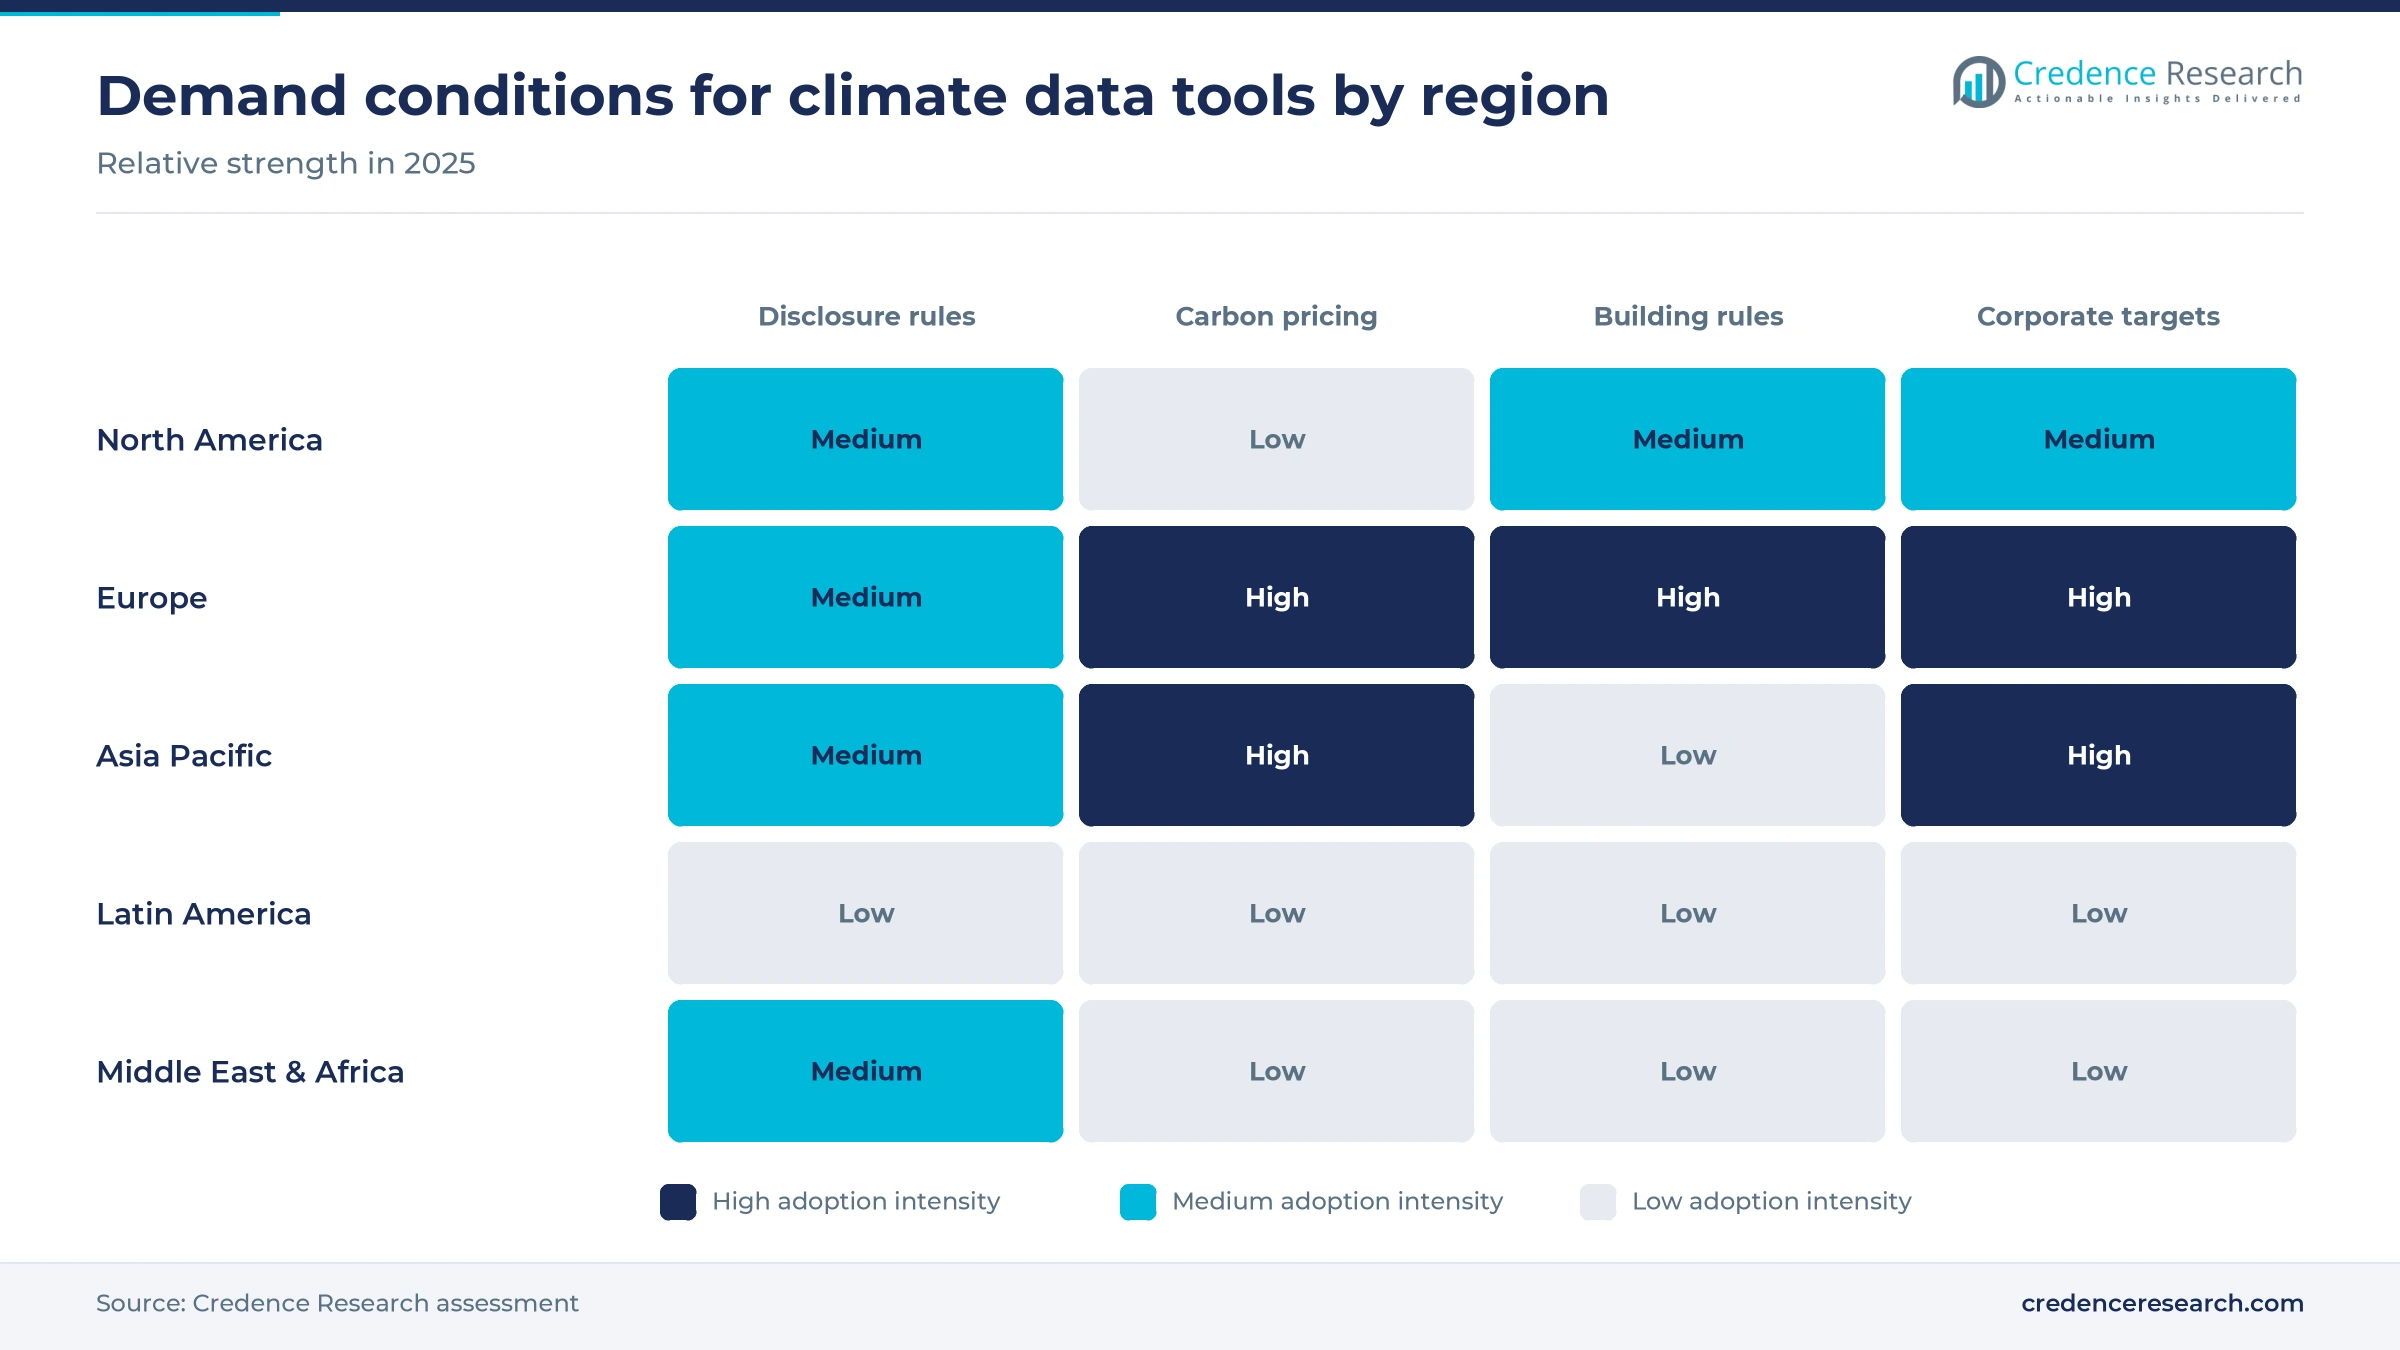
AI power demand forces hour-by-hour energy optimization
Electricity demand from data centers is pushing companies and utilities to buy software that matches load with low-carbon supply hour by hour. The IEA estimates that data centers used about 415 TWh in 2024 and could need about 945 TWh by 2030, just under 3% of global electricity. Microsoft reported in May 2025 that its total emissions were 23.4% above its 2020 baseline, even after contracting 34 GW of carbon-free electricity in 24 countries. The IEA also puts grid investment at about USD 400 billion a year in 2025, short of the pace of generation and electrification spending. Utilities and data center operators gain most from forecasting, congestion analytics and smart grid controls that defer costly network upgrades.
Validated climate targets lock in years of measurement
Validated climate targets create a multi-year measurement duty, because companies must show progress against a fixed baseline every year. The SBTi said 9,764 companies had validated science-based targets at the end of 2025, a 40% rise in one year, while net-zero targets grew 61%. Asia added 1,216 companies and now holds 36% of all validated targets. CDP said 640 investors with USD 127 trillion in assets asked it to collect company data in 2025, so disclosure pressure stays on listed firms even where rules have softened. Suppliers in Asian manufacturing hubs face the sharpest new data requests from customers that must report emissions from purchased goods and services across supply chains.
Embedded AI and platform deals reshape supply
Vendors shift carbon data into ERP and AI agents
Software vendors are shifting toward carbon accounting embedded in finance systems and AI agents to address audit requirements, creating openings for API-based emissions services across procurement, reporting and energy management. IBM released an Envizi Emissions API in April 2026 with GHG Protocol-aligned Scope 1, Scope 2 and Scope 3 calculations, plus an Excel add-in that requires no coding. Schneider Electric announced a multi-year agentic AI initiative for sustainability and energy management on May 15, 2025, folding in capabilities from its EcoAct acquisition. SAP's ledger approach, noted above, shows the same move toward carbon data held next to financial transactions. Vendors that own the transaction record gain an advantage, while standalone dashboards risk becoming a feature inside larger suites.
Platform consolidation rises across energy data and sensing
Larger suppliers are buying data and sensing specialists to offer one platform from meter reading to reported result. Arcadia closed its purchase of ENGIE Impact on April 29, 2026, and the combined company manages 4.5 million utility meters and more than USD 30 billion in annual utility payments. Siemens completed its acquisition of Altair on March 26, 2025, adding simulation and data science tools to its digital twin portfolio. CropX announced its eighth acquisition since 2020, near-infrared sensing firm SCIO, on Aug. 26, 2026, and serves customers in more than 70 countries. Buyers gain fewer integrations to manage, but face higher switching costs once data history sits with one vendor.
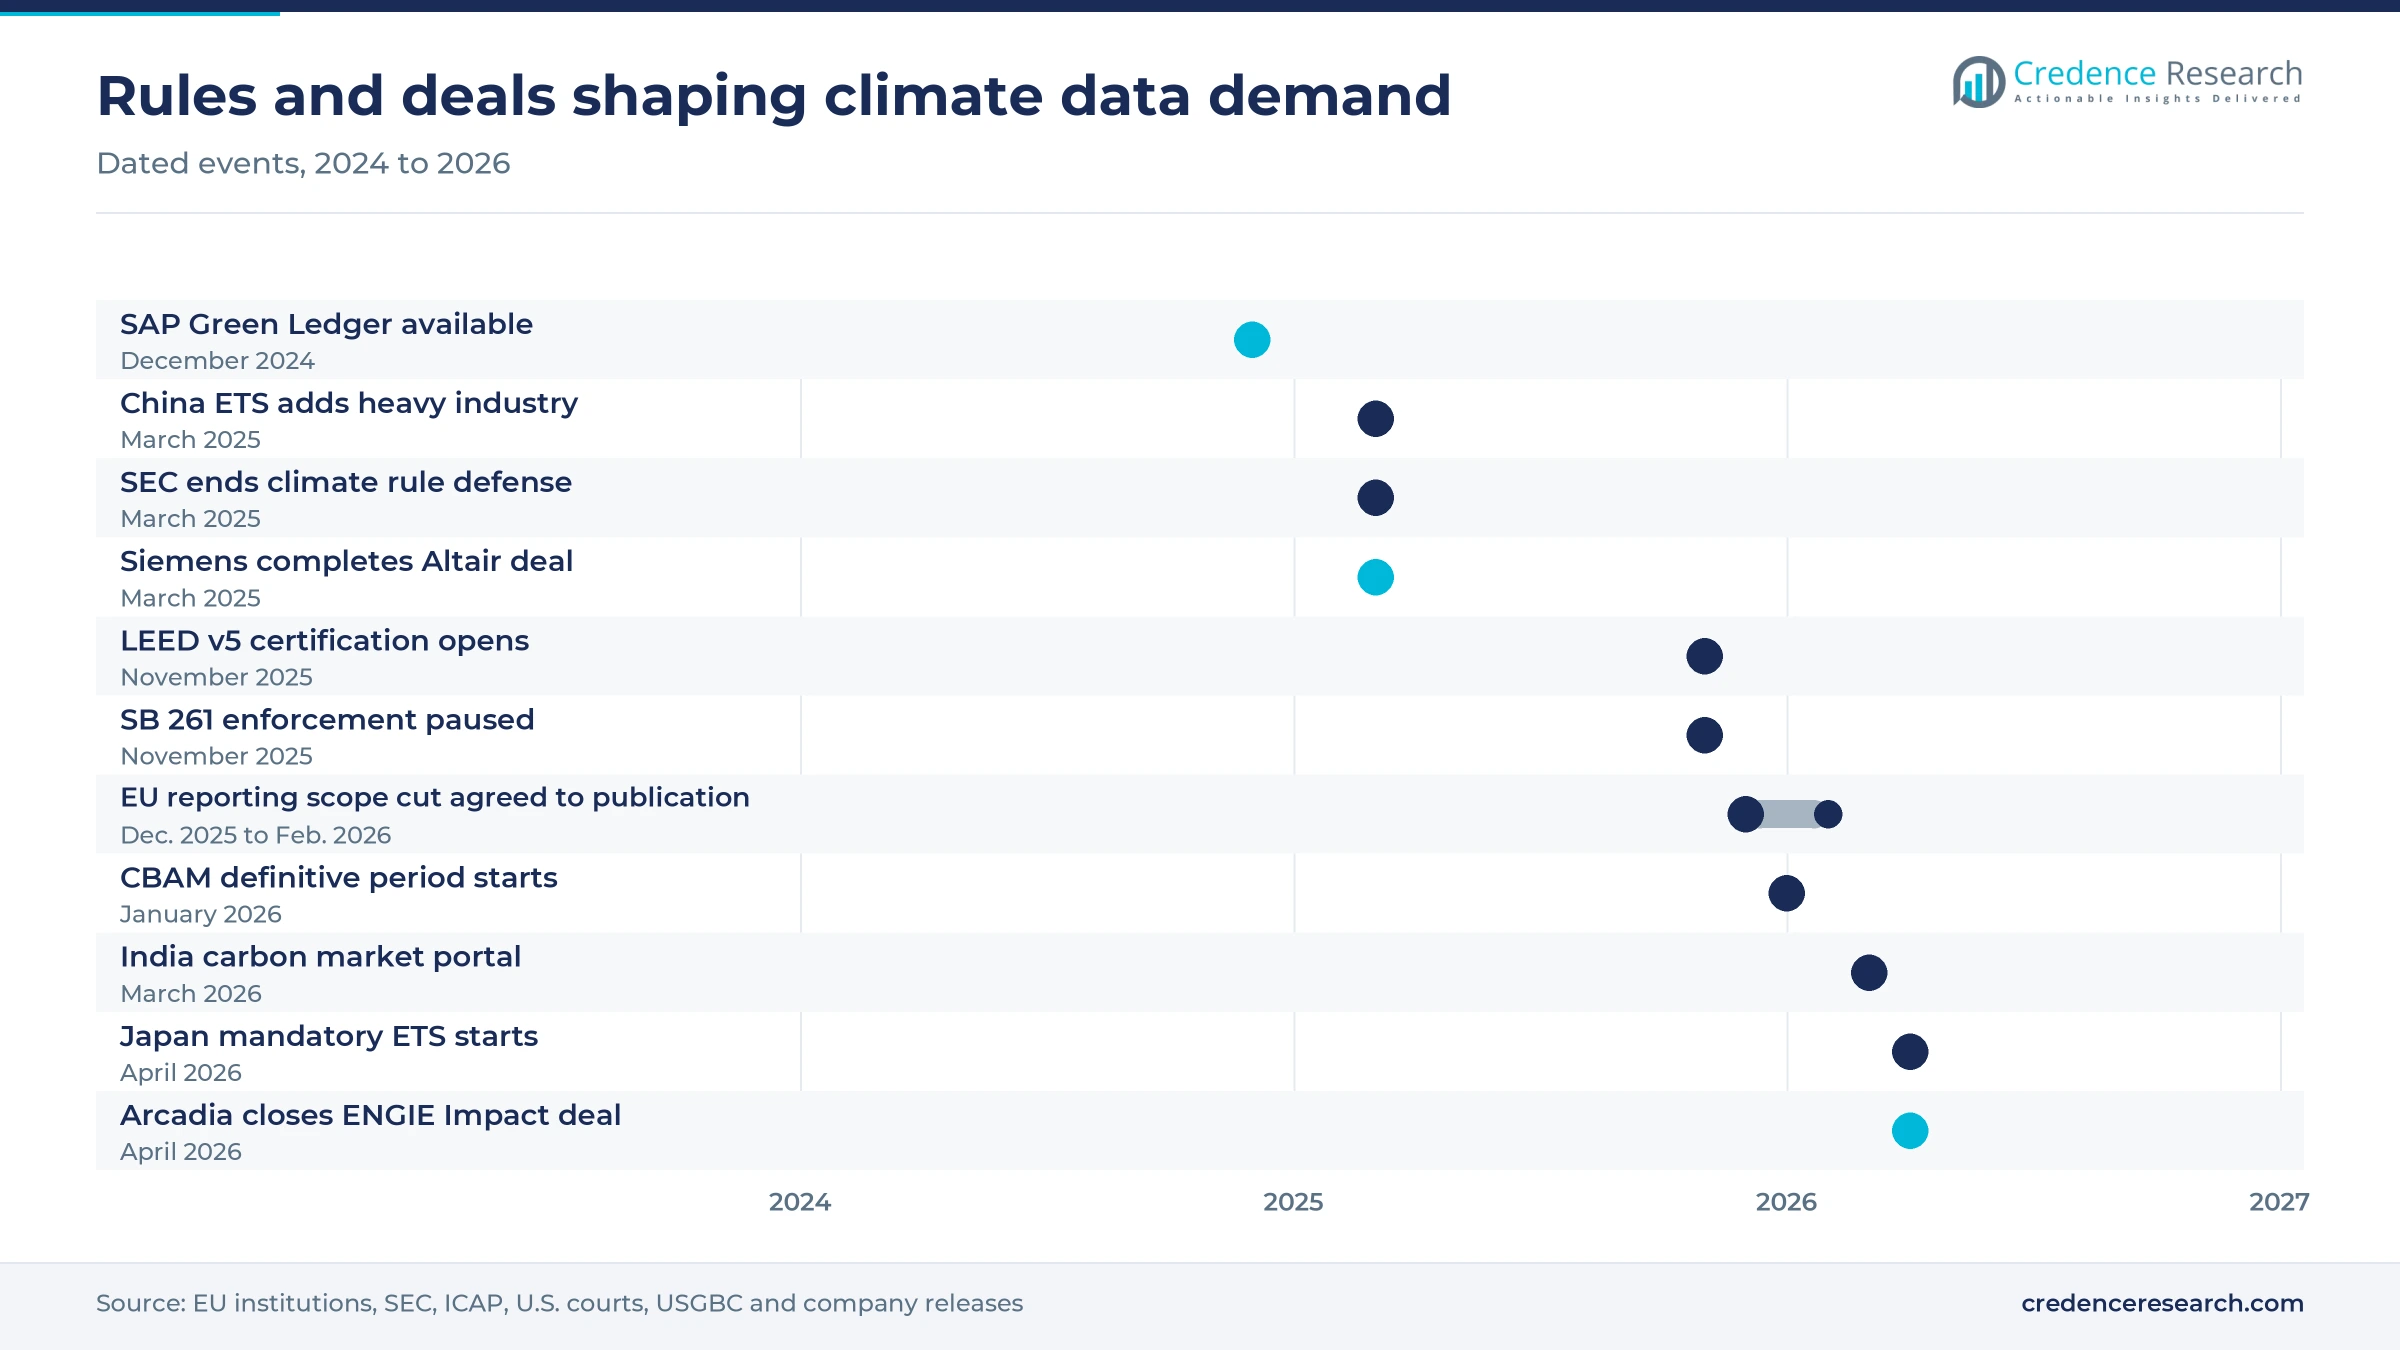
Building automation rules create a retrofit opening
European building rules create a clear opening for automation, metering and analytics in commercial property. The recast EU Energy Performance of Buildings Directive requires building automation and control systems in non-residential buildings with heating or cooling systems above 290 kW, and extends the duty to systems above 70 kW by the end of 2029. USGBC opened LEED v5 certification on Nov. 3, 2025, and Platinum projects now need minimum carbon reductions for the first time. More than 20 early adopters certified under the LEED v5 operations rating during beta testing. Owners of offices, retail and logistics sites form the main buyer group for building energy management systems that document these savings.
New compliance carbon markets create an MRV opening
Compliance carbon markets in Asia and Latin America create an opening for monitoring, reporting and verification software among heavy industrial emitters. India placed about 490 entities in seven sectors under emission-intensity targets, launched its Indian Carbon Market Portal on March 21, 2026, with first certificate trading planned for mid-2026, according to ICAP. Japan began the mandatory phase of its emissions trading system on April 1, 2026, covering companies above 100,000 metric tons a year and nearly 60% of domestic emissions. Brazil's Law 15,042 of December 2024 plans mandatory MRV plans for emitters above 10,000 metric tons during 2028 and 2029. Vendors with local registry links and verifier networks gain first.
Narrower reporting rules slow parts of demand
EU scope cuts shrink the mandatory reporting base
The EU narrowed its corporate reporting law, which removes many mid-size companies from mandatory demand. Parliament and Council agreed on Dec. 9, 2025, that reporting applies only to companies with more than 1,000 employees and EUR 450 million in turnover, and the directive was published on Feb. 26, 2026. Vendors and service firms that built pipelines around mid-size EU filers are most exposed. Demand from voluntary reporters and supply chain requests should offset part of the loss, but sales cycles lengthen.
U.S. federal retreat leaves state rules carrying demand
U.S. federal climate disclosure has stalled, so demand depends on state rules and investor pressure. The SEC voted on March 27, 2025, to end its legal defense of the climate disclosure rules it adopted in March 2024. The Ninth Circuit then paused enforcement of California's SB 261 climate risk law on Nov. 18, 2025, pending appeal. Companies below the revenue threshold of California's emissions law now have little legal reason to buy audit-grade systems. Vendors selling mainly on compliance to these firms face slower conversion.
Delayed rules in Brazil and the UAE defer purchases
Several emerging markets have softened or delayed reporting duties, which pushes software purchases further out. Brazil's securities regulator made ISSB-aligned reporting voluntary in June 2026 under a comply-or-explain approach, after mandatory reporting had been set for 2026 data. In the UAE, the climate law's May 30, 2026, compliance date was expected to be extended until technical guidance is issued, according to Ropes & Gray in April 2026. Local integrators and verifiers that hired ahead of these dates carry idle capacity until rules settle.
Extended water deadlines slow monitoring upgrades
Longer drinking water deadlines reduce near-term pressure on utilities to add contaminant monitoring and analytics. The U.S. EPA said on May 13, 2025, that it would keep its PFOA and PFOS limits but planned to extend the compliance date from 2029 to 2031. Small and midsize water systems, which rely on state revolving funds, are most likely to delay purchases. Suppliers of water quality sensors and analytics face a flatter order curve until the new rule is final.
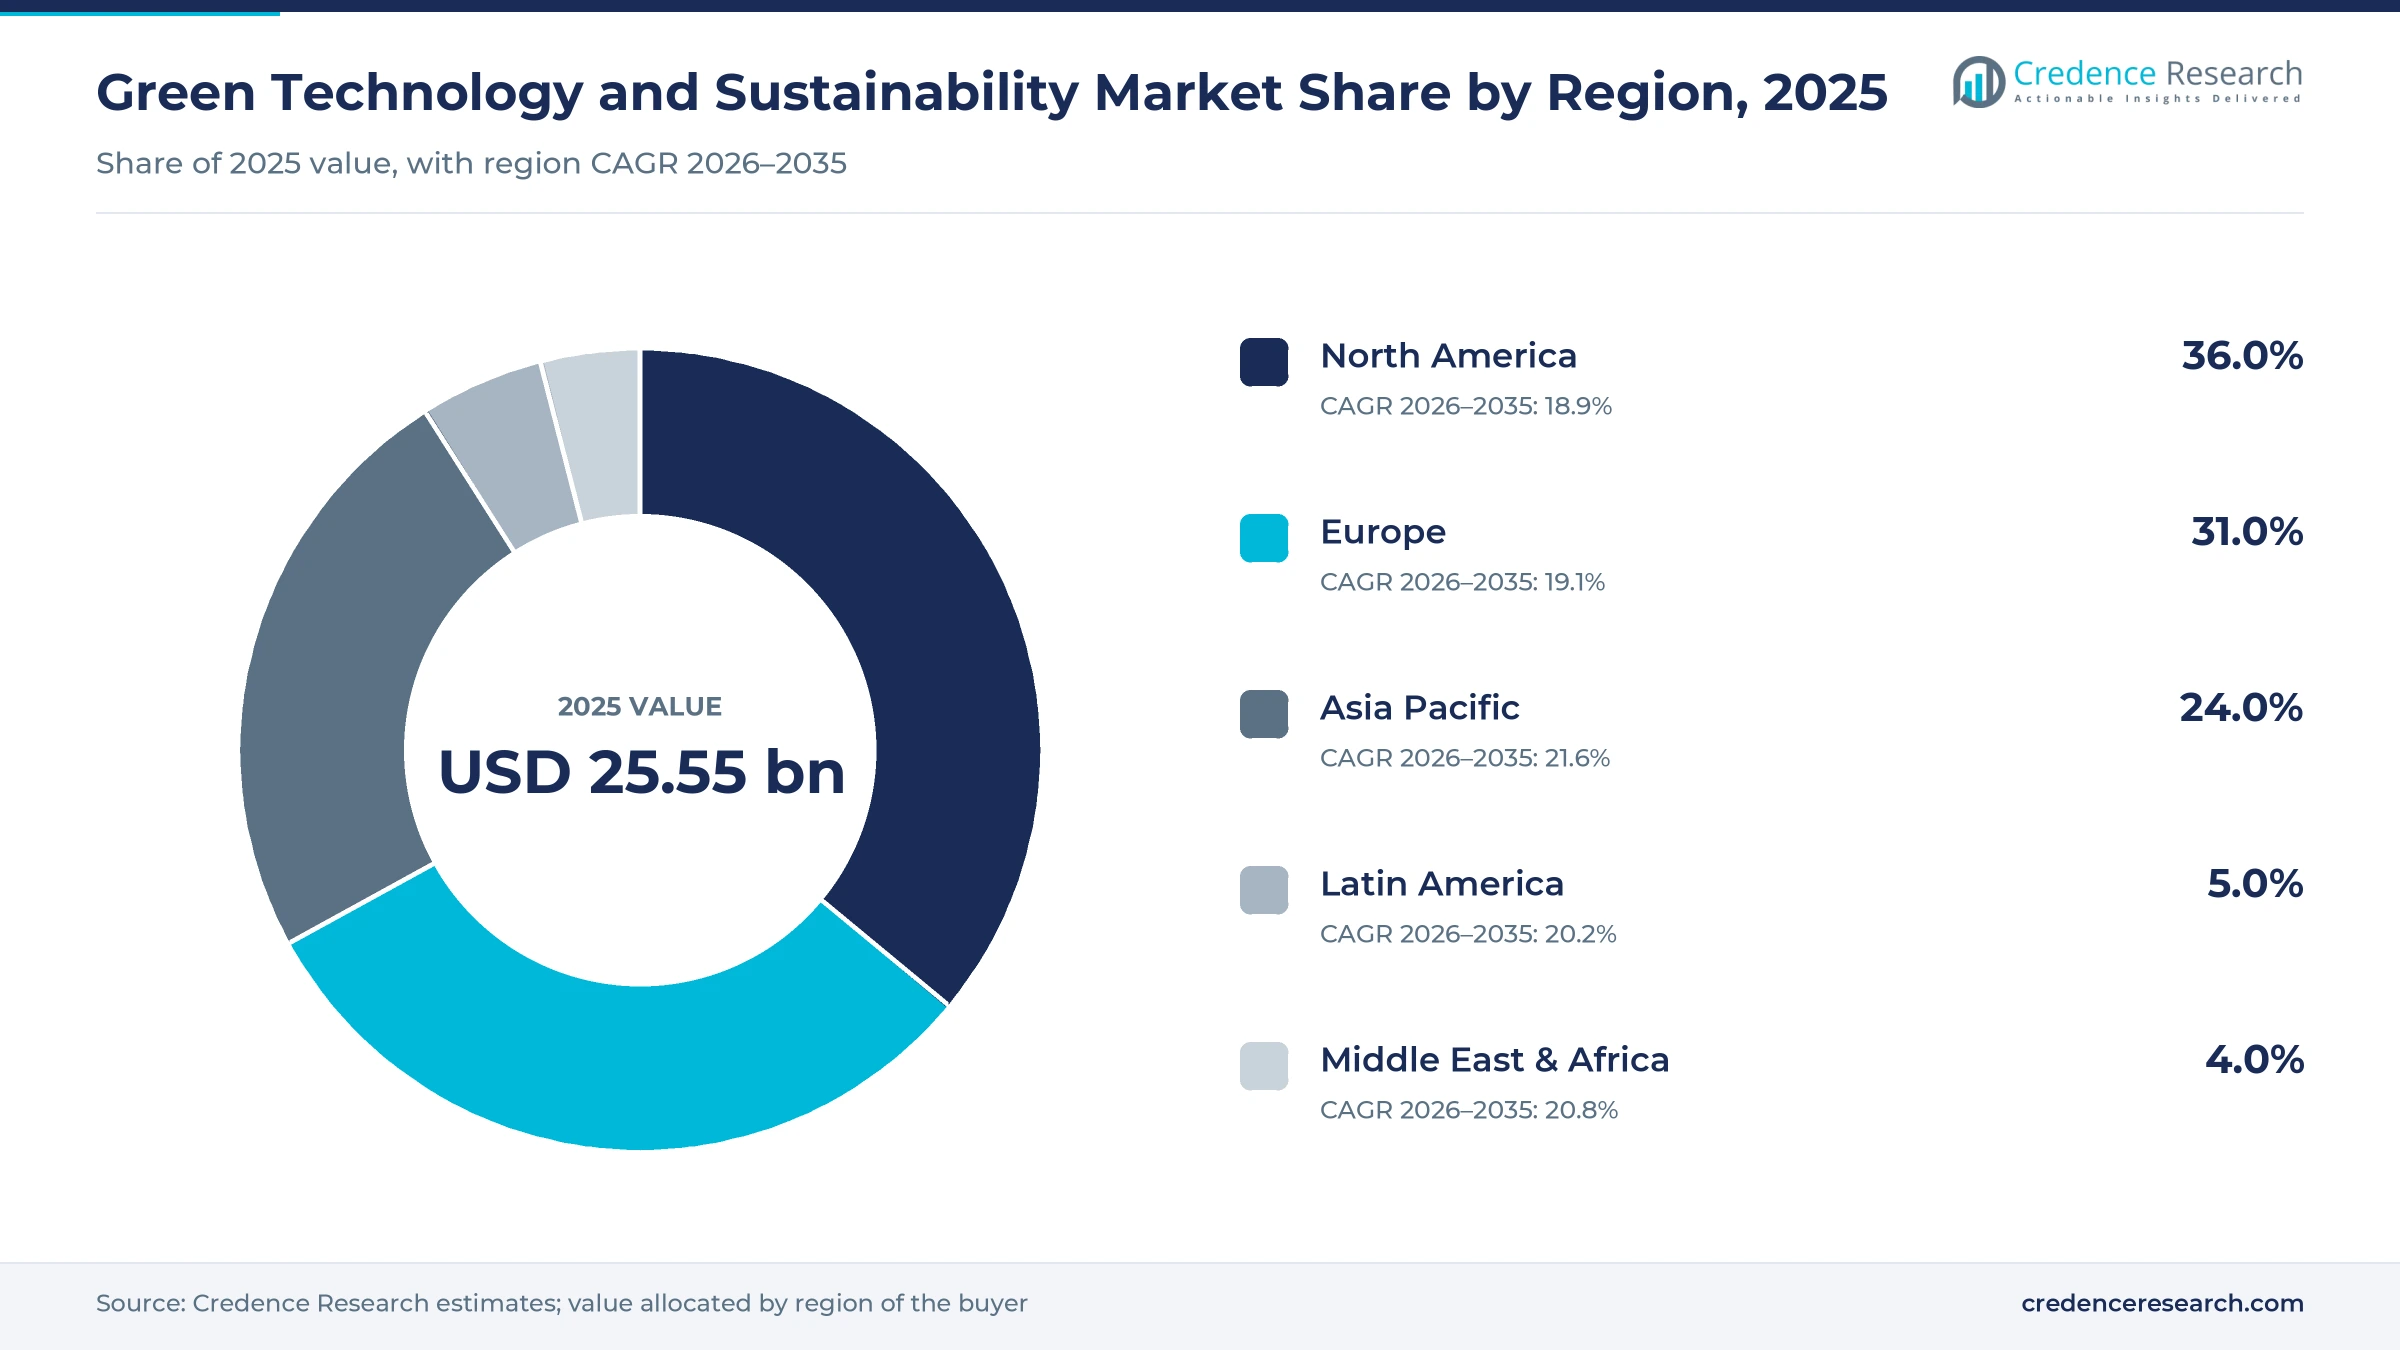
North America leads as Asia Pacific grows fastest
| Region | Value, 2025 (USD billion) | Share, 2025 | CAGR, 2026–2035 |
|---|---|---|---|
| North America | 9.20 | 36.0% | 18.9% |
| Europe | 7.92 | 31.0% | 19.1% |
| Asia Pacific | 6.13 | 24.0% | 21.6% |
| Latin America | 1.28 | 5.0% | 20.2% |
| Middle East & Africa | 1.02 | 4.0% | 20.8% |
North America leads on enterprise software buying
North America held 36.0% of 2025 value and grows at 18.9% a year. The region hosts the largest enterprise software buyers and several of the main platform vendors named below. The first California reports from companies above USD 1 billion in revenue fell due on Nov. 10, 2026, keeping demand for audit-ready systems steady despite the federal retreat. Growth trails the global rate because federal rules no longer add filers, and water monitoring orders slow with the EPA deadline extension.
Europe grows on carbon pricing despite reporting cuts
Europe held 31.0% of 2025 value and grows at 19.1% a year. Carbon pricing, not reporting law, now carries most new European demand after the scope cut. EU ETS auctions raised about EUR 43.2 billion in 2025, according to ICAP, including revenue for EU funds that finance industrial decarbonization projects, and each funded project needs a measured emissions baseline. Border levies, air quality limits and building automation duties, all described above, support demand from importers, cities and property owners.
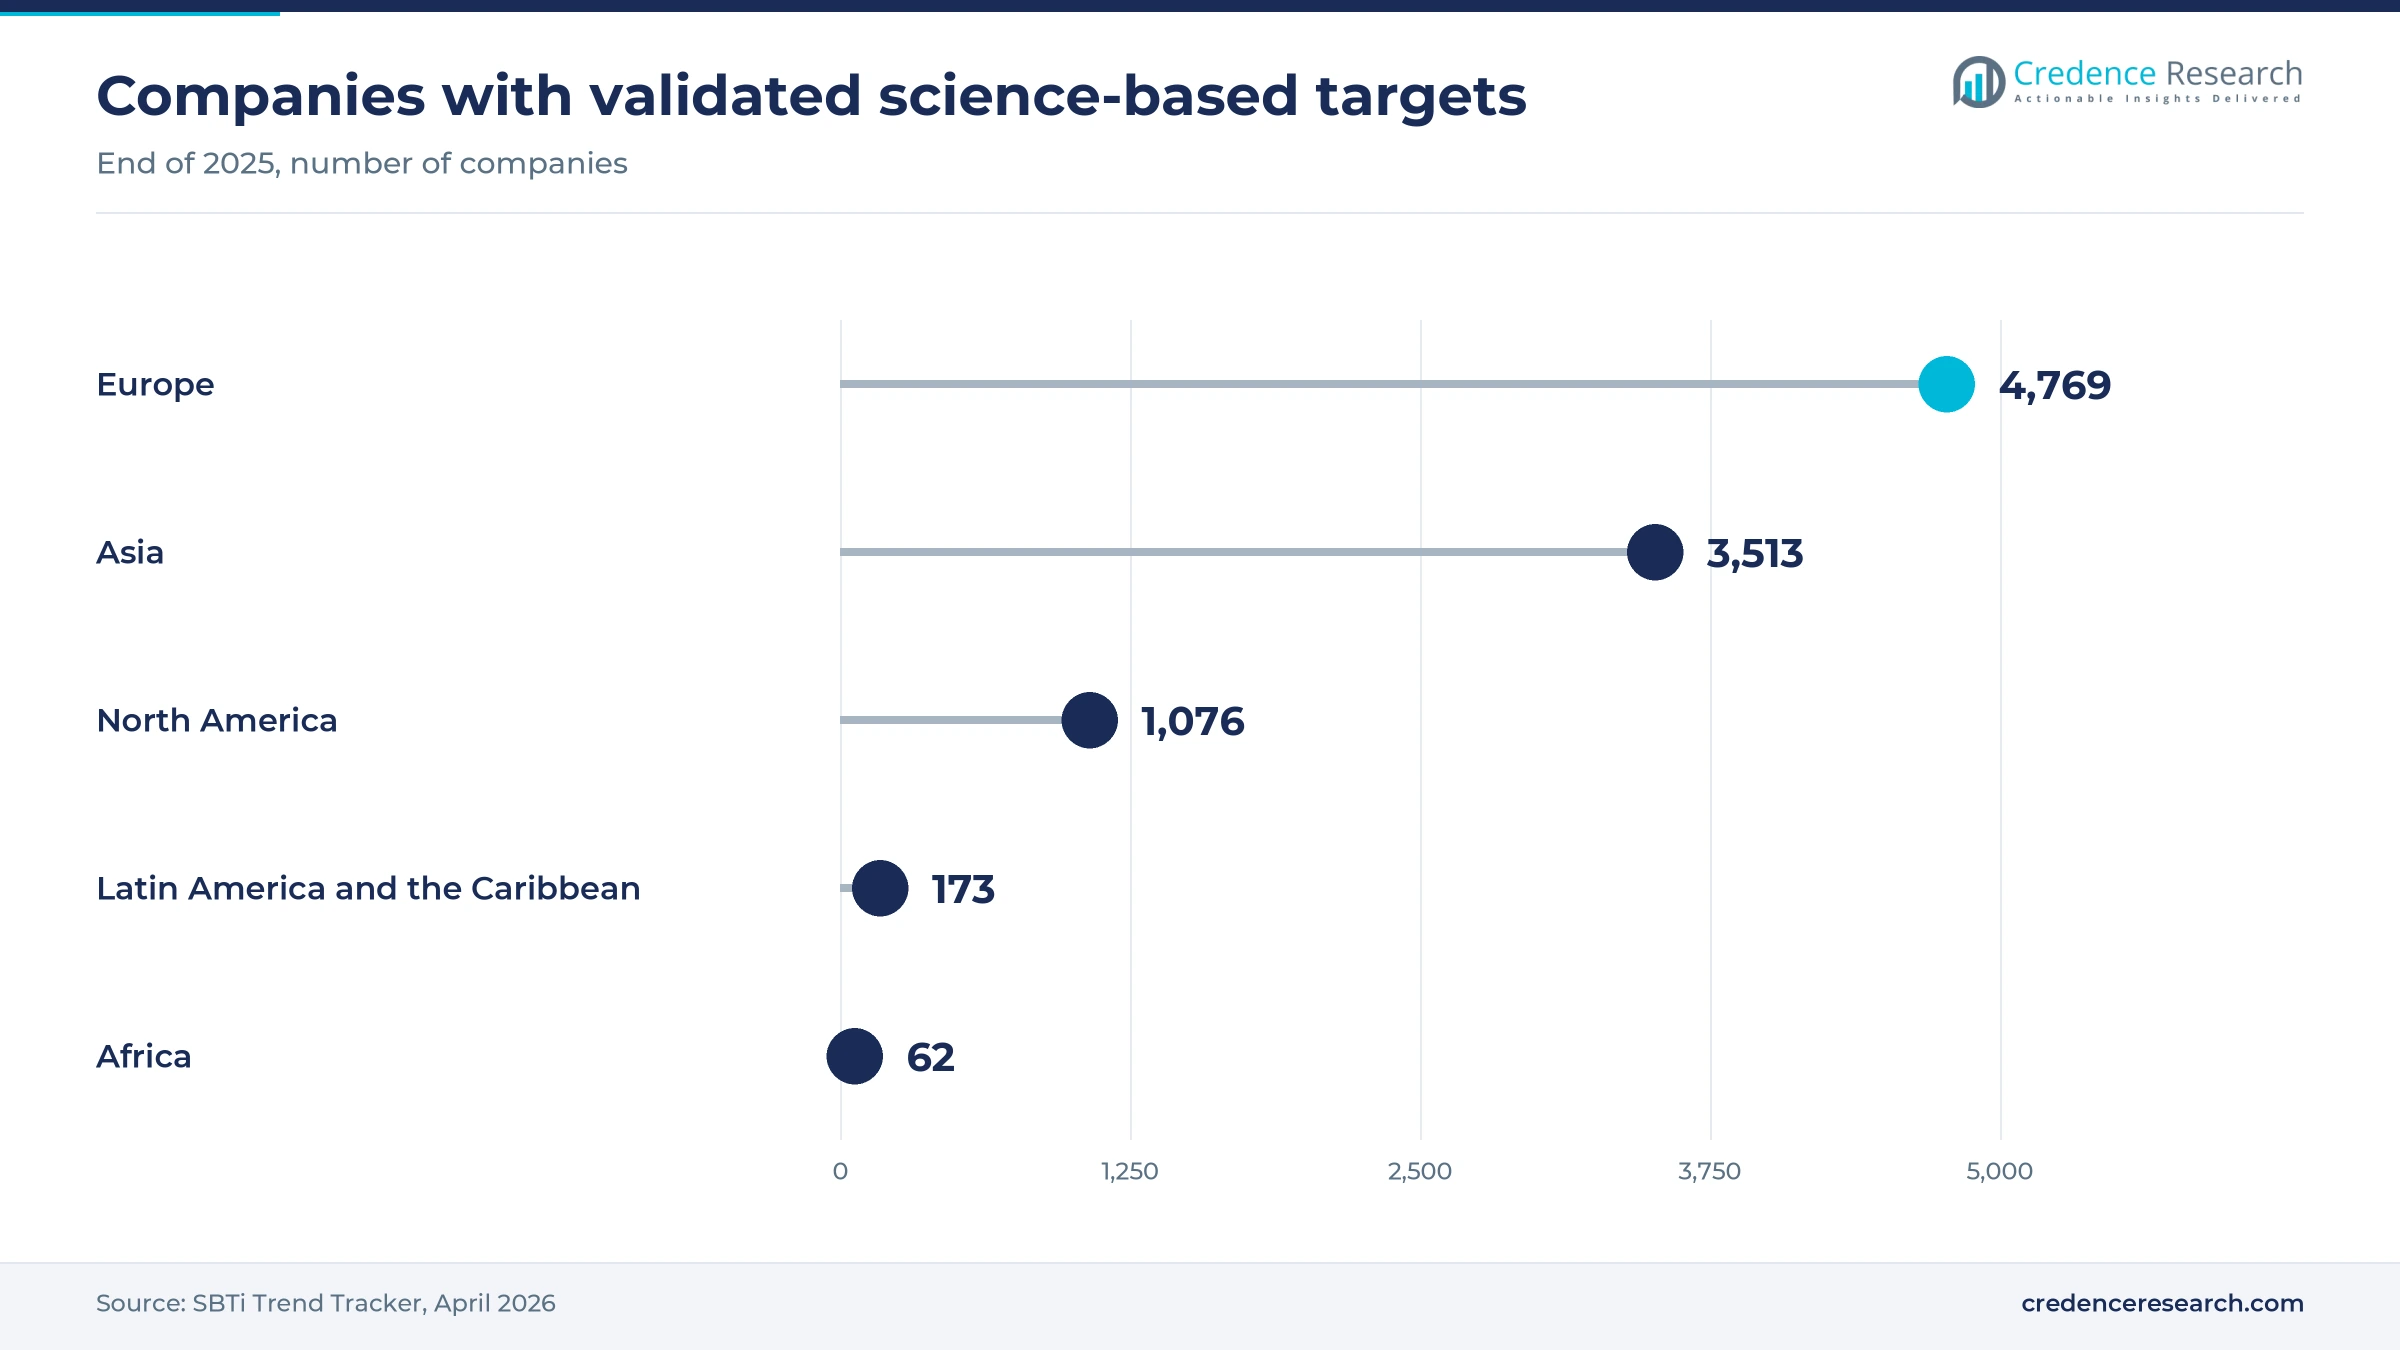
Asia Pacific grows fastest on new carbon markets
Asia Pacific held 24.0% of 2025 value and grows fastest at 21.6% a year. SBTi data show 2,091 Japanese companies with validated targets, the most of any country, and Prime Market companies worth JPY 3 trillion or more must report under Japan's new standards from the fiscal year ending March 2027, according to the Financial Services Agency. China's expanded carbon market and India's target scheme, noted above, put thousands of plants under verified reporting. Domestic vendors compete strongly in China, so global suppliers rely on local partners there.
Latin America waits on Brazil's carbon market
Latin America held 5.0% of 2025 value and grows at 20.2% a year. Demand rests mainly on exporters that must supply product carbon data to European buyers, since the EU border adjustment noted above prices embedded emissions in imported steel, cement and fertilizer. Brazil's carbon market law sets MRV duties only from 2028, and reporting rules for listed firms turned voluntary in 2026, so domestic mandates add little demand before 2028. Public data on regional software spending are thin, so this 2025 regional estimate carries wider uncertainty.
Middle East & Africa grows on Gulf reporting rules
Middle East & Africa held 4.0% of 2025 value and grows at 20.8% a year. In Abu Dhabi, facilities in industry, power, oil and gas and transport emitting at least 25,000 metric tons a year must report by March 31, with third-party verification from 2027, according to Ropes & Gray. The UAE climate law sets fines of AED 50,000 to AED 2 million for reporting violations. Africa had only 62 companies with validated targets at the end of 2025, so demand outside the Gulf remains limited.
Acquisitions in 2025 and 2026 widened vendor reach
| Development | Status and market relevance |
|---|---|
| In April 2026, Arcadia completed its acquisition of ENGIE Impact, combining energy data software with bill management and procurement services. | Completed; the combined company keeps the Arcadia name and serves more than 1,500 enterprise customers. |
| In July 2025, GE Vernova agreed to acquire Alteia, a French AI computer vision company already used in GridOS Visual Intelligence. | Acquisition completed, as later reported by Zawya; it adds visual inspection data to grid software. |
| In October 2025, Wolters Kluwer Enablon launched a cloud-native process hazard analysis application for industrial sites. | Product launch; it extends the Enablon EHS and ESG suite in oil and gas, chemicals and manufacturing. |
| In November 2025, Intelex, a Fortive operating company, introduced Input AI and Insight AI for EHSQ data capture and analysis. | Product launch; it targets data quality at entry, which matters for audited environmental records. |
| In August 2026, CropX announced the acquisition of SCIO, a maker of portable near-infrared spectroscopy for agriculture and food. | Acquisition announced; no price or closing date disclosed; it adds crop and soil sensing to the CropX platform. |
APIs, agents and digital twins change the toolset
- Emissions APIs calculate Scope 1, Scope 2 and Scope 3 values inside procurement and finance systems, so activity data no longer moves through spreadsheets and each figure keeps a link to its source record.
- Agentic AI drafts disclosures, classifies supplier spend and extracts utility bill data, so lean sustainability teams can close reporting cycles in weeks rather than months.
- Digital twins simulate buildings, plants and grids before retrofits, letting owners test energy and emissions savings in advance and rank projects by cost per metric ton avoided.
- Low-power cellular IoT connects meters and environmental sensors across farms, water networks and cities, cutting the cost of continuous monitoring compared with manual sampling.
Need a Custom Version of This Report?
Tailor the scope, geography, or segments to your exact requirements.
- Custom geography or segment scope
- Direct access to our analyst team
Data estates and audit trust decide competitive position
Competition turns on who already owns the customer's data, because carbon and energy figures must reconcile with finance, procurement and operations records. Microsoft, SAP, Salesforce and IBM use their existing data estates to sell sustainability modules, as the ERP and API moves described above show. Schneider Electric, Siemens and GE Vernova compete through operational data from buildings, factories and grids, and each has added AI or simulation capability since 2025. Wolters Kluwer Enablon, Cority and Intelex sell EHS and ESG software to heavy industry, where compliance records and incident data overlap. Persefoni competes in carbon accounting with a free entry tier, while Arcadia brings utility bill and meter data at scale. Buyers increasingly favor vendors whose data can pass assurance, a test that raises the bar for small dashboard providers.
How is the supply side organized and where do margins sit?
The supply side is organized in three distinct layers of suppliers. Enterprise platforms such as Microsoft, SAP, Salesforce and IBM sell sustainability modules on top of data their customers already hold, which gives them distribution and integration advantages. Industrial and energy groups such as Schneider Electric, Siemens and GE Vernova link operational technology data from buildings, plants and grids. EHS and ESG specialists, including Wolters Kluwer Enablon, Cority and Intelex, carbon specialists such as Persefoni and energy data firms such as Arcadia compete on depth. The market is moderately fragmented, and margins sit in recurring subscriptions and verified data services rather than in basic calculation.
Companies profiled and their roles in this market
| Company | Type | Role in the market |
|---|---|---|
| Microsoft Corporation | Enterprise platform | Dynamics 365 Sustainability for emissions, water and waste data management |
| SAP SE | Enterprise platform | Green Ledger and sustainability tools linking emissions to ERP transactions |
| IBM Corporation (Envizi) | Enterprise platform | Envizi ESG suite with emissions API and AI-assisted Scope 3 categorization |
| Salesforce, Inc. | Enterprise platform | Net Zero Cloud for carbon accounting and supplier engagement |
| Schneider Electric SE | Energy and automation group | Resource Advisor software and sustainability advisory with EcoAct |
| Siemens AG | Industrial technology group | Building automation, digital twin and simulation software for energy efficiency |
| GE Vernova Inc. | Energy technology group | GridOS grid software with AI visual intelligence for utilities |
| Wolters Kluwer N.V. (Enablon) | EHS and ESG specialist | Enablon EHS, ESG and operational risk software for industrial sites |
| Cority Software Inc. | EHS and ESG specialist | Environmental, health, safety and ESG reporting software |
| Fortive Corporation (Intelex) | EHS and ESG specialist | Intelex EHSQ software with AI data capture and analysis |
| Arcadia (ENGIE Impact) | Energy data specialist | Utility data, bill management and energy procurement platform |
| Persefoni AI, Inc. | Carbon accounting specialist | Carbon accounting software with free Pro tier and enterprise plans |
Verified data, not report volume, will pick the winners
Credence Research's view is that the winners will be suppliers whose data survives an audit, not those that produce the most reports. Carbon Footprint Management still holds 28.0% of 2025 value, yet the regulatory base for it is shifting from European reporting rules toward carbon prices and Asian trading systems. That shift favors vendors with installation-level measurement, registry links and finance-grade data trails. Enterprise platforms hold the strongest position because they own the underlying records, while specialists keep an opening in heavy industry and emerging carbon markets. The pace of rule changes remains the main forecast risk.
Estimates rebased to 2025 with disclosure and price data
The report uses 2025 as the base year and forecasts the market to 2035, with market values from the Credence Research model. The 2025 value updates the earlier Credence Research estimate with its own growth rate and was checked against disclosure counts, published software list prices and sensor connection data, while the forecast growth rate was moderated for the longer horizon. Regional and segment shares are Credence Research estimates built from public data. Sources include the EU institutions, the IEA, ICAP, SBTi, CDP, regulators in the United States, Japan, Brazil and the UAE, and company releases. No interviews or surveys were used to build these estimates.
Carbon markets and AI power loads set the path to 2035
Through 2035, the market is set to grow from USD 30.60 billion in 2026 to USD 155.56 billion, as carbon markets in China, Japan, India and later Brazil put more emitters under verified reporting. AI analytics gains share fastest, because automated categorization and data extraction cut the labor that limits reporting today. Asia Pacific gains share on these new markets, while Europe shifts from mandatory reporting toward carbon pricing and building rules. North America depends on California rules and continued investor pressure on listed companies. The main uncertainty is whether further scope cuts outweigh the demand created by carbon prices and AI-driven power loads.
Rule changes and carbon prices set the range of outcomes
The forecast range depends mainly on whether mandatory reporting keeps narrowing or carbon pricing widens, since one removes filers and the other gives every metric ton a cost. Further scope cuts in Europe, the United States and Latin America would keep growth near the downside. Fast operation of carbon markets in China, Japan and India, together with building automation duties and AI-driven energy optimization, would push growth toward the upside.
| Scenario | CAGR, 2026–2035 | Value, 2035 | What has to hold |
|---|---|---|---|
| Downside | 15.8% | USD 114.59 billion | Reporting duties narrow further and carbon markets in Asia stay at low prices |
| Base | 19.80% | USD 155.56 billion | State and Asian rules add filers while EU demand shifts to voluntary reporting |
| Upside | 22.8% | USD 194.34 billion | Carbon markets mature fast and AI energy loads accelerate optimization spending |
Frequently Asked Questions
How big is the green technology and sustainability market?
What does the green technology and sustainability market include?
What drives demand in the U.S. market?
How is Japan's market developing?
What role does India play in the market?
Which region leads the market?
What are the main challenges for suppliers?
Who are the leading companies in the market?
Table of Content
Chapter 1 Market Segmentation
- 1.1 Segmentation Framework
- 1.1.1 Product and Service Classification
- 1.1.2 Application and End-Use Classification
- 1.1.3 Technology and Solution Classification
- 1.1.4 Customer and Distribution Channel Classification
- 1.1.5 Geographic Segmentation
- 1.1.6 Market Segment Definitions and Boundaries
- 1.2 By Technology
- 1.2.1 Internet of Things (IoT)
- 1.2.2 Artificial Intelligence & Analytics
- 1.2.3 Cloud Computing
- 1.2.4 Digital Twin
- 1.2.5 Cyber Security
- 1.2.6 Blockchain
- 1.3 By Application
- 1.3.1 Carbon Footprint Management
- 1.3.2 Green Building
- 1.3.3 Air and Water Pollution Monitoring
- 1.3.4 Crop & Soil Monitoring
- 1.3.5 Weather Monitoring & Forecasting
- 1.3.6 Others
- 1.4 By Component
- 1.4.1 Solutions
- 1.4.2 Services
Chapter 2 Introduction
- 2.1 Report Objectives and Scope
- 2.2 Product Definition and Industry Terminology
- 2.3 Market Inclusions and Exclusions
- 2.4 Research Process
- 2.4.1 Primary Research and Expert Interviews
- 2.4.2 Secondary Research and Source Review
- 2.4.3 Top-Down and Bottom-Up Estimation
- 2.4.4 Data Triangulation and Verification
- 2.5 Market Size Measurement Basis
- 2.5.1 2025: USD 25.55 billion → 2035: USD 155.56 billion
- 2.6 Historical and Forecast Reference Periods
- 2.6.1 Historical Period: 2018-2025
- 2.6.2 Base Year: 2025
- 2.6.3 Forecast Period: 2025-2035
- 2.7 Research Assumptions and Limitations
Chapter 3 Executive Summary
- 3.1 Market Snapshot and Key Findings
- 3.2 Base-Year Market Size, 2025
- 3.3 Forecast Market Size, 2035
- 3.4 Revenue and Volume Growth Outlook
- 3.5 Key Demand and Supply Indicators
- 3.6 Leading Market Segments
- 3.7 Fastest-Growing Market Opportunities
- 3.8 Regional Performance Highlights
- 3.9 Technology and Industry Transformation
- 3.10 Competitive Landscape Summary
- 3.11 Analyst View and Strategic Implications
Chapter 4 Global Green Technology and Sustainability Market Trends and Developments
- 4.1 Historical Industry Development, 2018-2025
- 4.2 Recent Market Trends and Developments
- 4.3 Demand and Customer Behavior Trends
- 4.4 Technology and Product Innovation
- 4.5 Artificial Intelligence, Automation and Digitalization
- 4.6 Local Manufacturing and Supply Chain Realignment
- 4.7 Industry Partnerships, Mergers and Acquisitions
- 4.8 Sustainability and Circular Economy Developments
- 4.9 Government and Private Sector Investment Trends
- 4.10 Emerging Business Models and Commercialization
- 4.11 Industry Developments and Announcements
Chapter 5 Global Green Technology and Sustainability Market Production, Supply and Demand Analysis
- 5.1 Demand Trend and Consumption Analysis, 2018-2025
- 5.2 Demand Forecast, 2025-2035
- 5.3 Production and Output Trend, 2018-2025
- 5.4 Production and Output Forecast, 2025-2035
- 5.5 Installed Capacity and Capacity Utilization
- 5.6 Company-Wise Production Plants and Statistics
- 5.6.1 Installed Production Capacity
- 5.6.2 Actual Production
- 5.6.3 Planned Capacity and Expansion Targets
- 5.7 Supply Chain Structure and Procurement Trends
- 5.8 Supply-Demand Gap and Bottlenecks
- 5.9 Import Dependence and Sourcing Structure
- 5.10 Contract Manufacturing and Outsourcing
- 5.11 Regional Supply and Demand Concentration
Chapter 6 Global Green Technology and Sustainability Market Pricing Analysis
- 6.1 Pricing Structure and Measurement
- 6.2 Historical Pricing Trends, 2018-2025
- 6.3 Pricing Outlook, 2025-2035
- 6.4 Average Selling Price and Unit Economics
- 6.5 Pricing by Product and Market Segment
- 6.6 Geographic Pricing Differences
- 6.7 Key Input, Energy, Labor and Logistics Costs
- 6.8 Contract Pricing and Purchasing Models
- 6.9 Pricing Sensitivity and Competitive Positioning
- 6.10 Price, Margin and Profitability Implications
Chapter 7 Global Green Technology and Sustainability Market Dynamics
- 7.1 Market Growth Drivers
- 7.1.1 Demand-Side Drivers
- 7.1.2 Technology and Innovation Drivers
- 7.1.3 Infrastructure and Investment Drivers
- 7.1.4 Regulatory and Policy Drivers
- 7.2 Market Restraints
- 7.2.1 Cost and Affordability Constraints
- 7.2.2 Technology and Adoption Barriers
- 7.2.3 Supply Chain and Operational Constraints
- 7.3 Market Challenges
- 7.3.1 Competitive Pressure and Margin Erosion
- 7.3.2 Skills, Infrastructure and Implementation Gaps
- 7.4 Emerging Market Opportunities
- 7.5 Market Dynamics Impact and Time-Horizon Assessment
Chapter 8 Global Green Technology and Sustainability Value Chain Analysis
- 8.1 Industry Value Chain Overview
- 8.2 Upstream Suppliers and Critical Inputs
- 8.3 Technology and Component Providers
- 8.4 Manufacturing or Service Delivery
- 8.5 Distribution, Channel Partners and Integrators
- 8.6 Downstream Applications and End Users
- 8.7 Value Addition and Profit Pools
- 8.8 Vertical Integration and Outsourcing
- 8.9 Supplier Concentration and Risk
- 8.10 Supply Chain Localization and Resilience
Chapter 9 Global Green Technology and Sustainability Market Regulations and Policies
- 9.1 Relevant Laws, Standards and Compliance Frameworks
- 9.2 Product, Service, Safety and Quality Requirements
- 9.3 Government Policies, Incentives and Subsidies
- 9.4 Imports, Exports and Trade Barriers
- 9.5 Public Procurement and Local Content Requirements
- 9.6 Environmental and Sustainability Compliance
- 9.7 Data Protection, AI and Cybersecurity Compliance
- 9.8 Upcoming Policy Changes and Market Implications
Chapter 10 Global Green Technology and Sustainability Market Hotspots and Opportunities
- 10.1 Market Opportunity Mapping and Growth Hotspots
- 10.2 High-Growth Applications and Customer Groups
- 10.3 Underserved Markets and White-Space Opportunities
- 10.4 Emerging Technology and Product Opportunities
- 10.5 New Capacity and Investment Hotspots
- 10.6 Market Entry and Expansion Opportunities
- 10.7 Distribution and Partnership Opportunities
- 10.8 Near-Term and Long-Term Commercial Potential
- 10.9 Opportunity Attractiveness and Execution Risks
Chapter 11 Global Green Technology and Sustainability Market Outlook, 2025-2035
- 11.1 Market Size and Analysis
- 11.1.1 Revenue (Market Measurement: 2025: USD 25.55 billion → 2035: USD 155.56 billion)
- 11.1.2 Market Volume and Quantity Sold
- 11.1.3 Historical Market Size, 2018-2025
- 11.1.4 Base-Year Market Size, 2025
- 11.2 Market Forecast, 2025-2035
- 11.2.1 Revenue Forecast to 2035
- 11.2.2 Volume Forecast to 2035
- 11.2.3 CAGR and Year-on-Year Growth
- 11.2.4 Incremental Revenue Opportunity
- 11.3 Forecast Assumptions and Scenario Analysis
- 11.3.1 Base-Case Forecast
- 11.3.2 Optimistic and Conservative Scenarios
- 11.3.3 Technology, Pricing and Policy Sensitivities
- 11.4 Market Attractiveness and Growth Outlook
Chapter 12 Global Green Technology and Sustainability Market Segmentation and Outlook
- 12.1 Segmentation Summary and Market Shares, 2025
- 12.2 Largest and Fastest-Growing Segments
- 12.3 By Technology - Market Size and Forecast, 2025-2035
- 12.3.1 Segment Definition and Scope
- 12.3.2 Historical Market Size, 2018-2025
- 12.3.3 Revenue Forecast, 2025-2035
- 12.3.4 Volume Forecast, 2025-2035
- 12.3.5 Base-Year Market Share, 2025
- 12.3.6 Segment CAGR and Growth Drivers
- 12.3.7 Subsegment Market Size and Forecast
- 12.3.7.1 Internet of Things (IoT)
- 12.3.7.2 Artificial Intelligence & Analytics
- 12.3.7.3 Cloud Computing
- 12.3.7.4 Digital Twin
- 12.3.7.5 Cyber Security
- 12.3.7.6 Blockchain
- 12.3.8 Subsegment Pricing and Adoption Trends
- 12.3.9 Leading Suppliers and Competition
- 12.3.10 Regional Demand and Opportunities
- 12.4 By Application - Market Size and Forecast, 2025-2035
- 12.4.1 Segment Definition and Scope
- 12.4.2 Historical Market Size, 2018-2025
- 12.4.3 Revenue Forecast, 2025-2035
- 12.4.4 Volume Forecast, 2025-2035
- 12.4.5 Base-Year Market Share, 2025
- 12.4.6 Segment CAGR and Growth Drivers
- 12.4.7 Subsegment Market Size and Forecast
- 12.4.7.1 Carbon Footprint Management
- 12.4.7.2 Green Building
- 12.4.7.3 Air and Water Pollution Monitoring
- 12.4.7.4 Crop & Soil Monitoring
- 12.4.7.5 Weather Monitoring & Forecasting
- 12.4.7.6 Others
- 12.4.8 Subsegment Pricing and Adoption Trends
- 12.4.9 Leading Suppliers and Competition
- 12.4.10 Regional Demand and Opportunities
- 12.5 By Component - Market Size and Forecast, 2025-2035
- 12.5.1 Segment Definition and Scope
- 12.5.2 Historical Market Size, 2018-2025
- 12.5.3 Revenue Forecast, 2025-2035
- 12.5.4 Volume Forecast, 2025-2035
- 12.5.5 Base-Year Market Share, 2025
- 12.5.6 Segment CAGR and Growth Drivers
- 12.5.7 Subsegment Market Size and Forecast
- 12.5.7.1 Solutions
- 12.5.7.2 Services
- 12.5.8 Subsegment Pricing and Adoption Trends
- 12.5.9 Leading Suppliers and Competition
- 12.5.10 Regional Demand and Opportunities
- 12.6 Segment Growth Comparison
- 12.7 Segment Attractiveness and Priority Matrix
Chapter 13 Global Green Technology and Sustainability End-Use and Application Market Outlook
- 13.1 End-Use Industry and Customer Demand Structure
- 13.2 Leading Applications and Customer Groups
- 13.3 End-Use Market Size, Share and Forecast
- 13.4 Major End-Use Industry Deep Dives
- 13.4.1 Customer Requirements and Use Cases
- 13.4.2 Demand and Replacement Cycles
- 13.4.3 Technical and Regulatory Considerations
- 13.4.4 Purchasing and Procurement Models
- 13.4.5 Leading Vendors and Distribution Channels
- 13.4.6 Forecast and Commercial Opportunities
- 13.5 Emerging Applications and Cross-Segment Demand
- 13.6 End-Use Industry Investment Priorities
Chapter 14 Global Green Technology and Sustainability Geographic Market Outlook, 2025-2035
- 14.1 Regional Market Size and Share, 2025
- 14.2 Regional Market Forecast, 2025-2035
- 14.3 Regional Pricing, Production and Demand Differences
- 14.4 North America
- 14.4.1 United States
- 14.4.2 Canada
- 14.4.3 Mexico
- 14.5 Europe
- 14.5.1 Germany
- 14.5.2 France
- 14.5.3 Italy
- 14.5.4 United Kingdom
- 14.5.5 Spain
- 14.5.6 Poland
- 14.5.7 Russia
- 14.5.8 Netherlands
- 14.5.9 Belgium
- 14.5.10 Sweden
- 14.5.11 Denmark
- 14.5.12 Norway
- 14.5.13 Rest of Europe
- 14.6 Asia Pacific
- 14.6.1 China
- 14.6.2 India
- 14.6.3 Japan
- 14.6.4 South Korea
- 14.6.5 Thailand
- 14.6.6 Indonesia
- 14.6.7 Vietnam
- 14.6.8 Malaysia
- 14.6.9 Australia
- 14.6.10 Rest of Asia Pacific
- 14.7 Latin America
- 14.7.1 Brazil
- 14.7.2 Argentina
- 14.7.3 Colombia
- 14.7.4 Chile
- 14.7.5 Rest of Latin America
- 14.8 Middle East
- 14.8.1 Saudi Arabia
- 14.8.2 United Arab Emirates
- 14.8.3 Turkey
- 14.8.4 Israel
- 14.8.5 Iran
- 14.8.6 Rest of the Middle East
- 14.9 Africa
- 14.9.1 South Africa
- 14.9.2 Egypt
- 14.9.3 Nigeria
- 14.9.4 Morocco
- 14.9.5 Rest of Africa
- 14.10 Regional Investment, Policy and Supply Chain Differences
- 14.11 Regional Competitive Landscape
- 14.12 Geographic Growth Hotspots
Chapter 15 Global Green Technology and Sustainability Technology, Innovation and Sustainability Outlook
- 15.1 Technology Landscape and Maturity
- 15.2 Product, Process and Service Innovation
- 15.3 AI, Automation and Digital Tools in the Industry
- 15.4 Technology Adoption and Performance Benchmarking
- 15.5 Innovation Pipeline and R&D Investment
- 15.6 Patent and Intellectual Property Trends
- 15.7 Energy Efficiency and Resource Management
- 15.8 Sustainability, Recycling and Circularity
- 15.9 Technology Roadmap, 2025-2035
- 15.10 Risks of Obsolescence and Technology Substitution
Chapter 16 Global Green Technology and Sustainability Market Key Strategic Imperatives
- 16.1 Growth and Market Entry Priorities
- 16.2 High-Return Products and Segments
- 16.3 Pricing, Profitability and Cost Optimization
- 16.4 Technology Investment and Product Differentiation
- 16.5 Supply Chain Localization and Resilience
- 16.6 Distribution and Customer Acquisition
- 16.7 Partnership, Acquisition and Capacity Strategy
- 16.8 Regional Expansion Priorities
- 16.9 Short-, Medium- and Long-Term Actions
Chapter 17 Competition Outlook
- 17.1 Industry Competition Characteristics
- 17.2 Market Structure and Concentration
- 17.3 Market Share and Competitive Positioning, 2025
- 17.4 Company-Wise Revenue and Product Benchmarking
- 17.5 Production and Service Capacity Benchmarking
- 17.6 Technology, Pricing and Differentiation
- 17.7 Regional Footprint and Distribution Strength
- 17.8 Mergers, Acquisitions and Strategic Alliances
- 17.9 New Entrants and Competitive Threats
- 17.10 Porter's Five Forces and Industry Attractiveness
- 17.11 Competitive Outlook, 2025-2035
Chapter 18 Company Profiles
- 18.1 Company Coverage and Selection Criteria
- 18.2 Microsoft Corporation
- 18.2.1 Business Description
- 18.2.2 Company Ownership and Geographic Presence
- 18.2.3 Product and Service Portfolio
- 18.2.4 Manufacturing and Operating Footprint
- 18.2.5 Production Capacity and Expansion Plans
- 18.2.6 Financial Performance and Investment
- 18.2.7 Market Share and Competitive Position
- 18.2.8 Technology and Innovation Capabilities
- 18.2.9 Strategic Alliances or Partnerships
- 18.2.10 Recent Developments
- 18.2.11 Growth Strategy and Outlook
- 18.3 SAP SE
- 18.4 IBM Corporation (Envizi)
- 18.5 Salesforce, Inc.
- 18.6 Schneider Electric SE
- 18.7 Siemens AG
- 18.8 GE Vernova Inc.
- 18.9 Wolters Kluwer N.V. (Enablon)
- 18.10 Cority Software Inc.
- 18.11 Fortive Corporation (Intelex)
- 18.12 Arcadia (ENGIE Impact)
- 18.13 Persefoni AI, Inc.
- 18.14 Other Relevant Market Participants
Note: Every listed company is profiled on the structure shown under the first company. The company list is preliminary and may change based on research findings, market developments, data availability and client requirements.
Chapter 19 Disclaimer
- 19.1 Research and Forecast Disclaimer
- 19.2 Data Source and Estimation Limitations
Note: The depth of individual sections depends on data availability for this market. Volume, capacity, trade and other unit-based metrics are included where applicable.

