
Short-reach AI pods keep unlit multimode strands in demand
The North America multimode dark fiber market was valued at USD 705.0 million in 2025 and is projected to increase from USD 764.2 million in 2026 to USD 1.58 billion by 2035, registering a CAGR of 8.40% during 2026–2035. Demand comes from hyperscale and colocation operators, enterprises, universities, factories and defense programs that install or lease unlit multimode strands and light them with their own short-reach transceivers. The United States held 87.9% of 2025 value, because it hosts most of the continent's AI training and cloud halls, where switch-to-server links run tens of meters. Mexico is the fastest-growing country at 10.0% a year, as new cloud regions and campuses around Querétaro add halls that need short-reach cabling. Commercially, hyperscale buyers now sign multiyear supply agreements with cable makers, which ties domestic fiber and cable output to data center build schedules rather than to telecom budgets.
Scope covers short-reach strands that buyers light themselves
Value is measured on unlit multimode fiber supplied in North America, meaning OM3, OM4 and OM5 glass strands and large-core plastic or step-index fiber that a buyer installs, buys pre-terminated or leases without transmission equipment. It covers data center halls and campuses, enterprise and university buildings, short metro access risers, factory floors, aircraft and vehicle harnesses, and buyers light the strands with their own optics.
The estimate excludes lit services, transceivers, switches and the single-mode carrier dark fiber that Zayo, Lumen and Uniti lease between buildings and cities, which forms the wider U.S. dark fiber market. The value chain runs from preform and fiber draw plants to cablers, connectivity makers, distributors, installers and the operators that own the finished plant.

North America Multimode Dark Fiber Market Insights
- The North America multimode dark fiber market was valued at USD 705.0 million in 2025 and is projected to reach USD 1.58 billion by 2035, registering a CAGR of 8.40% during 2026–2035.
- The United States held 87.9% of 2025 value, because AI and cloud halls with short switch-to-server links sit mostly in U.S. metros.
- Data center networks led network types with a 55.0% share of 2025 value, as AI pods use dense 850 nm optics over tens of meters.
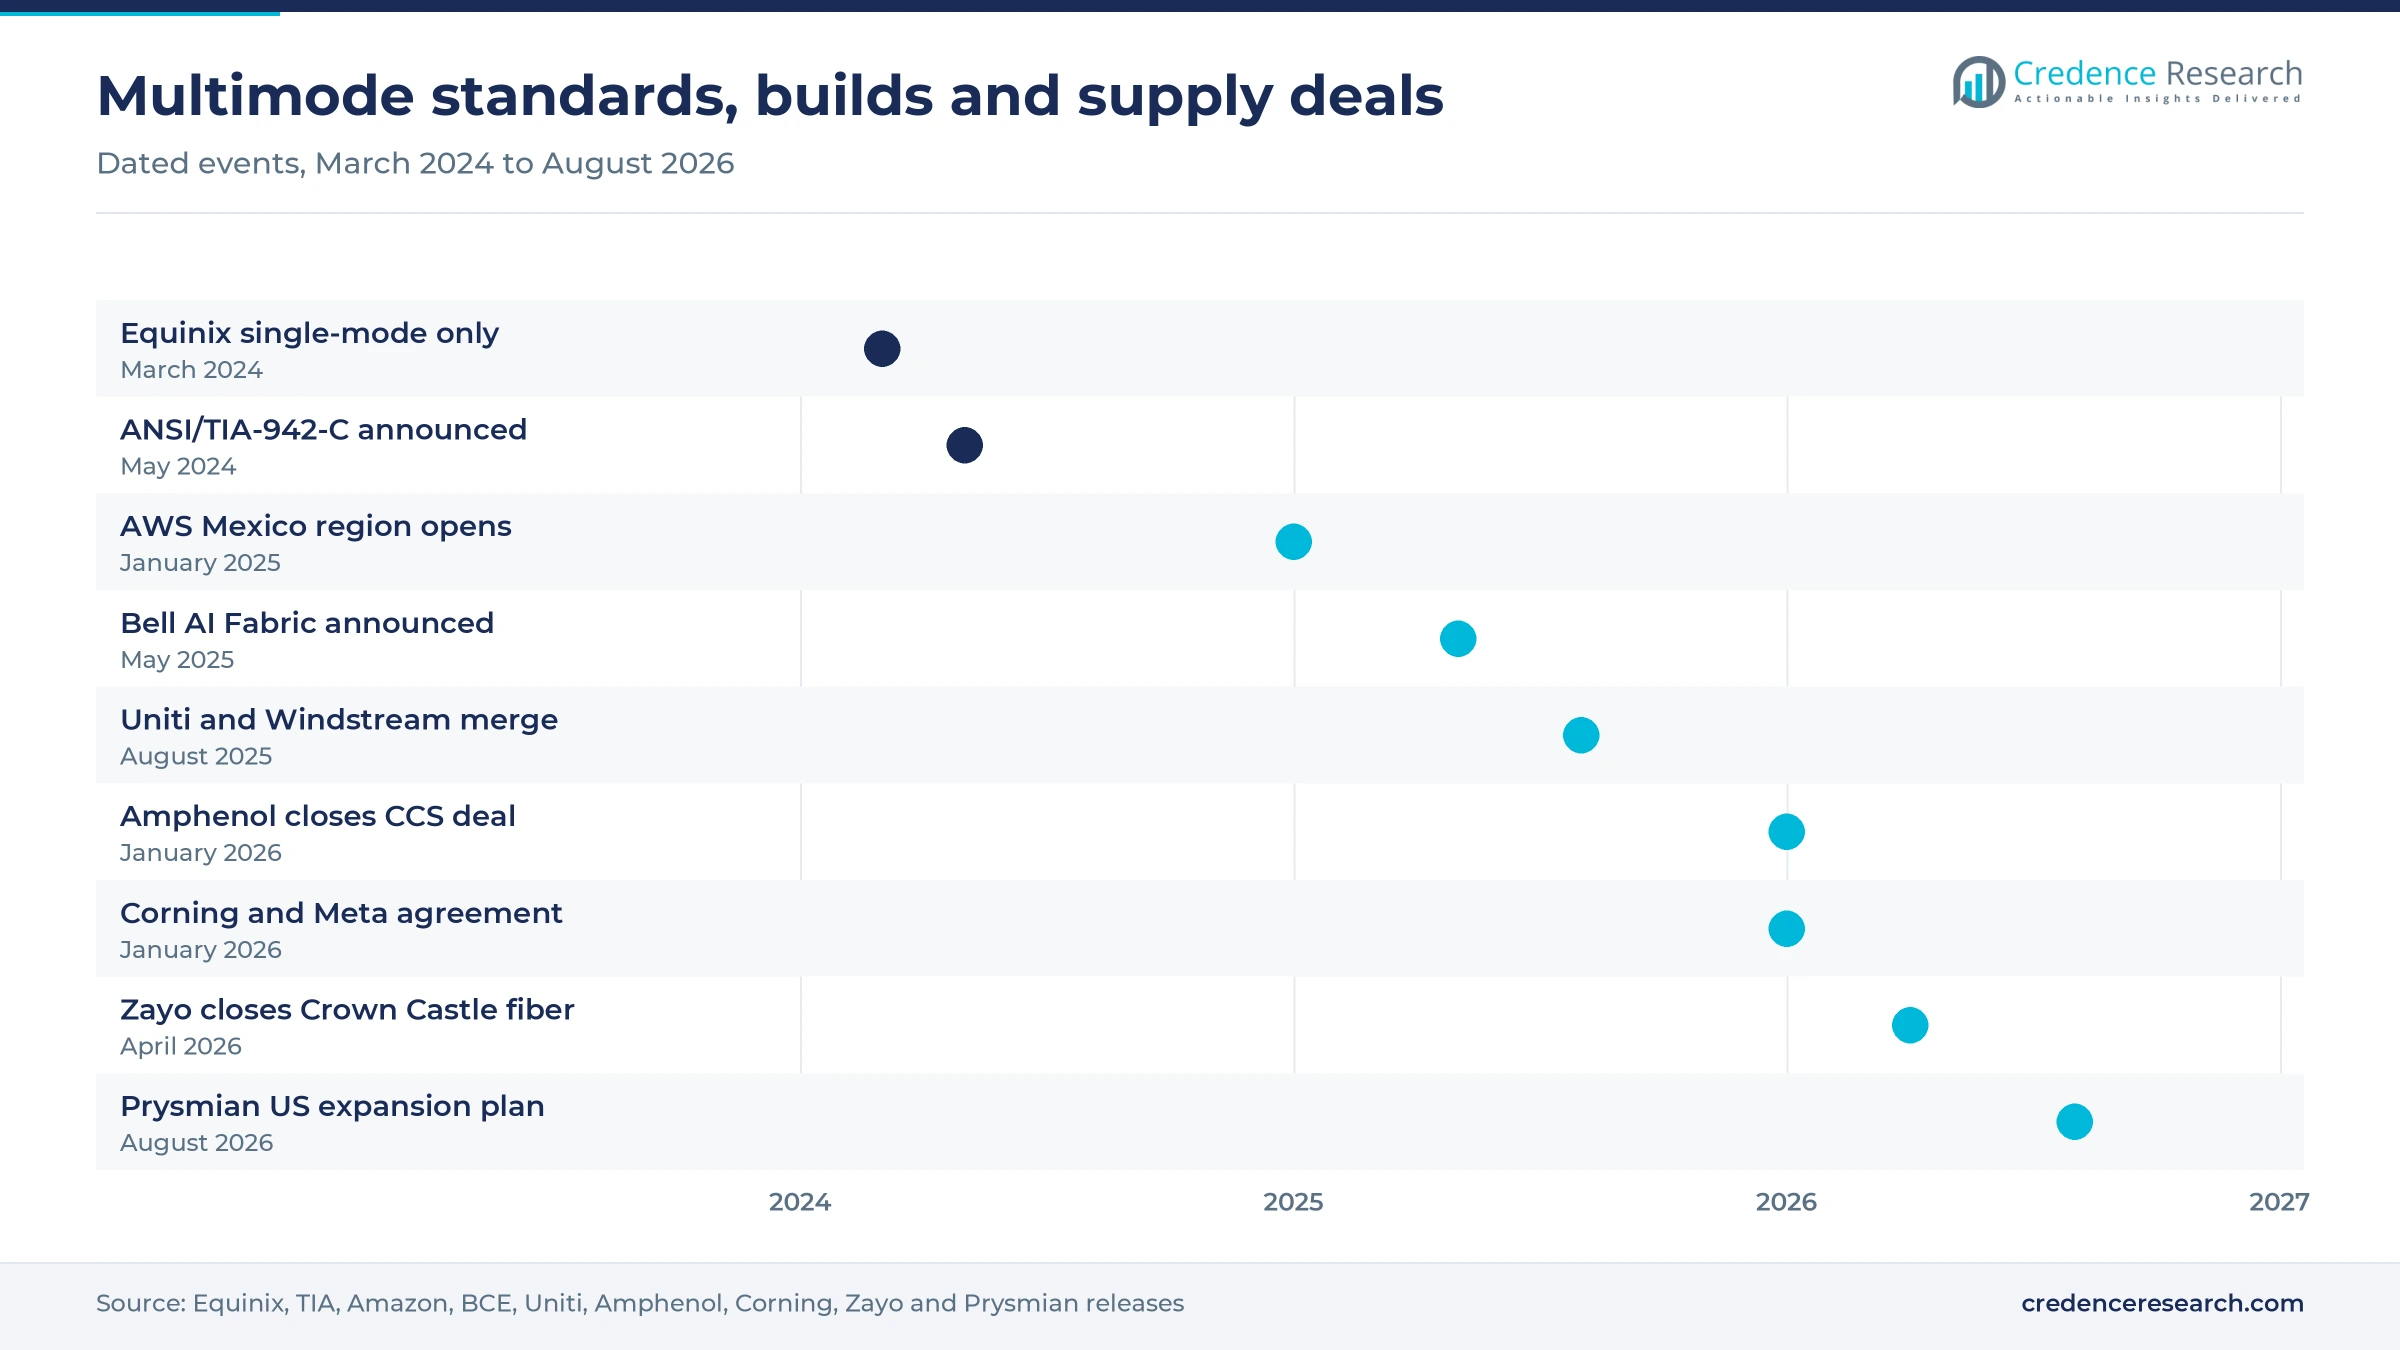
- Equinix made single-mode the only cross connect media at all of its data centers on March 31, 2024, which moves multimode demand inside customer cages.
- Corning and Meta announced a multiyear agreement worth up to USD 6 billion on Jan. 27, 2026, anchored by a cable plant expansion in Hickory, North Carolina.
Graded-index glass leads as data center links grow fastest
Graded-index fiber carries almost all VCSEL traffic
Based on fiber type, the market is categorized into graded-index multimode fiber and step-index multimode fiber. Graded-index Multimode Fiber led with a 91.4% share of 2025 value, because OM4 and OM5 graded-index fiber carries the VCSEL optics used in data centers and enterprise backbones. Furukawa Electric launched the Lightera brand in April 2025 for OFS and its other fiber units, according to Lightwave. Lightera continues to sell LaserWave graded-index fiber from its base in Georgia. Graded-index Multimode Fiber also grows fastest at 8.5% a year, as AI halls specify OM4 and OM5 for new rows. Step-index fiber serves industrial and sensing niches, where public volume data is an evidence gap.
Data center halls outweigh campus and metro links
Based on network type, the market is categorized into data center networks, enterprise and campus networks, and metro access networks. Data Center Network led with a 55.0% share of 2025 value, because each new hall packs thousands of short links between switches, servers and storage. U.S. data center construction reached an annual rate of USD 45 billion in December 2025, almost 30% above a year earlier, according to Census Bureau data reported by Marketplace. Data Center Network also grows fastest at 9.0% a year as these halls fill. Campus networks follow building refresh cycles, and metro access use covers risers and short hand-offs.
Glass serves every multi-gigabit building link
Based on material type, the market is categorized into glass and plastic. Glass led with a 94.0% share of 2025 value, because only glass multimode supports the multi-gigabit links used in buildings and data centers. Corning and Meta announced a multiyear agreement worth up to USD 6 billion for optical fiber, cable and connectivity on Jan. 27, 2026, according to Corning, which shows where hyperscale buyers place volume. Glass also grows fastest at 8.4% a year, while plastic fiber serves short, low-speed links in machines, lighting and consumer devices.
Telecom and data center buyers install most strands
Based on end user, the market is categorized into telecom and data centers, industrial automation and control, aerospace and defense, automobile and others. Telecom and Data Centers led with a 60.0% share of 2025 value, because the U.S. had 40.6 GW of live data center capacity in early 2026, according to law firm BLG. Automobile grows fastest at 11.3% a year from a small base, as the IEEE automotive optical Ethernet amendment released in June 2023 defines in-vehicle links over OM3 multimode glass. Factories and defense platforms buy through equipment upgrades and qualified harness programs, so their orders track program schedules.
| Segment Group | Leading Sub-segment | Share, 2025 | Fastest-growing Sub-segment | CAGR, 2026–2035 |
|---|---|---|---|---|
| By Fiber Type | Graded-index Multimode Fiber | 91.4% | Graded-index Multimode Fiber | 8.5% |
| By Network Type | Data Center Network | 55.0% | Data Center Network | 9.0% |
| By Material Type | Glass | 94.0% | Glass | 8.4% |
| By End User | Telecom and Data Centers | 60.0% | Automobile | 11.3% |
Bulk cable is cheap while trunks and cassettes carry value
Buyers pay for multimode plant by the foot of bulk cable, by the pre-terminated trunk, or as an installed cost per link once cassettes, labor and testing are added. U.S. distributors list 12-fiber OM4 plenum cable from about USD 1.36 to USD 3.35 per foot, while a single Panduit MPO-to-LC OM4 cassette lists at about USD 772. Factory termination and testing therefore move most of the value from glass into assemblies. Public bids show the same pattern, with installation labor quoted per foot alongside connector and panel prices. For suppliers, margin sits in pre-terminated, factory-tested assemblies and fast delivery, while bulk cable competes mainly on price.
| Offer | Typical price or fee | Basis |
|---|---|---|
| 12-fiber OM4 plenum bulk cable | About USD 1.36-3.35 per foot | Discount Low Voltage and Falcon Technologies list prices, November 2026 |
| Pre-terminated 12-fiber MTP OM4 trunk, 3 m and 5 m | About USD 146-162 each | StarTech list prices at CDW, November 2026 |
| Panduit HD Flex MPO-to-LC OM4 cassette, 12 fiber | About USD 772 each | Connection list price, November 2026 |
| 12-fiber OM3 plenum cable in a public bid | USD 1.67-2.10 per foot | Cobb County School District bid tabulation B1919 |
| Fiber installation labor in the same bid | USD 1.20-10.95 per foot | Cana Communications bid, Cobb County School District B1919 |
Request a Free Sample
Fill in your details and we'll send you a free sample report.
- Sample data tables & charts
- Research methodology
Faster VCSEL lanes and new AI pods lift strand counts
AI pods add strands rack by rack
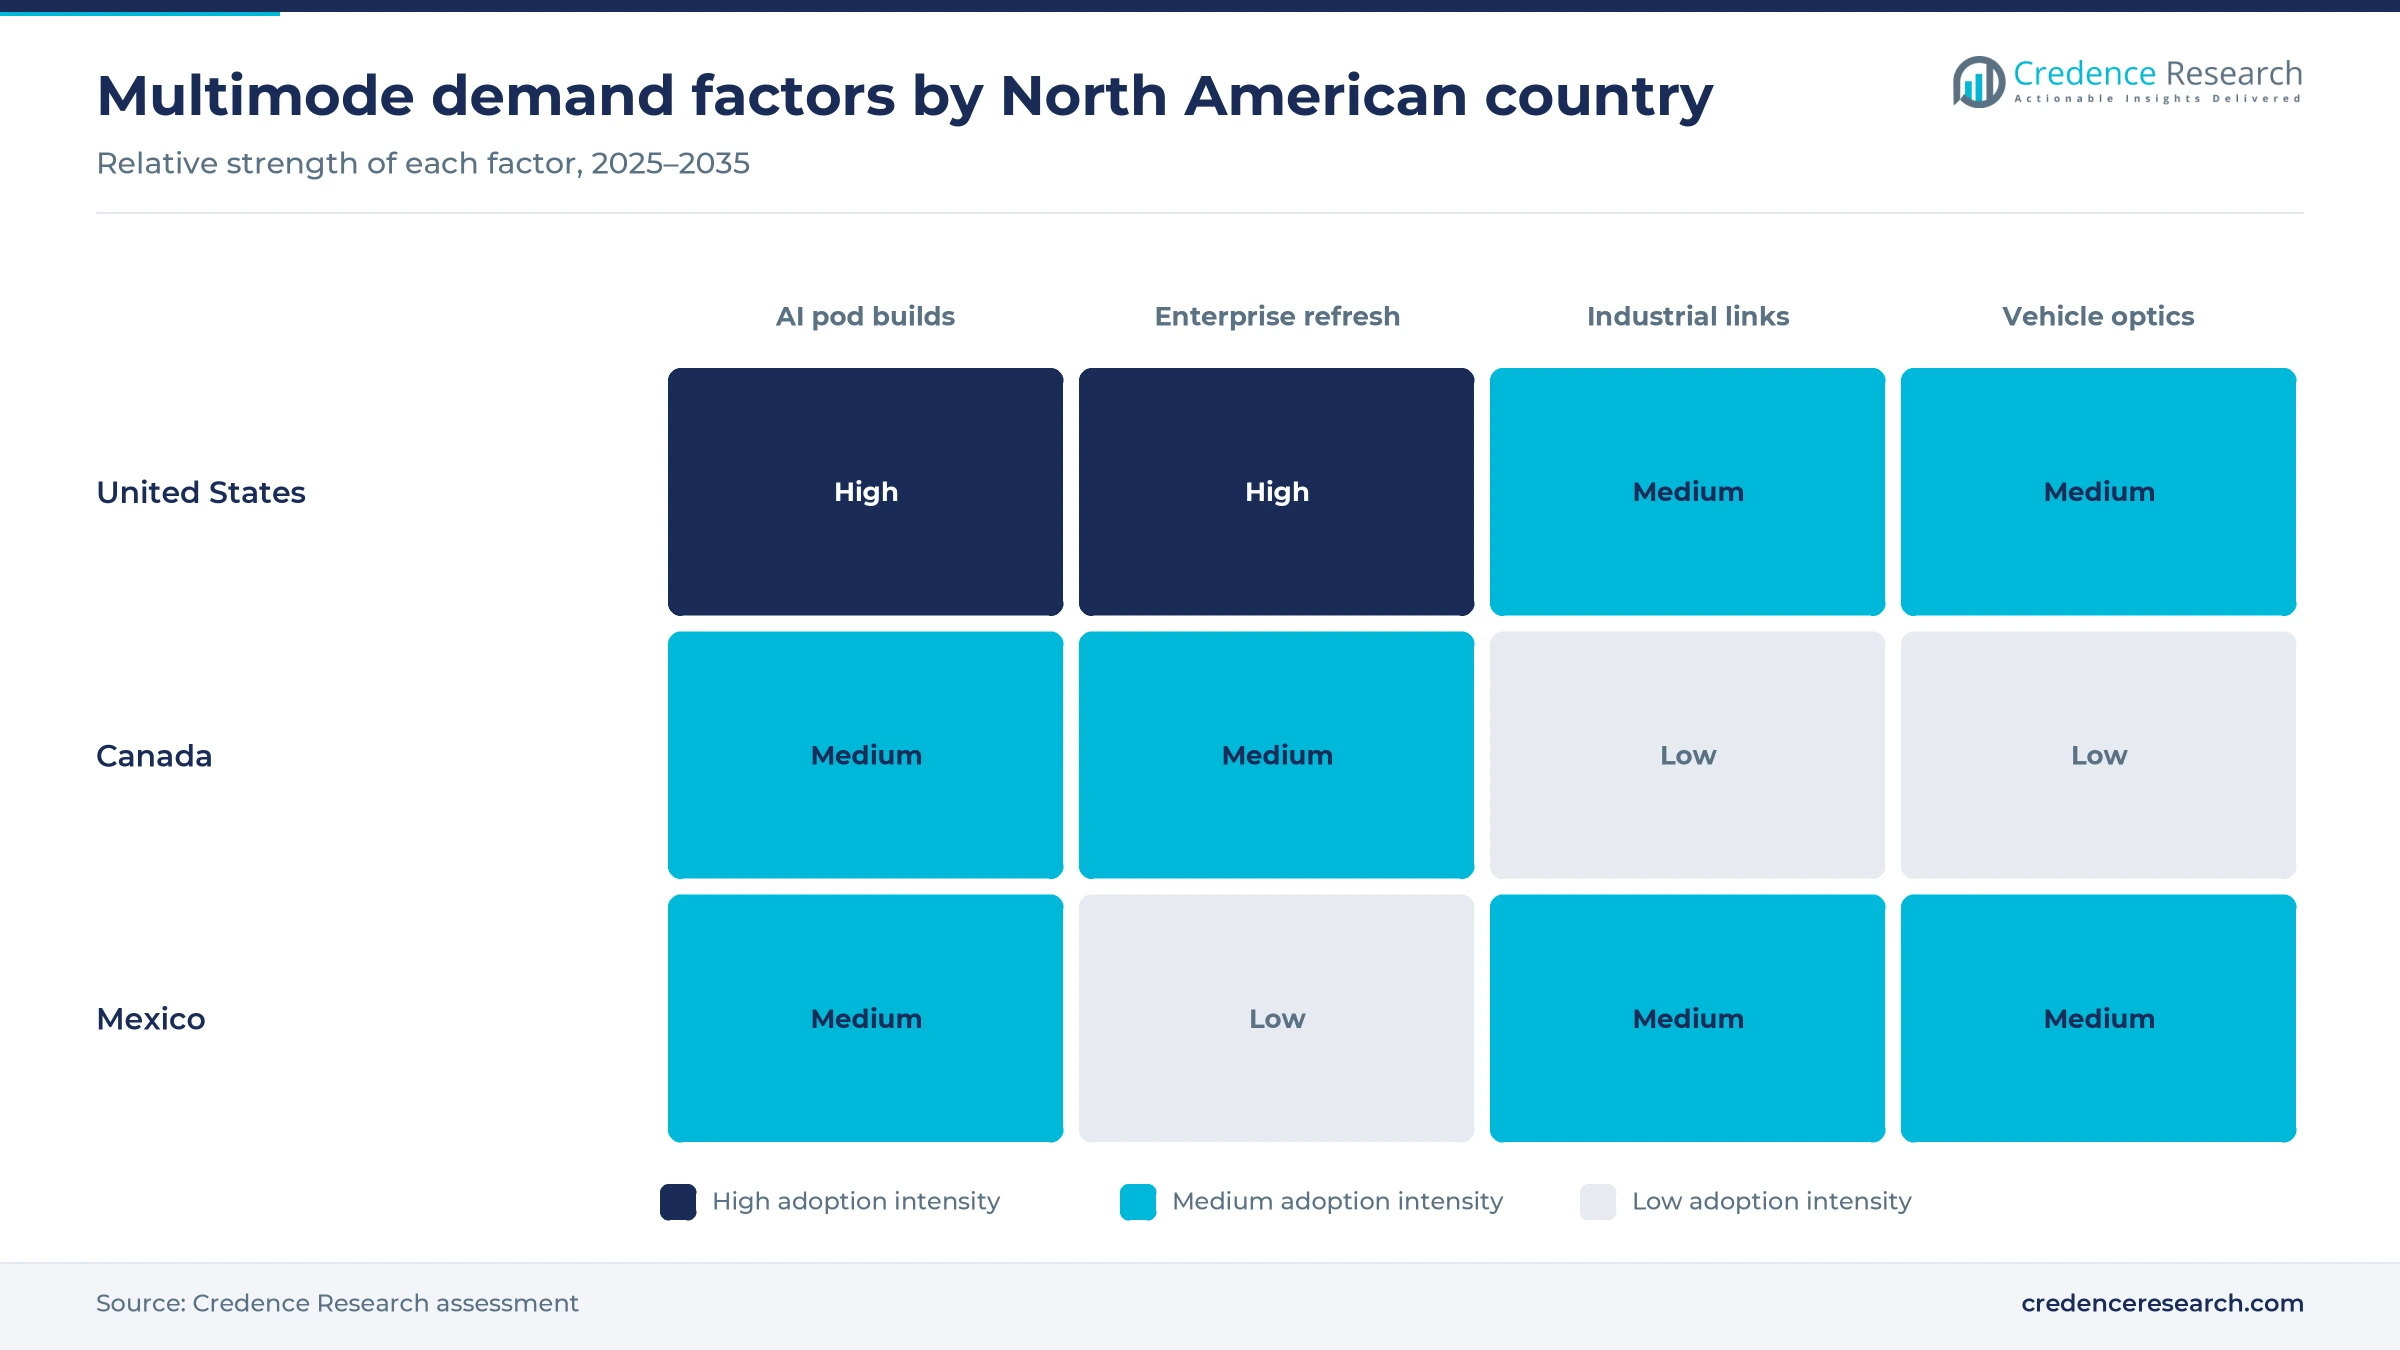
AI training pods connect switches and GPU servers over very short runs, and those runs still favor multimode fiber with low-cost 850 nm VCSEL optics. The NVIDIA 800G twin-port transceiver for InfiniBand and Ethernet reaches up to 50 m on OM4 and 30 m on OM3, according to its NVIDIA product documentation. Each port uses an MPO-12/APC connector carrying four 100G lanes, so each port occupies eight fibers of the trunk. That count rises with every rack added to a pod, which is why data center networks hold 55.0% of 2025 value. For cablers, the result is steady orders for high-count trunks and cassettes in each new AI hall.
IEEE and TIA rules extend the life of installed plant
Standards bodies keep raising the speed that multimode fiber can carry, which lets owners reuse installed OM4 and OM5 instead of replacing it with single-mode. The IEEE 802.3db amendment, which finished its last draft in July 2022, defined links of up to 400 Gb/s over 50 m and 100 m of OM4 and OM5, according to Cabling Installation and Maintenance. TIA announced ANSI/TIA-942-C on May 9, 2024, adding new cable media and connectivity requirements for data center design, according to TIA. These rules extend the life of graded-index plant, which holds 91.4% of 2025 value. Enterprise and colocation owners gain, since an optics upgrade costs less than a recabling project.
Prysmian, AFL and Lightera expand on reserved demand
Hyperscale buyers now commit to multiyear fiber and cable volumes, which gives makers the confidence to add North American capacity. Prysmian announced USD 1.25 billion of U.S. investment on Aug. 12, 2026, including USD 1.02 billion to double fiber output in Claremont, North Carolina, according to Fierce Network. The same report cited a 10-year Prysmian agreement to supply data center fiber products to Molex. AFL announced more than USD 50 million for cable plants in Duncan, South Carolina, in March 2024, and Lightera said in August 2026 that its U.S. expansion rests on long-term purchase commitments. As a result, domestic cable supply now follows data center build schedules closely.
Bell, AWS and ODATA projects widen the buyer base
New AI and cloud halls outside the United States add short-reach cabling demand in markets that had few large sites. Bell Canada announced Bell AI Fabric on May 28, 2025, aiming for more than 500 MW across six British Columbia facilities, according to BCE. AWS launched its Mexico region with three availability zones on Jan. 14, 2025, and plans to invest more than USD 5 billion over 15 years, according to Amazon. ODATA energized a first 200 MW phase of its USD 3 billion Querétaro campus in February 2025, according to Mexico News Daily. These projects explain why Mexico is the fastest-growing country in the region.
Single-mode gains at hand-offs as car networks open up
Equinix's single-mode rule moves multimode into cages
Colocation operators are shifting cross connects to single-mode fiber, which concentrates multimode inside customer cages and pods rather than in shared meet-me rooms. Single-mode became the only cross connect media at all Equinix data centers on March 31, 2024, according to Equinix documentation. NVIDIA said in March 2025 that its Quantum-X Photonics switches would ship later that year and Spectrum-X Photonics switches in 2026, both with co-packaged single-mode optics. As a result, colocation operators buy less multimode for shared rooms, while data center networks still grow at 9.0% a year inside the pods. Suppliers that sell pre-terminated multimode trunks into customer cages keep that volume.
Zayo, Lumen and Uniti reshape carrier unlit routes
Carriers are consolidating long-haul and metro single-mode fiber and selling more of it as lit capacity, which keeps multimode out of carrier routes and inside buildings. Zayo completed its purchase of Crown Castle's fiber solutions business on April 29, 2026, adding about 90,000 route miles to a network of 224,000 route miles, according to Zayo. Lumen reported nearly USD 13 billion of private connectivity fabric deals and met its 2025 goal of 17 million intercity fiber miles, according to Lightwave in February 2026. Uniti also completed its merger with Windstream on Aug. 1, 2025, according to Uniti. Buyers comparing Lumen and Zayo are shopping for single-mode routes, while multimode stays a building purchase.
In-vehicle optical Ethernet opens an automotive niche
Carmakers that move to zonal architectures need multi-gigabit links that resist electromagnetic noise, which opens a niche for multimode glass in vehicle harnesses. The IEEE automotive optical Ethernet amendment released in June 2023 covers 2.5 to 50 Gb/s over OM3 multimode glass fiber, according to chip designer KDPOF, which also says control units can be upgraded without changing the harness. The standard allows links of up to 40 m and is rated from minus 40 to 105 degrees Celsius for at least 15 years. Automobile buyers grow fastest at 11.3% a year from a small base, and suppliers that qualify harness-grade OM3 cable early could win platform awards running through 2035.
Rugged defense links reward qualified suppliers
Military aircraft and ships need high-speed links between avionics boxes that are light and immune to interference, which creates steady demand for qualified multimode cable and termini. Naval Aviation News said in December 2025 that fiber optics is the best option for high-speed communication between avionics systems, and the Navy funds optical transceivers and cables through small business innovation research awards. In May 2025, Boeing received a USD 20.3 million order to support the AN/USQ-82(V) fiber-optic shipboard network on Burke-class destroyers, according to Military and Aerospace Electronics. Moog also lists an ARINC 801 multimode terminus for aerospace fiber networks. Long qualification cycles protect suppliers that pass military and airframe testing.
Reach limits, grid queues and cable lead times constrain
Older OM3 plant loses usable reach at 800G
Each step up in lane speed shortens the distance multimode fiber can carry, which forces owners of older plant to recable or switch to single-mode. NVIDIA rates its 800G twin-port module at 50 m on OM4 but only 30 m on OM3. Owners of OM3 halls and campus backbones are most exposed, since links longer than these limits need new fiber. Designers can reduce the risk by specifying OM4 or OM5 and shorter row layouts.
Alberta and Quebec power limits hold back orders
Power connections, not fiber, set the pace of new halls in parts of Canada, which delays cabling orders tied to them. Data center requests in Alberta reached as much as 21 GW in October 2025, while the grid operator can connect only 1.2 GW by 2028, according to TD Economics. Quebec restricted new power for large data centers in 2024. Cablers and installers that planned around these projects face slower order books until grid capacity arrives.
Smaller installers wait longest for new cable output
New fiber and cable capacity takes years to build, so buyers face long lead times when several AI campuses order at once. Lightera said in August 2026 that its new U.S. capacity comes online progressively from the second half of fiscal 2028. Fierce Network reported no completion timeline for the Prysmian expansion. Smaller installers and enterprise buyers are most exposed, because large buyers hold reserved volumes under long agreements.
The Amphenol and CommScope deal narrows the field
Fewer, larger connectivity suppliers give buyers less room to negotiate on price and delivery for cassettes, trunks and pre-terminated cable. Amphenol completed its purchase of CommScope's connectivity and cable business on Jan. 12, 2026, adding about 20,000 employees, according to Amphenol. Distributors and regional integrators are most exposed, since they buy smaller volumes than hyperscalers. Multi-vendor designs and approved second sources limit the effect for these buyers.
The United States leads while Mexico adds capacity fastest
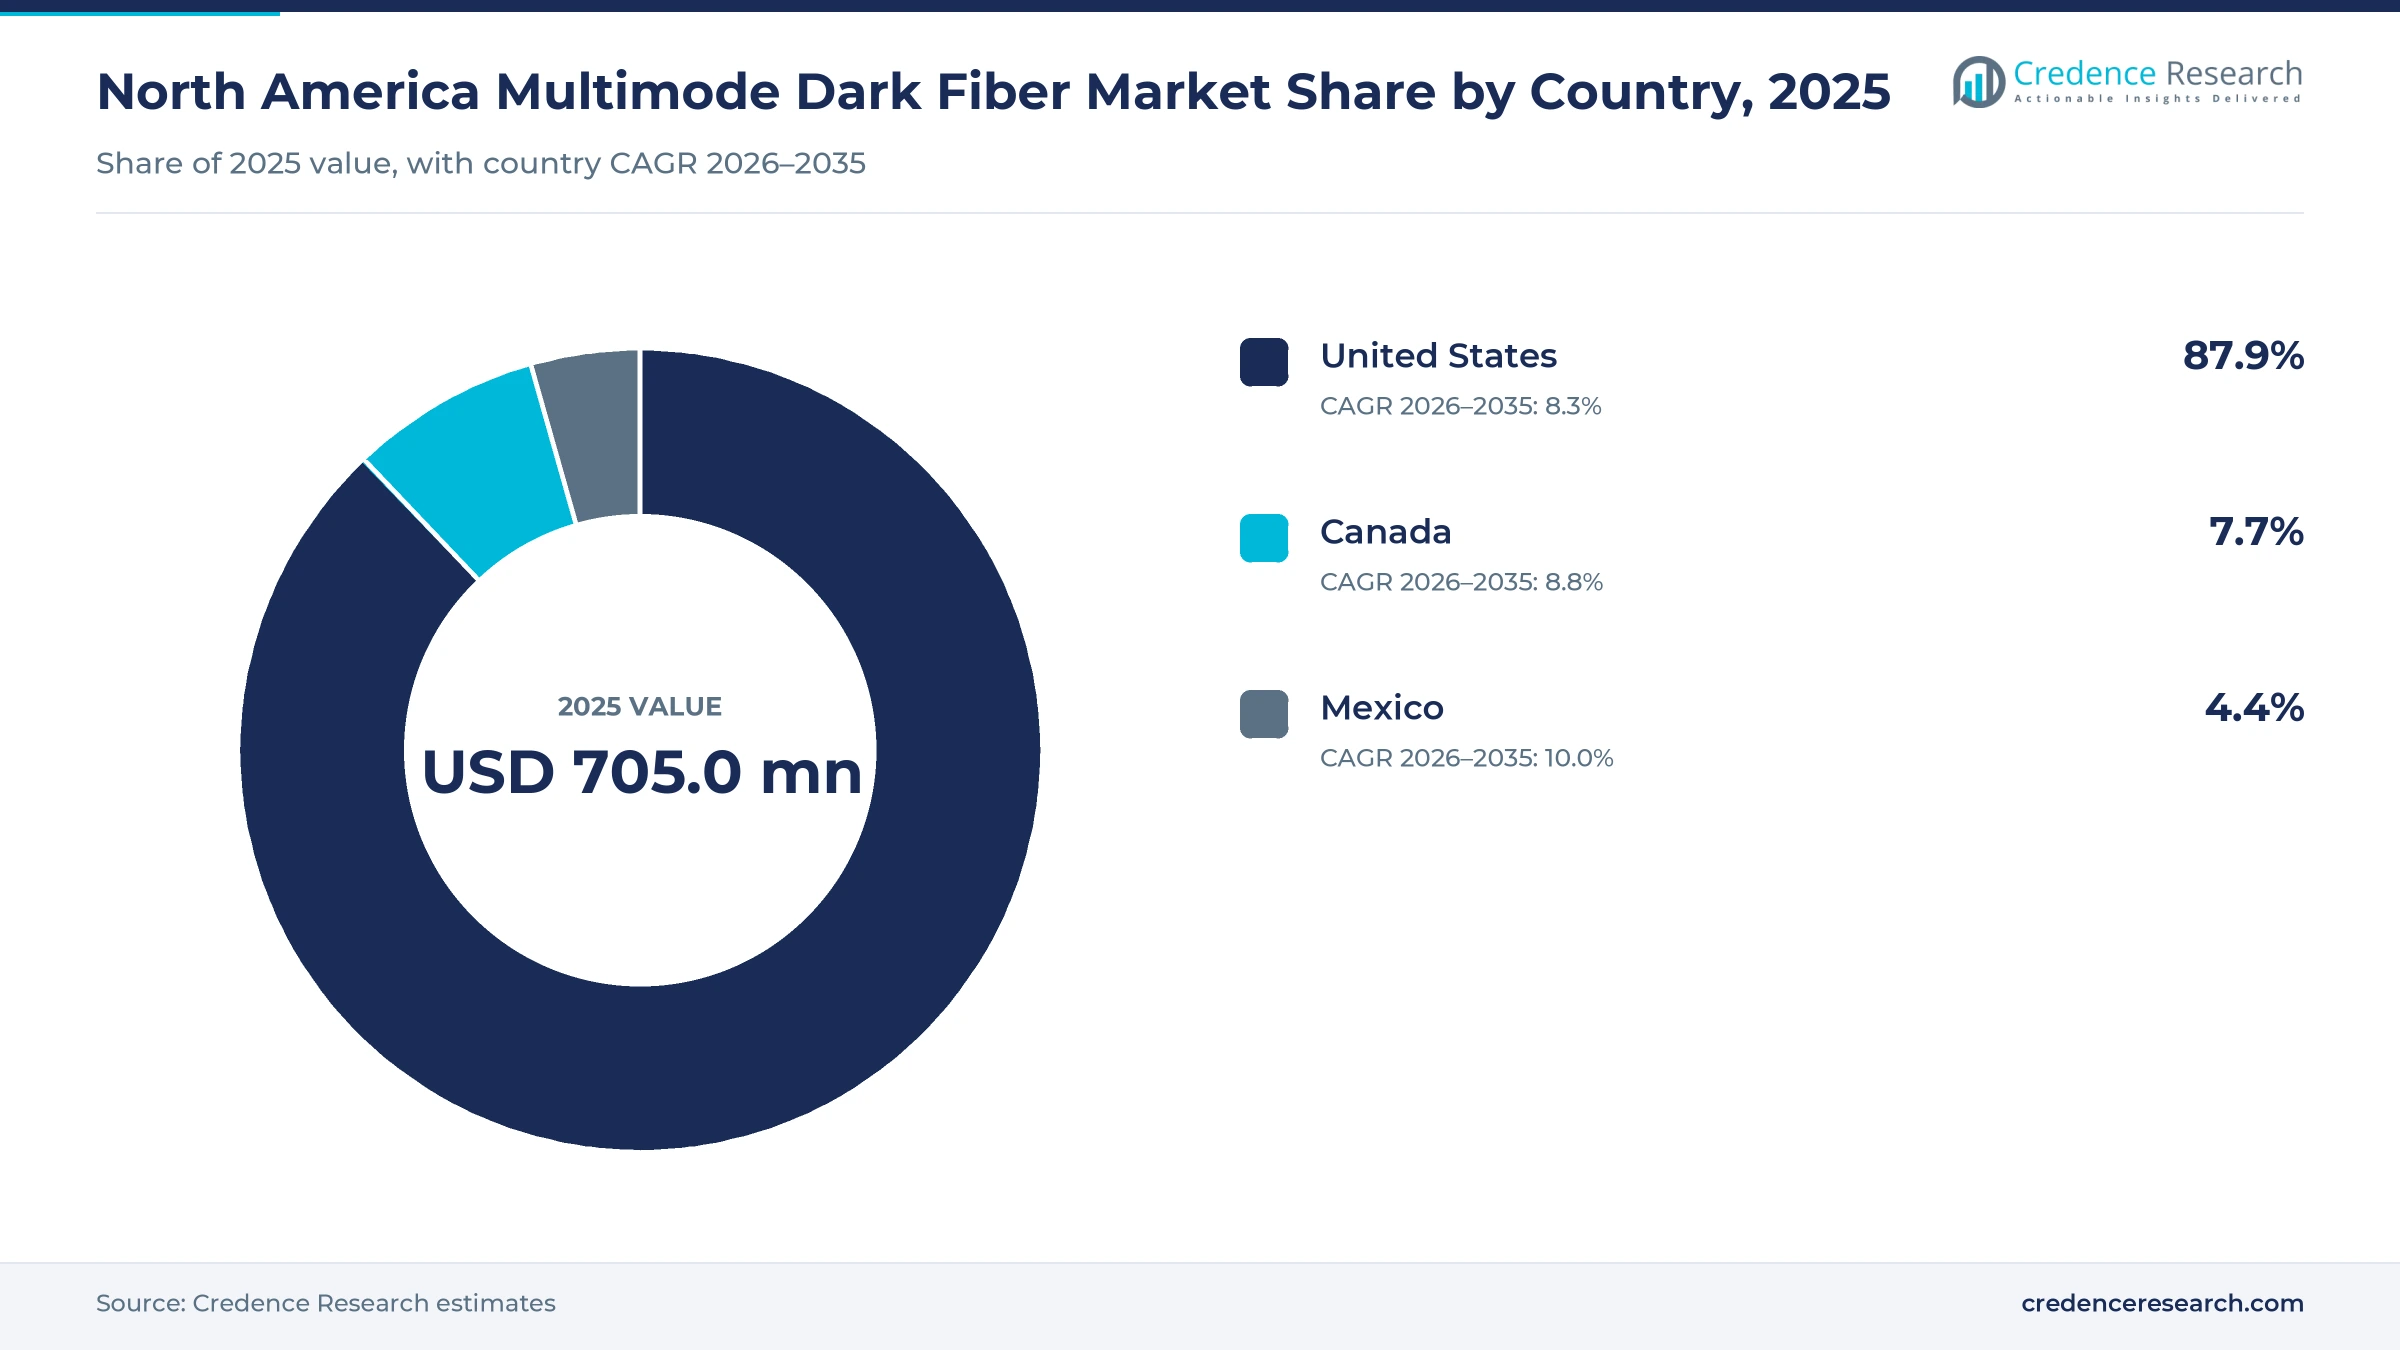
The North America multimode dark fiber market is split into the United States, Canada and Mexico, and Mexico also falls inside the Latin American regional definition, so its value appears in both regional estimates. Country shares and growth rates are Credence Research estimates built from live data center capacity, construction data and announced campus projects in each country.
| Country | Value, 2025 (USD million) | Share, 2025 | CAGR, 2026–2035 |
|---|---|---|---|
| United States | 619.7 | 87.9% | 8.3% |
| Canada | 54.3 | 7.7% | 8.8% |
| Mexico | 31.0 | 4.4% | 10.0% |
The United States hosts most AI and cloud halls
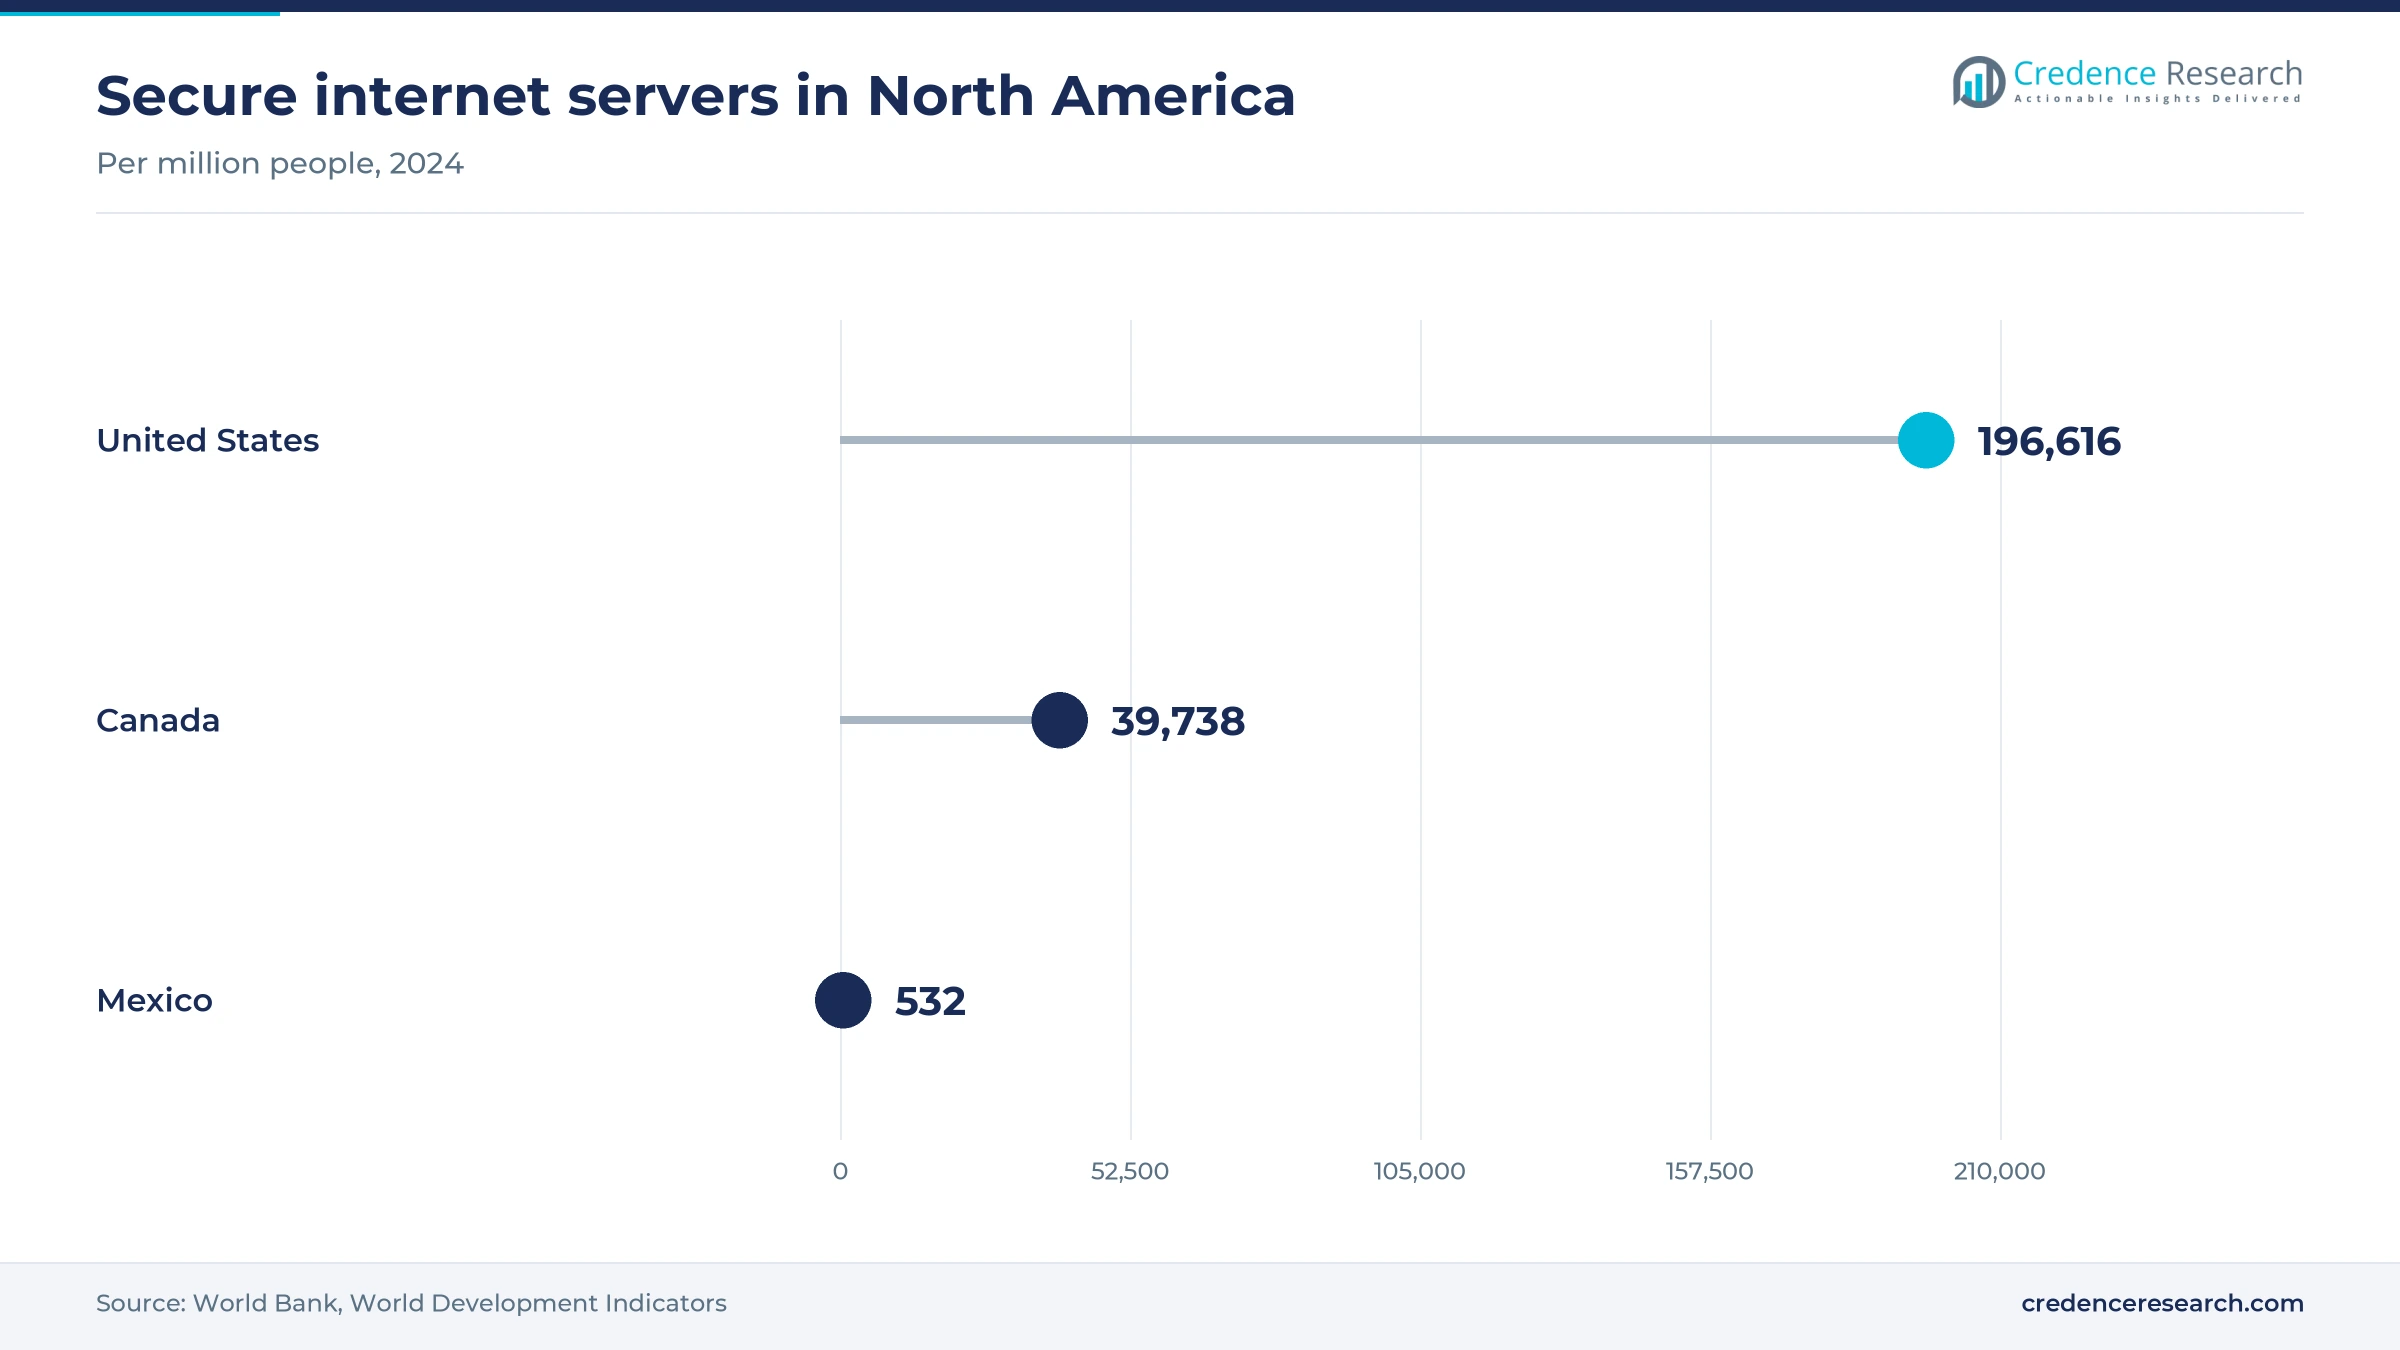
The United States held 87.9% of 2025 value and grows at 8.3% a year, because it hosts most of the continent's AI training halls, cloud regions and enterprise campuses. The country had 40.6 GW of live data center capacity in early 2026, according to BLG, against 1.4 GW in Canada. It also counted about 196,616 secure internet servers per million people in 2024, according to the World Bank. New hyperscale campuses in Virginia, Texas and the Midwest absorb most new multimode trunks as a result.
British Columbia hydropower anchors Canadian demand
Canada held 7.7% of 2025 value and grows at 8.8% a year, as hydroelectric power attracts AI halls to British Columbia while other provinces wait for grid capacity. The province will make 400 MW available over two years from February 2026, capped at 145 MW per project, according to BLG. Bell opened its first Bell AI Fabric site in Kamloops with Groq in June 2025, according to BCE. Canadian demand thus depends on a few large projects rather than many small enterprise refreshes.
Querétaro campuses lift Mexico from a small base
Mexico held 4.4% of 2025 value and grows fastest at 10.0% a year, because cloud providers and campus developers are building their first large halls around Querétaro. AWS opened its Mexico region with three availability zones in January 2025, and ODATA energized 200 MW at its Querétaro campus in February 2025. Mexico counted about 532 secure internet servers per million people in 2024, according to the World Bank, which shows how much room remains for hosting growth.
Cable deals and plant expansions marked 2025 and 2026
| Development | Status and market relevance |
|---|---|
| In January 2026, Amphenol completed its acquisition of CommScope's Connectivity and Cable Solutions business. | Completed acquisition; fiber connectivity for data centers now sits in Amphenol's communications segment. |
| In January 2026, Corning and Meta announced a multiyear agreement worth up to USD 6 billion for fiber, cable and connectivity. | Agreement announced; Corning plans to expand optical cable output in Hickory, North Carolina. |
| In April 2026, Zayo completed its purchase of Crown Castle's fiber solutions business, adding about 90,000 route miles. | Completed acquisition; consolidates single-mode carrier fiber next to the multimode building market. |
| In August 2026, Prysmian announced USD 1.25 billion to expand U.S. fiber and cable plants in three states. | Investment plan announced; no completion date published. |
| In August 2026, Lightera announced a manufacturing expansion across its U.S. operations backed by long-term purchase commitments. | Expansion plan announced; new capacity is due from the second half of fiscal 2028. |
Fiber grade and optics decide which strands stay useful
- OM4 and OM5 graded-index fiber carries the fastest short-reach Ethernet rates over tens of meters, which lets owners upgrade optics in later refresh cycles without pulling new cable through trays and risers.
- MPO-12 and MPO-16 connectivity carries eight or more fibers per connector, which keeps cable trays manageable in dense AI rows and shortens patching work.
- 850 nm VCSEL transceivers cost less and use less power than single-mode lasers over short runs, which keeps multimode competitive inside pods and enterprise closets.
- Pre-terminated trunks and cassettes arrive factory tested with optical connectors fitted, which cuts installation time on large builds.
Need a Custom Version of This Report?
Tailor the scope, geography, or segments to your exact requirements.
- Custom geography or segment scope
- Direct access to our analyst team
Fiber makers and cablers compete on plant and lead time
Competition centers on fiber makers and cablers that can deliver high-count multimode trunks quickly to large builds. Corning competes on integrated fiber, cable and connectivity output in North Carolina, and its agreement with Meta anchors new capacity. Prysmian competes on doubled fiber output in Claremont and its data center supply deal with Molex, while Lightera, formerly OFS, sells LaserWave multimode fiber from Georgia. Amphenol now owns the former CommScope connectivity and cable business, which adds enterprise and data center cabling systems to its range. AFL, part of Fujikura, makes cable and connectivity in South Carolina. Panduit, Belden and Leviton compete through distributors and certified installers in enterprise and industrial networks. Rivals compete on lead time, fiber grade, pre-terminated assemblies and warranty programs.
A few fiber draw plants feed many cablers and installers
Supply is organized as a narrow top and a wide base. Only a few companies draw multimode glass fiber for the region, mainly Corning and Prysmian in North Carolina and Lightera in Georgia, and they sell fiber to their own cable lines and to other cablers. Cablers and connectivity makers such as AFL, Amphenol, Panduit, Belden and Leviton turn it into trunks, cassettes and pre-terminated assemblies for distributors and installers. Entry is hard at fiber draw, which needs preform technology and large plants, but easier in assembly. Margins are highest in pre-terminated, factory-tested assemblies and lowest in bulk cable.
Fiber makers and cablers lead regional supply
| Company | Type | Role in the market |
|---|---|---|
| Corning Incorporated | Fiber and cable maker | Draws multimode fiber and makes cable and connectivity in North Carolina |
| Prysmian | Fiber and cable maker | Doubling fiber output in Claremont, North Carolina, for data center buyers |
| Amphenol Corporation (CommScope CCS) | Connectivity and cable maker | Acquired CommScope fiber connectivity and cable business in January 2026 |
| Lightera (Furukawa Electric) | Fiber and cable maker | Former OFS, sells LaserWave multimode fiber and cable from Georgia |
| AFL (Fujikura) | Cable and connectivity maker | Makes fiber optic cable and connectivity in Duncan, South Carolina |
| Panduit | Connectivity specialist | Sells Opti-Core OM4 multimode cable and data center connectivity |
| Belden Inc. | Cabling systems supplier | Supplies fiber cabling systems for data center and industrial networks |
| Leviton | Cabling systems supplier | Sells multimode fiber cabling and connectivity for enterprise networks |
Credence Research view on short-reach unlit capacity
Credence Research's view is that unlit multimode demand in North America will keep rising, but it will concentrate in fewer places than a decade ago. Interconnection rooms and carrier routes have moved to single-mode, and co-packaged optics will take some links inside AI rows. Multimode keeps a clear cost advantage for runs under about 50 m, which still describes most switch-to-server links in a training pod. Suppliers that pair OM4 or OM5 fiber with fast pre-terminated delivery should gain share, while bulk cable sellers face price pressure.
How the 2025 estimate was rebuilt from all-type data
The report uses 2025 as the base year on a calendar basis, and market values come from the Credence Research model. The 2025 value was rebuilt from published data on North American dark fiber of all types, live data center capacity, construction data and the reach limits of multimode optics, because the earlier page value exceeded what those data support. Country shares, segment splits and growth rates are Credence Research estimates. Sources used are standards bodies, regulators, statistical agencies, law firm and trade press reports and company publications, and no interviews or surveys were used.
AI pods and vehicle optics carry demand toward 2035
The North America multimode dark fiber market is expected to reach USD 1.58 billion by 2035, an 8.40% CAGR during 2026–2035, as AI pods, faster VCSEL optics and new halls in Canada and Mexico add short-reach strands. Growth should be strongest in data center networks, graded-index glass, automobile buyers and Mexico. Small edge sites will add steady but modest volumes, while the pace of co-packaged single-mode optics remains the main risk to the forecast. Suppliers with domestic fiber draw and fast pre-terminated delivery are best placed to capture the added volume.
Optics choices in AI pods decide the range of outcomes
The outcome depends mainly on how long AI pod designers keep VCSEL multimode optics for links inside rows. Faster adoption of co-packaged single-mode optics and longer row layouts would move value away from multimode and toward the downside case. Wide use of faster VCSEL optics over OM4 and OM5, steady enterprise refresh and early vehicle platform awards would push the market toward the upside case.
| Scenario | CAGR, 2026–2035 | Value, 2035 | What has to hold |
|---|---|---|---|
| Downside | 6.4% | USD 1.34 billion | Co-packaged single-mode optics reach AI pods quickly and campus refreshes slip |
| Base | 8.40% | USD 1.58 billion | AI halls keep multimode inside rows while hand-offs move to single-mode |
| Upside | 9.9% | USD 1.79 billion | Faster VCSEL optics hold inside rows and vehicle optical networks win early awards |
Frequently Asked Questions
How big is the North America multimode dark fiber market?
Which network type leads the market?
Which country leads the market?
Does the estimate include the wider U.S. dark fiber market?
How far can multimode fiber carry 800G links?
What does OM4 multimode cable cost?
Why did Equinix stop offering multimode cross connects?
Which companies lead the market?
Table of Content
Chapter 1 Market Segmentation
- 1.1 Segmentation Framework
- 1.1.1 Product and Service Classification
- 1.1.2 Application and End-Use Classification
- 1.1.3 Technology and Solution Classification
- 1.1.4 Customer and Distribution Channel Classification
- 1.1.5 Geographic Segmentation
- 1.1.6 Market Segment Definitions and Boundaries
- 1.2 By Fiber Type
- 1.2.1 Graded-index Multimode Fiber
- 1.2.2 Step-index Multimode Fiber
- 1.3 By Network Type
- 1.3.1 Data Center Network
- 1.3.2 Enterprise and Campus Network
- 1.3.3 Metro Access Network
- 1.4 By Material Type
- 1.4.1 Glass
- 1.4.2 Plastic
- 1.5 By End User
- 1.5.1 Telecom and Data Centers
- 1.5.2 Industrial Automation & Control
- 1.5.3 Aerospace & Defense
- 1.5.4 Automobile
- 1.5.5 Others
- 1.6 By Country
- 1.6.1 United States
- 1.6.2 Canada
- 1.6.3 Mexico
Chapter 2 Introduction
- 2.1 Report Objectives and Scope
- 2.2 Product Definition and Industry Terminology
- 2.3 Market Inclusions and Exclusions
- 2.4 Research Process
- 2.4.1 Primary Research and Expert Interviews
- 2.4.2 Secondary Research and Source Review
- 2.4.3 Top-Down and Bottom-Up Estimation
- 2.4.4 Data Triangulation and Verification
- 2.5 Market Size Measurement Basis
- 2.5.1 2025: USD 705.0 million → 2035: USD 1.58 billion
- 2.6 Historical and Forecast Reference Periods
- 2.6.1 Historical Period: 2018-2025
- 2.6.2 Base Year: 2025
- 2.6.3 Forecast Period: 2025-2035
- 2.7 Research Assumptions and Limitations
Chapter 3 Executive Summary
- 3.1 Market Snapshot and Key Findings
- 3.2 Base-Year Market Size, 2025
- 3.3 Forecast Market Size, 2035
- 3.4 Revenue and Volume Growth Outlook
- 3.5 Key Demand and Supply Indicators
- 3.6 Leading Market Segments
- 3.7 Fastest-Growing Market Opportunities
- 3.8 Regional Performance Highlights
- 3.9 Technology and Industry Transformation
- 3.10 Competitive Landscape Summary
- 3.11 Analyst View and Strategic Implications
Chapter 4 North America Multimode Dark Fiber Market Trends and Developments
- 4.1 Historical Industry Development, 2018-2025
- 4.2 Recent Market Trends and Developments
- 4.3 Demand and Customer Behavior Trends
- 4.4 Technology and Product Innovation
- 4.5 Artificial Intelligence, Automation and Digitalization
- 4.6 Local Manufacturing and Supply Chain Realignment
- 4.7 Industry Partnerships, Mergers and Acquisitions
- 4.8 Sustainability and Circular Economy Developments
- 4.9 Government and Private Sector Investment Trends
- 4.10 Emerging Business Models and Commercialization
- 4.11 Industry Developments and Announcements
Chapter 5 North America Multimode Dark Fiber Market Production, Supply and Demand Analysis
- 5.1 Demand Trend and Consumption Analysis, 2018-2025
- 5.2 Demand Forecast, 2025-2035
- 5.3 Production and Output Trend, 2018-2025
- 5.4 Production and Output Forecast, 2025-2035
- 5.5 Installed Capacity and Capacity Utilization
- 5.6 Company-Wise Production Plants and Statistics
- 5.6.1 Installed Production Capacity
- 5.6.2 Actual Production
- 5.6.3 Planned Capacity and Expansion Targets
- 5.7 Supply Chain Structure and Procurement Trends
- 5.8 Supply-Demand Gap and Bottlenecks
- 5.9 Import Dependence and Sourcing Structure
- 5.10 Contract Manufacturing and Outsourcing
- 5.11 Regional Supply and Demand Concentration
Chapter 6 North America Multimode Dark Fiber Market Pricing Analysis
- 6.1 Pricing Structure and Measurement
- 6.2 Historical Pricing Trends, 2018-2025
- 6.3 Pricing Outlook, 2025-2035
- 6.4 Average Selling Price and Unit Economics
- 6.5 Pricing by Product and Market Segment
- 6.6 Geographic Pricing Differences
- 6.7 Key Input, Energy, Labor and Logistics Costs
- 6.8 Contract Pricing and Purchasing Models
- 6.9 Pricing Sensitivity and Competitive Positioning
- 6.10 Price, Margin and Profitability Implications
Chapter 7 North America Multimode Dark Fiber Market Dynamics
- 7.1 Market Growth Drivers
- 7.1.1 Demand-Side Drivers
- 7.1.2 Technology and Innovation Drivers
- 7.1.3 Infrastructure and Investment Drivers
- 7.1.4 Regulatory and Policy Drivers
- 7.2 Market Restraints
- 7.2.1 Cost and Affordability Constraints
- 7.2.2 Technology and Adoption Barriers
- 7.2.3 Supply Chain and Operational Constraints
- 7.3 Market Challenges
- 7.3.1 Competitive Pressure and Margin Erosion
- 7.3.2 Skills, Infrastructure and Implementation Gaps
- 7.4 Emerging Market Opportunities
- 7.5 Market Dynamics Impact and Time-Horizon Assessment
Chapter 8 North America Multimode Dark Fiber Value Chain Analysis
- 8.1 Industry Value Chain Overview
- 8.2 Upstream Suppliers and Critical Inputs
- 8.3 Technology and Component Providers
- 8.4 Manufacturing or Service Delivery
- 8.5 Distribution, Channel Partners and Integrators
- 8.6 Downstream Applications and End Users
- 8.7 Value Addition and Profit Pools
- 8.8 Vertical Integration and Outsourcing
- 8.9 Supplier Concentration and Risk
- 8.10 Supply Chain Localization and Resilience
Chapter 9 North America Multimode Dark Fiber Market Regulations and Policies
- 9.1 Relevant Laws, Standards and Compliance Frameworks
- 9.2 Product, Service, Safety and Quality Requirements
- 9.3 Government Policies, Incentives and Subsidies
- 9.4 Imports, Exports and Trade Barriers
- 9.5 Public Procurement and Local Content Requirements
- 9.6 Environmental and Sustainability Compliance
- 9.7 Data Protection, AI and Cybersecurity Compliance
- 9.8 Upcoming Policy Changes and Market Implications
Chapter 10 North America Multimode Dark Fiber Market Hotspots and Opportunities
- 10.1 Market Opportunity Mapping and Growth Hotspots
- 10.2 High-Growth Applications and Customer Groups
- 10.3 Underserved Markets and White-Space Opportunities
- 10.4 Emerging Technology and Product Opportunities
- 10.5 New Capacity and Investment Hotspots
- 10.6 Market Entry and Expansion Opportunities
- 10.7 Distribution and Partnership Opportunities
- 10.8 Near-Term and Long-Term Commercial Potential
- 10.9 Opportunity Attractiveness and Execution Risks
Chapter 11 North America Multimode Dark Fiber Market Outlook, 2025-2035
- 11.1 Market Size and Analysis
- 11.1.1 Revenue (Market Measurement: 2025: USD 705.0 million → 2035: USD 1.58 billion)
- 11.1.2 Market Volume and Quantity Sold
- 11.1.3 Historical Market Size, 2018-2025
- 11.1.4 Base-Year Market Size, 2025
- 11.2 Market Forecast, 2025-2035
- 11.2.1 Revenue Forecast to 2035
- 11.2.2 Volume Forecast to 2035
- 11.2.3 CAGR and Year-on-Year Growth
- 11.2.4 Incremental Revenue Opportunity
- 11.3 Forecast Assumptions and Scenario Analysis
- 11.3.1 Base-Case Forecast
- 11.3.2 Optimistic and Conservative Scenarios
- 11.3.3 Technology, Pricing and Policy Sensitivities
- 11.4 Market Attractiveness and Growth Outlook
Chapter 12 North America Multimode Dark Fiber Market Segmentation and Outlook
- 12.1 Segmentation Summary and Market Shares, 2025
- 12.2 Largest and Fastest-Growing Segments
- 12.3 By Fiber Type - Market Size and Forecast, 2025-2035
- 12.3.1 Segment Definition and Scope
- 12.3.2 Historical Market Size, 2018-2025
- 12.3.3 Revenue Forecast, 2025-2035
- 12.3.4 Volume Forecast, 2025-2035
- 12.3.5 Base-Year Market Share, 2025
- 12.3.6 Segment CAGR and Growth Drivers
- 12.3.7 Subsegment Market Size and Forecast
- 12.3.7.1 Graded-index Multimode Fiber
- 12.3.7.2 Step-index Multimode Fiber
- 12.3.8 Subsegment Pricing and Adoption Trends
- 12.3.9 Leading Suppliers and Competition
- 12.3.10 Regional Demand and Opportunities
- 12.4 By Network Type - Market Size and Forecast, 2025-2035
- 12.4.1 Segment Definition and Scope
- 12.4.2 Historical Market Size, 2018-2025
- 12.4.3 Revenue Forecast, 2025-2035
- 12.4.4 Volume Forecast, 2025-2035
- 12.4.5 Base-Year Market Share, 2025
- 12.4.6 Segment CAGR and Growth Drivers
- 12.4.7 Subsegment Market Size and Forecast
- 12.4.7.1 Data Center Network
- 12.4.7.2 Enterprise and Campus Network
- 12.4.7.3 Metro Access Network
- 12.4.8 Subsegment Pricing and Adoption Trends
- 12.4.9 Leading Suppliers and Competition
- 12.4.10 Regional Demand and Opportunities
- 12.5 By Material Type - Market Size and Forecast, 2025-2035
- 12.5.1 Segment Definition and Scope
- 12.5.2 Historical Market Size, 2018-2025
- 12.5.3 Revenue Forecast, 2025-2035
- 12.5.4 Volume Forecast, 2025-2035
- 12.5.5 Base-Year Market Share, 2025
- 12.5.6 Segment CAGR and Growth Drivers
- 12.5.7 Subsegment Market Size and Forecast
- 12.5.7.1 Glass
- 12.5.7.2 Plastic
- 12.5.8 Subsegment Pricing and Adoption Trends
- 12.5.9 Leading Suppliers and Competition
- 12.5.10 Regional Demand and Opportunities
- 12.6 By End User - Market Size and Forecast, 2025-2035
- 12.6.1 Segment Definition and Scope
- 12.6.2 Historical Market Size, 2018-2025
- 12.6.3 Revenue Forecast, 2025-2035
- 12.6.4 Volume Forecast, 2025-2035
- 12.6.5 Base-Year Market Share, 2025
- 12.6.6 Segment CAGR and Growth Drivers
- 12.6.7 Subsegment Market Size and Forecast
- 12.6.7.1 Telecom and Data Centers
- 12.6.7.2 Industrial Automation & Control
- 12.6.7.3 Aerospace & Defense
- 12.6.7.4 Automobile
- 12.6.7.5 Others
- 12.6.8 Subsegment Pricing and Adoption Trends
- 12.6.9 Leading Suppliers and Competition
- 12.6.10 Regional Demand and Opportunities
- 12.7 By Country - Market Size and Forecast, 2025-2035
- 12.7.1 Segment Definition and Scope
- 12.7.2 Historical Market Size, 2018-2025
- 12.7.3 Revenue Forecast, 2025-2035
- 12.7.4 Volume Forecast, 2025-2035
- 12.7.5 Base-Year Market Share, 2025
- 12.7.6 Segment CAGR and Growth Drivers
- 12.7.7 Subsegment Market Size and Forecast
- 12.7.7.1 United States
- 12.7.7.2 Canada
- 12.7.7.3 Mexico
- 12.7.8 Subsegment Pricing and Adoption Trends
- 12.7.9 Leading Suppliers and Competition
- 12.7.10 Regional Demand and Opportunities
- 12.8 Segment Growth Comparison
- 12.9 Segment Attractiveness and Priority Matrix
Chapter 13 North America Multimode Dark Fiber End-Use and Application Market Outlook
- 13.1 End-Use Industry and Customer Demand Structure
- 13.2 Leading Applications and Customer Groups
- 13.3 End-Use Market Size, Share and Forecast
- 13.4 Major End-Use Industry Deep Dives
- 13.4.1 Customer Requirements and Use Cases
- 13.4.2 Demand and Replacement Cycles
- 13.4.3 Technical and Regulatory Considerations
- 13.4.4 Purchasing and Procurement Models
- 13.4.5 Leading Vendors and Distribution Channels
- 13.4.6 Forecast and Commercial Opportunities
- 13.5 Emerging Applications and Cross-Segment Demand
- 13.6 End-Use Industry Investment Priorities
Chapter 14 North America Multimode Dark Fiber Geographic Market Outlook, 2025-2035
- 14.1 Regional Market Size and Country-Level Shares, 2025
- 14.2 Country Market Size Comparison, 2025
- 14.3 Country Market Forecasts, 2025-2035
- 14.4 Subregional Industrial and Demand Clusters
- 14.5 Intra-Regional Pricing and Cost Differences
- 14.6 Cross-Border Trade and Supply Networks
- 14.7 Regional Supply and Demand Balances
- 14.8 Country Opportunity Comparison and Prioritization
Note: Every listed country is covered on the structure shown under the first country.
Chapter 15 North America Multimode Dark Fiber Technology, Innovation and Sustainability Outlook
- 15.1 Technology Landscape and Maturity
- 15.2 Product, Process and Service Innovation
- 15.3 AI, Automation and Digital Tools in the Industry
- 15.4 Technology Adoption and Performance Benchmarking
- 15.5 Innovation Pipeline and R&D Investment
- 15.6 Patent and Intellectual Property Trends
- 15.7 Energy Efficiency and Resource Management
- 15.8 Sustainability, Recycling and Circularity
- 15.9 Technology Roadmap, 2025-2035
- 15.10 Risks of Obsolescence and Technology Substitution
Chapter 16 North America Multimode Dark Fiber Market Key Strategic Imperatives
- 16.1 Growth and Market Entry Priorities
- 16.2 High-Return Products and Segments
- 16.3 Pricing, Profitability and Cost Optimization
- 16.4 Technology Investment and Product Differentiation
- 16.5 Supply Chain Localization and Resilience
- 16.6 Distribution and Customer Acquisition
- 16.7 Partnership, Acquisition and Capacity Strategy
- 16.8 Regional Expansion Priorities
- 16.9 Short-, Medium- and Long-Term Actions
Chapter 17 Competition Outlook
- 17.1 Industry Competition Characteristics
- 17.2 Market Structure and Concentration
- 17.3 Market Share and Competitive Positioning, 2025
- 17.4 Company-Wise Revenue and Product Benchmarking
- 17.5 Production and Service Capacity Benchmarking
- 17.6 Technology, Pricing and Differentiation
- 17.7 Regional Footprint and Distribution Strength
- 17.8 Mergers, Acquisitions and Strategic Alliances
- 17.9 New Entrants and Competitive Threats
- 17.10 Porter's Five Forces and Industry Attractiveness
- 17.11 Competitive Outlook, 2025-2035
Chapter 18 Company Profiles
- 18.1 Company Coverage and Selection Criteria
- 18.2 Corning Incorporated
- 18.2.1 Business Description
- 18.2.2 Company Ownership and Geographic Presence
- 18.2.3 Product and Service Portfolio
- 18.2.4 Manufacturing and Operating Footprint
- 18.2.5 Production Capacity and Expansion Plans
- 18.2.6 Financial Performance and Investment
- 18.2.7 Market Share and Competitive Position
- 18.2.8 Technology and Innovation Capabilities
- 18.2.9 Strategic Alliances or Partnerships
- 18.2.10 Recent Developments
- 18.2.11 Growth Strategy and Outlook
- 18.3 Prysmian
- 18.4 Amphenol Corporation (CommScope CCS)
- 18.5 Lightera (Furukawa Electric)
- 18.6 AFL (Fujikura)
- 18.7 Panduit
- 18.8 Belden Inc.
- 18.9 Leviton
- 18.10 Other Relevant Market Participants
Note: Every listed company is profiled on the structure shown under the first company. The company list is preliminary and may change based on research findings, market developments, data availability and client requirements.
Chapter 19 Disclaimer
- 19.1 Research and Forecast Disclaimer
- 19.2 Data Source and Estimation Limitations
Note: The depth of individual sections depends on data availability for this market. Volume, capacity, trade and other unit-based metrics are included where applicable.

