
Inline 3D inspection moves into battery and chip lines
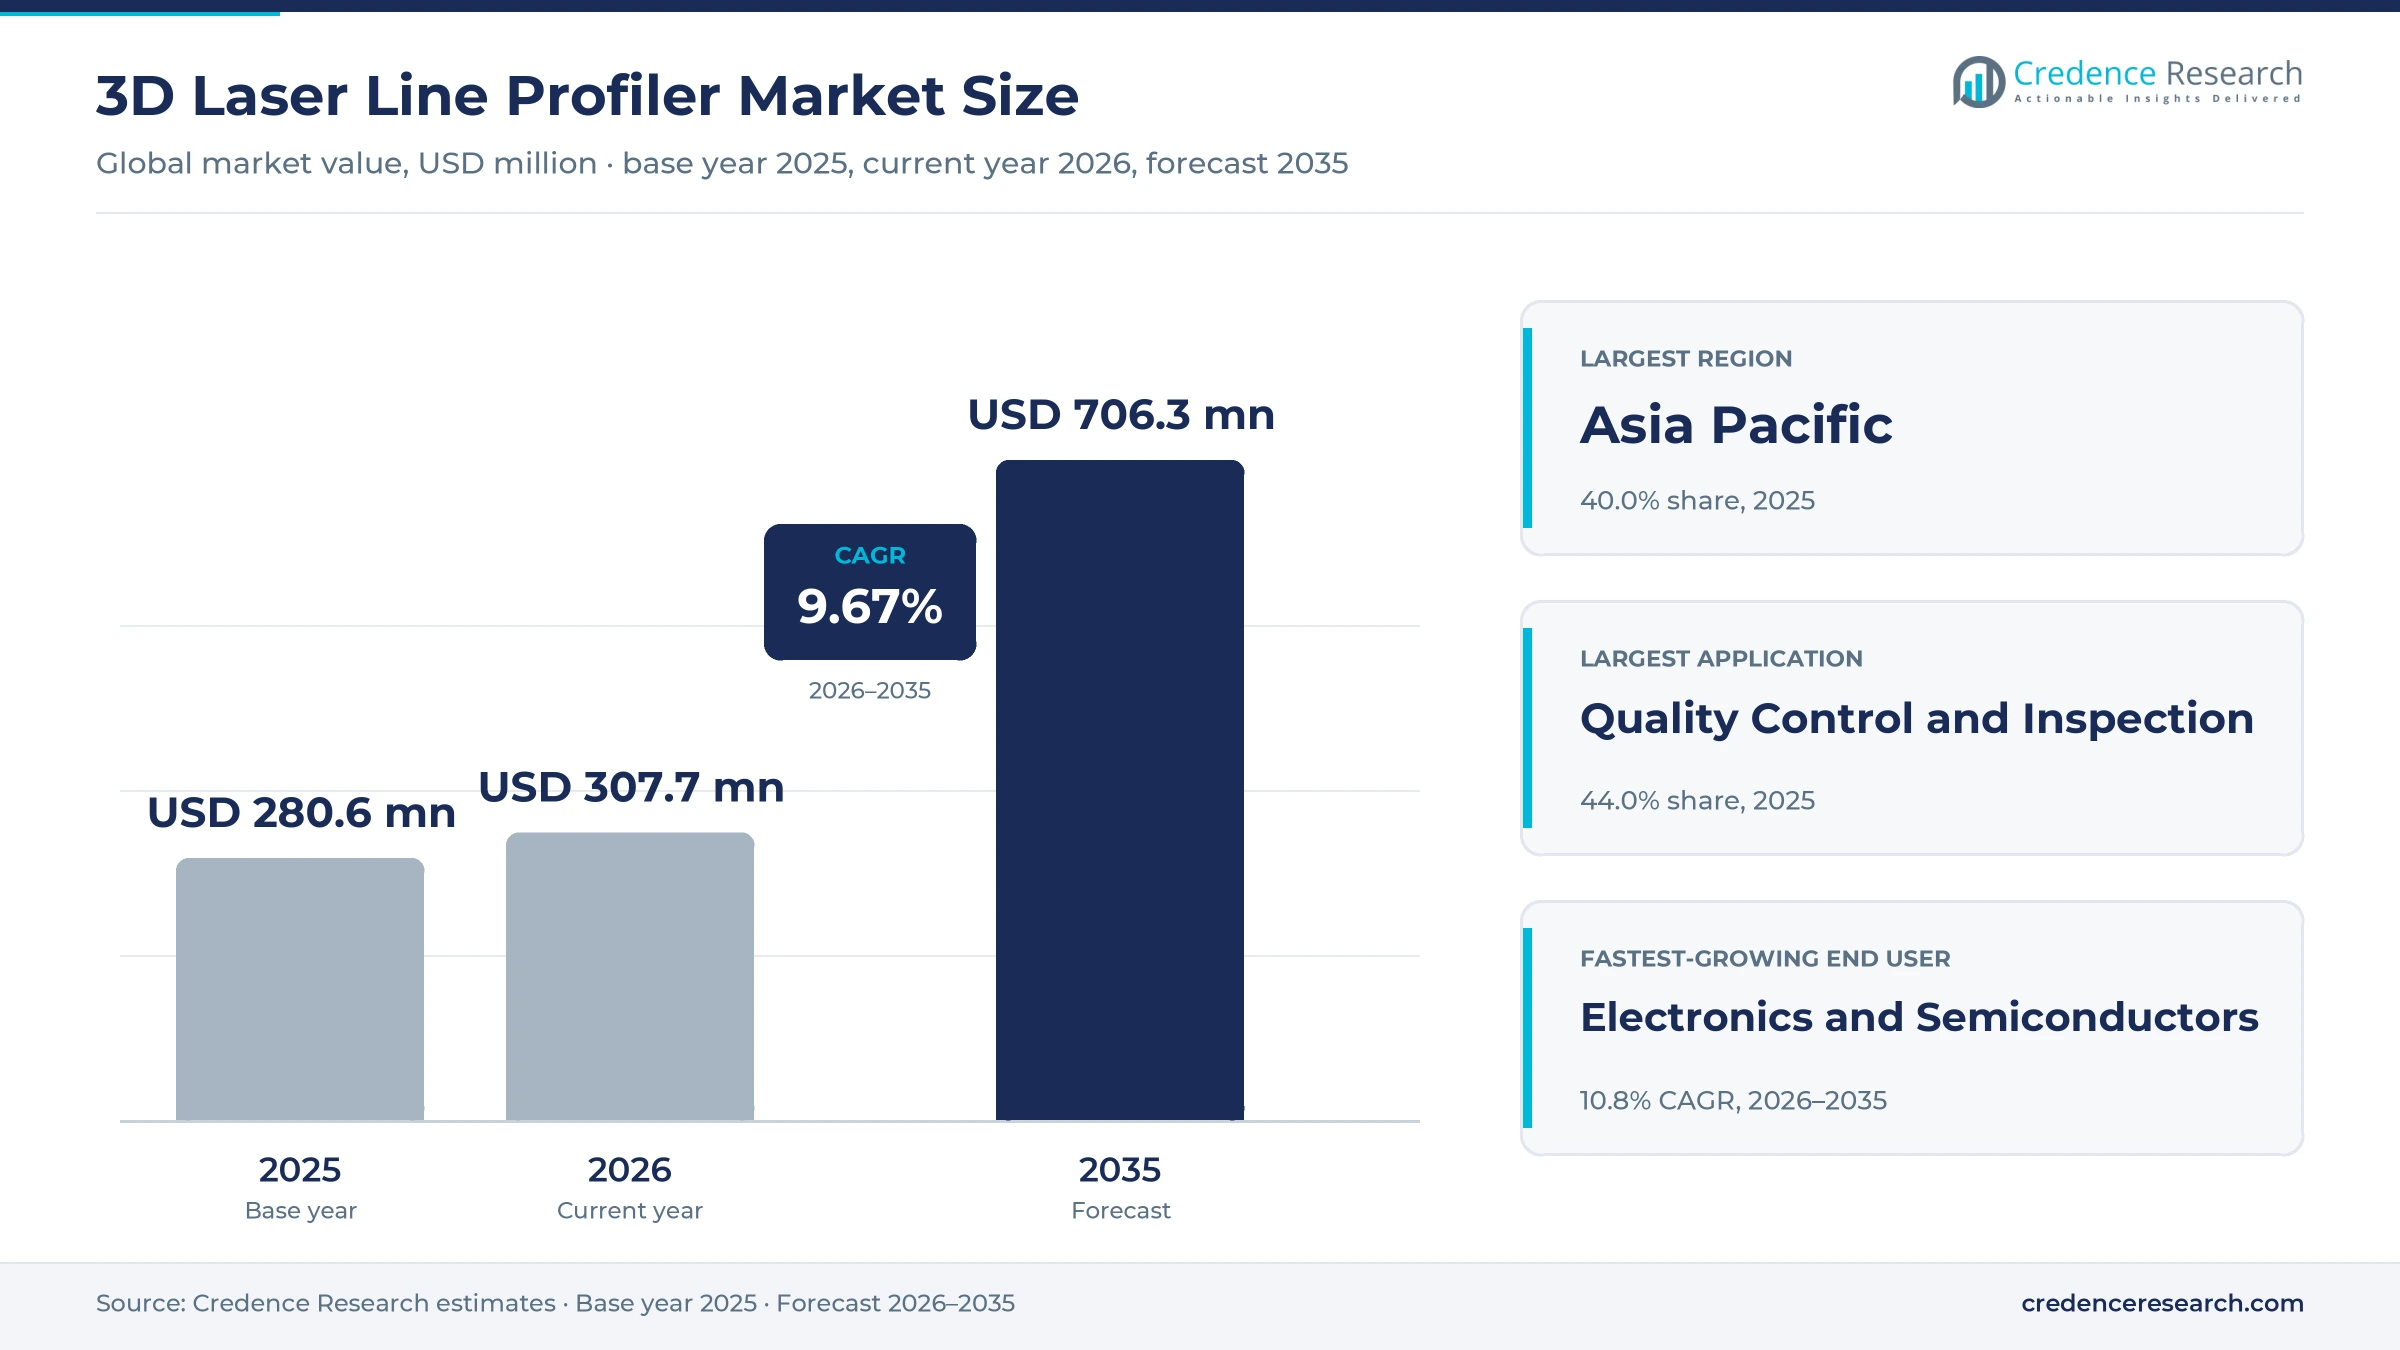
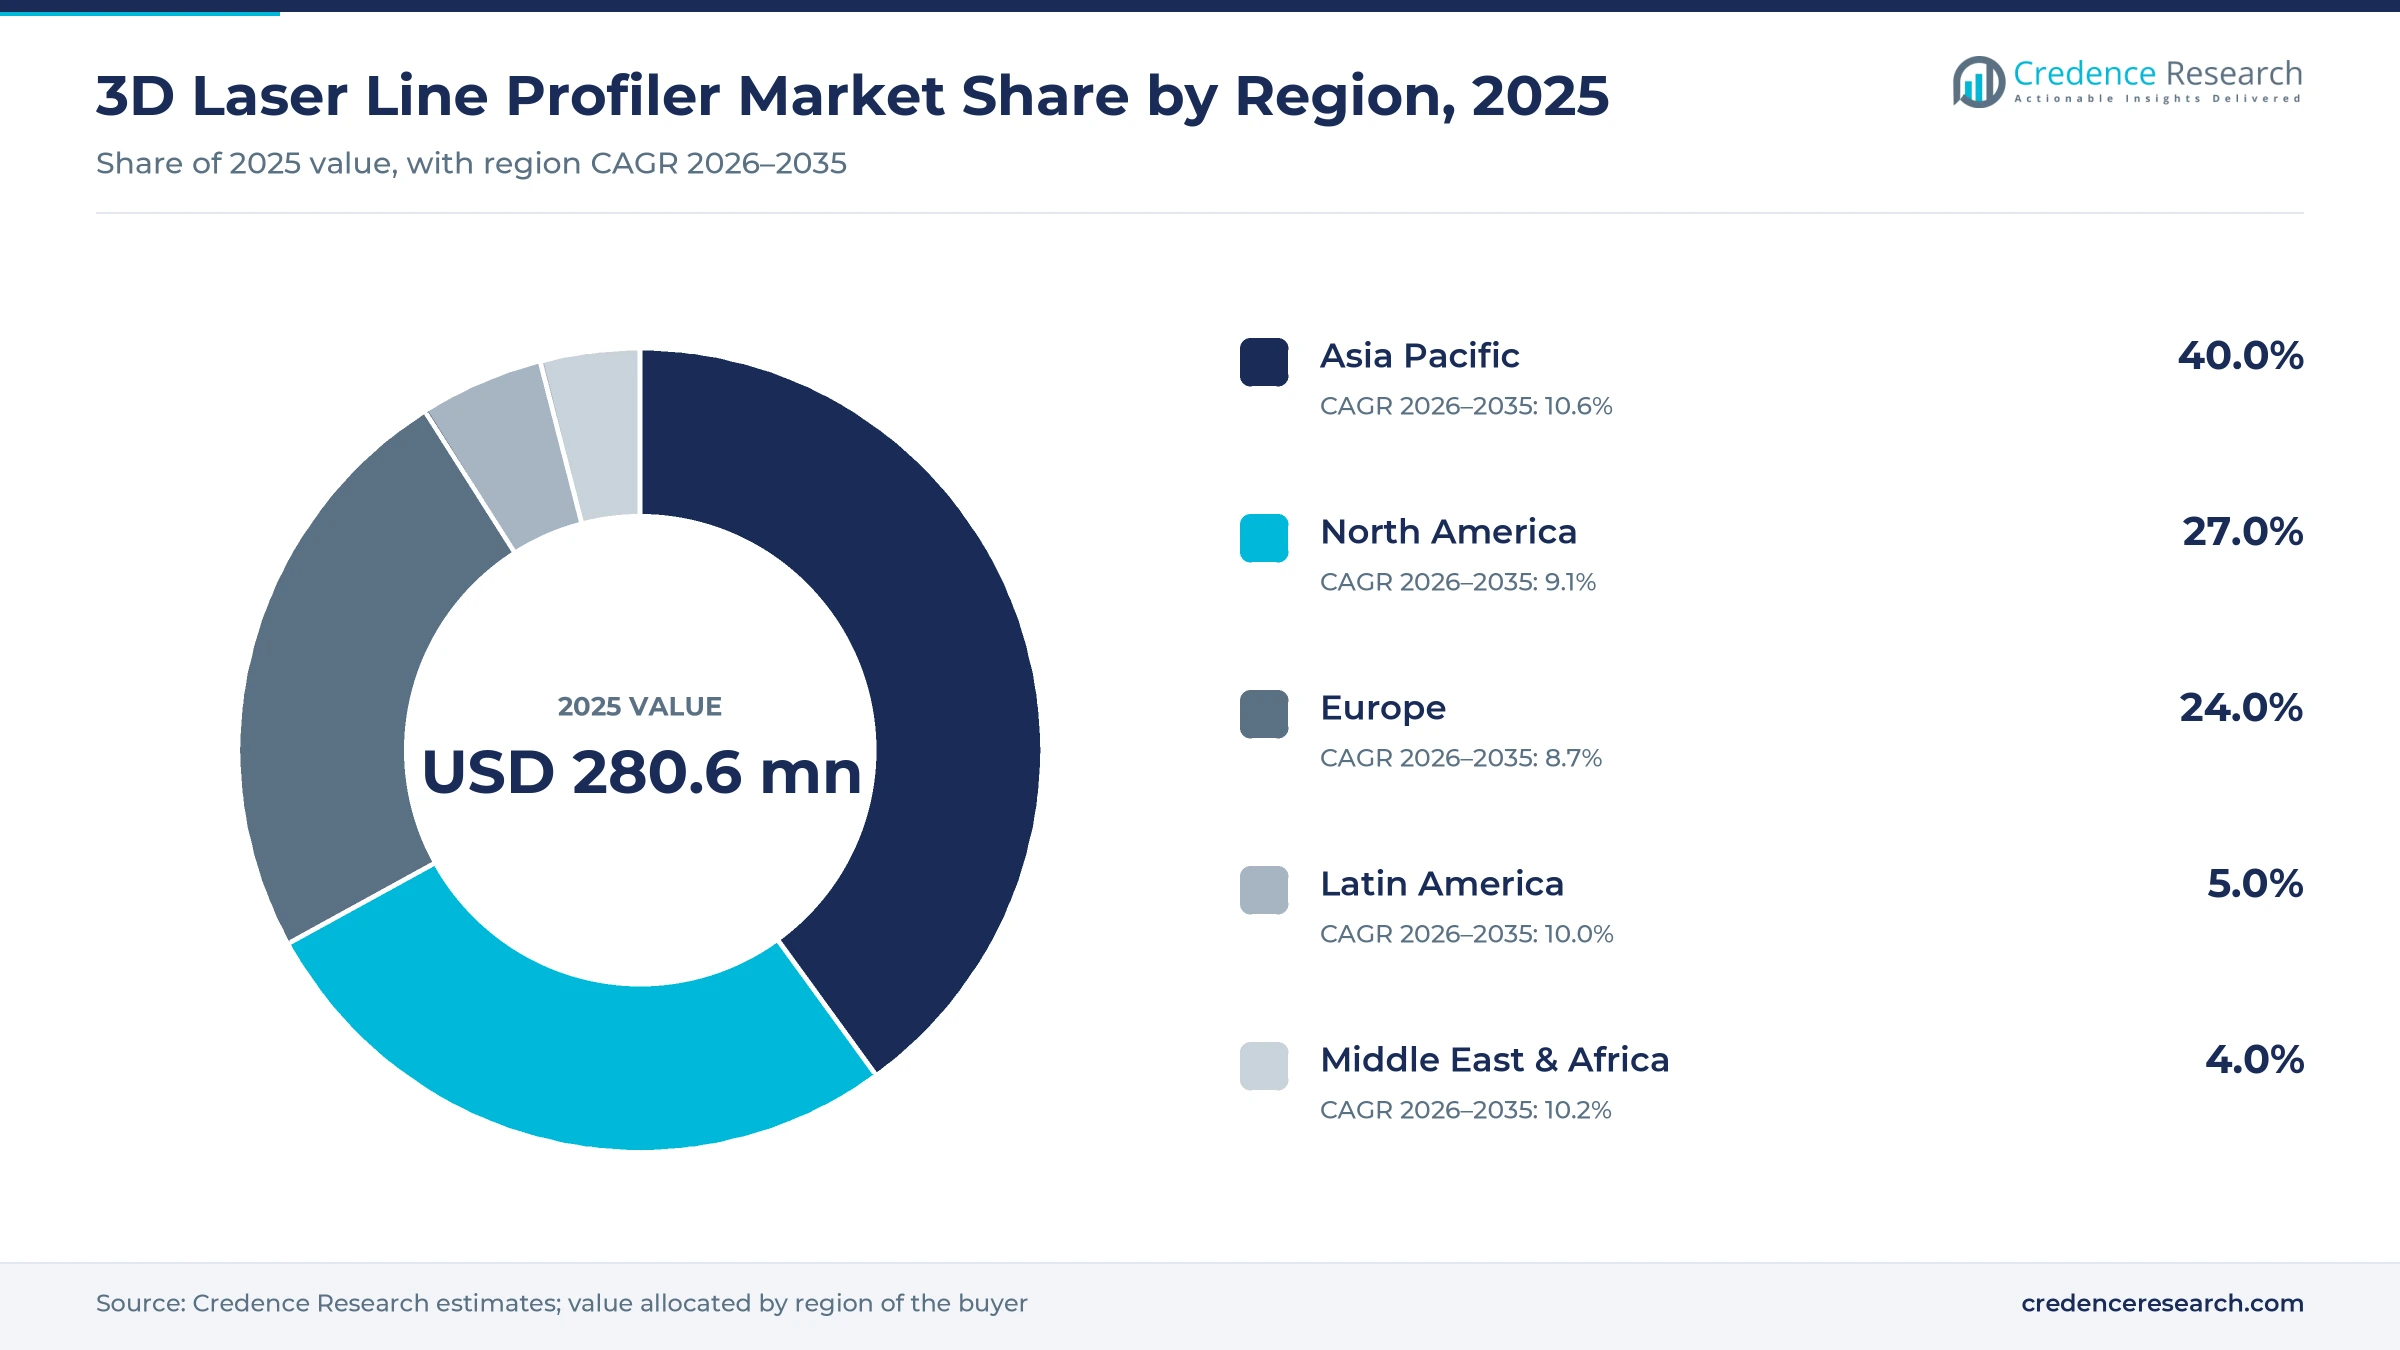
The global 3D laser line profiler market was valued at USD 280.6 million in 2025 and is projected to increase from USD 307.7 million in 2026 to USD 706.3 million by 2035, registering a CAGR of 9.67% during 2026–2035. Demand comes from battery cell and module lines, semiconductor and electronics assembly, automotive body and powertrain plants, tire, wood and logistics operations that need fast, non-contact height and shape measurement on moving parts. Asia Pacific held the largest regional share, 40.0% in 2025, because China, Japan and Korea host most battery and electronics production, and it is also the fastest-growing region at 10.6% a year. North America follows with 27.0%, supported by automotive body shops, new battery plants and semiconductor fabs. Blue-laser sensors with on-board measurement tools now let integrators skip a separate vision PC on many inspection stations. Sensor prices from Chinese suppliers are falling, which widens adoption but squeezes the margins of established brands.
Why do factories measure shape with a single laser line?
The estimate counts sensors that project a laser line onto a moving part and use triangulation to build height profiles, including smart profilers with built-in measurement tools, 3D streaming cameras that send profiles to a host and the laser line heads of portable arm and handheld scanners. Buyers are machine builders, system integrators and plant engineering teams, who usually order through the sensor maker or its authorized distributors.
Coordinate measuring machines, structured-light area cameras without a laser line, vision software sold separately and integration labor fall outside the scope. Because a profiler is often specified during line design, a supplier chosen for a battery, electronics or automotive line tends to keep that station for its full life.
3D Laser Line Profiler Market Insights
- The market is valued at USD 280.6 million in 2025 and is projected to reach USD 706.3 million by 2035, growing at a 9.67% CAGR as battery and semiconductor lines automate inspection.
- Asia Pacific led with 40.0% of 2025 value, because China installed 295,000 industrial robots in 2024 and hosts over 80% of battery cell capacity.
- Fixed 3D Laser Line Profilers held 86.0% of 2025 value, since most demand comes from inline stations that measure every part at line speed.
- In August 2024, the European Commission approved EUR 5 billion of German aid for the ESMC chip fab in Dresden, a new greenfield buyer of inspection stations.
- Chinese suppliers such as Hikrobot and SinceVision are expanding abroad, and Hikrobot launched its 3D laser profile sensor in India in October 2025.
Fixed inline sensors lead as robot guidance gains
Fixed inline sensors carry volume while portable heads serve metrology
Based on product type, the market is categorized into fixed 3D laser line profilers and portable 3D laser line profilers. Fixed 3D Laser Line Profilers led with 86.0% of 2025 value and also grow fastest at 9.8% a year, because inline stations check every part at production speed rather than sampling. Wide-field inline units now reach line speeds of thousands of profiles per second, as the Teledyne launch in the developments table shows. Portable heads on measuring arms and handheld scanners such as the ZEISS T-SCAN hawk 2 serve first-article and tooling checks, a smaller and slower-growing pool.
Inspection leads while robot guidance grows fastest
Based on application, the market is categorized into quality control and inspection, industrial automation, production and assembly, and research and development. Quality Control and Inspection led with 44.0% of 2025 value because battery, electronics and tire plants must document dimensions and surface defects on every unit, and SICK lists glue bead, flatness and battery housing scratch checks among Ruler3000 uses. Industrial Automation grows fastest at 10.7% a year as profilers guide welding and picking robots, and North American automotive OEM robot orders rose 34% in the first half of 2025, according to the Association for Advancing Automation.
Automotive and battery plants lead as chip lines accelerate
Based on end user, the market is categorized into automotive and EV battery, electronics and semiconductors, consumer goods, aerospace and others. Automotive and EV Battery led with 36.0% of 2025 value because body, powertrain, electrode, cell and module lines each need several profilers per station, and the IEA puts EV battery deployment at 1.2 TWh in 2025. Electronics and Semiconductors grow fastest at 10.8% a year as new fabs and assembly plants add wafer, package and board inspection stations, and India alone produced electronics worth about USD 127 billion in 2024-25, according to IBEF.
| Segment Group | Leading Sub-segment | Share, 2025 | Fastest-growing Sub-segment | CAGR, 2026–2035 |
|---|---|---|---|---|
| By Product Type | Fixed 3D Laser Line Profilers | 86.0% | Fixed 3D Laser Line Profilers | 9.8% |
| By Application | Quality Control and Inspection | 44.0% | Industrial Automation | 10.7% |
| By End User | Automotive and EV Battery | 36.0% | Electronics and Semiconductors | 10.8% |
Inline profilers list at about USD 5,000 to 11,000
Sensor makers price per unit, with list prices set by field of view, resolution, speed and whether measurement tools run on the sensor. Distributor listings in North America show about USD 5,081 for a Leuze LPS 36.10 and USD 11,077 for a wenglor MLSL124, while most premium brands quote on request through system integrators. Chinese suppliers undercut these levels on battery and electronics lines, and Western brands have answered with cheaper entry-level tiers of smart sensors. Software licenses, mounting, calibration and integration often cost as much as the sensor, so the buyer judges total station cost rather than the list price alone.
| Offer | Typical price or fee | Basis |
|---|---|---|
| Leuze LPS 36.10 light section sensor | USD 5,081 list | Automation Distribution listing, November 2026 |
| wenglor weCat3D MLSL124 profile sensor | USD 11,077 list | Standard Electric Supply listing, November 2026 |
| Entry-level Asian smart profiler | About USD 2,000–4,000 per unit | Credence Research estimate; no public list price found |
| Micron-level blue-laser smart profiler | About USD 15,000–30,000 per unit | Credence Research estimate scaled from the distributor listings above |
| Laser line head for portable arm or handheld scanner | About USD 20,000–60,000 per head | Credence Research estimate, head only, arm excluded |
Request a Free Sample
Fill in your details and we'll send you a free sample report.
- Sample data tables & charts
- Research methodology
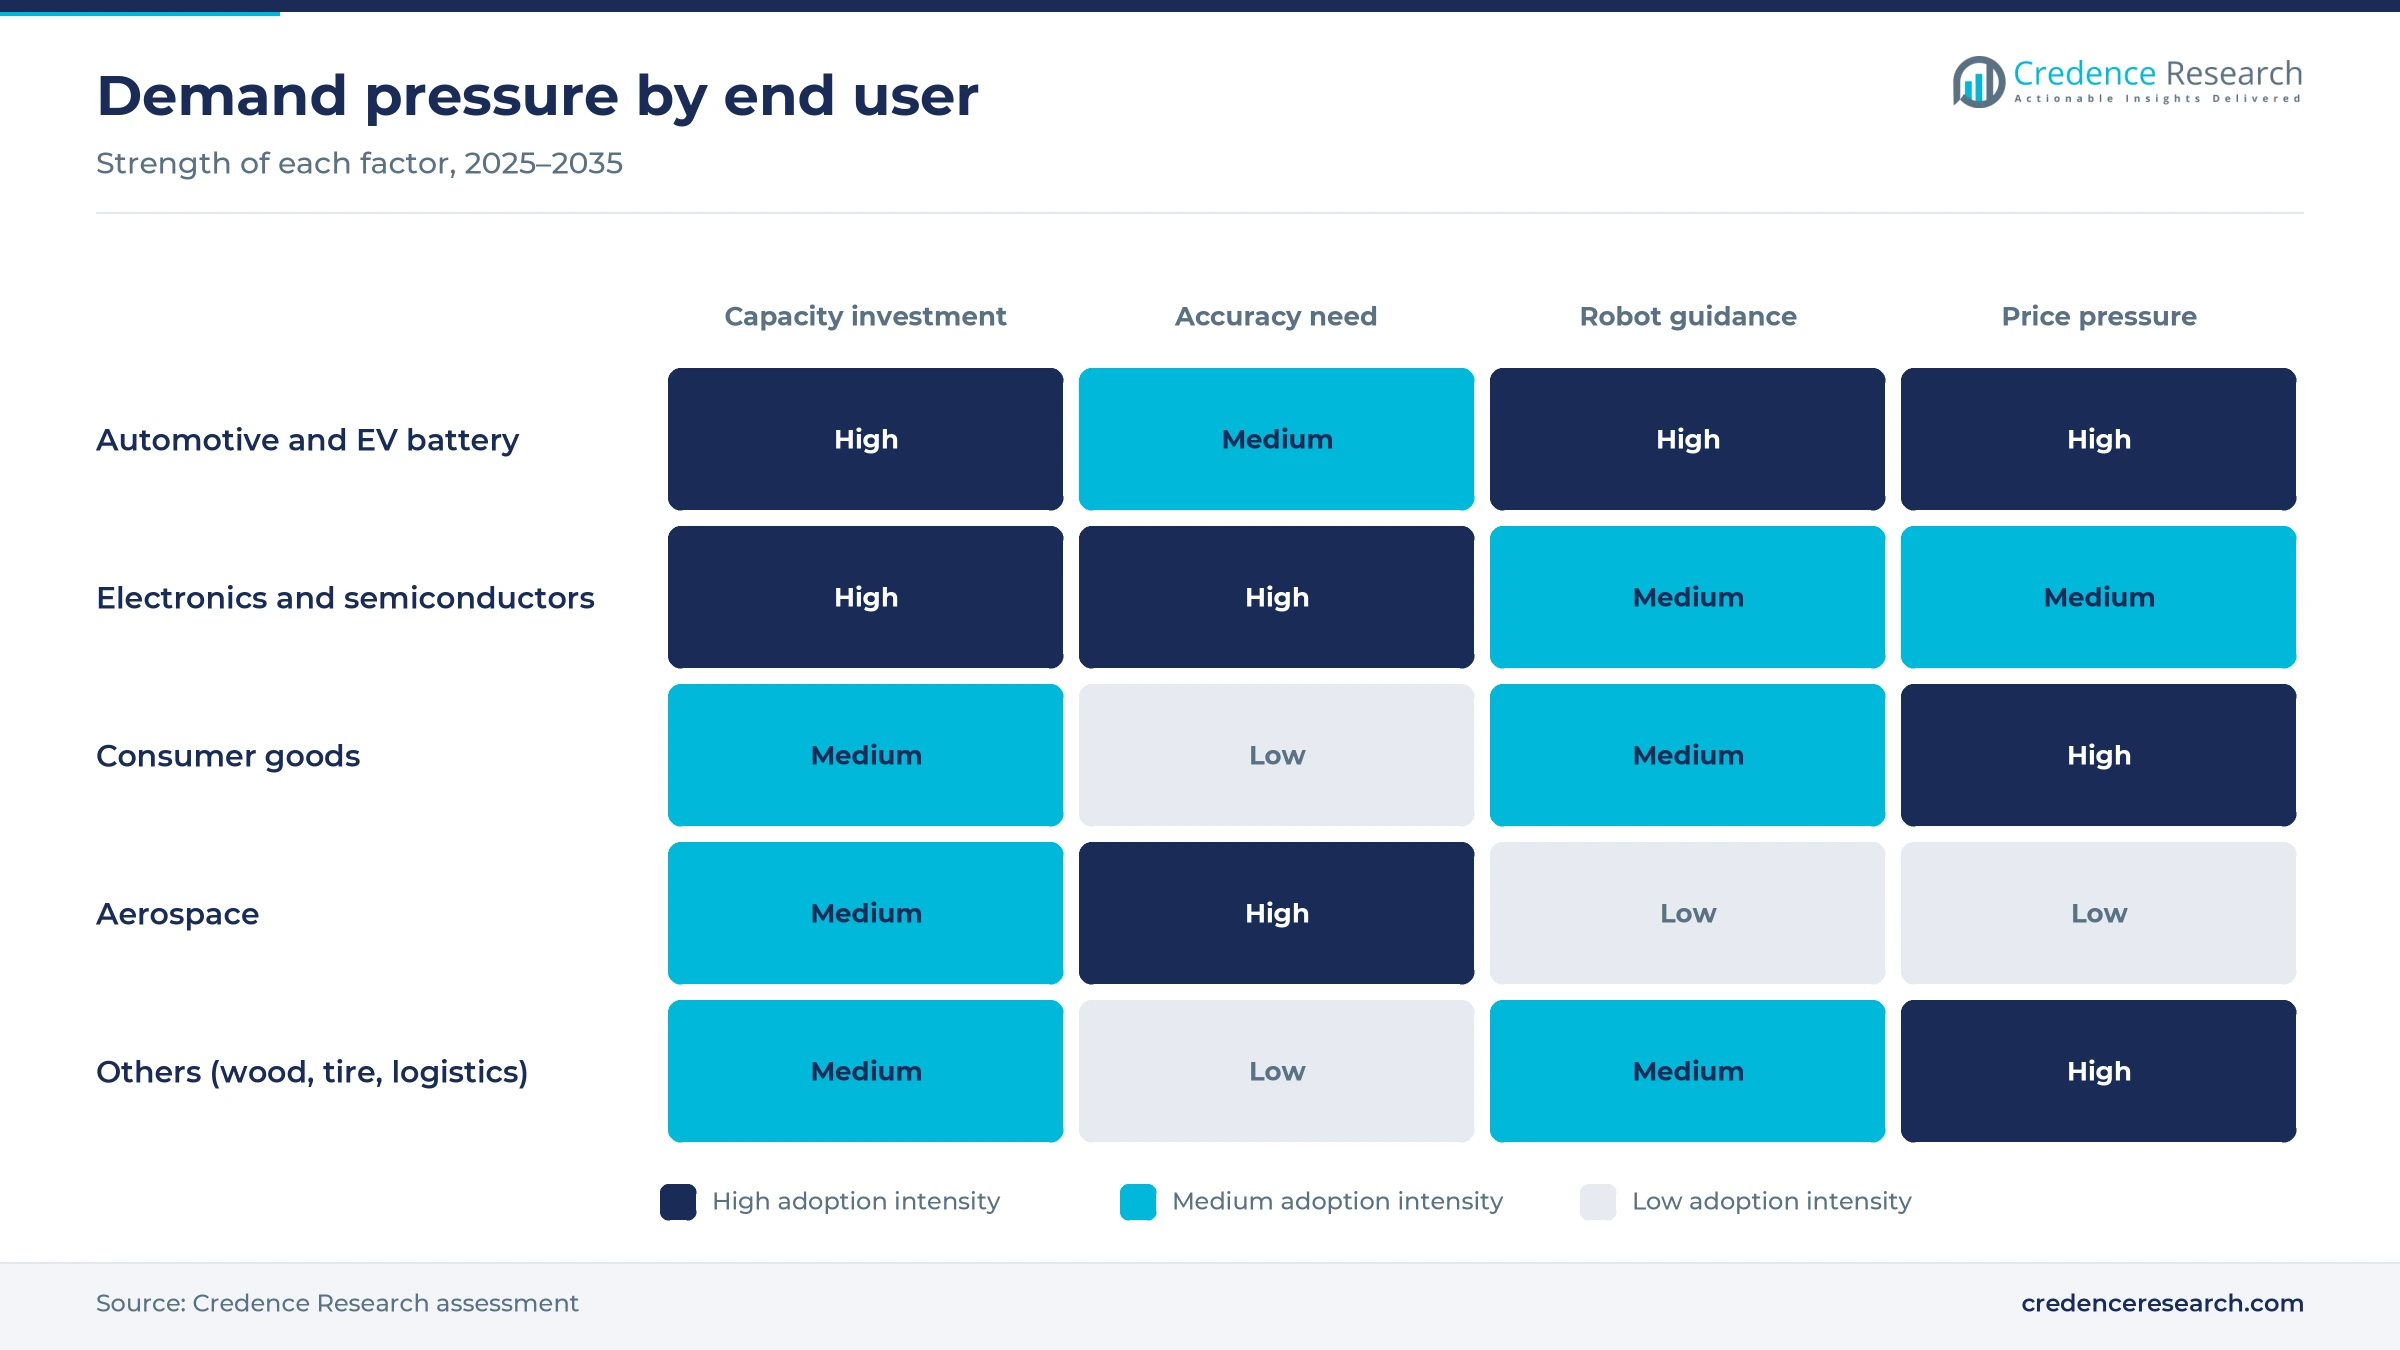
Battery, chip and robot investment pull sensor demand
Battery cell lines add profilers at every stage
Battery manufacturing is the strongest new source of demand, because electrode coating, slitting, stacking, welding and module assembly each need non-contact height and gap checks at line speed. The IEA reported that EV battery deployment reached 1.2 TWh in 2025, almost 30% more than in 2024, and that global lithium-ion manufacturing capacity passed 4 TWh by the end of 2025, with China holding over 80%. TKH Group said in March 2026 that its 3D machine vision business won projects in battery manufacturing and consumer electronics, mainly in Asia. Suppliers that offer battery-specific measurement tools and fast blue-laser heads gain the most from this capacity, although overcapacity in China can delay new lines.
Robot installations widen guidance and seam tracking use
Industrial robots need eyes for welding, gluing, picking and bin handling, and a 3D laser line profiler is the common choice when a robot must follow a seam or locate a part edge. The IFR counted 542,000 industrial robots installed in 2024, more than double the total of ten years earlier, and expects about 575,000 in 2025 and more than 700,000 a year by 2028. China alone installed 295,000 robots in 2024, the highest annual total on record. Each welding or dispensing cell that adds a profiler for path correction raises sensor volume faster than robot volume, which favors suppliers with ready robot interfaces.
Semiconductor and electronics lines need micron-level height data
Smaller pitches in chips, packages and boards push inspection from 2D images to 3D height data, because coplanarity, warpage and solder volume cannot be judged from contrast alone. SEMI expects 300mm fab equipment spending to rise 9% to USD 116 billion in 2026, with China, Korea and Taiwan leading investment. LMI launched the Gocator 6300 series in March 2025 with Z repeatability as fine as 0.15 micrometers for semiconductor, EV battery and consumer electronics inspection. Each new advanced packaging or board line adds several height-inspection stations to its tool set. Suppliers with micron-class optics capture the highest prices per unit in this segment, while generic red-laser sensors stay excluded.
Automotive plants extend inline gap and flush checks
Automotive plants keep moving dimensional checks from offline measuring rooms to the line, because inline data lets engineers correct body, weld and sealing faults before parts pile up. North American companies ordered 17,635 robots worth USD 1.094 billion in the first half of 2025, with automotive OEM unit orders up 34%, according to the Association for Advancing Automation. In Mexico, automotive accounted for 63% of the 5,600 robots installed in 2024, the IFR said. New EV platforms add battery tray, sealing and gap checks to the body shop. Suppliers with automotive references and robust IP67 housings are best placed for these retrofit and new-platform orders.
AI tools, snapshot heads and cheaper wide-field units
AI defect tools merge with 3D measurement
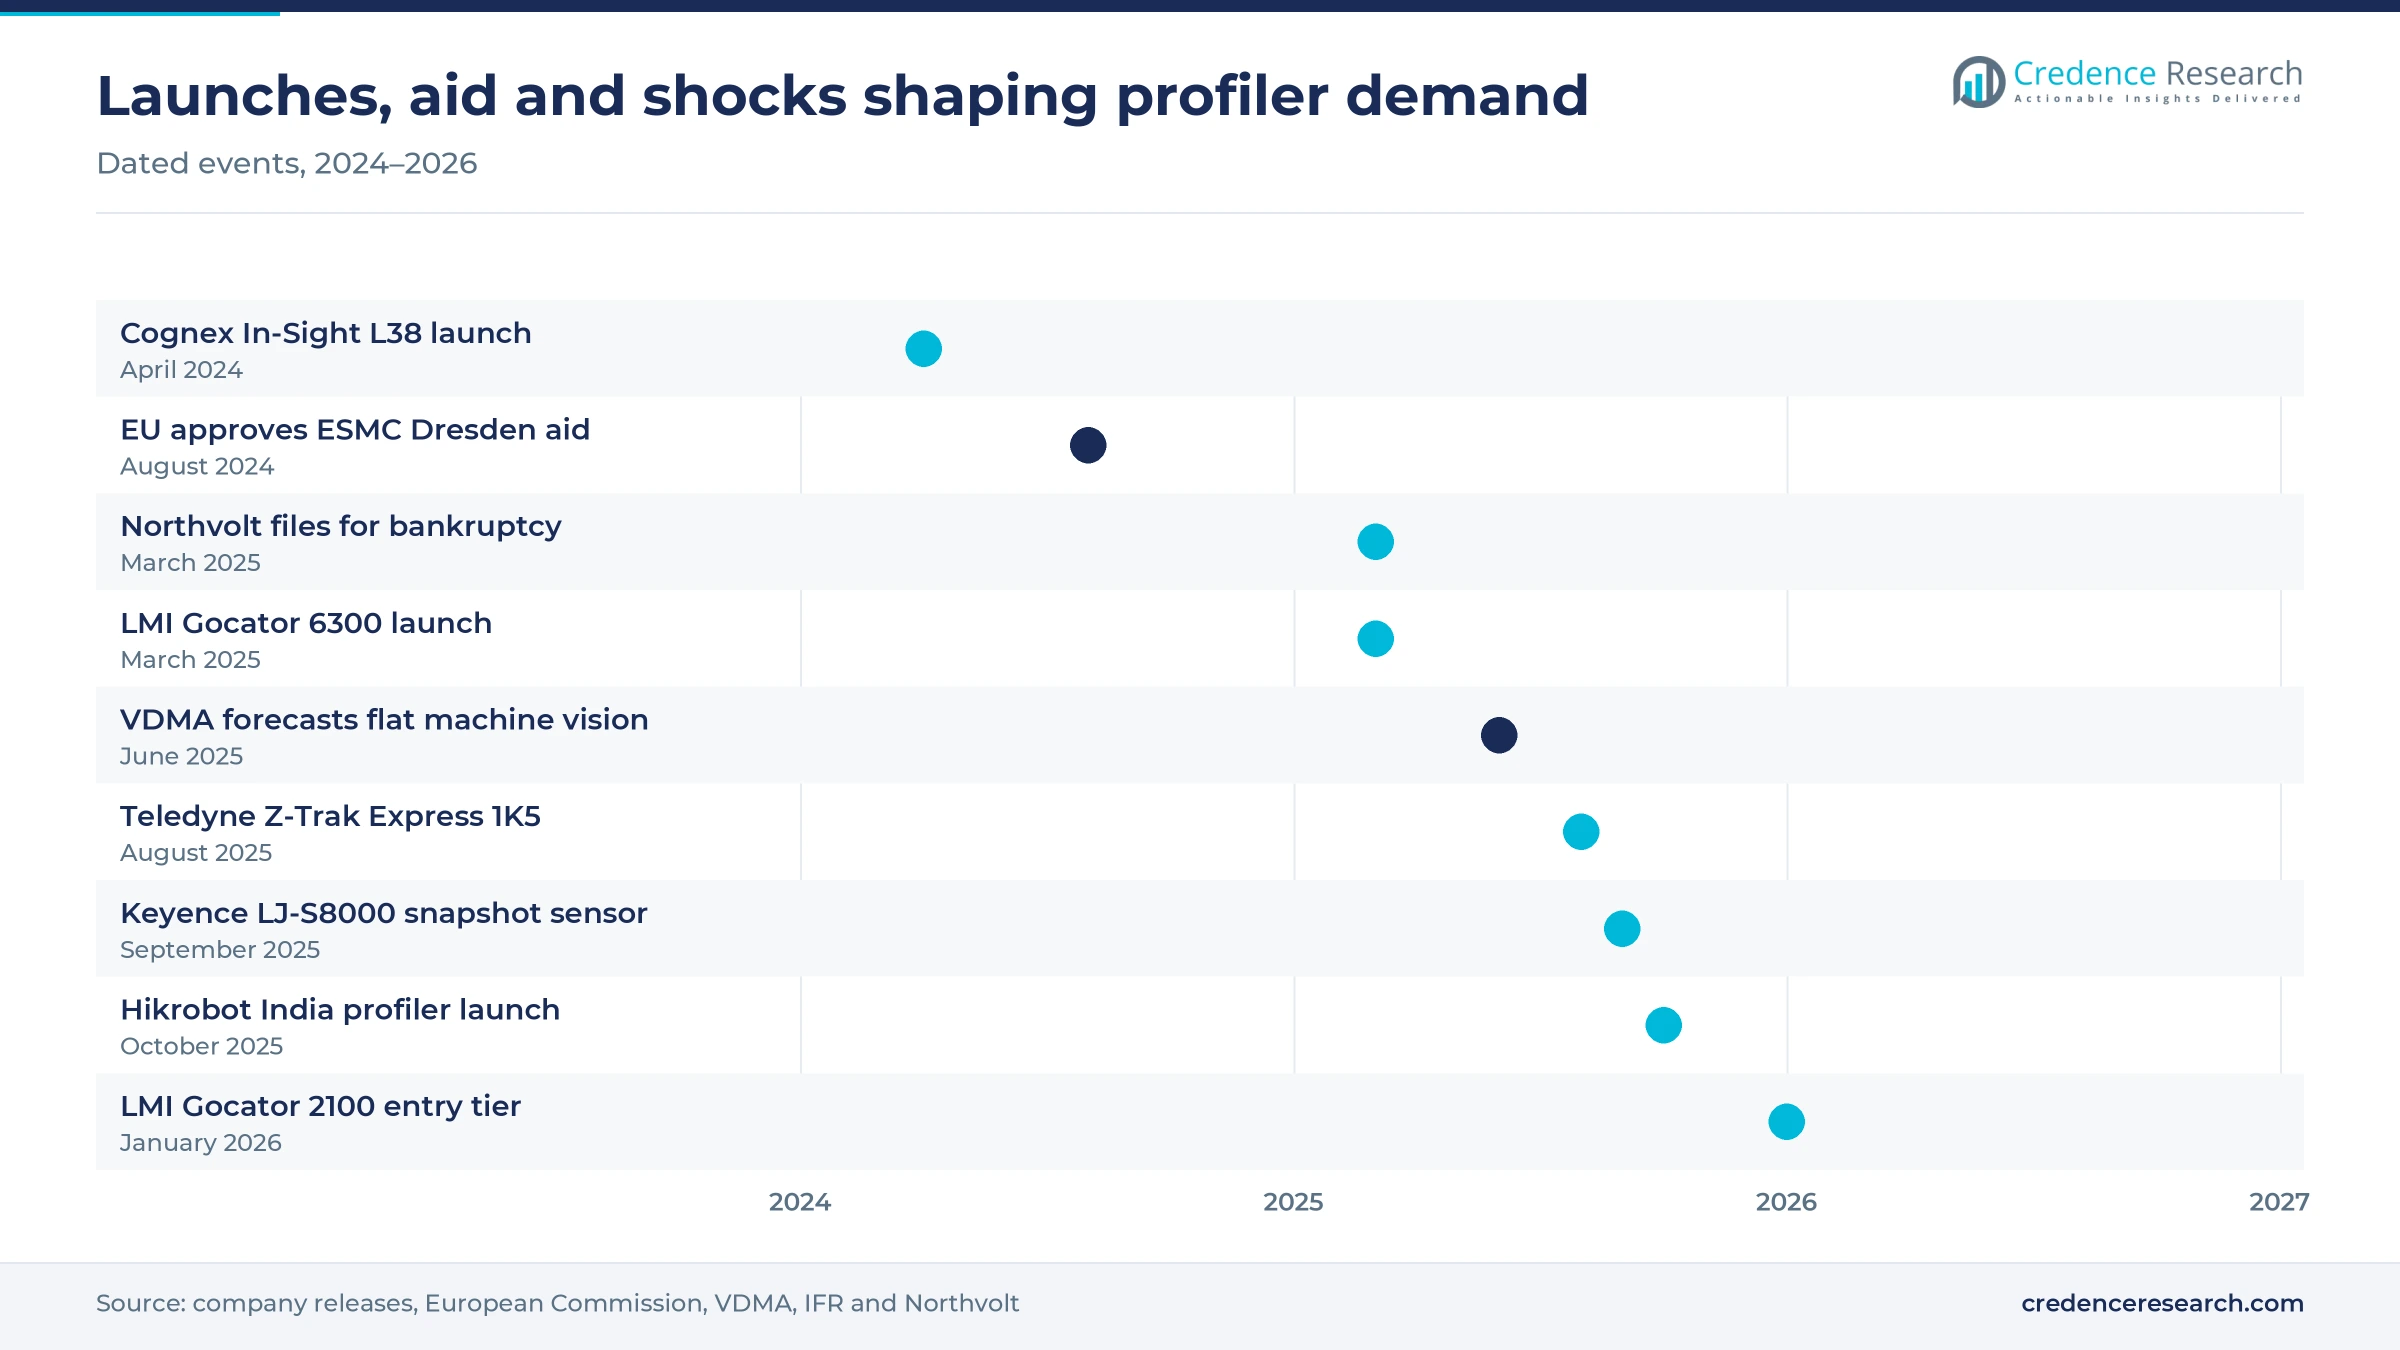
Vision suppliers are shifting toward sensors that combine rule-based 3D measurement with trained AI defect detection, to address defects that vary too much for fixed tolerances. Cognex launched the In-Sight L38 in April 2024, combining AI, 2D and 3D vision with laser optics, and said its AI tools can be set up with as few as 5 to 10 labeled images. Hikrobot says its 3D profile sensor launched in India in October 2025 runs spatial and time-domain filtering on board, so no external CPU is needed. This shift creates openings for smart profilers across cosmetic, weld and seal inspection, and it raises the value of software relative to optics.
Snapshot sensors with built-in scanning blur the category
Sensor makers are shifting toward heads that move the laser line internally, to address stations where the part cannot travel under a fixed line. Keyence introduced the LJ-S8000 3D laser snapshot sensor in September 2025, with motor-driven scanning, repeatability of 0.3 micrometers, imaging in as little as 0.2 seconds and fields of view up to 640 mm, without an external stage or encoder. Micro-Epsilon presented scanCONTROL scanners with a CMM trigger output in November 2025, with raw data transfer at up to 10 million points per second. These designs pull laser profiling into robot cells and metrology stations that used to need area cameras or tactile probes on coordinate measuring machines.
Wide-field, lower-cost profilers open bulk industries
Lower-cost, wide-field profilers create an opening in wood, logistics, tire and road applications, where buyers need millimeter rather than micrometer data across large parts. Teledyne launched the Z-Trak Express 1K5 in August 2025 as a cost-effective in-line profiler for lumber, logistics, secondary battery and automotive inspection. LMI followed in January 2026 with the entry-level Gocator 2100 series for part detection and simple geometry checks. TKH said its 3D vision business grew in wood processing in the Americas in 2025. Sawmills, parcel hubs and tire plants can now justify a profiler per conveyor instead of one per plant.
New fabs and electronics hubs outside China need inspection
New semiconductor fabs and electronics plants outside China open a greenfield opportunity for profiler suppliers, because every new line is specified from scratch. The European Commission approved EUR 5 billion of German aid in August 2024 for the ESMC fab in Dresden, a TSMC, Bosch, Infineon and NXP venture planned to reach full capacity of 480,000 wafers a year by 2029. India produced electronics worth Rs 11.3 lakh crore, about USD 127 billion, in 2024-25, according to IBEF citing government data. Suppliers that build local application teams early can win line standards in these new plants.
European capex, battery failures and price pressure
European automation spending has stalled
Weak capital spending in Europe limits demand for new inspection stations. The VDMA said in June 2025 that German robotics and automation sales would fall 10% to EUR 14.5 billion in 2025, while machine vision sales of about EUR 3.1 billion would show zero growth. German and Italian machine builders, a large channel for profilers, are the most exposed. Suppliers with high European sales shares must rely on retrofit and export projects until orders recover.
Battery project failures cancel planned lines
Battery projects outside China carry high execution risk, which can cancel profiler orders after design-in. Northvolt filed for bankruptcy in Sweden on March 12, 2025, which put the equipment orders of a flagship European cell maker in doubt. The IEA also noted that LGES cut capital spending to about USD 7.5 billion in 2025 from about USD 9 billion in 2024. Suppliers with large pipelines in European and U.S. gigafactories face delays when such projects stall or change chemistry.
Chinese competition compresses sensor prices
Lower-priced Chinese profilers compress prices on battery and electronics lines, where buyers order hundreds of identical stations. Hikrobot and SinceVision now market 3D laser profilers abroad, and the IEA reported that average battery prices fell 8% in 2025, which pushes cell makers to cut equipment costs further. Western and Japanese brands lose share on high-volume stations unless they prove lower total station cost, while integrators gain bargaining power.
Shiny and dark surfaces still limit accuracy
Reflective metal, transparent films and dark rubber scatter or absorb laser light, which causes missing points and false heights. LMI's newest high-end profilers needed redesigned optics and telecentric line generation to cope with reflective and curved surfaces, which shows the problem persists even at the top of the range. Hikrobot likewise built multi-exposure fusion and single-frame HDR into the sensor it launched in India in October 2025 to handle mixed-reflectivity parts. Buyers with mixed materials often need several heads or longer setup, which raises station cost and slows adoption in smaller plants.
Asia Pacific leads on battery and electronics output
| Region | Value, 2025 (USD million) | Share, 2025 | CAGR, 2026–2035 |
|---|---|---|---|
| Asia Pacific | 112.2 | 40.0% | 10.6% |
| North America | 75.8 | 27.0% | 9.1% |
| Europe | 67.3 | 24.0% | 8.7% |
| Latin America | 14.0 | 5.0% | 9.9% |
| Middle East & Africa | 11.2 | 4.0% | 10.2% |
Asia Pacific leads on batteries and electronics
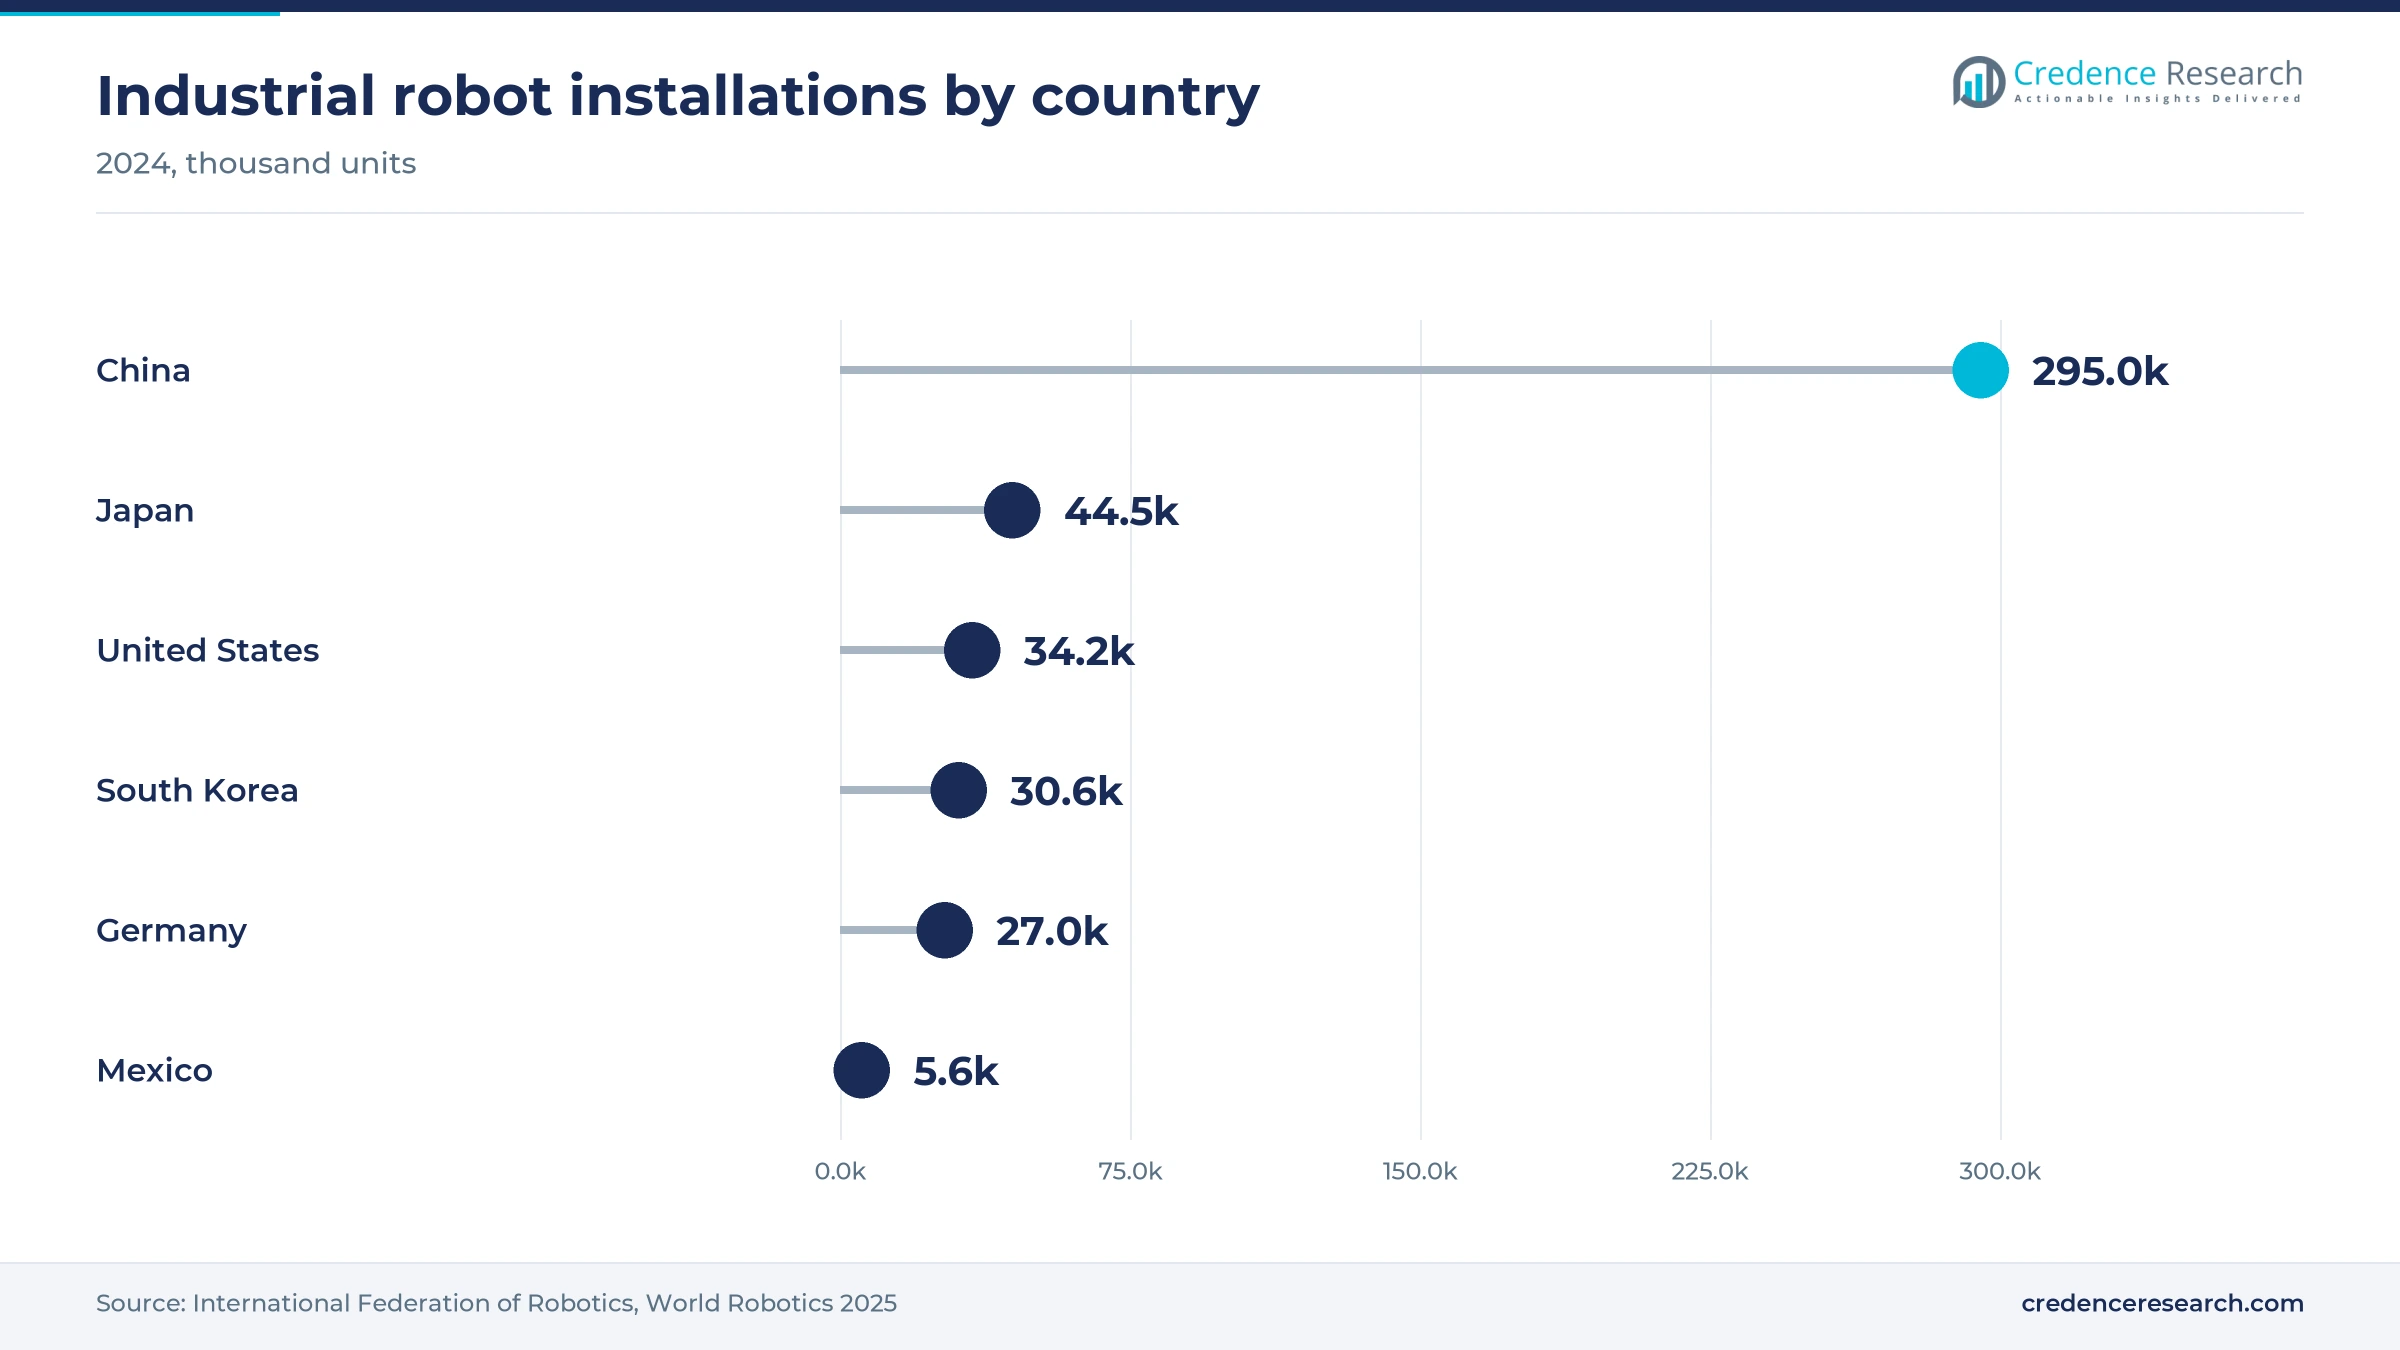
Asia Pacific held 40.0% of 2025 value and is the fastest-growing region at 10.6% a year. China installed 295,000 industrial robots in 2024 and holds over 80% of global battery cell capacity, as noted above. Japan installed 44,500 robots and Korea 30,600 in 2024, the IFR said, and both host leading sensor and electronics makers. Chinese suppliers such as Hikrobot and SinceVision compete hard on price in the region, so unit growth outpaces value growth.
North America grows on automotive and fab projects
North America held 27.0% of 2025 value and grows at 9.1% a year. The United States installed 34,200 industrial robots in 2024, according to the IFR, and the rebound in automotive OEM robot orders noted above supports body shop and battery tray stations. SEMI expects the Americas to spend about USD 60 billion on fab equipment for large wafers from 2026 to 2028. The IEA said more than 50 GWh of U.S. battery capacity was reallocated to LFP in 2025, which forces line changes and new inspection setups.
Europe holds precision demand despite weak capex
Europe held 24.0% of 2025 value and grows at 8.7% a year, the slowest pace, because the machine-building slowdown noted in the challenges limits new stations. Germany, the largest source of regional demand, installed 26,982 robots in 2024, the most in Europe, according to the IFR. The ESMC fab in Dresden and premium automotive plants keep demand for micron-level profilers alive, and European suppliers such as SICK, Micro-Epsilon, wenglor and Baumer keep design and production in the region.
Latin America depends on Mexican automotive lines
Latin America held 5.0% of 2025 value and grows at 9.9% a year. Mexico installed 5,600 robots in 2024, down 4%, with the automotive industry taking a 63% share, the IFR reported. Profiler demand therefore follows vehicle and parts programs in Mexico and Brazil. No public statistic on regional sensor shipments was found, so this share is a Credence Research estimate with a wider error band.
Middle East & Africa starts from a small base
Middle East & Africa held 4.0% of 2025 value and grows at 10.2% a year, with demand from packaging, metals, food and a few automotive assembly plants in Turkey, South Africa and the Gulf. No official statistic on profiler or machine vision sales in the region was found, so the share rests on Credence Research estimates from industrial output and robot use.
Launches widen both the high-end and entry tiers
| Development | Status and market relevance |
|---|---|
| In August 2025, Teledyne launched the Z-Trak Express 1K5 profiler with up to 5,000 profiles per second and a 1,700 mm field of view. | Commercial launch; it addresses cost-sensitive wood, logistics, battery and automotive body inspection. |
| In September 2025, Keyence introduced the LJ-S8000 3D laser snapshot sensor with built-in motor-driven scanning. | Commercial launch; it removes the external stage and encoder from static and robot-mounted inspection. |
| In October 2025, Hikrobot launched its blue-laser 3D laser profile sensor in India for electronics, lithium battery and PCB plants. | Market entry and launch; it brings a Chinese price point to Indian electronics and battery lines. |
| In January 2026, LMI Technologies introduced the entry-level Gocator 2100 series for part detection and simple geometry inspection. | Commercial launch; it answers low-cost competition with a cheaper tier of smart sensors. |
Blue lasers, scheimpflug optics and on-sensor tools
- Blue 405 nm lasers scatter less on hot, shiny and organic surfaces than red lasers, so they suit battery foils, metal parts and electronics.
- Scheimpflug optics and telecentric line generation keep the whole laser line in focus and reduce occlusion, which helps on tall features and small defects.
- On-sensor measurement tools run height, gap, volume and flatness checks inside the head, so many stations no longer need a separate vision PC.
- High-speed imagers and multi-head alignment lift profile rates into tens of kilohertz and let several heads build one 360-degree point cloud.
Need a Custom Version of This Report?
Tailor the scope, geography, or segments to your exact requirements.
- Custom geography or segment scope
- Direct access to our analyst team
Keyence and LMI face fast-rising Chinese suppliers
Competition turns on resolution, speed, software and application support, because buyers choose a profiler for a specific station and rarely change it. Keyence sells direct through its own engineers and covers both line profilers and snapshot sensors. LMI, part of TKH Group, focuses on smart Gocator sensors from entry-level to micron-class heads. Cognex ties 3D heads to its In-Sight and AI software, while SICK and Teledyne DALSA supply 3D streaming cameras to integrators. Micro-Epsilon, wenglor and Baumer compete on compact sensors for machine builders. Hikrobot and SinceVision push hard on price in battery and electronics plants. Hexagon and ZEISS supply laser line heads for portable metrology. Wider machine vision suppliers increasingly bundle 3D heads with cameras, lighting and software.
How concentrated is supply of laser line profilers?
Supply is moderately concentrated, with Keyence and LMI Technologies leading smart profilers and Cognex, SICK, Teledyne DALSA, Micro-Epsilon, wenglor and Baumer holding strong niches. Chinese suppliers such as Hikrobot and SinceVision have grown quickly on domestic battery and electronics lines. Entry barriers sit in optics, imager design, calibration and application software, not in the laser itself. Margins are highest on micron-level heads and software tools sold through direct engineering teams, while wide-field red-laser sensors trade closer to commodity pricing through distributors.
Companies profiled and their roles in this market
| Company | Type | Role in the market |
|---|---|---|
| Keyence Corporation | Sensor and vision supplier | LJ-X line profilers and LJ-S8000 snapshot sensors sold direct |
| LMI Technologies (TKH Group) | Smart 3D sensor specialist | Gocator smart laser line profilers from entry-level to micron class |
| Cognex Corporation | Machine vision supplier | In-Sight L38 and 3D displacement sensors with AI tools |
| SICK AG | Sensor and automation supplier | Ruler3000 and Ranger3 3D streaming cameras for integrators |
| Micro-Epsilon | Precision sensor specialist | scanCONTROL laser profile scanners for inline and CMM use |
| Teledyne DALSA (Teledyne Technologies) | Imaging supplier | Z-Trak2 and Z-Trak Express 3D laser profilers |
| wenglor sensoric | Sensor supplier | weCat3D 2D/3D profile sensors including weld seam models |
| Baumer Group | Sensor supplier | OX series 2D/3D profile sensors for machine builders |
| Hikrobot | Machine vision supplier | Blue-laser 3D profile sensors for electronics and battery lines |
| SinceVision | 3D sensor specialist | 3D laser profilers and displacement sensors for battery plants |
| Hexagon AB | Metrology supplier | Absolute Scanner AS1 laser line scanners for arms and trackers |
| ZEISS Industrial Quality Solutions | Metrology supplier | T-SCAN hawk 2 handheld laser scanners for portable inspection |
Value shifts toward software and micron accuracy
Credence Research's view is that value in the 3D laser line profiler market is moving toward micron-level accuracy and software, while basic red-laser profiling becomes a price-led product. Battery and semiconductor lines will absorb most new premium heads, and robot guidance will add the most new stations. Suppliers that combine on-sensor tools, AI defect detection and strong application engineering can defend prices against Chinese competition. The weakest position belongs to suppliers selling only generic sensors through distributors into European machine building.
Earlier estimate rebased to 2025 and tested bottom-up
The report uses 2025 as the base year and 2026 to 2035 as the forecast period. The earlier Credence Research estimate was rebased to 2025 with its own growth rate and then tested against a bottom-up model of unit demand and distributor list prices, which supported the converted value. The value sits below several published estimates, because this scope excludes vision software, integration and complete inspection systems, and the unit shipments of Chinese suppliers, which no public statistic reports, are the least certain input. All regional and segment splits shown in this report are Credence Research estimates. Sources used include the IFR, the IEA, SEMI, the European Commission, the VDMA, the Association for Advancing Automation, company releases, distributor listings and trade press. No interviews or surveys were conducted for this edition of the study.
Battery and semiconductor capex set the 2035 path
Through 2035, the 3D laser line profiler market should grow at 9.67% a year as battery, semiconductor, electronics and automotive plants move dimensional checks inline and as robots take on more guided welding and picking. Asia Pacific will keep the largest and fastest-growing value pool, while North America and Europe depend on new fabs, EV platforms and retrofits. Prices on standard sensors should keep falling, which lifts unit volume faster than value. Battery overcapacity and European machine-building demand remain the main swing factors.
Battery and chip capex set the range of outcomes
The outcome to 2035 depends mainly on how steadily battery and semiconductor capacity keeps expanding and how far Chinese price competition pulls down average selling prices. Steady fab and robot investment with moderate price erosion holds the base case. A longer battery overcapacity cycle and weak European machine building would slow value growth, while fast AI inspection adoption and new fabs in India, Europe and the United States would lift it.
| Scenario | CAGR, 2026–2035 | Value, 2035 | What has to hold |
|---|---|---|---|
| Downside | 7.7% | USD 598.4 million | Battery overcapacity delays lines and Chinese price cuts outpace volume growth |
| Base | 9.67% | USD 706.3 million | Fab, battery and robot investment grow steadily with moderate price erosion |
| Upside | 11.5% | USD 817.7 million | New fabs outside China and AI inspection push profilers into more stations |
Frequently Asked Questions
How big is the 3D laser profiler market?
How does 3D laser profile measurement work?
How is a 3D snapshot sensor different from a line profiler?
Which region leads the market?
Which manufacturers lead in 2D/3D laser profile sensors?
What does a 2D/3D laser profiler cost to own?
Which application grows fastest?
What are the main risks for suppliers?
Table of Content
Chapter 1 Market Segmentation
- 1.1 Segmentation Framework
- 1.1.1 Product and Service Classification
- 1.1.2 Application and End-Use Classification
- 1.1.3 Technology and Solution Classification
- 1.1.4 Customer and Distribution Channel Classification
- 1.1.5 Geographic Segmentation
- 1.1.6 Market Segment Definitions and Boundaries
- 1.2 By Product Type
- 1.2.1 Fixed 3D Laser Line Profilers
- 1.2.2 Portable 3D Laser Line Profilers
- 1.3 By Application
- 1.3.1 Quality Control and Inspection
- 1.3.2 Industrial Automation
- 1.3.3 Production and Assembly
- 1.3.4 Research and Development
- 1.4 By End User
- 1.4.1 Automotive and EV Battery
- 1.4.2 Electronics and Semiconductors
- 1.4.3 Consumer Goods
- 1.4.4 Aerospace
- 1.4.5 Others
Chapter 2 Introduction
- 2.1 Report Objectives and Scope
- 2.2 Product Definition and Industry Terminology
- 2.3 Market Inclusions and Exclusions
- 2.4 Research Process
- 2.4.1 Primary Research and Expert Interviews
- 2.4.2 Secondary Research and Source Review
- 2.4.3 Top-Down and Bottom-Up Estimation
- 2.4.4 Data Triangulation and Verification
- 2.5 Market Size Measurement Basis
- 2.5.1 2025: USD 280.6 million → 2035: USD 706.3 million
- 2.6 Historical and Forecast Reference Periods
- 2.6.1 Historical Period: 2018-2025
- 2.6.2 Base Year: 2025
- 2.6.3 Forecast Period: 2025-2035
- 2.7 Research Assumptions and Limitations
Chapter 3 Executive Summary
- 3.1 Market Snapshot and Key Findings
- 3.2 Base-Year Market Size, 2025
- 3.3 Forecast Market Size, 2035
- 3.4 Revenue and Volume Growth Outlook
- 3.5 Key Demand and Supply Indicators
- 3.6 Leading Market Segments
- 3.7 Fastest-Growing Market Opportunities
- 3.8 Regional Performance Highlights
- 3.9 Technology and Industry Transformation
- 3.10 Competitive Landscape Summary
- 3.11 Analyst View and Strategic Implications
Chapter 4 Global 3D Laser Line Profiler Market Trends and Developments
- 4.1 Historical Industry Development, 2018-2025
- 4.2 Recent Market Trends and Developments
- 4.3 Demand and Customer Behavior Trends
- 4.4 Technology and Product Innovation
- 4.5 Artificial Intelligence, Automation and Digitalization
- 4.6 Local Manufacturing and Supply Chain Realignment
- 4.7 Industry Partnerships, Mergers and Acquisitions
- 4.8 Sustainability and Circular Economy Developments
- 4.9 Government and Private Sector Investment Trends
- 4.10 Emerging Business Models and Commercialization
- 4.11 Industry Developments and Announcements
Chapter 5 Global 3D Laser Line Profiler Market Production, Supply and Demand Analysis
- 5.1 Demand Trend and Consumption Analysis, 2018-2025
- 5.2 Demand Forecast, 2025-2035
- 5.3 Production and Output Trend, 2018-2025
- 5.4 Production and Output Forecast, 2025-2035
- 5.5 Installed Capacity and Capacity Utilization
- 5.6 Company-Wise Production Plants and Statistics
- 5.6.1 Installed Production Capacity
- 5.6.2 Actual Production
- 5.6.3 Planned Capacity and Expansion Targets
- 5.7 Supply Chain Structure and Procurement Trends
- 5.8 Supply-Demand Gap and Bottlenecks
- 5.9 Import Dependence and Sourcing Structure
- 5.10 Contract Manufacturing and Outsourcing
- 5.11 Regional Supply and Demand Concentration
Chapter 6 Global 3D Laser Line Profiler Market Pricing Analysis
- 6.1 Pricing Structure and Measurement
- 6.2 Historical Pricing Trends, 2018-2025
- 6.3 Pricing Outlook, 2025-2035
- 6.4 Average Selling Price and Unit Economics
- 6.5 Pricing by Product and Market Segment
- 6.6 Geographic Pricing Differences
- 6.7 Key Input, Energy, Labor and Logistics Costs
- 6.8 Contract Pricing and Purchasing Models
- 6.9 Pricing Sensitivity and Competitive Positioning
- 6.10 Price, Margin and Profitability Implications
Chapter 7 Global 3D Laser Line Profiler Market Dynamics
- 7.1 Market Growth Drivers
- 7.1.1 Demand-Side Drivers
- 7.1.2 Technology and Innovation Drivers
- 7.1.3 Infrastructure and Investment Drivers
- 7.1.4 Regulatory and Policy Drivers
- 7.2 Market Restraints
- 7.2.1 Cost and Affordability Constraints
- 7.2.2 Technology and Adoption Barriers
- 7.2.3 Supply Chain and Operational Constraints
- 7.3 Market Challenges
- 7.3.1 Competitive Pressure and Margin Erosion
- 7.3.2 Skills, Infrastructure and Implementation Gaps
- 7.4 Emerging Market Opportunities
- 7.5 Market Dynamics Impact and Time-Horizon Assessment
Chapter 8 Global 3D Laser Line Profiler Value Chain Analysis
- 8.1 Industry Value Chain Overview
- 8.2 Upstream Suppliers and Critical Inputs
- 8.3 Technology and Component Providers
- 8.4 Manufacturing or Service Delivery
- 8.5 Distribution, Channel Partners and Integrators
- 8.6 Downstream Applications and End Users
- 8.7 Value Addition and Profit Pools
- 8.8 Vertical Integration and Outsourcing
- 8.9 Supplier Concentration and Risk
- 8.10 Supply Chain Localization and Resilience
Chapter 9 Global 3D Laser Line Profiler Market Regulations and Policies
- 9.1 Relevant Laws, Standards and Compliance Frameworks
- 9.2 Product, Service, Safety and Quality Requirements
- 9.3 Government Policies, Incentives and Subsidies
- 9.4 Imports, Exports and Trade Barriers
- 9.5 Public Procurement and Local Content Requirements
- 9.6 Environmental and Sustainability Compliance
- 9.7 Data Protection, AI and Cybersecurity Compliance
- 9.8 Upcoming Policy Changes and Market Implications
Chapter 10 Global 3D Laser Line Profiler Market Hotspots and Opportunities
- 10.1 Market Opportunity Mapping and Growth Hotspots
- 10.2 High-Growth Applications and Customer Groups
- 10.3 Underserved Markets and White-Space Opportunities
- 10.4 Emerging Technology and Product Opportunities
- 10.5 New Capacity and Investment Hotspots
- 10.6 Market Entry and Expansion Opportunities
- 10.7 Distribution and Partnership Opportunities
- 10.8 Near-Term and Long-Term Commercial Potential
- 10.9 Opportunity Attractiveness and Execution Risks
Chapter 11 Global 3D Laser Line Profiler Market Outlook, 2025-2035
- 11.1 Market Size and Analysis
- 11.1.1 Revenue (Market Measurement: 2025: USD 280.6 million → 2035: USD 706.3 million)
- 11.1.2 Market Volume and Quantity Sold
- 11.1.3 Historical Market Size, 2018-2025
- 11.1.4 Base-Year Market Size, 2025
- 11.2 Market Forecast, 2025-2035
- 11.2.1 Revenue Forecast to 2035
- 11.2.2 Volume Forecast to 2035
- 11.2.3 CAGR and Year-on-Year Growth
- 11.2.4 Incremental Revenue Opportunity
- 11.3 Forecast Assumptions and Scenario Analysis
- 11.3.1 Base-Case Forecast
- 11.3.2 Optimistic and Conservative Scenarios
- 11.3.3 Technology, Pricing and Policy Sensitivities
- 11.4 Market Attractiveness and Growth Outlook
Chapter 12 Global 3D Laser Line Profiler Market Segmentation and Outlook
- 12.1 Segmentation Summary and Market Shares, 2025
- 12.2 Largest and Fastest-Growing Segments
- 12.3 By Product Type - Market Size and Forecast, 2025-2035
- 12.3.1 Segment Definition and Scope
- 12.3.2 Historical Market Size, 2018-2025
- 12.3.3 Revenue Forecast, 2025-2035
- 12.3.4 Volume Forecast, 2025-2035
- 12.3.5 Base-Year Market Share, 2025
- 12.3.6 Segment CAGR and Growth Drivers
- 12.3.7 Subsegment Market Size and Forecast
- 12.3.7.1 Fixed 3D Laser Line Profilers
- 12.3.7.2 Portable 3D Laser Line Profilers
- 12.3.8 Subsegment Pricing and Adoption Trends
- 12.3.9 Leading Suppliers and Competition
- 12.3.10 Regional Demand and Opportunities
- 12.4 By Application - Market Size and Forecast, 2025-2035
- 12.4.1 Segment Definition and Scope
- 12.4.2 Historical Market Size, 2018-2025
- 12.4.3 Revenue Forecast, 2025-2035
- 12.4.4 Volume Forecast, 2025-2035
- 12.4.5 Base-Year Market Share, 2025
- 12.4.6 Segment CAGR and Growth Drivers
- 12.4.7 Subsegment Market Size and Forecast
- 12.4.7.1 Quality Control and Inspection
- 12.4.7.2 Industrial Automation
- 12.4.7.3 Production and Assembly
- 12.4.7.4 Research and Development
- 12.4.8 Subsegment Pricing and Adoption Trends
- 12.4.9 Leading Suppliers and Competition
- 12.4.10 Regional Demand and Opportunities
- 12.5 By End User - Market Size and Forecast, 2025-2035
- 12.5.1 Segment Definition and Scope
- 12.5.2 Historical Market Size, 2018-2025
- 12.5.3 Revenue Forecast, 2025-2035
- 12.5.4 Volume Forecast, 2025-2035
- 12.5.5 Base-Year Market Share, 2025
- 12.5.6 Segment CAGR and Growth Drivers
- 12.5.7 Subsegment Market Size and Forecast
- 12.5.7.1 Automotive and EV Battery
- 12.5.7.2 Electronics and Semiconductors
- 12.5.7.3 Consumer Goods
- 12.5.7.4 Aerospace
- 12.5.7.5 Others
- 12.5.8 Subsegment Pricing and Adoption Trends
- 12.5.9 Leading Suppliers and Competition
- 12.5.10 Regional Demand and Opportunities
- 12.6 Segment Growth Comparison
- 12.7 Segment Attractiveness and Priority Matrix
Chapter 13 Global 3D Laser Line Profiler End-Use and Application Market Outlook
- 13.1 End-Use Industry and Customer Demand Structure
- 13.2 Leading Applications and Customer Groups
- 13.3 End-Use Market Size, Share and Forecast
- 13.4 Major End-Use Industry Deep Dives
- 13.4.1 Customer Requirements and Use Cases
- 13.4.2 Demand and Replacement Cycles
- 13.4.3 Technical and Regulatory Considerations
- 13.4.4 Purchasing and Procurement Models
- 13.4.5 Leading Vendors and Distribution Channels
- 13.4.6 Forecast and Commercial Opportunities
- 13.5 Emerging Applications and Cross-Segment Demand
- 13.6 End-Use Industry Investment Priorities
Chapter 14 Global 3D Laser Line Profiler Geographic Market Outlook, 2025-2035
- 14.1 Regional Market Size and Share, 2025
- 14.2 Regional Market Forecast, 2025-2035
- 14.3 Regional Pricing, Production and Demand Differences
- 14.4 North America
- 14.4.1 United States
- 14.4.2 Canada
- 14.4.3 Mexico
- 14.5 Europe
- 14.5.1 Germany
- 14.5.2 France
- 14.5.3 Italy
- 14.5.4 United Kingdom
- 14.5.5 Spain
- 14.5.6 Poland
- 14.5.7 Russia
- 14.5.8 Netherlands
- 14.5.9 Belgium
- 14.5.10 Sweden
- 14.5.11 Denmark
- 14.5.12 Norway
- 14.5.13 Rest of Europe
- 14.6 Asia Pacific
- 14.6.1 China
- 14.6.2 India
- 14.6.3 Japan
- 14.6.4 South Korea
- 14.6.5 Thailand
- 14.6.6 Indonesia
- 14.6.7 Vietnam
- 14.6.8 Malaysia
- 14.6.9 Australia
- 14.6.10 Rest of Asia Pacific
- 14.7 Latin America
- 14.7.1 Brazil
- 14.7.2 Argentina
- 14.7.3 Colombia
- 14.7.4 Chile
- 14.7.5 Rest of Latin America
- 14.8 Middle East
- 14.8.1 Saudi Arabia
- 14.8.2 United Arab Emirates
- 14.8.3 Turkey
- 14.8.4 Israel
- 14.8.5 Iran
- 14.8.6 Rest of the Middle East
- 14.9 Africa
- 14.9.1 South Africa
- 14.9.2 Egypt
- 14.9.3 Nigeria
- 14.9.4 Morocco
- 14.9.5 Rest of Africa
- 14.10 Regional Investment, Policy and Supply Chain Differences
- 14.11 Regional Competitive Landscape
- 14.12 Geographic Growth Hotspots
Chapter 15 Global 3D Laser Line Profiler Technology, Innovation and Sustainability Outlook
- 15.1 Technology Landscape and Maturity
- 15.2 Product, Process and Service Innovation
- 15.3 AI, Automation and Digital Tools in the Industry
- 15.4 Technology Adoption and Performance Benchmarking
- 15.5 Innovation Pipeline and R&D Investment
- 15.6 Patent and Intellectual Property Trends
- 15.7 Energy Efficiency and Resource Management
- 15.8 Sustainability, Recycling and Circularity
- 15.9 Technology Roadmap, 2025-2035
- 15.10 Risks of Obsolescence and Technology Substitution
Chapter 16 Global 3D Laser Line Profiler Market Key Strategic Imperatives
- 16.1 Growth and Market Entry Priorities
- 16.2 High-Return Products and Segments
- 16.3 Pricing, Profitability and Cost Optimization
- 16.4 Technology Investment and Product Differentiation
- 16.5 Supply Chain Localization and Resilience
- 16.6 Distribution and Customer Acquisition
- 16.7 Partnership, Acquisition and Capacity Strategy
- 16.8 Regional Expansion Priorities
- 16.9 Short-, Medium- and Long-Term Actions
Chapter 17 Competition Outlook
- 17.1 Industry Competition Characteristics
- 17.2 Market Structure and Concentration
- 17.3 Market Share and Competitive Positioning, 2025
- 17.4 Company-Wise Revenue and Product Benchmarking
- 17.5 Production and Service Capacity Benchmarking
- 17.6 Technology, Pricing and Differentiation
- 17.7 Regional Footprint and Distribution Strength
- 17.8 Mergers, Acquisitions and Strategic Alliances
- 17.9 New Entrants and Competitive Threats
- 17.10 Porter's Five Forces and Industry Attractiveness
- 17.11 Competitive Outlook, 2025-2035
Chapter 18 Company Profiles
- 18.1 Company Coverage and Selection Criteria
- 18.2 Keyence Corporation
- 18.2.1 Business Description
- 18.2.2 Company Ownership and Geographic Presence
- 18.2.3 Product and Service Portfolio
- 18.2.4 Manufacturing and Operating Footprint
- 18.2.5 Production Capacity and Expansion Plans
- 18.2.6 Financial Performance and Investment
- 18.2.7 Market Share and Competitive Position
- 18.2.8 Technology and Innovation Capabilities
- 18.2.9 Strategic Alliances or Partnerships
- 18.2.10 Recent Developments
- 18.2.11 Growth Strategy and Outlook
- 18.3 LMI Technologies (TKH Group)
- 18.4 Cognex Corporation
- 18.5 SICK AG
- 18.6 Micro-Epsilon
- 18.7 Teledyne DALSA (Teledyne Technologies)
- 18.8 wenglor sensoric
- 18.9 Baumer Group
- 18.10 Hikrobot
- 18.11 SinceVision
- 18.12 Hexagon AB
- 18.13 ZEISS Industrial Quality Solutions
- 18.14 Other Relevant Market Participants
Note: Every listed company is profiled on the structure shown under the first company. The company list is preliminary and may change based on research findings, market developments, data availability and client requirements.
Chapter 19 Disclaimer
- 19.1 Research and Forecast Disclaimer
- 19.2 Data Source and Estimation Limitations
Note: The depth of individual sections depends on data availability for this market. Volume, capacity, trade and other unit-based metrics are included where applicable.

