
Hazardous-area safety spending follows gas and plant builds
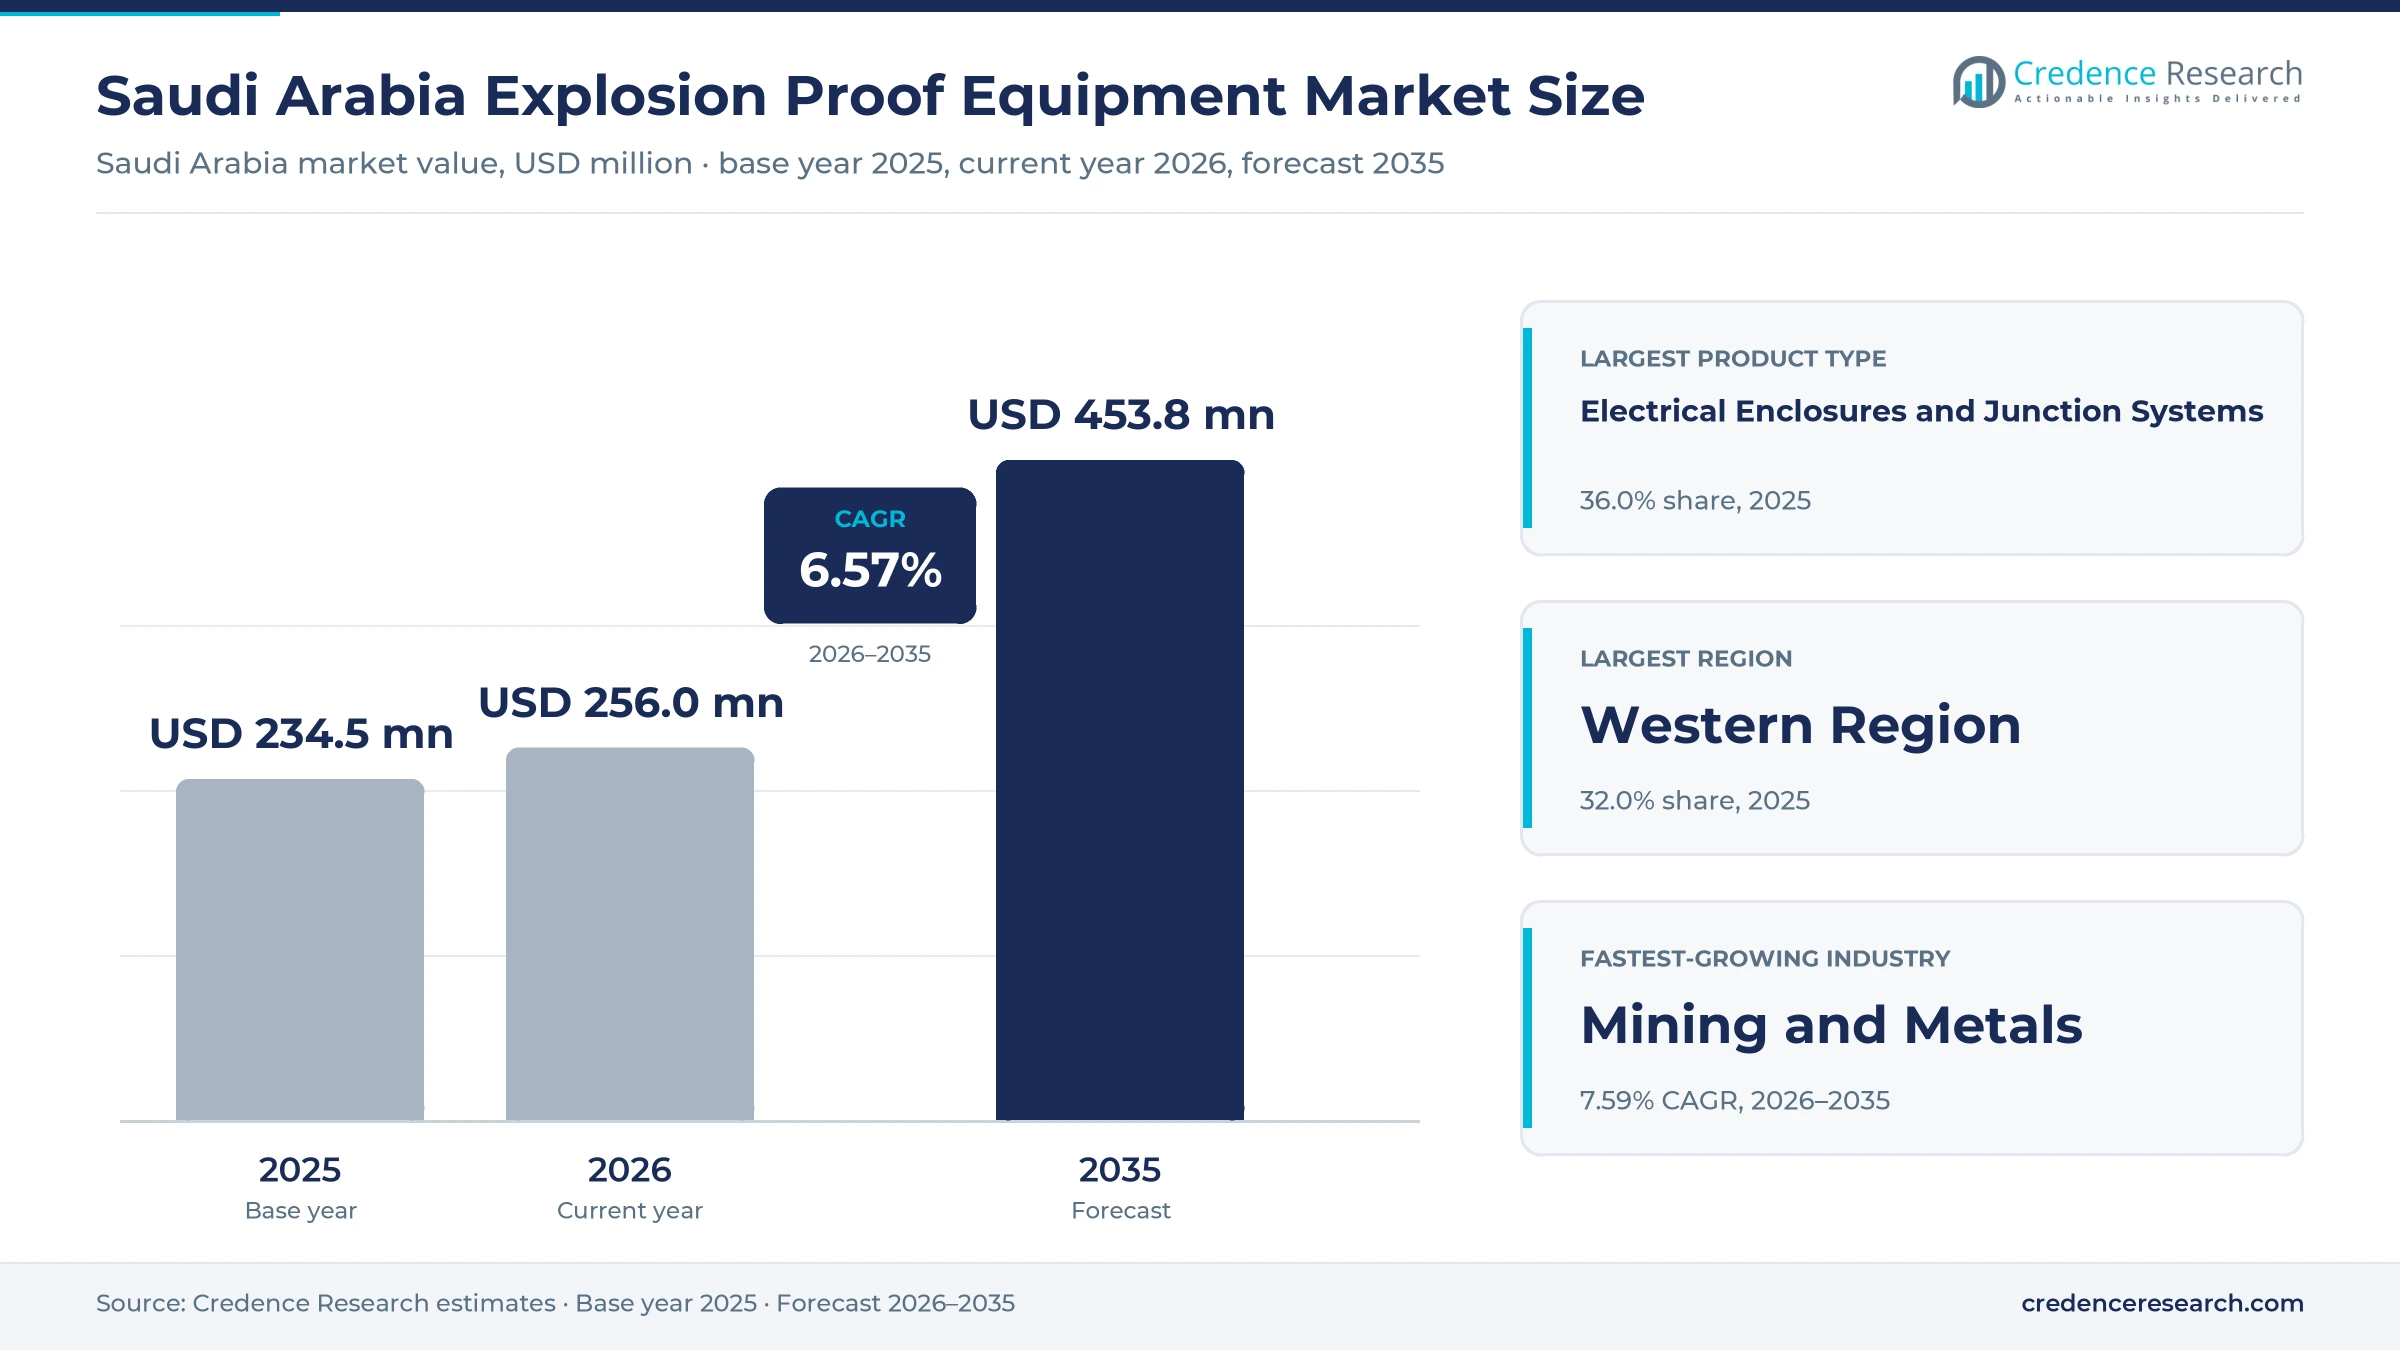
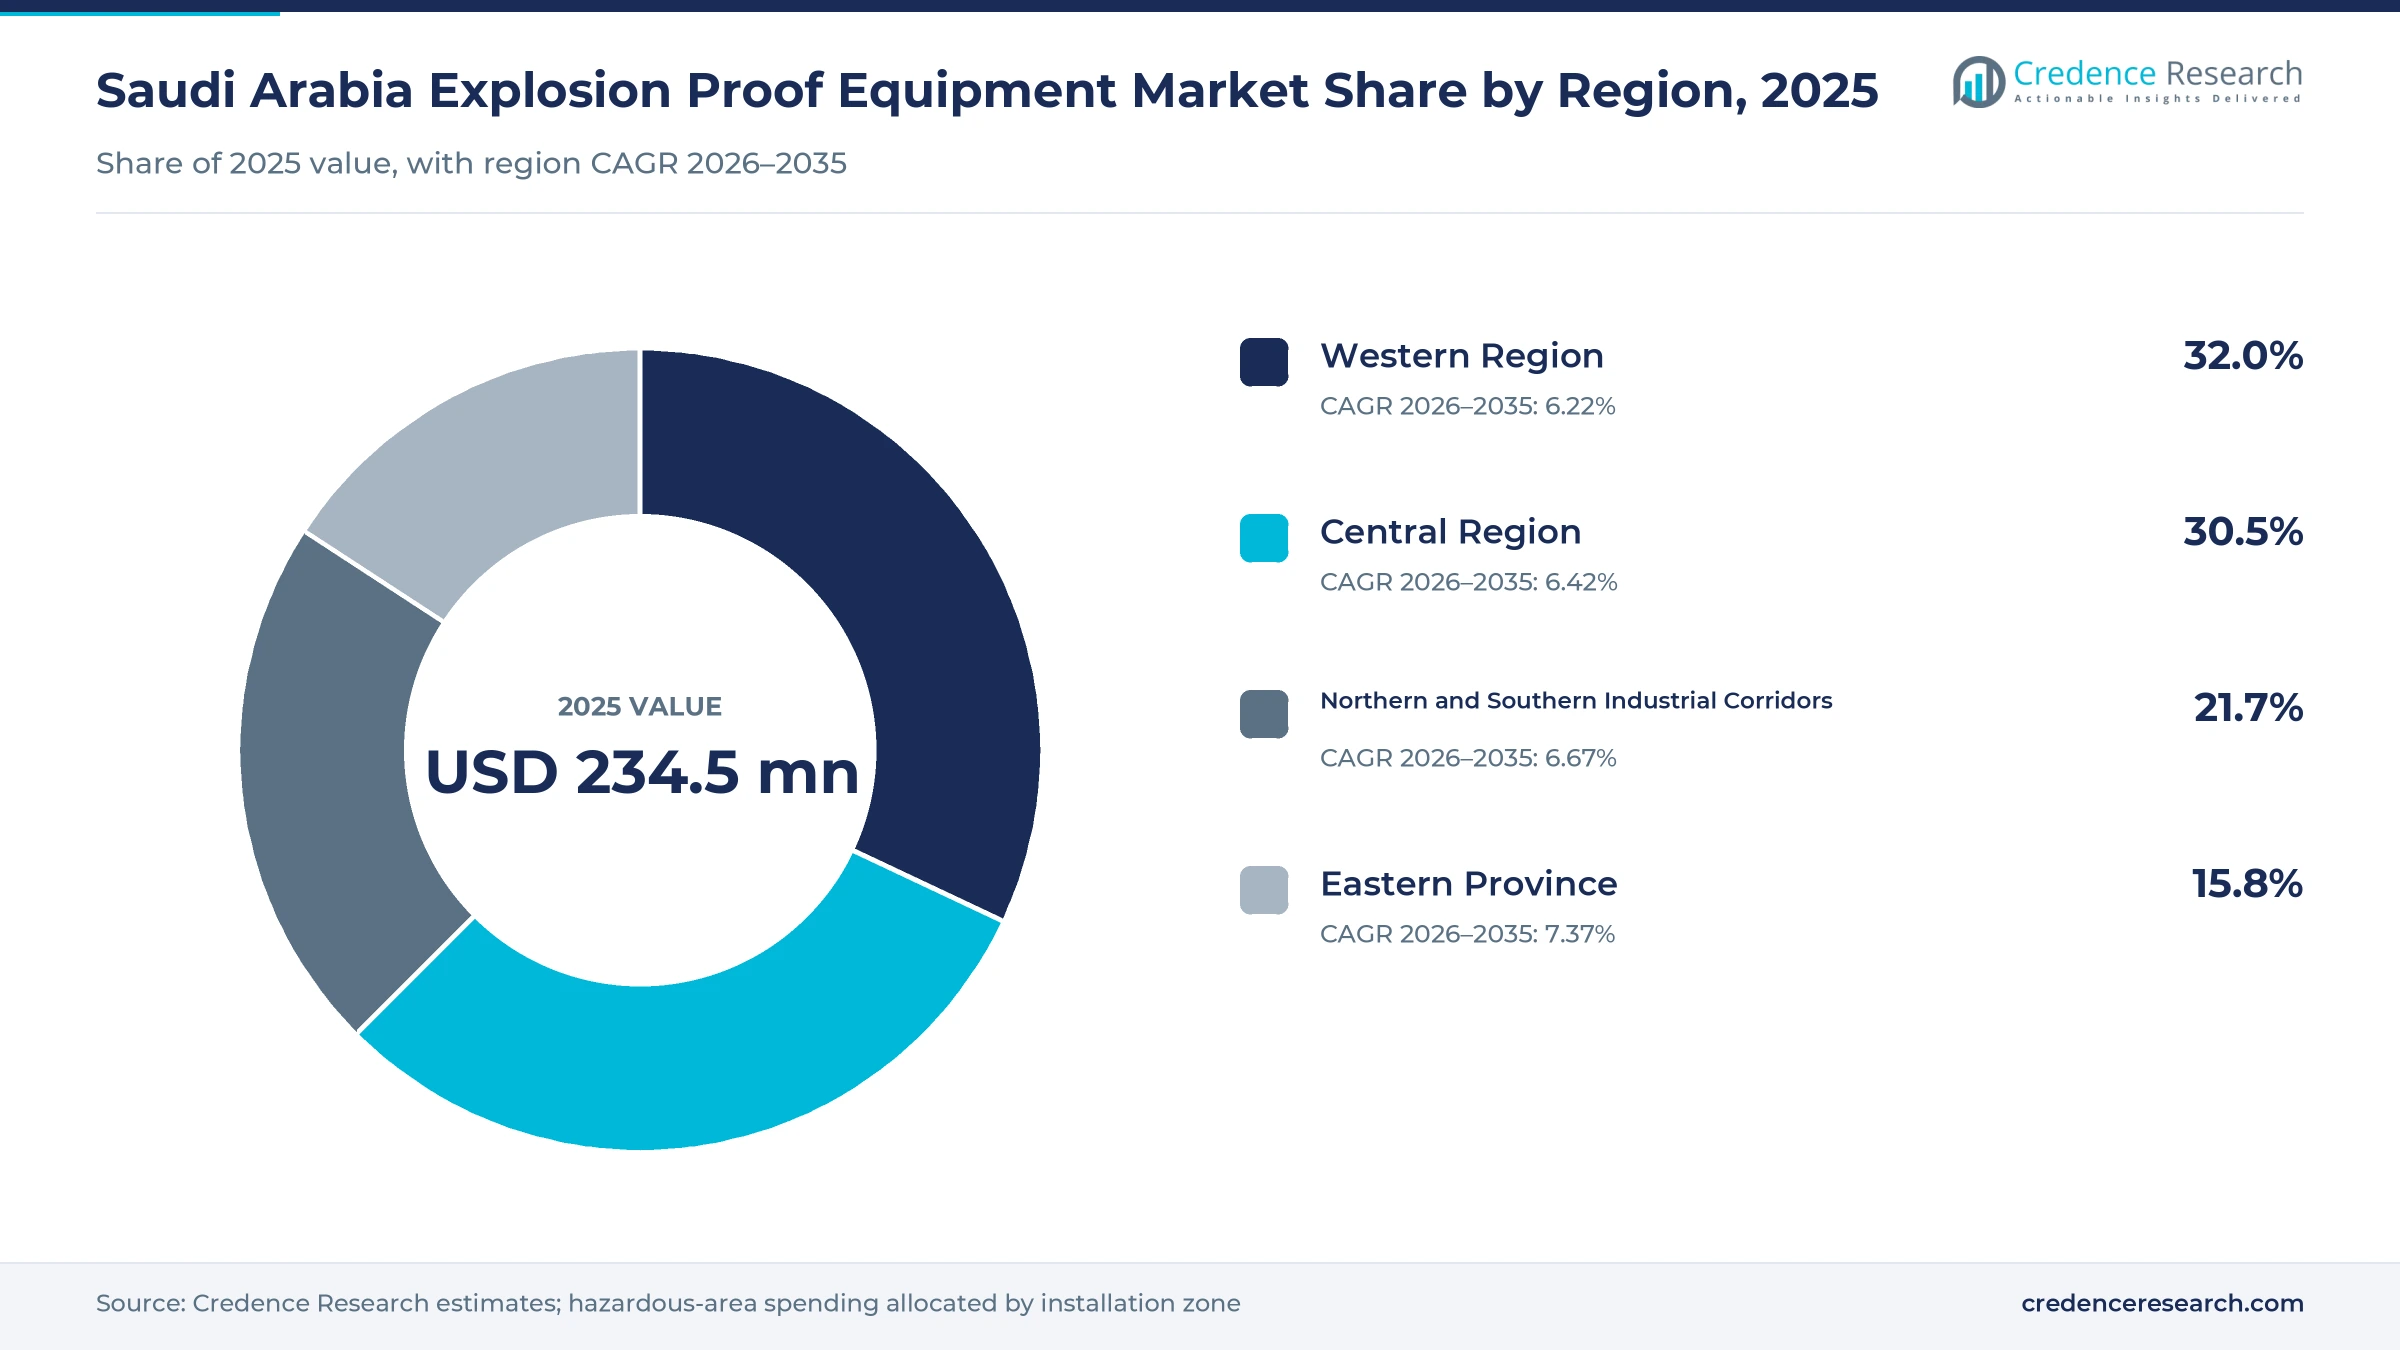
The Saudi Arabia explosion proof equipment market was valued at USD 234.5 million in 2025 and is projected to increase from USD 256.0 million in 2026 to USD 453.8 million by 2035, registering a CAGR of 6.57% during 2026–2035. Demand comes from gas processing plants, refineries, petrochemical complexes, mines and utilities that must use certified electrical products in zones where flammable gas or dust can form. The Western Region held the largest share, 32.0% in 2025, followed by the Central Region at 30.5%. The Eastern Province is the fastest-growing region at 7.37% a year, because new gas output from the Jafurah field and the Tanajib gas plant started in December 2025. On the regulatory side, products for explosive atmospheres need a certificate of conformity before they reach the Saudi market. As a result, certified suppliers with local stock, testing support and service teams win a growing share of plant maintenance and new project orders.
What hazardous-area products does the estimate include?
The estimate measures spending on electrical and electronic products designed to operate safely in explosive gas and dust atmospheres. It covers enclosures and junction boxes, luminaires and signals, control and automation devices, and portable radios, phones and inspection tools. Values are stated in USD million at current prices for each calendar year.
The estimate excludes ordinary industrial electrical goods, mechanical equipment such as pumps and compressors, fixed fire suppression systems and stand-alone installation labor. The value chain runs from global and local manufacturers through certification bodies, distributors and engineering contractors to plant owners and maintenance teams.
Saudi Arabia Explosion Proof Equipment Market Insights
- The market was valued at USD 234.5 million in 2025 and is projected to reach USD 453.8 million by 2035, registering a CAGR of 6.57% during 2026–2035.
- The Western Region held 32.0% of 2025 value, as refineries, industrial cities and utility sites along the Red Sea coast buy certified products.
- Electrical enclosures and junction systems led with 36.0% of 2025 value, because every hazardous-area circuit needs protected connection points.
- Aramco began first shale gas production at Jafurah in December 2025, which adds new processing sites that need certified electrical products.
- Saudi Arabia issued 1,660 new industrial licenses in 2025, which widens demand beyond oil and gas toward chemicals, metals and process plants.
Enclosures and oil and gas sites lead hazardous-area demand
Why do enclosures and junction systems lead?
Based on product type, the market is categorized into electrical enclosures and junction systems, lighting and signalling equipment, control and automation equipment, and communication and mobile devices. Electrical Enclosures and Junction Systems led with 36.0% of 2025 value, because every motor, panel and instrument loop in a hazardous zone needs protected connection points. Communication and Mobile Devices grow fastest at 7.19% a year, as plants equip field crews with certified radios, phones and tablets.
Which industries buy the most certified products?
Based on end-use industry, the market is categorized into oil and gas, chemicals and petrochemicals, mining and metals, and utilities and process manufacturing. Oil and Gas led with 52.0% of 2025 value, because upstream fields, gas plants and refineries contain the largest classified areas. Mining and Metals grow fastest at 7.59% a year, as new mines and processing plants add dust and gas hazard zones.
How do plants use hazardous-area products?
Based on application, the market is categorized into power distribution, process control and instrumentation, area lighting and signalling, and workforce communication and inspection. Power Distribution led with 34.0% of 2025 value, because distribution boards, plugs and cable glands carry power to every hazardous-area load. Workforce Communication and Inspection grows fastest at 7.09% a year, as operators digitize rounds and inspections with certified handheld devices.
How do buyers procure certified products?
Based on sales channel, the market is categorized into direct OEM sales, authorized distributors, EPC procurement and government and enterprise tenders. EPC Procurement led with 33.0% of 2025 value, because engineering contractors buy complete packages for new gas and chemical plants. Authorized Distributors grow fastest at 6.91% a year, as plant owners buy spare parts and replacements from local stock rather than waiting for factory orders.
| Segment Group | Leading Sub-segment | Share, 2025 | Fastest-growing Sub-segment | CAGR, 2026–2035 |
|---|---|---|---|---|
| By Product Type | Electrical Enclosures and Junction Systems | 36.0% | Communication and Mobile Devices | 7.19% |
| By End-Use Industry | Oil and Gas | 52.0% | Mining and Metals | 7.59% |
| By Application | Power Distribution | 34.0% | Workforce Communication and Inspection | 7.09% |
| By Sales Channel | EPC Procurement | 33.0% | Authorized Distributors | 6.91% |
Request a Free Sample
Fill in your details and we'll send you a free sample report.
- Sample data tables & charts
- Research methodology
Gas expansion, new factories and compliance drive demand
How does gas processing expansion lift hazardous-area demand?
Gas processing and hydrocarbon asset expansion is the largest demand driver, because every new well pad, pipeline station and processing train contains classified zones. Aramco began first shale gas production at Jafurah in December 2025 and targets up to 2 billion standard cubic feet a day of sales gas by 2030, according to World Oil. The Tanajib gas plant also started in December 2025 and is expected to reach 2.6 billion standard cubic feet a day of raw gas processing capacity in 2026. In turn, Aramco aims to raise sales gas capacity by about 80% by 2030 from 2021 levels, which keeps oil and gas at 52.0% of 2025 value.
Why does industrial diversification widen the buyer base?
Industrial diversification and manufacturing expansion widen the buyer base beyond oil and gas, because chemical, metals and process plants also handle flammable gases and dusts. Saudi Arabia issued 1,660 new industrial licenses in 2025 worth more than SAR 76 billion, according to Asharq Al-Awsat, citing the Ministry of Industry and Mineral Resources. During the same year, 1,201 factories started production with more than SAR 31 billion of investment and about 45,454 workers. Manufacturing contributed 15.8% of GDP in 2025, according to World Bank data. As a result, mining and metals plants and new process sites add steady demand for certified products outside the oil and gas sector.
How do certification rules drive replacement buying?
Certification, compliance and asset replacement keep demand steady, because aging or noncompliant products must be replaced to keep classified areas safe. The SASO technical regulation for explosive atmospheres requires a certificate of conformity before products are displayed or sold in the kingdom. Each product also needs a technical file with a declaration of conformity and a risk assessment. In turn, markings must show the explosion protection type, test certificate number and maximum ambient temperature, and violations can bring penalties under the Anti-Commercial Fraud Law. Industry, including construction, contributed 43.0% of GDP in 2025, which means a large installed base must stay compliant. As a result, enclosures and junction systems, which carry these markings at every connection point, held 36.0% of 2025 value, and power distribution applications held 34.0%.
Why does localization pull suppliers into the kingdom?
Localization through the iktva program pulls suppliers to build factories, assembly lines and service centers inside the kingdom. Aramco signed 145 agreements and memorandums worth about USD 9 billion at the iktva forum in January 2025, according to Aramco. Its iktva score in procurement reached 67% in 2024, up from 35% in 2015. The program has also enabled 350 new local manufacturing facilities, and 47 products are now made in Saudi Arabia for the first time. As a result, buyers increasingly favor locally assembled control, instrumentation and safety products that support in-kingdom value targets. In turn, certified products that are assembled and tested locally can also reach plant sites faster during shutdowns.
Shale gas and local integration reshape the supply base
How is the rise of unconventional gas changing demand?
The rise of unconventional gas is shifting new demand toward large, multi-site processing networks in the Eastern Province. The Jafurah field covers about 17,000 square kilometers and holds an estimated 229 trillion cubic feet of raw gas. By 2030, Aramco plans to recover about 420 million standard cubic feet a day of ethane and about 630,000 barrels a day of high-value liquids. These liquids feed petrochemical plants, which adds classified areas downstream as well as at the field. As a result, the Eastern Province becomes the main source of new hazardous-area orders, because each new gas train, compressor station and liquids line needs certified lighting, junction boxes and instruments.
Why is local system integration gaining ground?
Local system integration is gaining ground, because operators want faster delivery, local testing and in-kingdom support. ABB runs a 10,000 square meter site in Dammam that houses its measurement and analytics system integration unit, with assembly of pressure and temperature transmitters. The unit won a Distributor of the Year award in 2024 at the Instrumentation Excellence Awards for industrial process and gas analysis. In 2025, a partnership with Samsung Engineering made ABB a single-source vendor for gas analyzer system integration in the kingdom. Schneider Electric also planned a 20,000 square meter facility at King Salman Energy Park for control and emergency shutdown systems. In turn, control and automation products gain share as local integrators bundle certified field devices with oilfield automation systems.
Can new petrochemical complexes open large package orders?
New petrochemical complexes offer a clear opening, because each one needs thousands of certified lighting, junction and control points. The Amiral complex at Jubail will include a mixed-feed cracker producing 1.65 million tons a year of ethylene and two polyethylene units of 500,000 tons a year each. It is scheduled to begin commercial operations in 2027, linked to an existing 460,000 barrel-a-day refinery. Such projects also lift demand for gas detectors and related safety systems across the site. Therefore, suppliers that qualify early with engineering contractors can win long package orders that run from construction through the first years of operation.
Is mining a new opening for dust-zone products?
Mining offers a second opening, because mines and mineral processing plants create dust and gas hazard zones that require Group I or Group II certified products. Saudi Arabia issued 736 new mining licenses in 2025, bringing active mining licenses to 2,925 by year-end. The SASO regulation separates Group I equipment for mines from Group II equipment for other explosive atmospheres, which creates distinct product lines. In turn, mining and metals grows at 7.59% a year, the fastest end-use industry, and suppliers with certified lighting, enclosures and portable radios can build early positions near new mine sites and supply them through local distributors.
Certification, skills and project timing slow buyers
How do certification costs slow product launches?
Certification costs slow product launches, because each product family needs test reports, a technical file and a certificate of conformity before sale. Smaller suppliers and local assemblers face the highest relative cost, since they spread testing over fewer units. As a result, some buyers wait longer for approved alternatives or keep using older models. Suppliers mitigate this by certifying core product families first and sharing test data across similar designs.
Why does the skills gap affect installation quality?
A shortage of trained hazardous-area technicians affects installation quality, because incorrect cable glands, seals or wiring can void a protection method. This risk is highest during plant shutdowns, when many contractors work on site at the same time. In turn, operators face rework, inspection findings and delayed restarts. Training programs, supplier-led workshops and competency certification for technicians help reduce these errors over time.
How does project timing create uneven demand?
Project timing creates uneven demand, because large orders arrive only when gas, chemical or mining projects reach construction. Engineering contractors buy most packages in short windows, which strains supplier lead times and local stock. However, demand can pause when owners delay final investment decisions or reschedule capital budgets. Suppliers mitigate this by building steady maintenance and spare parts revenue alongside project sales.
Why does price competition squeeze margins?
Price competition squeezes margins, because certified products from many countries compete for the same tenders and distributor shelves. Buyers often compare offers mainly on unit price once certification is confirmed, which favors high-volume producers. As a result, premium suppliers must prove value through service, longer life and lower maintenance costs. Local assembly and long-term frame agreements with plant owners help protect margins.
Western Region leads while Eastern Province grows fastest
| Region | Value, 2025 (USD million) | Share, 2025 | CAGR, 2026–2035 |
|---|---|---|---|
| Western Region | 75.0 | 32.0% | 6.22% |
| Central Region | 71.5 | 30.5% | 6.42% |
| Northern and Southern Industrial Corridors | 50.9 | 21.7% | 6.67% |
| Eastern Province | 37.1 | 15.8% | 7.37% |
Why does the Western Region lead spending?
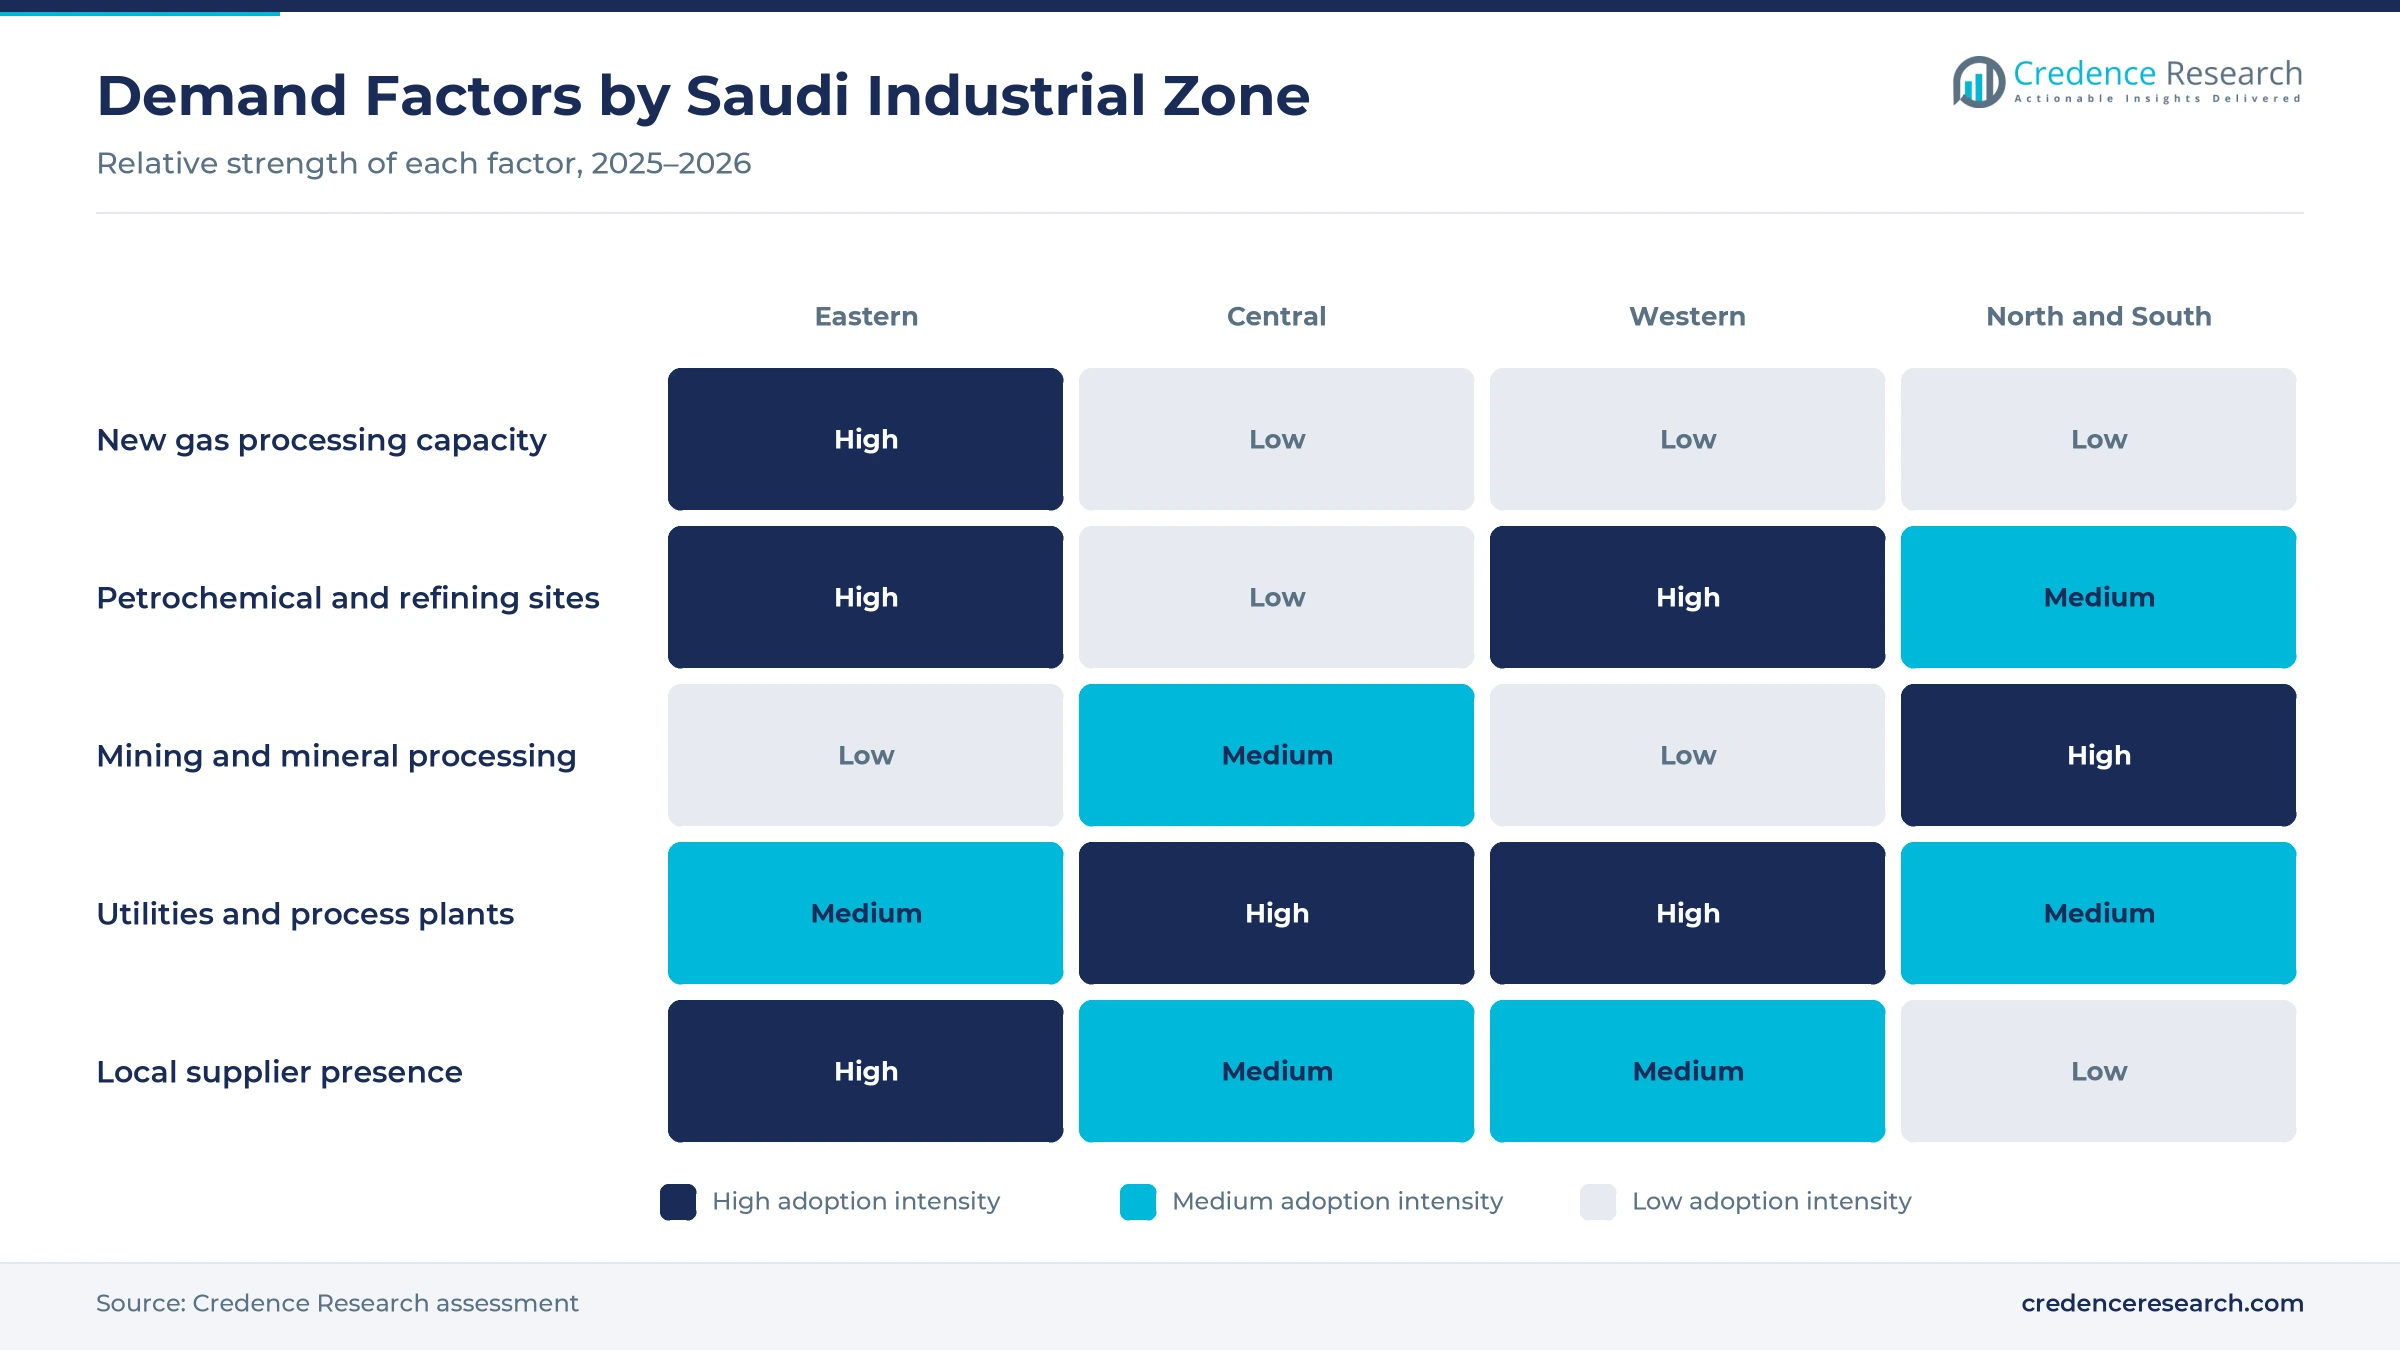
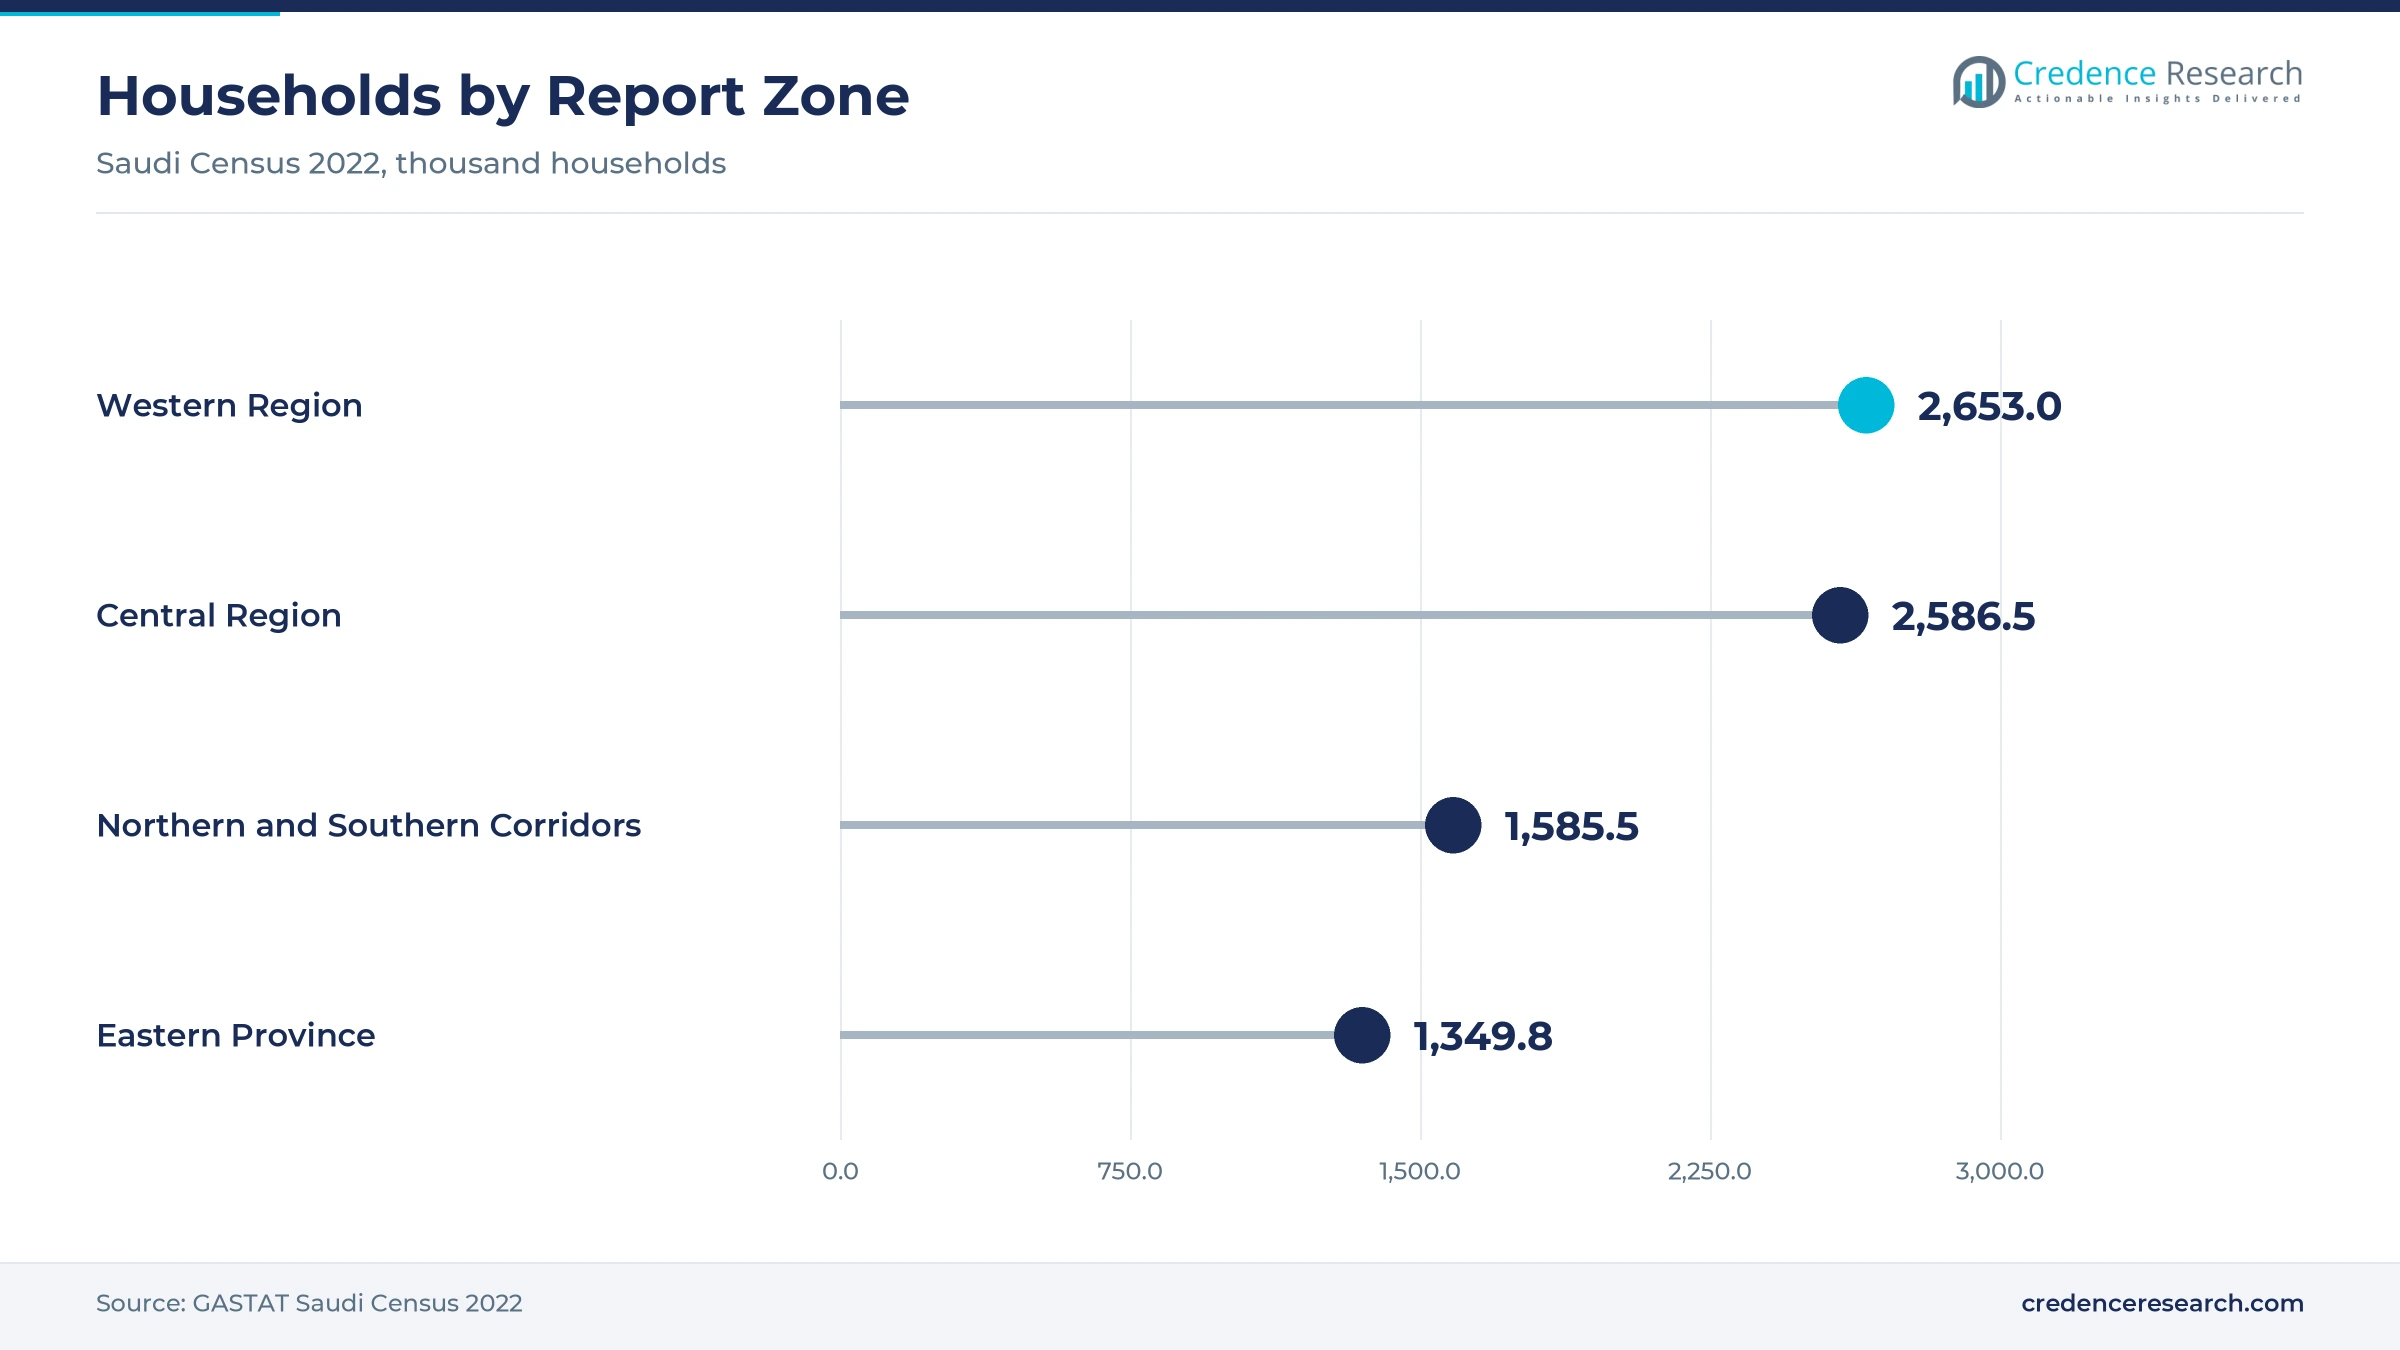
The Western Region held 32.0% of 2025 value and grows at 6.22% a year. The zone covers Makkah and Madinah regions, which together held about 2.65 million households in the 2022 census. Coastal refining, petrochemical and utility sites in the zone buy certified lighting, enclosures and control products for maintenance and expansions. As a result, distributors with stock in the region serve a broad base of plant owners and maintenance contractors.
How does the Central region support demand?
The Central Region held 30.5% of 2025 value and grows at 6.42% a year. The zone covers Riyadh and Al-Qassim regions, with about 2.59 million households in the 2022 census. Industrial cities, utilities and process plants around the capital buy certified products for fuel storage, gas supply and chemical handling. In turn, enterprise tenders and distributor sales are especially important in the zone, because many buyers run smaller sites.
What drives demand in the northern and southern corridors?
The Northern and Southern Industrial Corridors held 21.7% of 2025 value and grow at 6.67% a year. The zone groups eight administrative regions, including Tabuk, Hail, Northern Borders, Al-Jouf, Aseer, Jazan, Najran and Al-Baha, with about 1.59 million households. Mining, mineral processing and utility projects drive demand for dust-rated lighting and enclosures. Therefore, suppliers that support remote sites with stock and service gain an edge.
Why is the Eastern Province the fastest-growing zone?
The Eastern Province held 15.8% of 2025 value and grows fastest at 7.37% a year, as new gas capacity comes online. Jafurah and Tanajib both started in December 2025, and King Salman Energy Park hosts new supplier factories. The zone also hosts Jubail, where the Amiral petrochemical complex is scheduled to start in 2027. In turn, oilfield automation and power distribution projects in the province add large orders for certified enclosures and control products.
Gas start-ups and local deals mark 2025 and 2026
| Development | Status and market relevance |
|---|---|
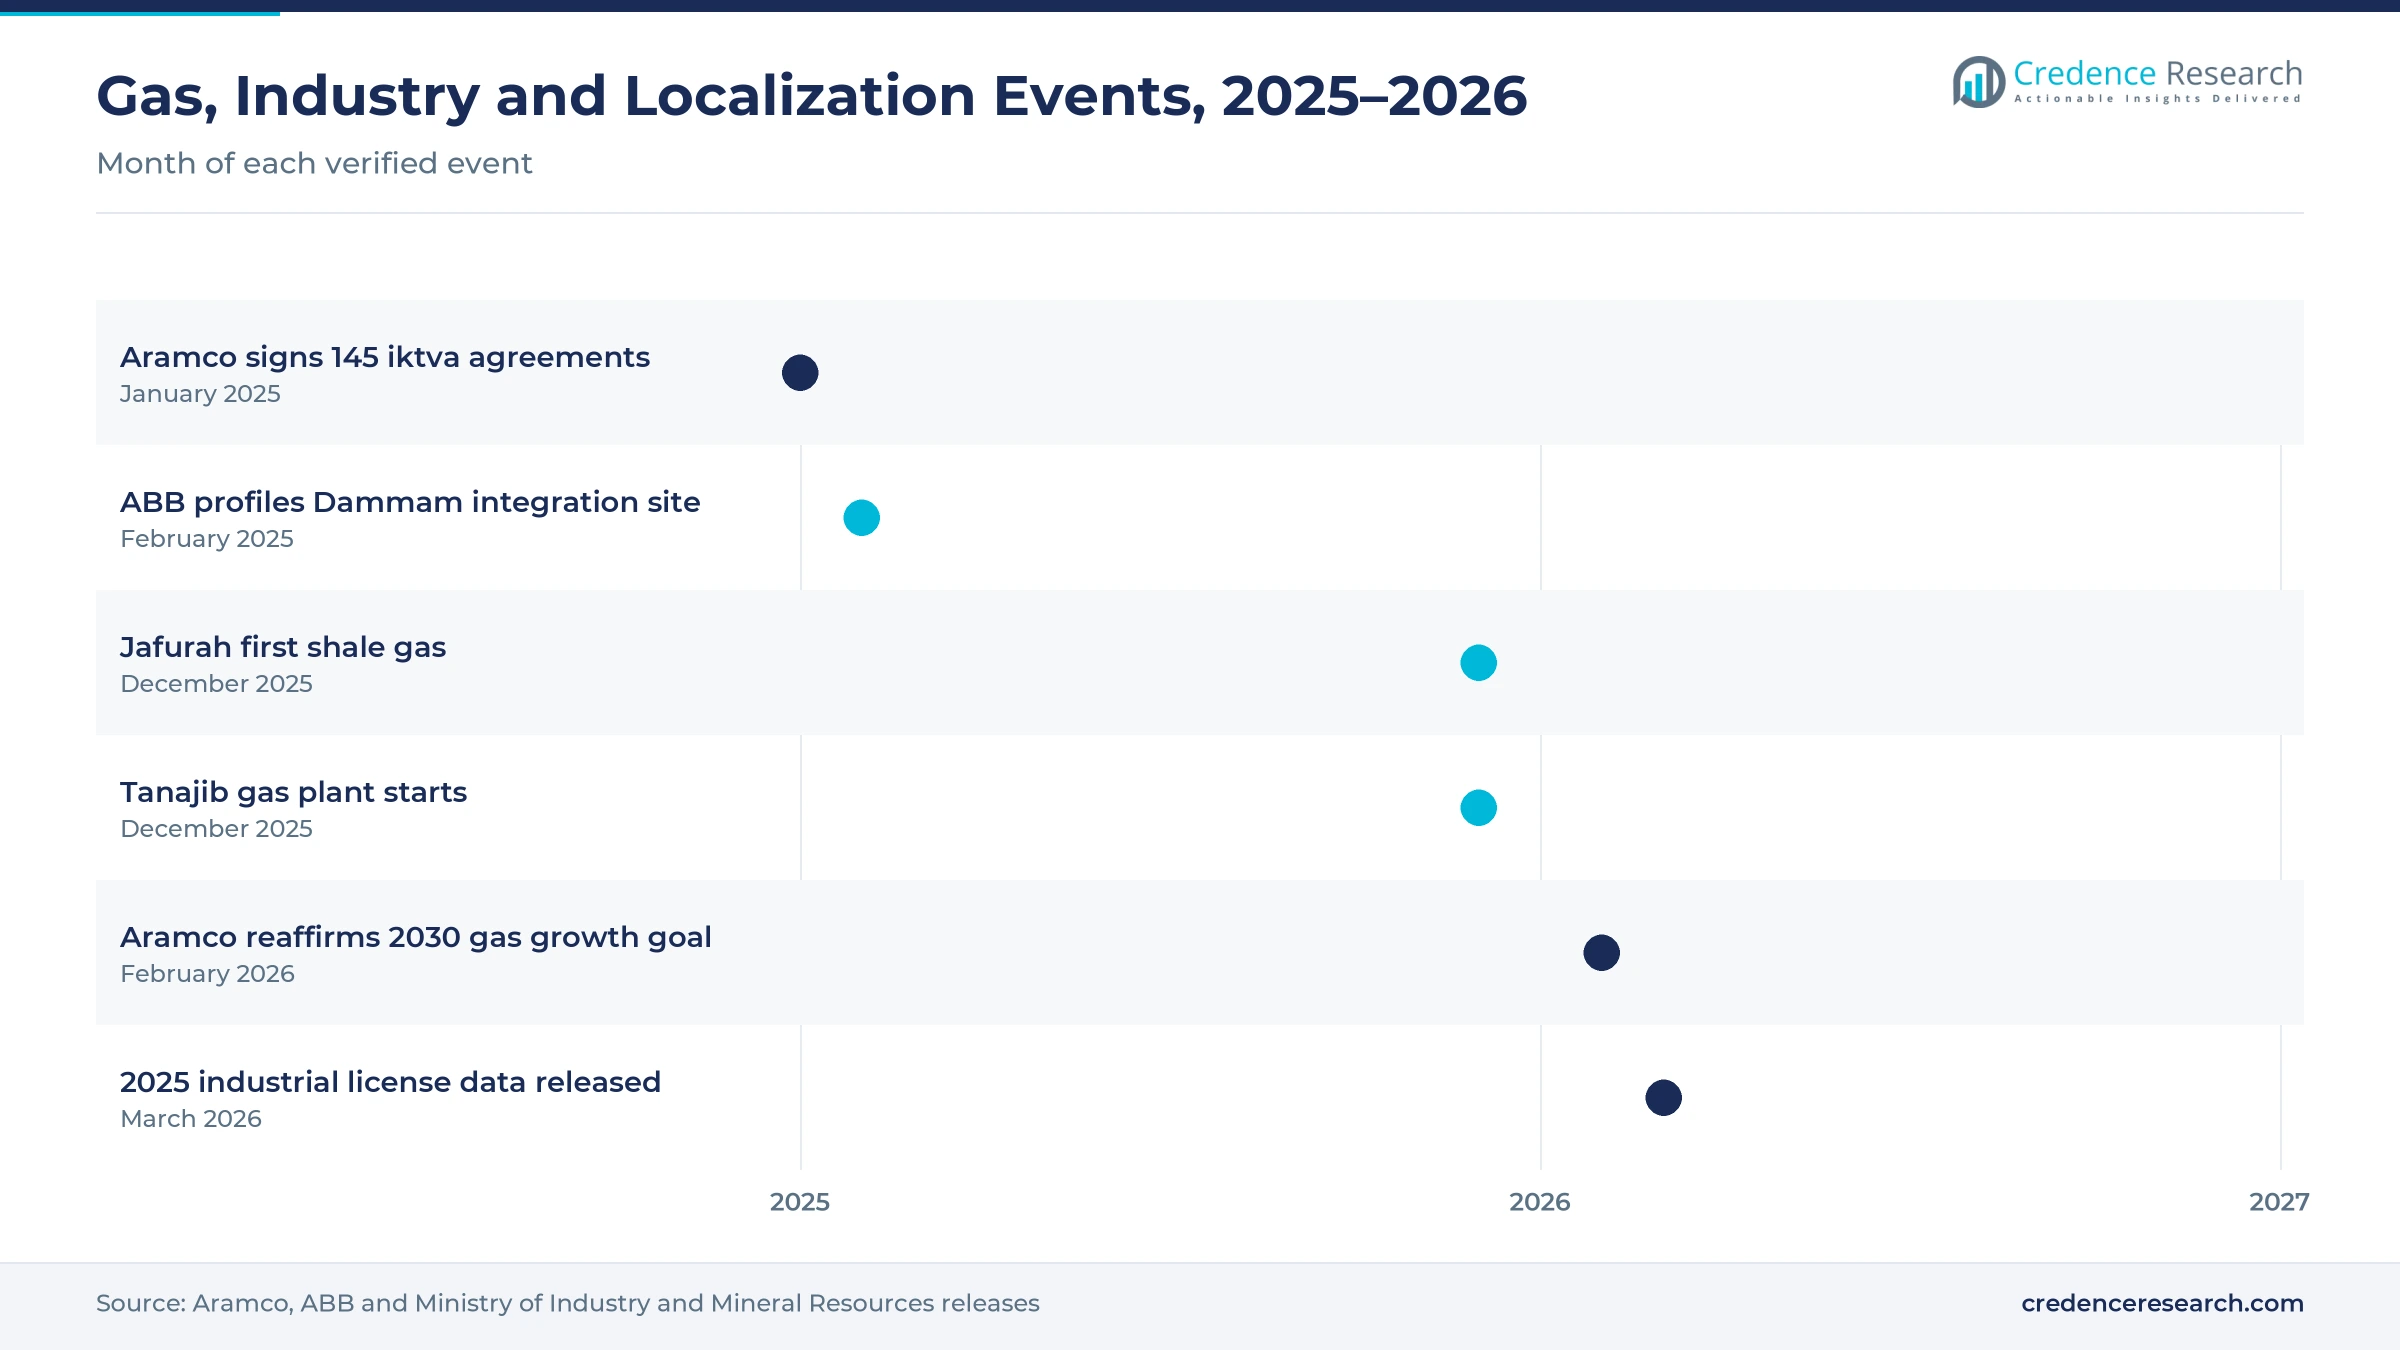
| In January 2025, Aramco signed 145 agreements and memorandums worth about USD 9 billion at the iktva forum in Dhahran. | Supports local manufacturing of industrial and safety products used in hazardous areas |
| In February 2025, ABB described its 10,000 square meter Dammam site for analytical system integration and transmitter assembly. | Shows instrumentation suppliers building local engineering and assembly capacity |
| In December 2025, Aramco began first shale gas production from the Jafurah field. | Adds new processing sites that require certified electrical and instrumentation products |
| In December 2025, the Tanajib gas plant started operations, processing associated gas from the Marjan and Zuluf fields. | Expected to reach 2.6 billion standard cubic feet a day of raw gas capacity in 2026 |
| In March 2026, ministry data showed 1,660 new industrial licenses and 1,201 factories starting production in 2025. | Widens demand for certified products beyond oil and gas |
Digital and portable devices enter hazardous zones
- Intrinsically safe digital instruments limit energy in field circuits so that transmitters and analyzers can be serviced without shutting down a live process.
- Certified LED luminaires replace older lamps in classified zones, which reduces maintenance visits and power use across large plant areas.
- Certified mobile devices such as radios, smartphones and tablets let field crews record inspections and alarms directly from hazardous zones.
- Remote condition monitoring uses sensors on enclosures, motors and circuit breakers to flag faults early, which helps plants plan replacements during scheduled shutdowns.
Need a Custom Version of This Report?
Tailor the scope, geography, or segments to your exact requirements.
- Custom geography or segment scope
- Direct access to our analyst team
Global safety specialists compete through local partners
Competition in the Saudi Arabia explosion proof equipment market is led by global hazardous-area specialists and broad automation groups that sell through local distributors, engineering contractors and frame agreements with energy operators. Specialist hazardous-area manufacturers such as Eaton Crouse-Hinds, Pepperl+Fuchs, BARTEC and R. STAHL focus on certified enclosures, lighting, junction systems and intrinsic safety products. ABB, Schneider Electric, Honeywell, Siemens, Emerson and Rockwell Automation compete in control, instrumentation and power distribution packages for gas and chemical plants. Several of these groups have built local capacity, including ABB in Dammam and Honeywell and Schneider Electric at King Salman Energy Park. Rivals compete on certification coverage, delivery time, local content, engineering support and service, while iktva targets increasingly shape vendor selection.
Companies profiled and their roles in this market
| Company | Type | Role in the market |
|---|---|---|
| ABB | Automation and instrumentation group | Runs a 10,000 square meter Dammam site for analytical system integration and transmitter assembly |
| Honeywell | Automation and safety group | Broke ground on a manufacturing center at King Salman Energy Park for field instruments, gas detection and rugged mobile computers |
| Schneider Electric | Energy management and automation group | Planned a 20,000 square meter facility at King Salman Energy Park for control and emergency shutdown systems |
| Emerson | Process automation group | Signed an iktva agreement with Aramco and operates a central digital hub facility in the kingdom |
Credence Research view on gas capex and localization
Credence Research's view is that explosion proof equipment spending in Saudi Arabia will track gas and chemical capital programs, with replacement demand providing a steady base between project peaks. Jafurah, Tanajib and the Amiral complex give the Eastern Province the strongest growth outlook through 2030. Localization will matter as much as price, because iktva scoring rewards suppliers with local assembly, testing and service. Suppliers that combine certified product breadth with in-kingdom stock and trained installers should gain share, while importers without local support will face tighter margins.
How the hazardous-area spending estimate was built
The report uses 2025 as the base year on a calendar basis, with values in USD million at current prices. Market values come from the Credence Research model, which links explosion proof equipment demand to installed and planned capacity in gas, refining, chemicals, mining and utilities, then checks the result against industrial license data. Regional, segment and channel splits are Credence Research estimates built from census, industry and project information. Sources used are company releases, ministry and census statistics, World Bank data, technical regulations and trade press, and no interviews or surveys were used.
Steady gains to 2035 as gas and chemicals expand
Explosion proof equipment spending is expected to reach USD 453.8 million by 2035, a 6.57% CAGR during 2026–2035, as gas processing, chemicals and mining add new classified areas. Growth should be strongest through 2030, while Jafurah and other gas projects ramp up and the Amiral complex enters service. After that, replacement of aging products, digital upgrades and new industrial plants should keep demand rising at a steadier pace. Faster mining development would lift this outlook, while delays in gas or chemical projects would lower it.
Frequently Asked Questions
How big is the Saudi Arabia explosion proof equipment market?
Which region leads hazardous-area spending in the kingdom?
Which product type holds the largest share?
Which industry buys the most certified products?
What certification do products need in Saudi Arabia?
How does the Jafurah field affect demand?
Who are the leading companies in the market?
How does localization shape supplier choice?
Table of Content
Chapter 1 Market Segmentation
- 1.1 Segmentation Framework
- 1.1.1 Product and Service Classification
- 1.1.2 Application and End-Use Classification
- 1.1.3 Technology and Solution Classification
- 1.1.4 Customer and Distribution Channel Classification
- 1.1.5 Geographic Segmentation
- 1.1.6 Market Segment Definitions and Boundaries
- 1.2 By Product Type
- 1.2.1 Electrical Enclosures and Junction Systems
- 1.2.2 Lighting and Signalling Equipment
- 1.2.3 Control and Automation Equipment
- 1.2.4 Communication and Mobile Devices
- 1.3 By End-Use Industry
- 1.3.1 Oil and Gas
- 1.3.2 Chemicals and Petrochemicals
- 1.3.3 Mining and Metals
- 1.3.4 Utilities and Process Manufacturing
- 1.4 By Application
- 1.4.1 Power Distribution
- 1.4.2 Process Control and Instrumentation
- 1.4.3 Area Lighting and Signalling
- 1.4.4 Workforce Communication and Inspection
- 1.5 By Sales Channel
- 1.5.1 Direct OEM Sales
- 1.5.2 Authorized Distributors
- 1.5.3 EPC Procurement
- 1.5.4 Government and Enterprise Tenders
Chapter 2 Introduction
- 2.1 Report Objectives and Scope
- 2.2 Product Definition and Industry Terminology
- 2.3 Market Inclusions and Exclusions
- 2.4 Research Process
- 2.4.1 Primary Research and Expert Interviews
- 2.4.2 Secondary Research and Source Review
- 2.4.3 Top-Down and Bottom-Up Estimation
- 2.4.4 Data Triangulation and Verification
- 2.5 Market Size Measurement Basis
- 2.5.1 2025: USD 234.5 million → 2035: USD 453.8 million
- 2.6 Historical and Forecast Reference Periods
- 2.6.1 Historical Period: 2018-2025
- 2.6.2 Base Year: 2025
- 2.6.3 Forecast Period: 2025-2035
- 2.7 Research Assumptions and Limitations
Chapter 3 Executive Summary
- 3.1 Market Snapshot and Key Findings
- 3.2 Base-Year Market Size, 2025
- 3.3 Forecast Market Size, 2035
- 3.4 Revenue and Volume Growth Outlook
- 3.5 Key Demand and Supply Indicators
- 3.6 Leading Market Segments
- 3.7 Fastest-Growing Market Opportunities
- 3.8 Regional Performance Highlights
- 3.9 Technology and Industry Transformation
- 3.10 Competitive Landscape Summary
- 3.11 Analyst View and Strategic Implications
Chapter 4 Saudi Arabia Explosion Proof Equipment Market Trends and Developments
- 4.1 Historical Industry Development, 2018-2025
- 4.2 Recent Market Trends and Developments
- 4.3 Demand and Customer Behavior Trends
- 4.4 Technology and Product Innovation
- 4.5 Artificial Intelligence, Automation and Digitalization
- 4.6 Local Manufacturing and Supply Chain Realignment
- 4.7 Industry Partnerships, Mergers and Acquisitions
- 4.8 Sustainability and Circular Economy Developments
- 4.9 Government and Private Sector Investment Trends
- 4.10 Emerging Business Models and Commercialization
- 4.11 Industry Developments and Announcements
Chapter 5 Saudi Arabia Explosion Proof Equipment Market Production, Supply and Demand Analysis
- 5.1 Demand Trend and Consumption Analysis, 2018-2025
- 5.2 Demand Forecast, 2025-2035
- 5.3 Production and Output Trend, 2018-2025
- 5.4 Production and Output Forecast, 2025-2035
- 5.5 Installed Capacity and Capacity Utilization
- 5.6 Company-Wise Production Plants and Statistics
- 5.6.1 Installed Production Capacity
- 5.6.2 Actual Production
- 5.6.3 Planned Capacity and Expansion Targets
- 5.7 Supply Chain Structure and Procurement Trends
- 5.8 Supply-Demand Gap and Bottlenecks
- 5.9 Import Dependence and Sourcing Structure
- 5.10 Contract Manufacturing and Outsourcing
- 5.11 Regional Supply and Demand Concentration
Chapter 6 Saudi Arabia Explosion Proof Equipment Market Pricing Analysis
- 6.1 Pricing Structure and Measurement
- 6.2 Historical Pricing Trends, 2018-2025
- 6.3 Pricing Outlook, 2025-2035
- 6.4 Average Selling Price and Unit Economics
- 6.5 Pricing by Product and Market Segment
- 6.6 Geographic Pricing Differences
- 6.7 Key Input, Energy, Labor and Logistics Costs
- 6.8 Contract Pricing and Purchasing Models
- 6.9 Pricing Sensitivity and Competitive Positioning
- 6.10 Price, Margin and Profitability Implications
Chapter 7 Saudi Arabia Explosion Proof Equipment Market Dynamics
- 7.1 Market Growth Drivers
- 7.1.1 Demand-Side Drivers
- 7.1.2 Technology and Innovation Drivers
- 7.1.3 Infrastructure and Investment Drivers
- 7.1.4 Regulatory and Policy Drivers
- 7.2 Market Restraints
- 7.2.1 Cost and Affordability Constraints
- 7.2.2 Technology and Adoption Barriers
- 7.2.3 Supply Chain and Operational Constraints
- 7.3 Market Challenges
- 7.3.1 Competitive Pressure and Margin Erosion
- 7.3.2 Skills, Infrastructure and Implementation Gaps
- 7.4 Emerging Market Opportunities
- 7.5 Market Dynamics Impact and Time-Horizon Assessment
Chapter 8 Saudi Arabia Explosion Proof Equipment Value Chain Analysis
- 8.1 Industry Value Chain Overview
- 8.2 Upstream Suppliers and Critical Inputs
- 8.3 Technology and Component Providers
- 8.4 Manufacturing or Service Delivery
- 8.5 Distribution, Channel Partners and Integrators
- 8.6 Downstream Applications and End Users
- 8.7 Value Addition and Profit Pools
- 8.8 Vertical Integration and Outsourcing
- 8.9 Supplier Concentration and Risk
- 8.10 Supply Chain Localization and Resilience
Chapter 9 Saudi Arabia Explosion Proof Equipment Market Regulations and Policies
- 9.1 Relevant Laws, Standards and Compliance Frameworks
- 9.2 Product, Service, Safety and Quality Requirements
- 9.3 Government Policies, Incentives and Subsidies
- 9.4 Imports, Exports and Trade Barriers
- 9.5 Public Procurement and Local Content Requirements
- 9.6 Environmental and Sustainability Compliance
- 9.7 Upcoming Policy Changes and Market Implications
Chapter 10 Saudi Arabia Explosion Proof Equipment Market Hotspots and Opportunities
- 10.1 Market Opportunity Mapping and Growth Hotspots
- 10.2 High-Growth Applications and Customer Groups
- 10.3 Underserved Markets and White-Space Opportunities
- 10.4 Emerging Technology and Product Opportunities
- 10.5 New Capacity and Investment Hotspots
- 10.6 Market Entry and Expansion Opportunities
- 10.7 Distribution and Partnership Opportunities
- 10.8 Near-Term and Long-Term Commercial Potential
- 10.9 Opportunity Attractiveness and Execution Risks
Chapter 11 Saudi Arabia Explosion Proof Equipment Market Outlook, 2025-2035
- 11.1 Market Size and Analysis
- 11.1.1 Revenue (Market Measurement: 2025: USD 234.5 million → 2035: USD 453.8 million)
- 11.1.2 Market Volume and Quantity Sold
- 11.1.3 Historical Market Size, 2018-2025
- 11.1.4 Base-Year Market Size, 2025
- 11.2 Market Forecast, 2025-2035
- 11.2.1 Revenue Forecast to 2035
- 11.2.2 Volume Forecast to 2035
- 11.2.3 CAGR and Year-on-Year Growth
- 11.2.4 Incremental Revenue Opportunity
- 11.3 Forecast Assumptions and Scenario Analysis
- 11.3.1 Base-Case Forecast
- 11.3.2 Optimistic and Conservative Scenarios
- 11.3.3 Technology, Pricing and Policy Sensitivities
- 11.4 Market Attractiveness and Growth Outlook
Chapter 12 Saudi Arabia Explosion Proof Equipment Market Segmentation and Outlook
- 12.1 Segmentation Summary and Market Shares, 2025
- 12.2 Largest and Fastest-Growing Segments
- 12.3 By Product Type - Market Size and Forecast, 2025-2035
- 12.3.1 Segment Definition and Scope
- 12.3.2 Historical Market Size, 2018-2025
- 12.3.3 Revenue Forecast, 2025-2035
- 12.3.4 Volume Forecast, 2025-2035
- 12.3.5 Base-Year Market Share, 2025
- 12.3.6 Segment CAGR and Growth Drivers
- 12.3.7 Subsegment Market Size and Forecast
- 12.3.7.1 Electrical Enclosures and Junction Systems
- 12.3.7.2 Lighting and Signalling Equipment
- 12.3.7.3 Control and Automation Equipment
- 12.3.7.4 Communication and Mobile Devices
- 12.3.8 Subsegment Pricing and Adoption Trends
- 12.3.9 Leading Suppliers and Competition
- 12.3.10 Regional Demand and Opportunities
- 12.4 By End-Use Industry - Market Size and Forecast, 2025-2035
- 12.4.1 Segment Definition and Scope
- 12.4.2 Historical Market Size, 2018-2025
- 12.4.3 Revenue Forecast, 2025-2035
- 12.4.4 Volume Forecast, 2025-2035
- 12.4.5 Base-Year Market Share, 2025
- 12.4.6 Segment CAGR and Growth Drivers
- 12.4.7 Subsegment Market Size and Forecast
- 12.4.7.1 Oil and Gas
- 12.4.7.2 Chemicals and Petrochemicals
- 12.4.7.3 Mining and Metals
- 12.4.7.4 Utilities and Process Manufacturing
- 12.4.8 Subsegment Pricing and Adoption Trends
- 12.4.9 Leading Suppliers and Competition
- 12.4.10 Regional Demand and Opportunities
- 12.5 By Application - Market Size and Forecast, 2025-2035
- 12.5.1 Segment Definition and Scope
- 12.5.2 Historical Market Size, 2018-2025
- 12.5.3 Revenue Forecast, 2025-2035
- 12.5.4 Volume Forecast, 2025-2035
- 12.5.5 Base-Year Market Share, 2025
- 12.5.6 Segment CAGR and Growth Drivers
- 12.5.7 Subsegment Market Size and Forecast
- 12.5.7.1 Power Distribution
- 12.5.7.2 Process Control and Instrumentation
- 12.5.7.3 Area Lighting and Signalling
- 12.5.7.4 Workforce Communication and Inspection
- 12.5.8 Subsegment Pricing and Adoption Trends
- 12.5.9 Leading Suppliers and Competition
- 12.5.10 Regional Demand and Opportunities
- 12.6 By Sales Channel - Market Size and Forecast, 2025-2035
- 12.6.1 Segment Definition and Scope
- 12.6.2 Historical Market Size, 2018-2025
- 12.6.3 Revenue Forecast, 2025-2035
- 12.6.4 Volume Forecast, 2025-2035
- 12.6.5 Base-Year Market Share, 2025
- 12.6.6 Segment CAGR and Growth Drivers
- 12.6.7 Subsegment Market Size and Forecast
- 12.6.7.1 Direct OEM Sales
- 12.6.7.2 Authorized Distributors
- 12.6.7.3 EPC Procurement
- 12.6.7.4 Government and Enterprise Tenders
- 12.6.8 Subsegment Pricing and Adoption Trends
- 12.6.9 Leading Suppliers and Competition
- 12.6.10 Regional Demand and Opportunities
- 12.7 Segment Growth Comparison
- 12.8 Segment Attractiveness and Priority Matrix
Chapter 13 Saudi Arabia Explosion Proof Equipment End-Use and Application Market Outlook
- 13.1 End-Use Industry and Customer Demand Structure
- 13.2 Leading Applications and Customer Groups
- 13.3 End-Use Market Size, Share and Forecast
- 13.4 Major End-Use Industry Deep Dives
- 13.4.1 Customer Requirements and Use Cases
- 13.4.2 Demand and Replacement Cycles
- 13.4.3 Technical and Regulatory Considerations
- 13.4.4 Purchasing and Procurement Models
- 13.4.5 Leading Vendors and Distribution Channels
- 13.4.6 Forecast and Commercial Opportunities
- 13.5 Emerging Applications and Cross-Segment Demand
- 13.6 End-Use Industry Investment Priorities
Chapter 14 Saudi Arabia Explosion Proof Equipment Geographic Market Outlook, 2025-2035
- 14.1 Regional Market Size and Country-Level Shares, 2025
- 14.2 Country Market Size Comparison, 2025
- 14.3 Country Market Forecasts, 2025-2035
- 14.4 Subregional Industrial and Demand Clusters
- 14.5 Intra-Regional Pricing and Cost Differences
- 14.6 Cross-Border Trade and Supply Networks
- 14.7 Regional Supply and Demand Balances
- 14.8 Country Opportunity Comparison and Prioritization
Note: Every listed country is covered on the structure shown under the first country.
Chapter 15 Saudi Arabia Explosion Proof Equipment Technology, Innovation and Sustainability Outlook
- 15.1 Technology Landscape and Maturity
- 15.2 Product, Process and Service Innovation
- 15.3 AI, Automation and Digital Tools in the Industry
- 15.4 Technology Adoption and Performance Benchmarking
- 15.5 Innovation Pipeline and R&D Investment
- 15.6 Patent and Intellectual Property Trends
- 15.7 Energy Efficiency and Resource Management
- 15.8 Sustainability, Recycling and Circularity
- 15.9 Technology Roadmap, 2025-2035
- 15.10 Risks of Obsolescence and Technology Substitution
Chapter 16 Saudi Arabia Explosion Proof Equipment Market Key Strategic Imperatives
- 16.1 Growth and Market Entry Priorities
- 16.2 High-Return Products and Segments
- 16.3 Pricing, Profitability and Cost Optimization
- 16.4 Technology Investment and Product Differentiation
- 16.5 Supply Chain Localization and Resilience
- 16.6 Distribution and Customer Acquisition
- 16.7 Partnership, Acquisition and Capacity Strategy
- 16.8 Regional Expansion Priorities
- 16.9 Short-, Medium- and Long-Term Actions
Chapter 17 Competition Outlook
- 17.1 Industry Competition Characteristics
- 17.2 Market Structure and Concentration
- 17.3 Market Share and Competitive Positioning, 2025
- 17.4 Company-Wise Revenue and Product Benchmarking
- 17.5 Production and Service Capacity Benchmarking
- 17.6 Technology, Pricing and Differentiation
- 17.7 Regional Footprint and Distribution Strength
- 17.8 Mergers, Acquisitions and Strategic Alliances
- 17.9 New Entrants and Competitive Threats
- 17.10 Porter's Five Forces and Industry Attractiveness
- 17.11 Competitive Outlook, 2025-2035
Chapter 18 Company Profiles
- 18.1 Company Coverage and Selection Criteria
- 18.2 Eaton Crouse-Hinds
- 18.2.1 Business Description
- 18.2.2 Company Ownership and Geographic Presence
- 18.2.3 Product and Service Portfolio
- 18.2.4 Manufacturing and Operating Footprint
- 18.2.5 Production Capacity and Expansion Plans
- 18.2.6 Financial Performance and Investment
- 18.2.7 Market Share and Competitive Position
- 18.2.8 Technology and Innovation Capabilities
- 18.2.9 Strategic Alliances or Partnerships
- 18.2.10 Recent Developments
- 18.2.11 Growth Strategy and Outlook
- 18.3 R. STAHL
- 18.4 Pepperl+Fuchs
- 18.5 ABB
- 18.6 Schneider Electric
- 18.7 Honeywell
- 18.8 Siemens
- 18.9 Emerson
- 18.10 BARTEC
- 18.11 Rockwell Automation
- 18.12 Other Relevant Market Participants
Note: Every listed company is profiled on the structure shown under the first company. The company list is preliminary and may change based on research findings, market developments, data availability and client requirements.
Chapter 19 Disclaimer
- 19.1 Research and Forecast Disclaimer
- 19.2 Data Source and Estimation Limitations
Note: The depth of individual sections depends on data availability for this market. Volume, capacity, trade and other unit-based metrics are included where applicable.

