
Asia Pacific 3D Printing Market: USD 5.20 billion in 2025, the Fastest-Growing Regional Market
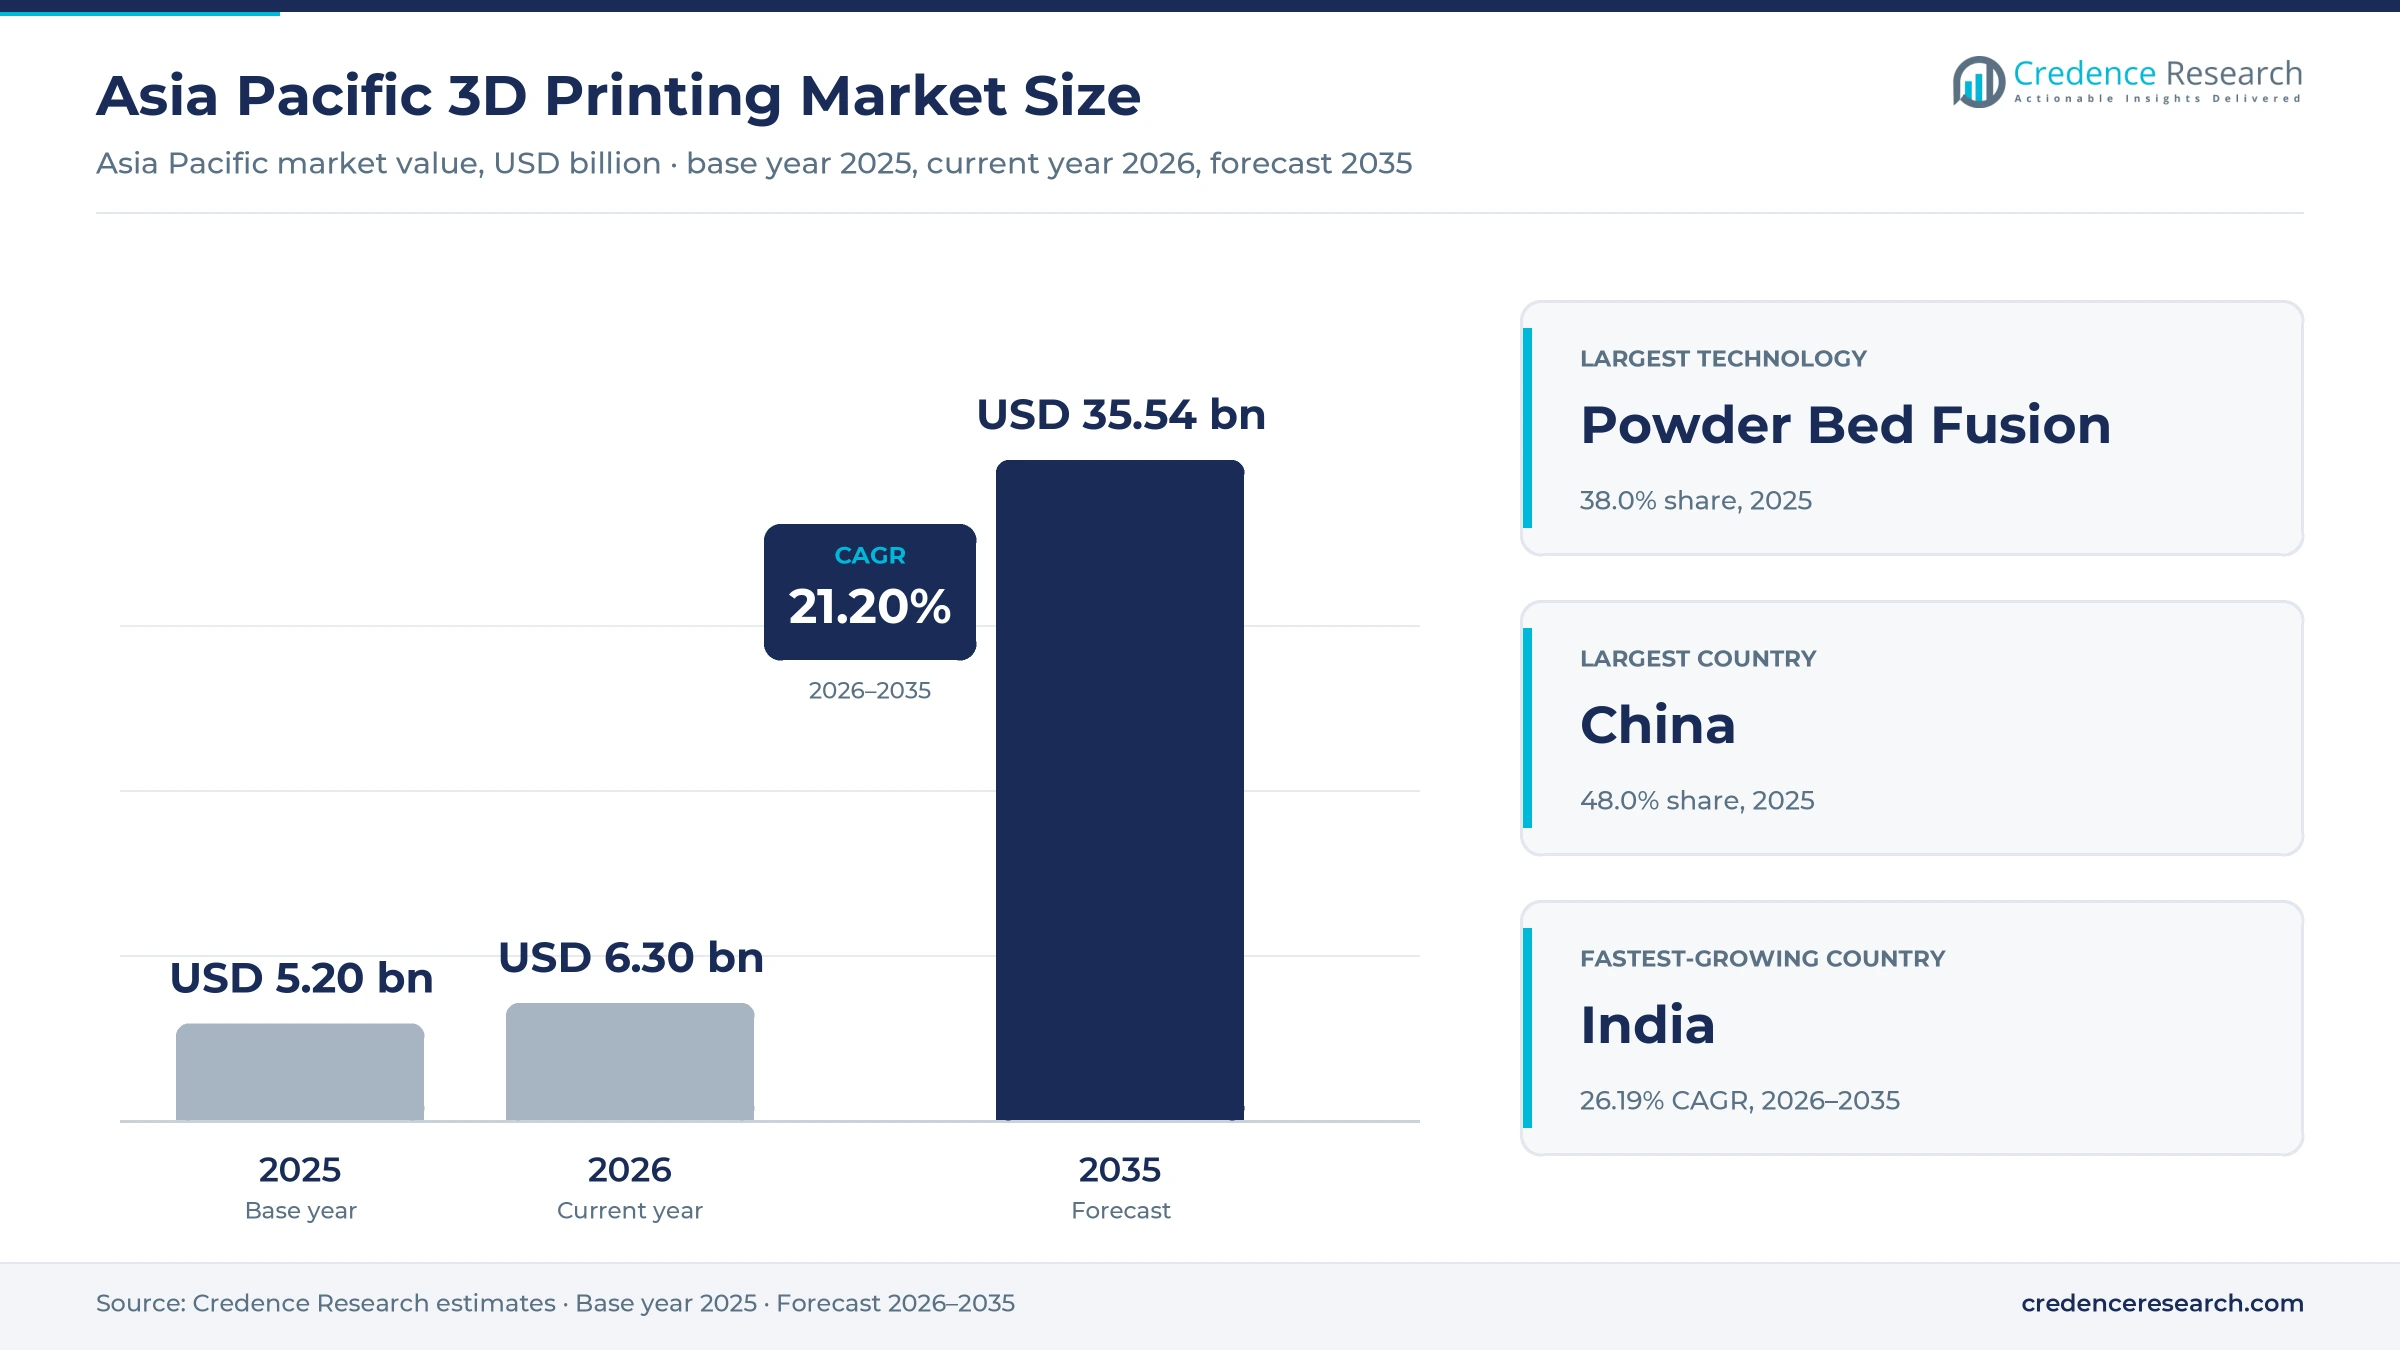
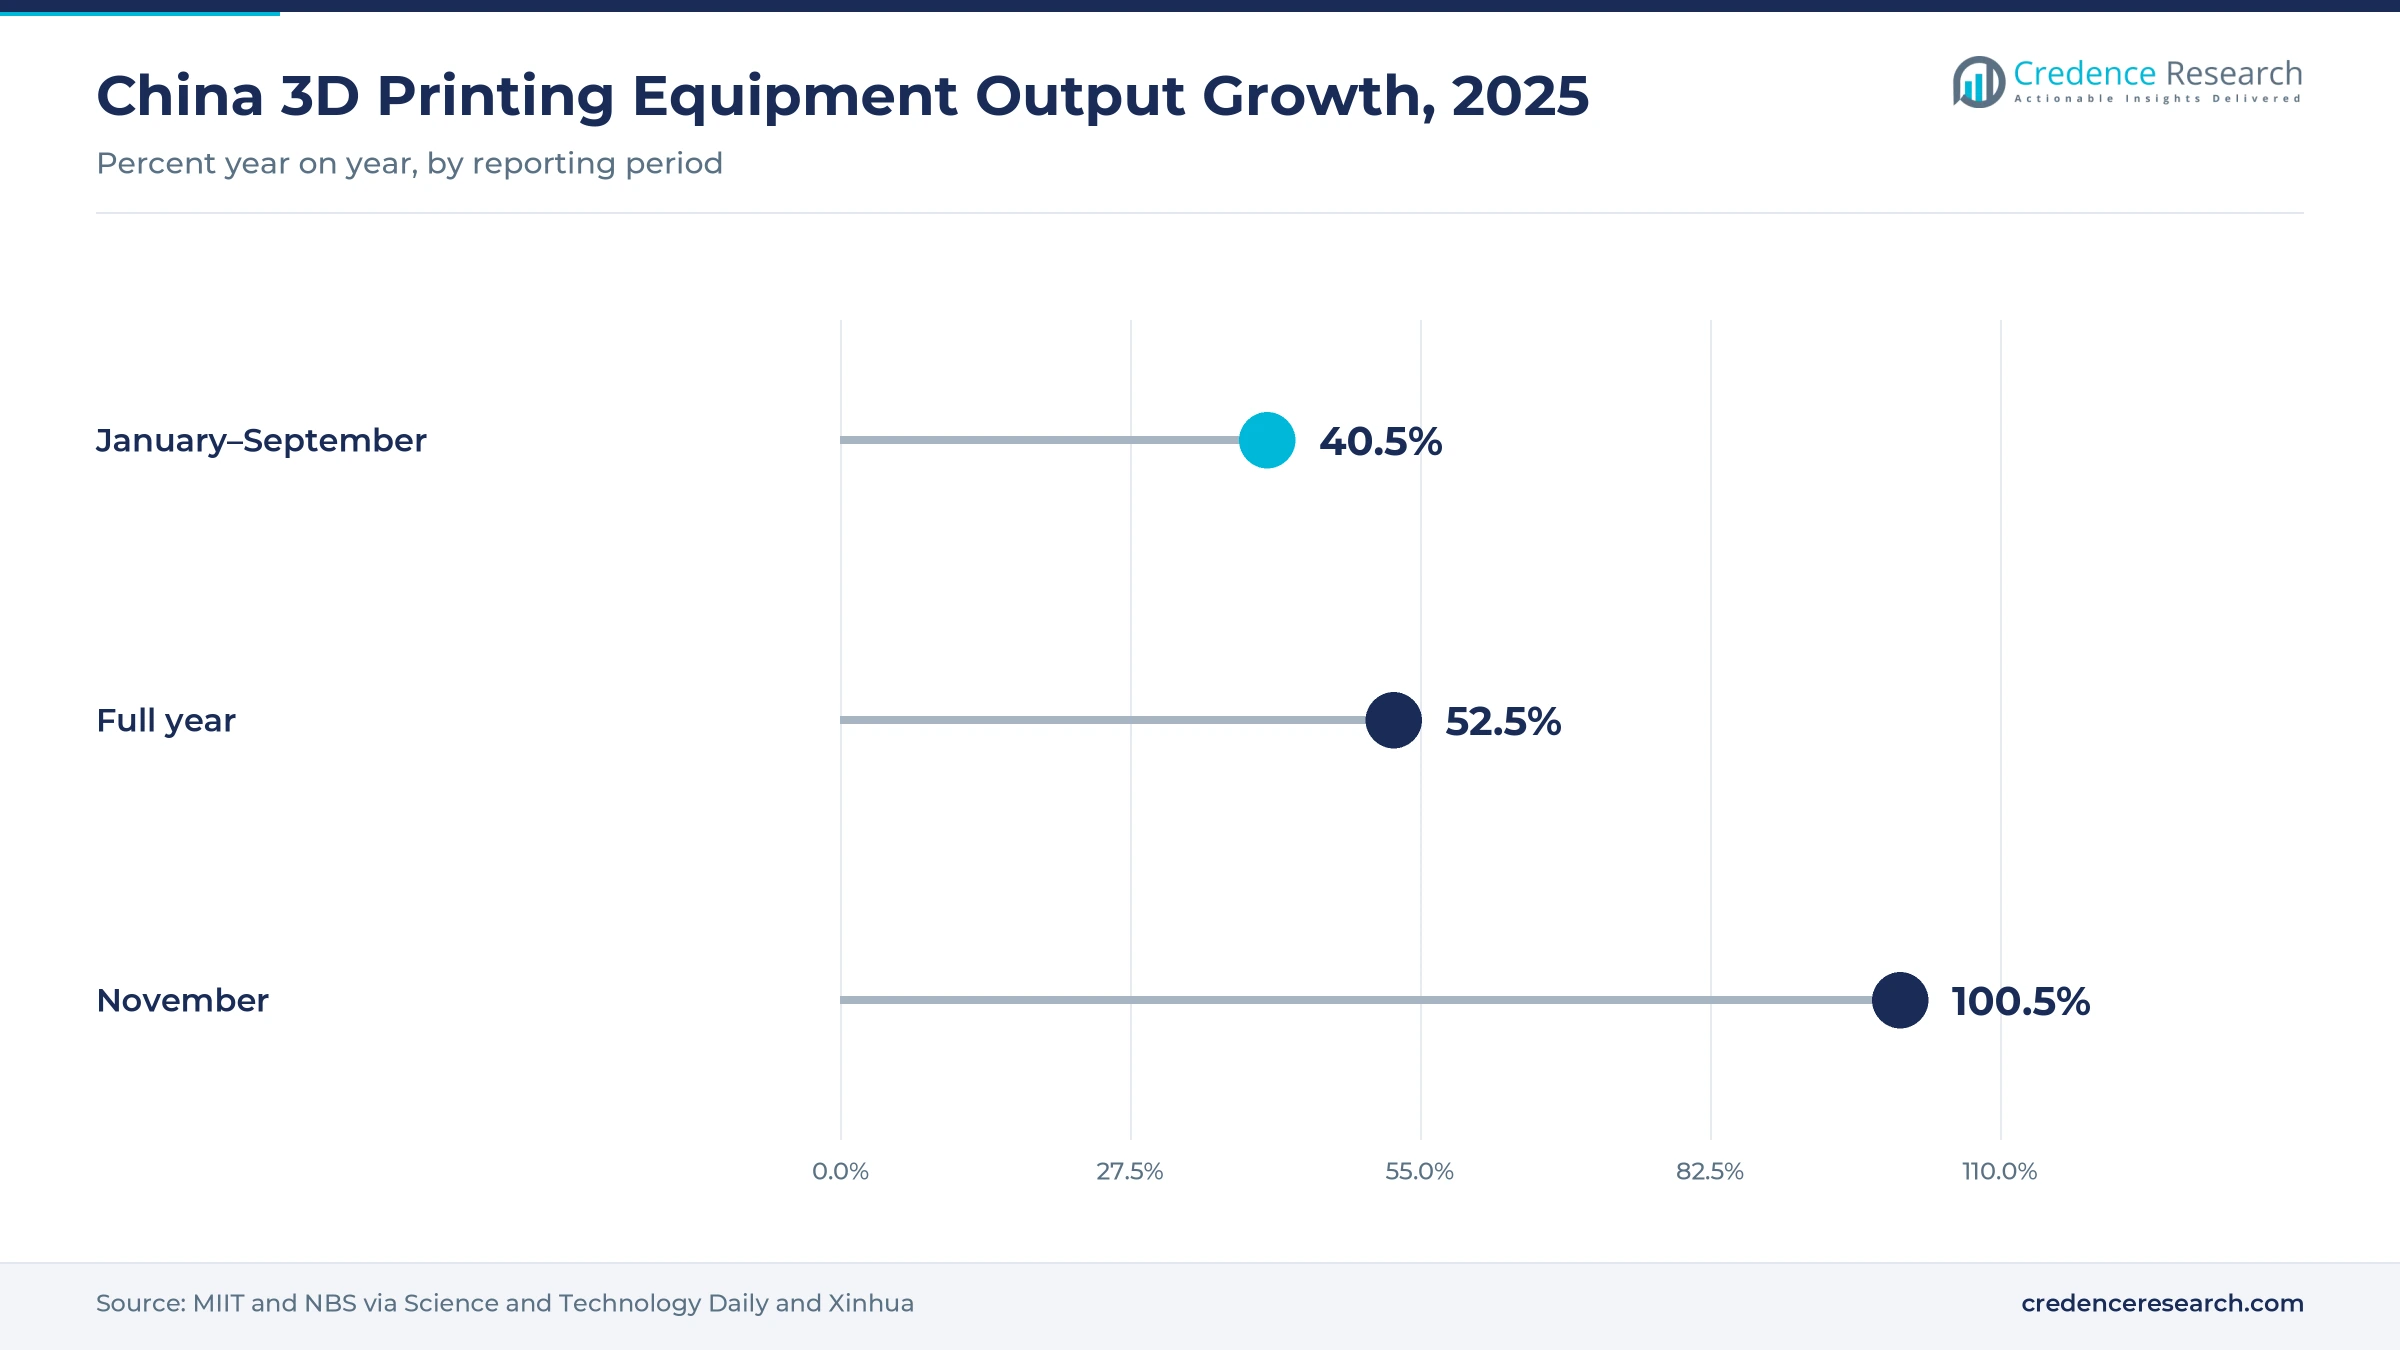
China's output of 3D printing equipment rose 52.5% in 2025, the clearest sign of why the Asia Pacific 3D printing market reached USD 5.20 billion in 2025. Credence Research forecasts USD 35.54 billion by 2035, a 21.20% CAGR over 2026–2035, with 2026 estimated at USD 6.30 billion. The region both makes most of the world's desktop printers and is building a large base of industrial metal printers for aerospace, tooling and electronics.
Two tiers drive the market. Consumer and prosumer printers sell in millions of units at low prices, while industrial metal and polymer systems account for most of the value.
What does the market cover?
The market covers printers, materials, software and services bought in Asia Pacific. The scope includes:
- Material extrusion, powder bed fusion, vat photopolymerization, binder jetting and directed energy deposition systems.
- Polymer, metal, ceramic and composite materials, design and build software, and part-printing services.
- Prototyping, tooling, functional and end-use parts and MRO across automotive, aerospace and defense, healthcare, electronics, industrial and consumer users.
The scope excludes stand-alone 3D scanners, CAD software with no printing link and tissue bioprinting. Values are in USD billion at current prices, allocated to the country of the buyer, so printers made in China and exported elsewhere are not counted. Bioprinting is covered in the Asia Pacific 3D bioprinting market.
How was the estimate built?
All figures are Credence Research estimates, built from official equipment output data, installed printers by country, material consumption, service-bureau capacity and supplier disclosures.
Which standard sets the terms?
Process names follow ISO/ASTM 52900:2021, the additive manufacturing vocabulary standard, which was reviewed and confirmed in 2025, according to ISO.
Report Attributes
| Attribute | Details |
|---|---|
| Historical Period | 2018–2024 |
| Base Year | 2025 |
| Forecast Period | 2026–2035 |
| Market Size 2025 | USD 5.20 billion |
| Market Size 2026 (estimate) | USD 6.30 billion |
| Market Size 2035 (forecast) | USD 35.54 billion |
| CAGR (2026–2035) | 21.20% |
| Segments Covered | By Offering, By Technology, By Material, By Application, By End Use |
| Countries Covered | China, Japan, South Korea, India, Australia, Southeast Asia, Rest of Asia Pacific |
| Companies Covered | Stratasys Ltd., 3D Systems Corporation, EOS GmbH, HP Inc., Farsoon Technologies, BLT (Xi'an Bright Laser Technologies), Materialise NV, Nikon SLM Solutions, Bambu Lab, Formlabs |
APAC 3D Printing Market Insights
- The Asia Pacific 3D printing market was worth USD 5.20 billion in 2025 and is forecast to reach USD 35.54 billion by 2035, a 21.20% CAGR over 2026–2035.
- Credence Research estimates the market at USD 6.30 billion in 2026, the current year.
- Manufacturing localization and Industry 4.0 investment is the strongest driver, adding about 5.8 percentage points to the forecast CAGR.
- Powder bed fusion leads technologies with 38.0%; metals grow fastest by material at 24.34%.
- China holds 48.0% of value; India grows fastest at 26.19%.
- Aerospace and defense leads end uses with 20.0% and grows fastest at 23.81%.
Industrial Powder Bed Printers for Aerospace and Tooling Hold the Largest Share
Which offering leads?
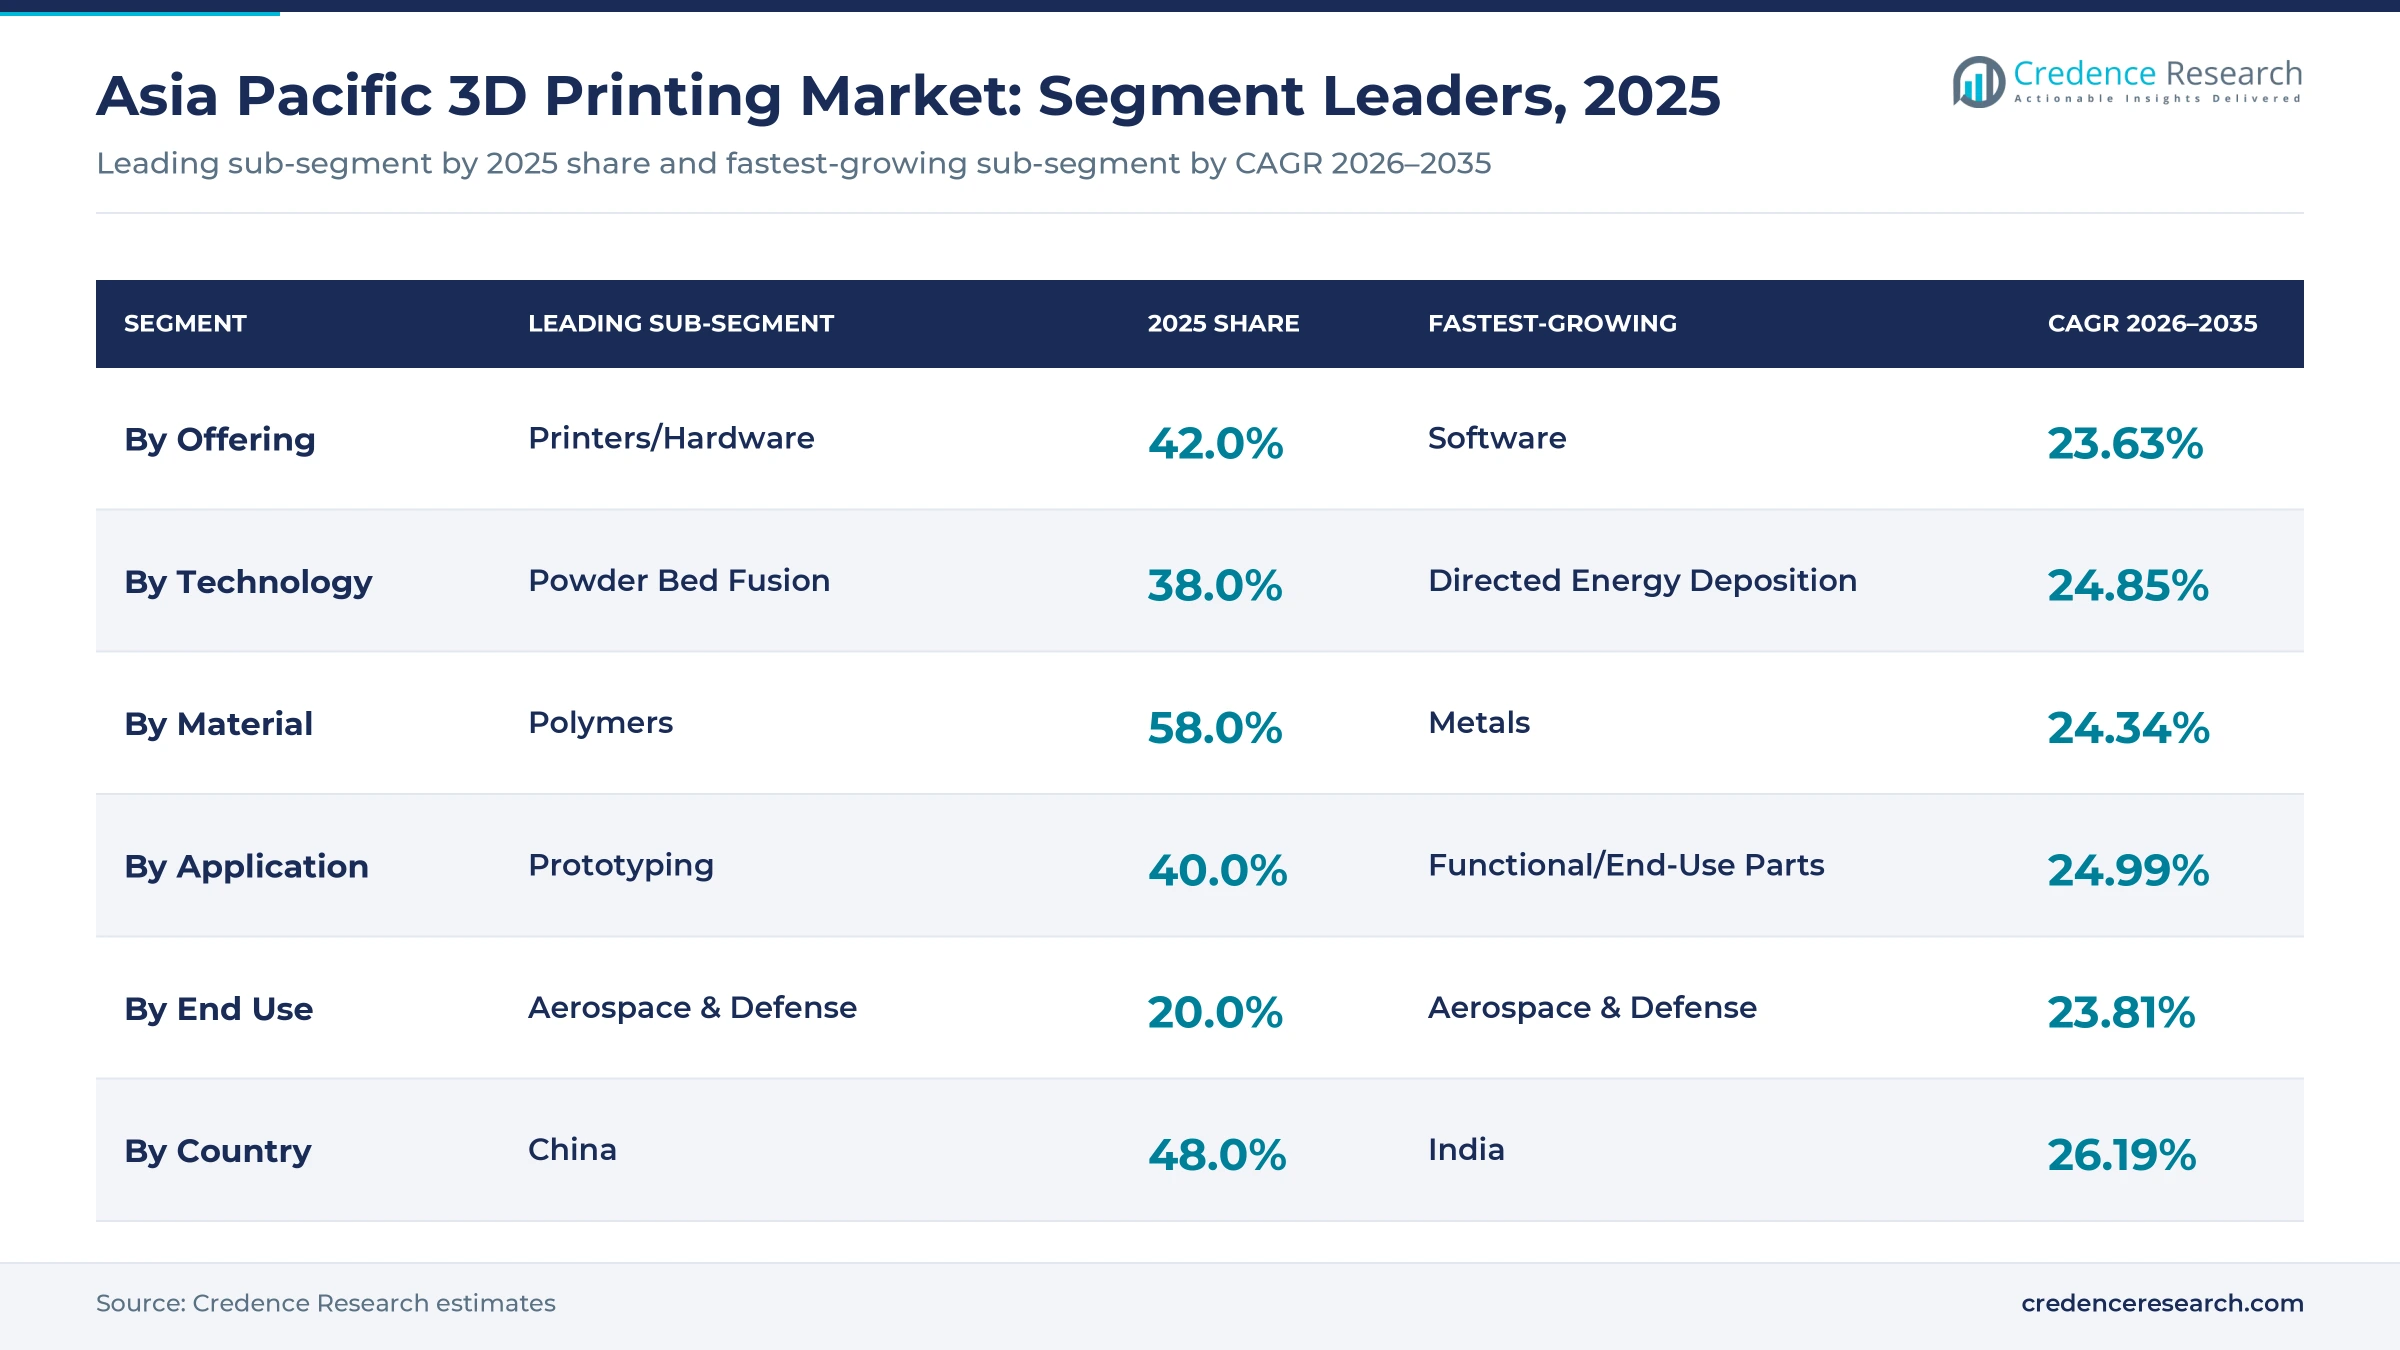
Printers and hardware lead with a 42.0% share in 2025, followed by materials and services. Software grows fastest at 23.63%.
Which technology leads?
Powder bed fusion leads with 38.0%, ahead of material extrusion, vat photopolymerization, binder jetting and directed energy deposition. Directed energy deposition grows fastest at 24.85% for large metal parts.
Which material leads?
Polymers lead with 58.0%, while metals grow fastest at 24.34%.
Which application and end use lead?
Prototyping leads applications with 40.0%, while functional and end-use parts grow fastest at 24.99%. Aerospace and defense leads end uses with 20.0% and grows fastest at 23.81%. Industrial printer demand is tracked in the industrial 3D printing market.
| Segment Group | Leading Sub-segment | 2025 Share | Fastest-growing Sub-segment | CAGR 2026–2035 |
|---|---|---|---|---|
| By Offering | Printers/Hardware | 42.0% | Software | 23.63% |
| By Technology | Powder Bed Fusion | 38.0% | Directed Energy Deposition | 24.85% |
| By Material | Polymers | 58.0% | Metals | 24.34% |
| By Application | Prototyping | 40.0% | Functional/End-Use Parts | 24.99% |
| By End Use | Aerospace & Defense | 20.0% | Aerospace & Defense | 23.81% |
Request a Free Sample
Fill in your details and we'll send you a free sample report.
- Sample data tables & charts
- Research methodology
Industrial Policy, Factory Adoption and National Programs Drive Growth
Why does manufacturing localization matter most? (~+5.8% impact on forecast CAGR)
Manufacturing localization and Industry 4.0 investment across Asia Pacific is the strongest driver, adding about 5.8 percentage points to the forecast CAGR. China's additive manufacturing industry grew from RMB 20.8 billion to about RMB 70 billion over the 2021–2025 plan period, according to the Additive Manufacturing Alliance of China as reported by Xinhua. The Ministry of Industry and Information Technology reported equipment output up 100.5% year on year in November 2025 and printer and part exports above RMB 10 billion in the first 11 months, as reported by Science and Technology Daily. Powder bed fusion leads technologies with a 38.0% share, and printers and hardware lead offerings with 42.0%. Local supply chains for metal powders, lasers and control software lower equipment prices, which lets mid-sized factories buy industrial printers that were once affordable only for aerospace groups.
How do electronics, automotive and industry add demand? (~+4.5% impact on forecast CAGR)
Electronics, automotive and industrial adoption adds about 4.5 percentage points to the forecast CAGR. Factories print jigs, fixtures, heat exchangers and short-run parts, and contract printing farms are scaling up; one Shenzhen service provider runs about 5,000 printers and plans 10,000. Chinese metal printer makers report growth led by aerospace and civil customized parts. Functional and end-use parts are the fastest-growing application at 24.99% a year, and metals the fastest-growing material at 24.34%.
What role do government programs play? (~+3.3% impact on forecast CAGR)
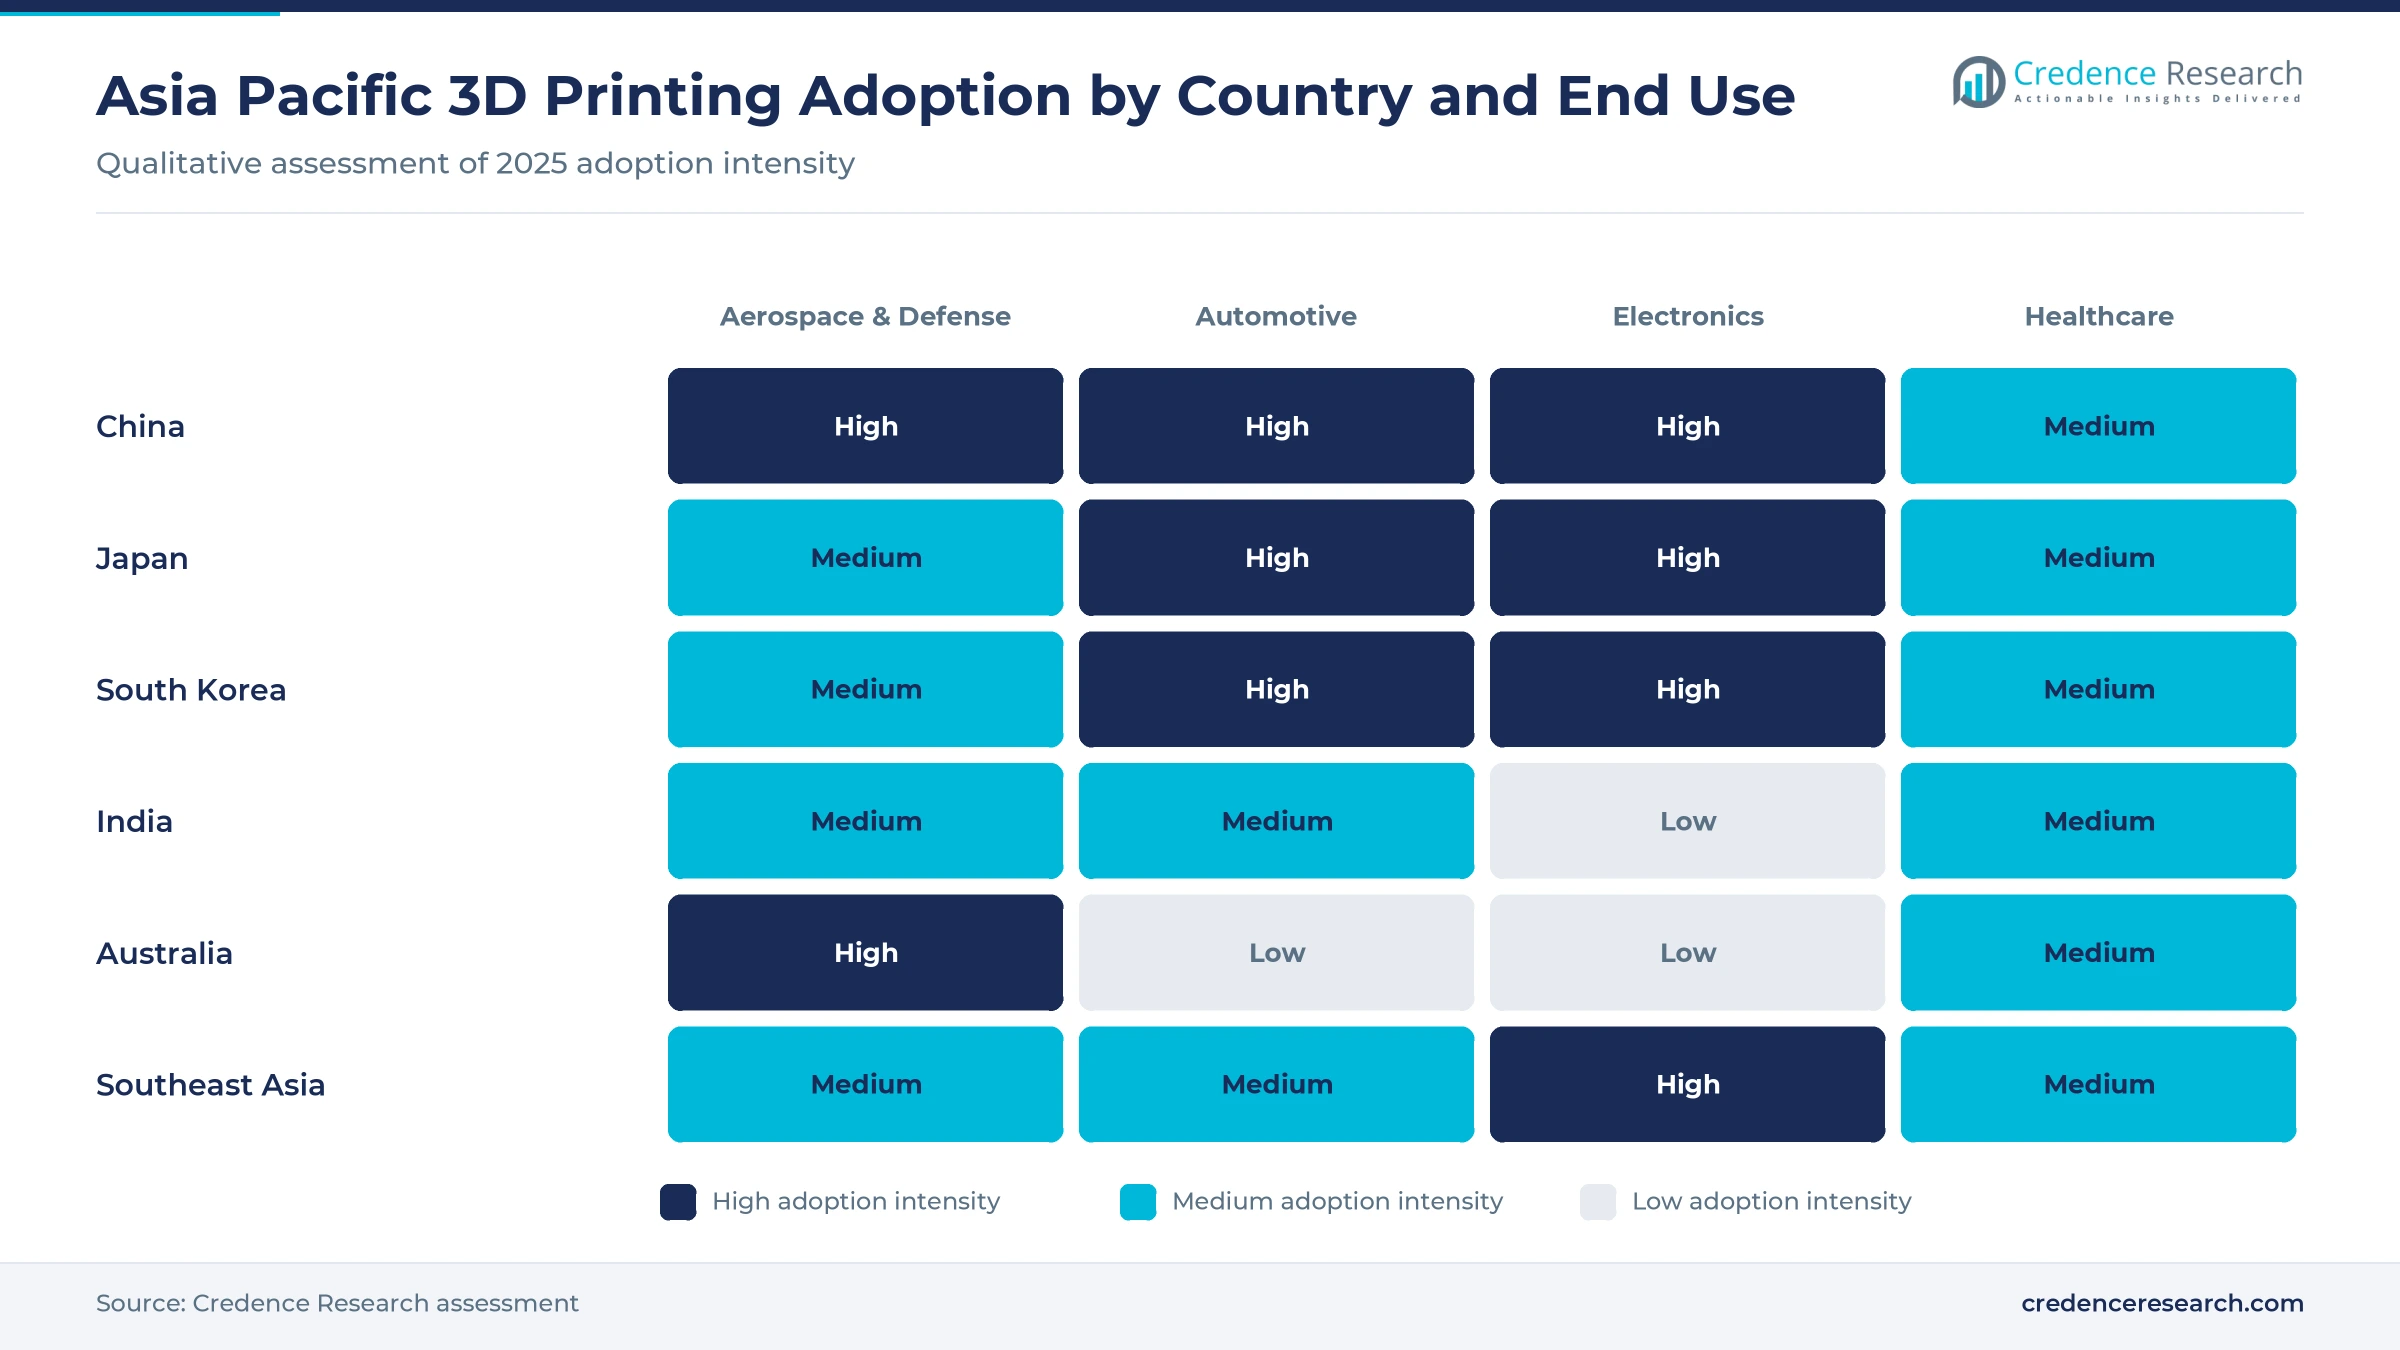
Government incentives, domestic ecosystems and R&D programs add about 3.3 percentage points to the forecast CAGR. India's National Strategy on Additive Manufacturing set goals including 100,000 trained workers and a 5% share of the global market. Singapore's EDB reported that local firms made up about 40% of the ASEAN additive manufacturing market, according to EDB Singapore. South Korea's trade ministry funds a project of about USD 13 million for printed automotive parts in Ulsan, and Australia's AML3D supplies large printed metal parts for US Navy submarines. Aerospace and defense leads end uses with 20.0% and grows fastest at 23.81%.
Metal Printing Scale-Up, Consumer Printer Leadership and Exports
Trend 1: Is metal printing scaling fastest?
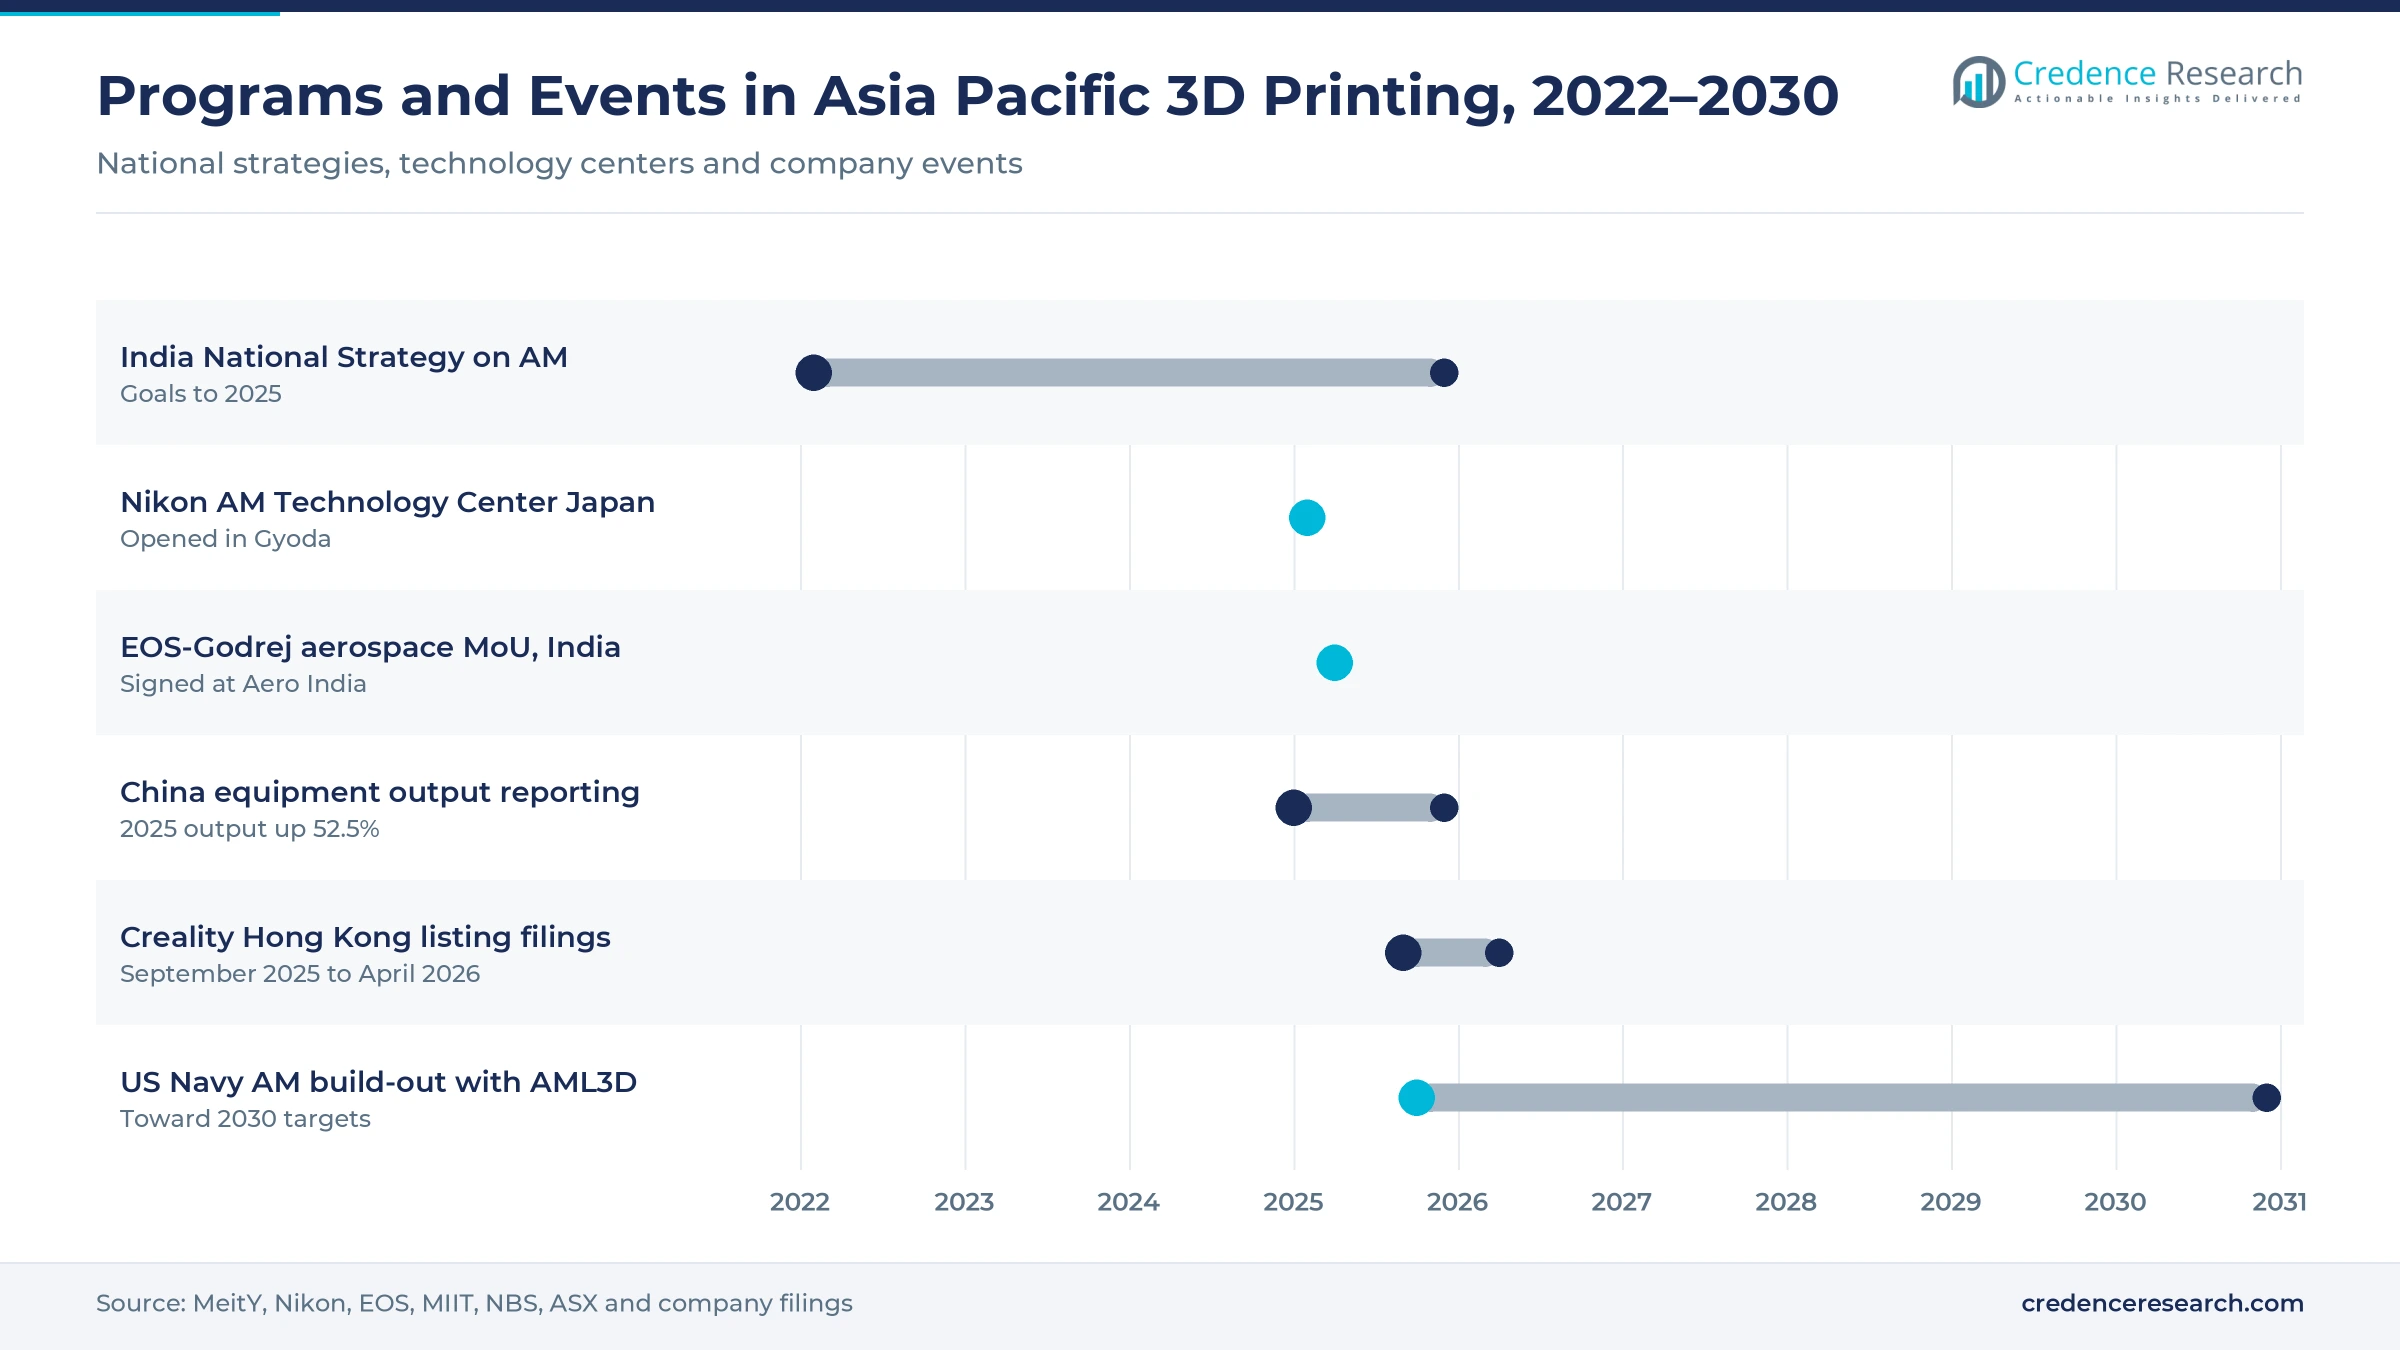
Yes. Chinese makers of large multi-laser metal printers serve aerospace, space and tooling customers, and Japan's Nikon opened an additive manufacturing technology center in Gyoda in February 2025 for metal printing R&D and customer support, according to Nikon.
Trend 2: Does the region lead consumer printers?
Yes. Shenzhen-based Bambu Lab held about 37% of the entry-level printer segment in 2025, and Creality filed to list in Hong Kong. Material extrusion remains a large technology, though its value grows more slowly than metal.
Trend 3: Are global suppliers deepening local ties?
Yes. EOS signed a memorandum with Godrej Enterprises at Aero India 2025 to build aerospace printing capability, and Formlabs showed its first large industrial SLS system at a partner summit in Shenzhen in July 2026.
Trend 4: Is software growing fastest?
Yes. Software grows fastest by offering at 23.63% a year as firms manage build preparation, simulation and print farms. Metal demand is tracked in the metal additive manufacturing market.
Price Wars, Thin Margins and Trade Risk Weigh on Suppliers
Are consumer printer makers under pressure?
Yes. Intense price competition among desktop printer makers has squeezed margins, and some leading brands reported losses despite higher sales.
Are industrial margins thin?
Partly. Chinese industrial printer makers grew sales quickly in 2025, but profit growth lagged as prices fell and competition rose.
Is trade policy a risk?
Yes. US defense rules restrict printers from covered foreign countries, and buyers in some markets are wary of Chinese equipment, which may limit export-led scale.
Is adoption in mass production still low?
Yes. Singapore's national additive manufacturing cluster has said that printing makes up less than 0.1% of global mass production, so most factory output still relies on molding, casting and machining.
Where are the opportunities?
Qualified metal printing for aerospace, defense and energy, and printed tooling for electronics and automotive plants, offer the clearest growth. Suppliers that pair printers with certified materials and process data can win long-term contracts. The execution risk is meeting export rules and quality standards in each country.
China Leads, India Grows Fastest
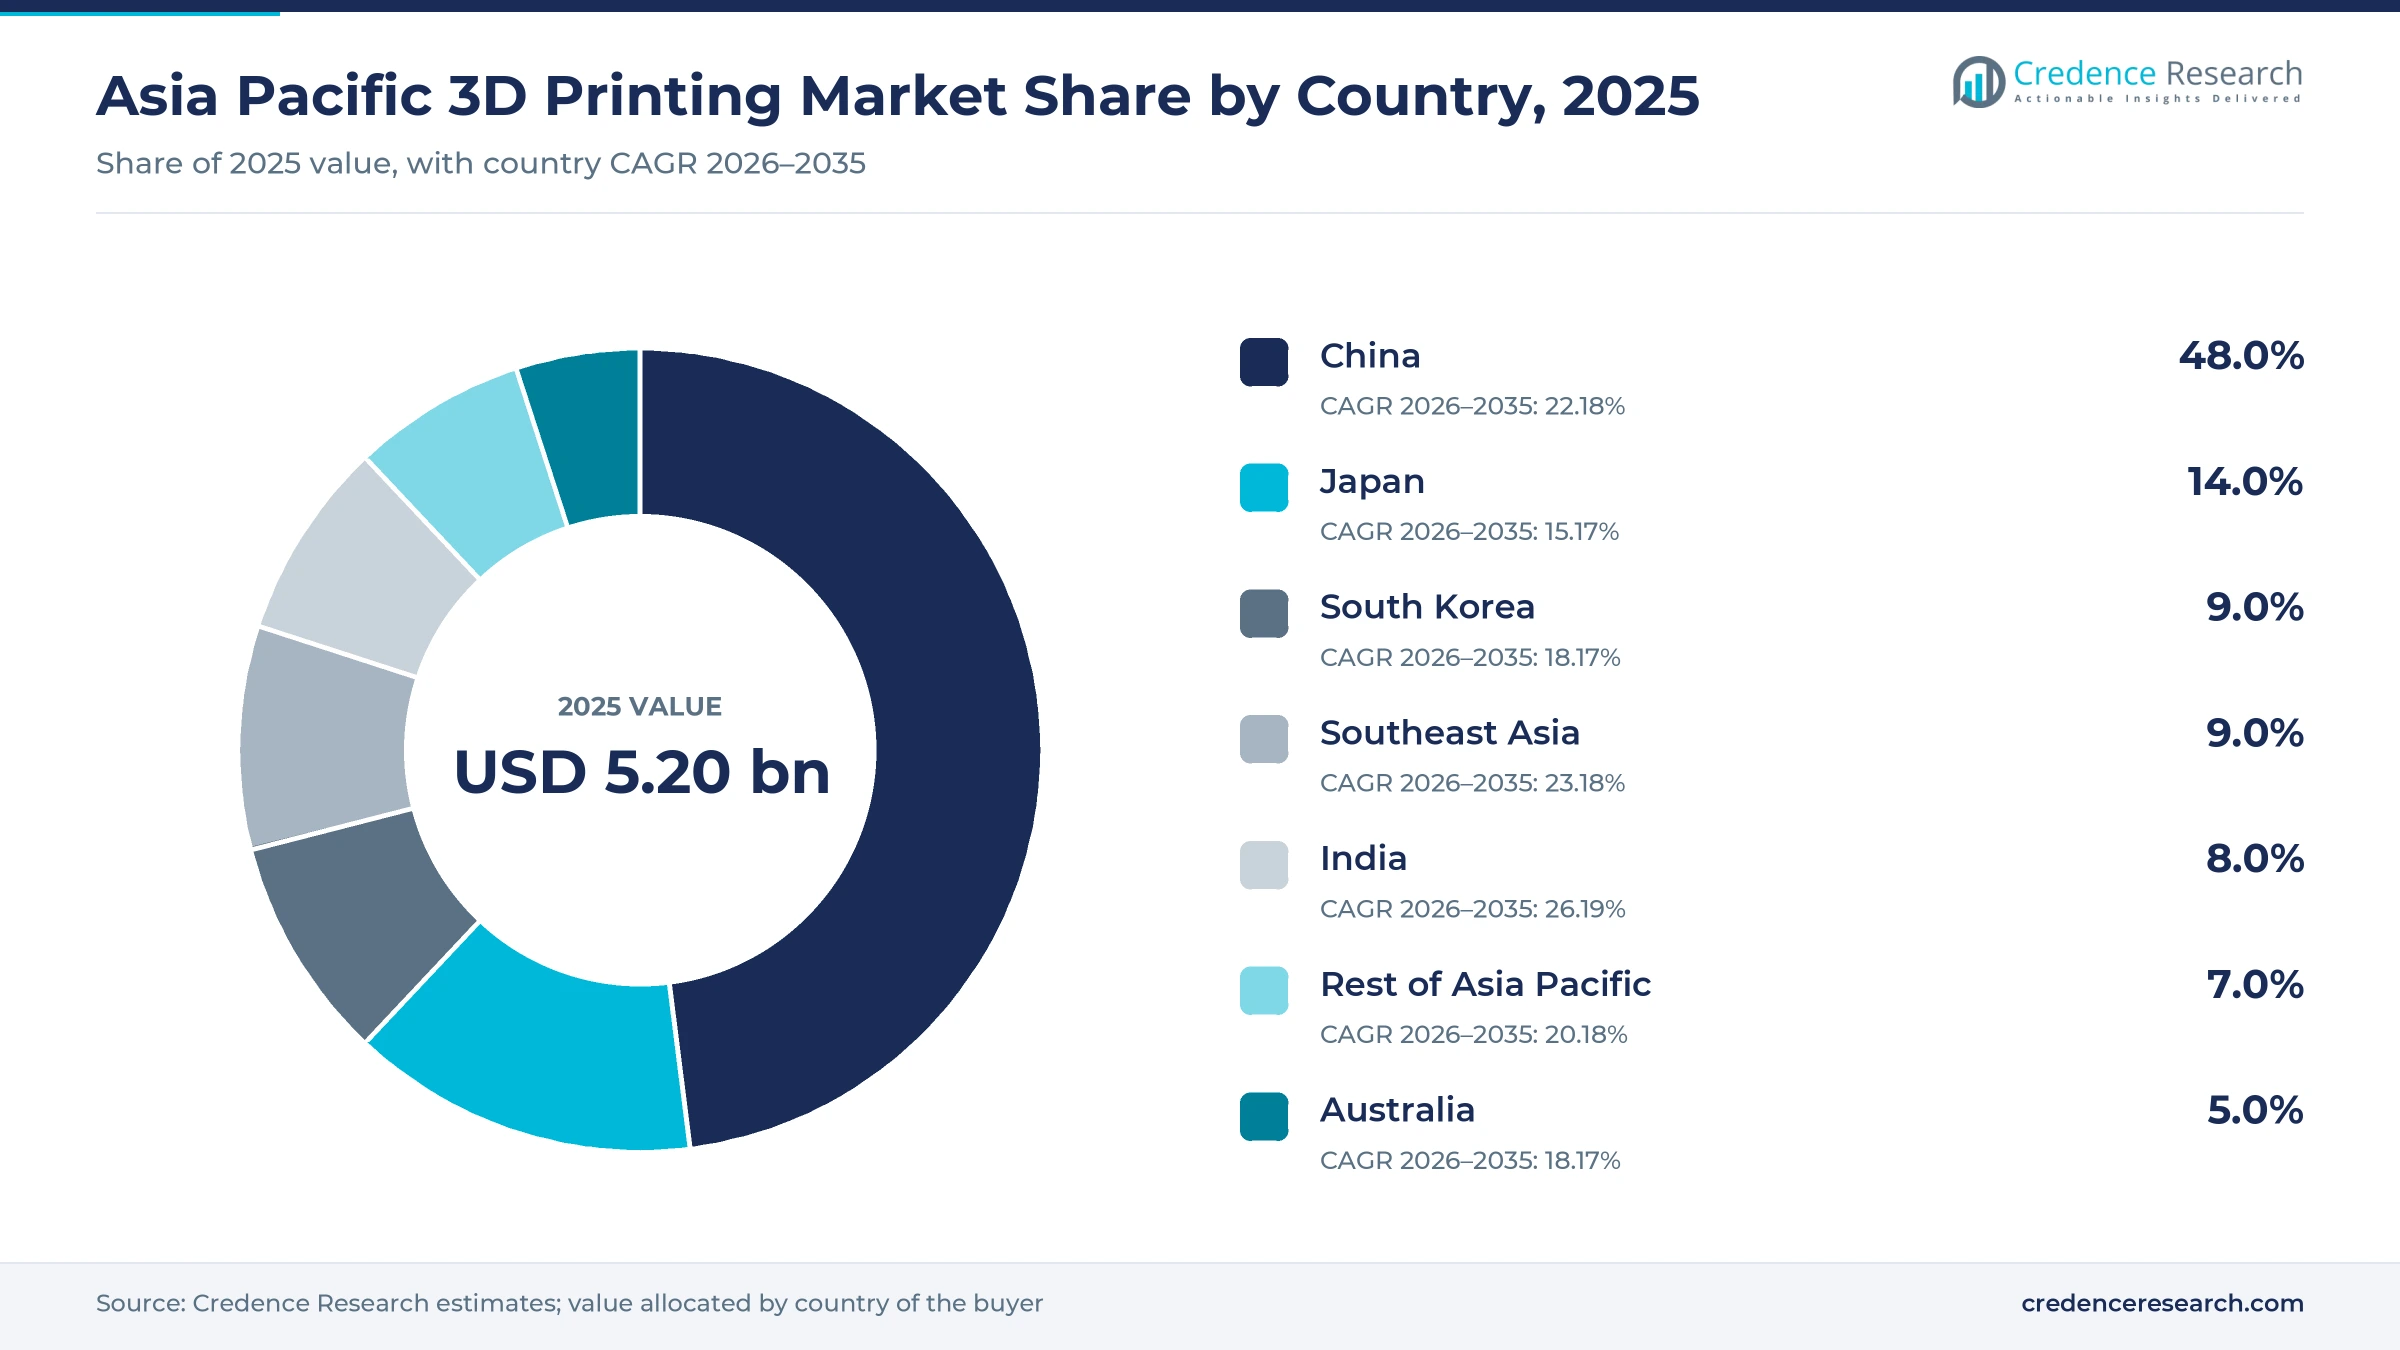
Asia Pacific 3D printing value is allocated to the country of the buyer.
| Country | Share 2025 | CAGR 2026–2035 |
|---|---|---|
| China | 48.0% | 22.18% |
| Japan | 14.0% | 15.17% |
| South Korea | 9.0% | 18.17% |
| Southeast Asia | 9.0% | 23.18% |
| India | 8.0% | 26.19% |
| Rest of Asia Pacific | 7.0% | 20.18% |
| Australia | 5.0% | 18.17% |
Why does China lead?
China holds a 48.0% share in 2025 and grows at 22.18% a year. It hosts the largest base of industrial metal printers, the main consumer printer makers and large print farms, supported by national manufacturing policy.
Why does India grow fastest?
India holds 8.0% and is the fastest-growing country at 26.19% a year. Its national strategy, aerospace partnerships and growing medical and automotive use lift demand from a small base.
What shapes Japan and South Korea?
Japan holds 14.0% and grows at 15.17%, led by automotive and machinery makers and Nikon's metal printing work. South Korea holds 9.0% and grows at 18.17%, with programs for printed vehicle parts and electronics.
What about Australia, Southeast Asia and the rest of the region?
Australia holds 5.0% and grows at 18.17%, where firms such as AML3D build large wire-arc metal printers. Southeast Asia holds 9.0% and grows at 23.18%, led by Singapore. The rest of Asia Pacific holds 7.0% and grows at 20.18%.
Orders, Centers and Product Launches, 2025–2026
| Development | Status and why it matters |
|---|---|
| In September 2026, AML3D signed an initial production order with Austal USA for three large copper-nickel parts for US Navy submarines. | Ordered. Shows Australian metal printing exports. |
| In July 2026, Formlabs showed its Fuse X1 industrial SLS system at its Asia Pacific partner summit in Shenzhen. | Launched. Adds industrial polymer capacity. |
| In April 2026, Creality filed an updated application to list in Hong Kong. | Filed. Shows scale of desktop printer makers. |
| In March 2026, AML3D signed an order of about AUD 2.61 million for five submarine parts through the BlueForge Alliance. | Contracted. Expands defense demand. |
| In February 2026, Xinhua reported that China's 3D printing equipment output rose 52.5% in 2025. | Reported. Confirms rapid scale-up. |
| In December 2025, MIIT announced that equipment output rose 100.5% year on year in November 2025. | Reported. Signals strong year-end demand. |
| In April 2025, EOS and Godrej Enterprises signed an MoU to build aerospace printing capability in India. | Signed. Supports India's aerospace supply chain. |
| In February 2025, Nikon opened the Nikon AM Technology Center Japan in Gyoda. | Opened. Adds metal printing support in Asia. |
Need a Custom Version of This Report?
Tailor the scope, geography, or segments to your exact requirements.
- Custom geography or segment scope
- Direct access to our analyst team
Chinese Metal and Desktop Makers Compete With Global Industrial Suppliers
The market mixes fast-growing Chinese printer makers with global industrial suppliers and software firms. No share ranking is given because suppliers do not report regional sales on a consistent basis.
Who are the leading regional makers?
BLT (Xi'an Bright Laser Technologies) makes large metal powder bed printers, metal powders and aerospace parts. Farsoon Technologies makes polymer and metal powder bed systems and sells them in China and abroad. Bambu Lab leads entry-level desktop printers with about 37% of that segment in 2025. Nikon SLM Solutions, owned by Nikon of Japan, makes large metal printers and runs a technology center in Japan.
Who are the global industrial suppliers?
EOS GmbH supplies metal and polymer powder bed systems and is working with Godrej in India. HP Inc. sells Multi Jet Fusion polymer printers and has a large manufacturing campus in Singapore. Stratasys Ltd. and 3D Systems Corporation sell polymer and metal printers through regional offices and partners. Formlabs sells desktop resin and SLS printers and launched a large SLS system, showing it in Shenzhen.
Who supplies software?
Materialise NV supplies build-preparation software and medical planning services rather than printers. Its tools are used by hospitals and service bureaus across the region to prepare patient-specific models and manage printer fleets.
How do suppliers compete?
Chinese suppliers compete on price, build size and delivery speed, while global firms compete on qualified materials, process data and service. Export rules and customer qualification increasingly decide which suppliers win aerospace and defense work, and print farms reward makers that offer reliable machines, remote management software and low material costs.
Frequently Asked Questions
How big is the Asia Pacific 3D printing market?
What drives the market?
Which country leads?
Which technology leads?
Which application grows fastest?
What holds the market back?
Table of Content
Chapter 1 Market Segmentation
- 1.1 Segmentation Framework
- 1.1.1 Product and Service Classification
- 1.1.2 Application and End-Use Classification
- 1.1.3 Technology and Solution Classification
- 1.1.4 Customer and Distribution Channel Classification
- 1.1.5 Geographic Segmentation
- 1.1.6 Market Segment Definitions and Boundaries
- 1.2 By Offering
- 1.2.1 Printers/Hardware
- 1.2.2 Materials
- 1.2.3 Software
- 1.2.4 Services
- 1.3 By Technology
- 1.3.1 Material Extrusion/FDM
- 1.3.2 Powder Bed Fusion
- 1.3.3 Vat Photopolymerization
- 1.3.4 Binder Jetting
- 1.3.5 Directed Energy Deposition
- 1.4 By Material
- 1.4.1 Polymers
- 1.4.2 Metals
- 1.4.3 Ceramics
- 1.4.4 Composites
- 1.5 By Application
- 1.5.1 Prototyping
- 1.5.2 Tooling
- 1.5.3 Functional/End-Use Parts
- 1.5.4 MRO
- 1.6 By End Use
- 1.6.1 Automotive
- 1.6.2 Aerospace & Defense
- 1.6.3 Healthcare
- 1.6.4 Electronics
- 1.6.5 Industrial
- 1.6.6 Consumer
- 1.7 By Country
- 1.7.1 China
- 1.7.2 Japan
- 1.7.3 South Korea
- 1.7.4 India
- 1.7.5 Australia
- 1.7.6 Southeast Asia
- 1.7.7 Rest of Asia Pacific
Chapter 2 Introduction
- 2.1 Report Objectives and Scope
- 2.2 Product Definition and Industry Terminology
- 2.3 Market Inclusions and Exclusions
- 2.4 Research Process
- 2.4.1 Primary Research and Expert Interviews
- 2.4.2 Secondary Research and Source Review
- 2.4.3 Top-Down and Bottom-Up Estimation
- 2.4.4 Data Triangulation and Verification
- 2.5 Market Size Measurement Basis
- 2.5.1 2025: USD 5.20 billion → 2035: USD 35.54 billion
- 2.6 Historical and Forecast Reference Periods
- 2.6.1 Historical Period: 2018-2025
- 2.6.2 Base Year: 2025
- 2.6.3 Forecast Period: 2025-2035
- 2.7 Research Assumptions and Limitations
Chapter 3 Executive Summary
- 3.1 Market Snapshot and Key Findings
- 3.2 Base-Year Market Size, 2025
- 3.3 Forecast Market Size, 2035
- 3.4 Revenue and Volume Growth Outlook
- 3.5 Key Demand and Supply Indicators
- 3.6 Leading Market Segments
- 3.7 Fastest-Growing Market Opportunities
- 3.8 Regional Performance Highlights
- 3.9 Technology and Industry Transformation
- 3.10 Competitive Landscape Summary
- 3.11 Analyst View and Strategic Implications
Chapter 4 Global APAC 3D Printing Market Trends and Developments
- 4.1 Historical Industry Development, 2018-2025
- 4.2 Recent Market Trends and Developments
- 4.3 Demand and Customer Behavior Trends
- 4.4 Technology and Product Innovation
- 4.5 Artificial Intelligence, Automation and Digitalization
- 4.6 Local Manufacturing and Supply Chain Realignment
- 4.7 Industry Partnerships, Mergers and Acquisitions
- 4.8 Sustainability and Circular Economy Developments
- 4.9 Government and Private Sector Investment Trends
- 4.10 Emerging Business Models and Commercialization
- 4.11 Industry Developments and Announcements
Chapter 5 Global APAC 3D Printing Market Production, Supply and Demand Analysis
- 5.1 Demand Trend and Consumption Analysis, 2018-2025
- 5.2 Demand Forecast, 2025-2035
- 5.3 Production and Output Trend, 2018-2025
- 5.4 Production and Output Forecast, 2025-2035
- 5.5 Installed Capacity and Capacity Utilization
- 5.6 Company-Wise Production Plants and Statistics
- 5.6.1 Installed Production Capacity
- 5.6.2 Actual Production
- 5.6.3 Planned Capacity and Expansion Targets
- 5.7 Supply Chain Structure and Procurement Trends
- 5.8 Supply-Demand Gap and Bottlenecks
- 5.9 Import Dependence and Sourcing Structure
- 5.10 Contract Manufacturing and Outsourcing
- 5.11 Regional Supply and Demand Concentration
Chapter 6 Global APAC 3D Printing Market Pricing Analysis
- 6.1 Pricing Structure and Measurement
- 6.2 Historical Pricing Trends, 2018-2025
- 6.3 Pricing Outlook, 2025-2035
- 6.4 Average Selling Price and Unit Economics
- 6.5 Pricing by Product and Market Segment
- 6.6 Geographic Pricing Differences
- 6.7 Key Input, Energy, Labor and Logistics Costs
- 6.8 Contract Pricing and Purchasing Models
- 6.9 Pricing Sensitivity and Competitive Positioning
- 6.10 Price, Margin and Profitability Implications
Chapter 7 Global APAC 3D Printing Market Dynamics
- 7.1 Market Growth Drivers
- 7.1.1 Demand-Side Drivers
- 7.1.2 Technology and Innovation Drivers
- 7.1.3 Infrastructure and Investment Drivers
- 7.1.4 Regulatory and Policy Drivers
- 7.2 Market Restraints
- 7.2.1 Cost and Affordability Constraints
- 7.2.2 Technology and Adoption Barriers
- 7.2.3 Supply Chain and Operational Constraints
- 7.3 Market Challenges
- 7.3.1 Competitive Pressure and Margin Erosion
- 7.3.2 Skills, Infrastructure and Implementation Gaps
- 7.4 Emerging Market Opportunities
- 7.5 Market Dynamics Impact and Time-Horizon Assessment
Chapter 8 Global APAC 3D Printing Value Chain Analysis
- 8.1 Industry Value Chain Overview
- 8.2 Upstream Suppliers and Critical Inputs
- 8.3 Technology and Component Providers
- 8.4 Manufacturing or Service Delivery
- 8.5 Distribution, Channel Partners and Integrators
- 8.6 Downstream Applications and End Users
- 8.7 Value Addition and Profit Pools
- 8.8 Vertical Integration and Outsourcing
- 8.9 Supplier Concentration and Risk
- 8.10 Supply Chain Localization and Resilience
Chapter 9 Global APAC 3D Printing Market Regulations and Policies
- 9.1 Relevant Laws, Standards and Compliance Frameworks
- 9.2 Product, Service, Safety and Quality Requirements
- 9.3 Government Policies, Incentives and Subsidies
- 9.4 Imports, Exports and Trade Barriers
- 9.5 Public Procurement and Local Content Requirements
- 9.6 Environmental and Sustainability Compliance
- 9.7 Upcoming Policy Changes and Market Implications
Chapter 10 Global APAC 3D Printing Market Hotspots and Opportunities
- 10.1 Market Opportunity Mapping and Growth Hotspots
- 10.2 High-Growth Applications and Customer Groups
- 10.3 Underserved Markets and White-Space Opportunities
- 10.4 Emerging Technology and Product Opportunities
- 10.5 New Capacity and Investment Hotspots
- 10.6 Market Entry and Expansion Opportunities
- 10.7 Distribution and Partnership Opportunities
- 10.8 Near-Term and Long-Term Commercial Potential
- 10.9 Opportunity Attractiveness and Execution Risks
Chapter 11 Global APAC 3D Printing Market Outlook, 2025-2035
- 11.1 Market Size and Analysis
- 11.1.1 Revenue (Market Measurement: 2025: USD 5.20 billion → 2035: USD 35.54 billion)
- 11.1.2 Market Volume and Quantity Sold
- 11.1.3 Historical Market Size, 2018-2025
- 11.1.4 Base-Year Market Size, 2025
- 11.2 Market Forecast, 2025-2035
- 11.2.1 Revenue Forecast to 2035
- 11.2.2 Volume Forecast to 2035
- 11.2.3 CAGR and Year-on-Year Growth
- 11.2.4 Incremental Revenue Opportunity
- 11.3 Forecast Assumptions and Scenario Analysis
- 11.3.1 Base-Case Forecast
- 11.3.2 Optimistic and Conservative Scenarios
- 11.3.3 Technology, Pricing and Policy Sensitivities
- 11.4 Market Attractiveness and Growth Outlook
Chapter 12 Global APAC 3D Printing Market Segmentation and Outlook
- 12.1 Segmentation Summary and Market Shares, 2025
- 12.2 Largest and Fastest-Growing Segments
- 12.3 By Offering - Market Size and Forecast, 2025-2035
- 12.3.1 Segment Definition and Scope
- 12.3.2 Historical Market Size, 2018-2025
- 12.3.3 Revenue Forecast, 2025-2035
- 12.3.4 Volume Forecast, 2025-2035
- 12.3.5 Base-Year Market Share, 2025
- 12.3.6 Segment CAGR and Growth Drivers
- 12.3.7 Subsegment Market Size and Forecast
- 12.3.7.1 Printers/Hardware
- 12.3.7.2 Materials
- 12.3.7.3 Software
- 12.3.7.4 Services
- 12.3.8 Subsegment Pricing and Adoption Trends
- 12.3.9 Leading Suppliers and Competition
- 12.3.10 Regional Demand and Opportunities
- 12.4 By Technology - Market Size and Forecast, 2025-2035
- 12.4.1 Segment Definition and Scope
- 12.4.2 Historical Market Size, 2018-2025
- 12.4.3 Revenue Forecast, 2025-2035
- 12.4.4 Volume Forecast, 2025-2035
- 12.4.5 Base-Year Market Share, 2025
- 12.4.6 Segment CAGR and Growth Drivers
- 12.4.7 Subsegment Market Size and Forecast
- 12.4.7.1 Material Extrusion/FDM
- 12.4.7.2 Powder Bed Fusion
- 12.4.7.3 Vat Photopolymerization
- 12.4.7.4 Binder Jetting
- 12.4.7.5 Directed Energy Deposition
- 12.4.8 Subsegment Pricing and Adoption Trends
- 12.4.9 Leading Suppliers and Competition
- 12.4.10 Regional Demand and Opportunities
- 12.5 By Material - Market Size and Forecast, 2025-2035
- 12.5.1 Segment Definition and Scope
- 12.5.2 Historical Market Size, 2018-2025
- 12.5.3 Revenue Forecast, 2025-2035
- 12.5.4 Volume Forecast, 2025-2035
- 12.5.5 Base-Year Market Share, 2025
- 12.5.6 Segment CAGR and Growth Drivers
- 12.5.7 Subsegment Market Size and Forecast
- 12.5.7.1 Polymers
- 12.5.7.2 Metals
- 12.5.7.3 Ceramics
- 12.5.7.4 Composites
- 12.5.8 Subsegment Pricing and Adoption Trends
- 12.5.9 Leading Suppliers and Competition
- 12.5.10 Regional Demand and Opportunities
- 12.6 By Application - Market Size and Forecast, 2025-2035
- 12.6.1 Segment Definition and Scope
- 12.6.2 Historical Market Size, 2018-2025
- 12.6.3 Revenue Forecast, 2025-2035
- 12.6.4 Volume Forecast, 2025-2035
- 12.6.5 Base-Year Market Share, 2025
- 12.6.6 Segment CAGR and Growth Drivers
- 12.6.7 Subsegment Market Size and Forecast
- 12.6.7.1 Prototyping
- 12.6.7.2 Tooling
- 12.6.7.3 Functional/End-Use Parts
- 12.6.7.4 MRO
- 12.6.8 Subsegment Pricing and Adoption Trends
- 12.6.9 Leading Suppliers and Competition
- 12.6.10 Regional Demand and Opportunities
- 12.7 By End Use - Market Size and Forecast, 2025-2035
- 12.7.1 Segment Definition and Scope
- 12.7.2 Historical Market Size, 2018-2025
- 12.7.3 Revenue Forecast, 2025-2035
- 12.7.4 Volume Forecast, 2025-2035
- 12.7.5 Base-Year Market Share, 2025
- 12.7.6 Segment CAGR and Growth Drivers
- 12.7.7 Subsegment Market Size and Forecast
- 12.7.7.1 Automotive
- 12.7.7.2 Aerospace & Defense
- 12.7.7.3 Healthcare
- 12.7.7.4 Electronics
- 12.7.7.5 Industrial
- 12.7.7.6 Consumer
- 12.7.8 Subsegment Pricing and Adoption Trends
- 12.7.9 Leading Suppliers and Competition
- 12.7.10 Regional Demand and Opportunities
- 12.8 By Country - Market Size and Forecast, 2025-2035
- 12.8.1 Segment Definition and Scope
- 12.8.2 Historical Market Size, 2018-2025
- 12.8.3 Revenue Forecast, 2025-2035
- 12.8.4 Volume Forecast, 2025-2035
- 12.8.5 Base-Year Market Share, 2025
- 12.8.6 Segment CAGR and Growth Drivers
- 12.8.7 Subsegment Market Size and Forecast
- 12.8.7.1 China
- 12.8.7.2 Japan
- 12.8.7.3 South Korea
- 12.8.7.4 India
- 12.8.7.5 Australia
- 12.8.7.6 Southeast Asia
- 12.8.7.7 Rest of Asia Pacific
- 12.8.8 Subsegment Pricing and Adoption Trends
- 12.8.9 Leading Suppliers and Competition
- 12.8.10 Regional Demand and Opportunities
- 12.9 Segment Growth Comparison
- 12.10 Segment Attractiveness and Priority Matrix
Chapter 13 Global APAC 3D Printing End-Use and Application Market Outlook
- 13.1 End-Use Industry and Customer Demand Structure
- 13.2 Leading Applications and Customer Groups
- 13.3 End-Use Market Size, Share and Forecast
- 13.4 Major End-Use Industry Deep Dives
- 13.4.1 Customer Requirements and Use Cases
- 13.4.2 Demand and Replacement Cycles
- 13.4.3 Technical and Regulatory Considerations
- 13.4.4 Purchasing and Procurement Models
- 13.4.5 Leading Vendors and Distribution Channels
- 13.4.6 Forecast and Commercial Opportunities
- 13.5 Emerging Applications and Cross-Segment Demand
- 13.6 End-Use Industry Investment Priorities
Chapter 14 Global APAC 3D Printing Geographic Market Outlook, 2025-2035
- 14.1 Regional Market Size and Share, 2025
- 14.2 Regional Market Forecast, 2025-2035
- 14.3 Regional Pricing, Production and Demand Differences
- 14.4 North America
- 14.4.1 United States
- 14.4.2 Canada
- 14.4.3 Mexico
- 14.5 Europe
- 14.5.1 Germany
- 14.5.2 France
- 14.5.3 Italy
- 14.5.4 United Kingdom
- 14.5.5 Spain
- 14.5.6 Poland
- 14.5.7 Russia
- 14.5.8 Netherlands
- 14.5.9 Belgium
- 14.5.10 Sweden
- 14.5.11 Denmark
- 14.5.12 Norway
- 14.5.13 Rest of Europe
- 14.6 Asia Pacific
- 14.6.1 China
- 14.6.2 India
- 14.6.3 Japan
- 14.6.4 South Korea
- 14.6.5 Thailand
- 14.6.6 Indonesia
- 14.6.7 Vietnam
- 14.6.8 Malaysia
- 14.6.9 Australia
- 14.6.10 Rest of Asia Pacific
- 14.7 Latin America
- 14.7.1 Brazil
- 14.7.2 Argentina
- 14.7.3 Colombia
- 14.7.4 Chile
- 14.7.5 Rest of Latin America
- 14.8 Middle East
- 14.8.1 Saudi Arabia
- 14.8.2 United Arab Emirates
- 14.8.3 Turkey
- 14.8.4 Israel
- 14.8.5 Iran
- 14.8.6 Rest of the Middle East
- 14.9 Africa
- 14.9.1 South Africa
- 14.9.2 Egypt
- 14.9.3 Nigeria
- 14.9.4 Morocco
- 14.9.5 Rest of Africa
- 14.10 Regional Investment, Policy and Supply Chain Differences
- 14.11 Regional Competitive Landscape
- 14.12 Geographic Growth Hotspots
Chapter 15 Global APAC 3D Printing Technology, Innovation and Sustainability Outlook
- 15.1 Technology Landscape and Maturity
- 15.2 Product, Process and Service Innovation
- 15.3 AI, Automation and Digital Tools in the Industry
- 15.4 Technology Adoption and Performance Benchmarking
- 15.5 Innovation Pipeline and R&D Investment
- 15.6 Patent and Intellectual Property Trends
- 15.7 Energy Efficiency and Resource Management
- 15.8 Sustainability, Recycling and Circularity
- 15.9 Technology Roadmap, 2025-2035
- 15.10 Risks of Obsolescence and Technology Substitution
Chapter 16 Global APAC 3D Printing Market Key Strategic Imperatives
- 16.1 Growth and Market Entry Priorities
- 16.2 High-Return Products and Segments
- 16.3 Pricing, Profitability and Cost Optimization
- 16.4 Technology Investment and Product Differentiation
- 16.5 Supply Chain Localization and Resilience
- 16.6 Distribution and Customer Acquisition
- 16.7 Partnership, Acquisition and Capacity Strategy
- 16.8 Regional Expansion Priorities
- 16.9 Short-, Medium- and Long-Term Actions
Chapter 17 Competition Outlook
- 17.1 Industry Competition Characteristics
- 17.2 Market Structure and Concentration
- 17.3 Market Share and Competitive Positioning, 2025
- 17.4 Company-Wise Revenue and Product Benchmarking
- 17.5 Production and Service Capacity Benchmarking
- 17.6 Technology, Pricing and Differentiation
- 17.7 Regional Footprint and Distribution Strength
- 17.8 Mergers, Acquisitions and Strategic Alliances
- 17.9 New Entrants and Competitive Threats
- 17.10 Porter's Five Forces and Industry Attractiveness
- 17.11 Competitive Outlook, 2025-2035
Chapter 18 Company Profiles
- 18.1 Company Coverage and Selection Criteria
- 18.2 Stratasys Ltd.
- 18.2.1 Business Description
- 18.2.2 Company Ownership and Geographic Presence
- 18.2.3 Product and Service Portfolio
- 18.2.4 Manufacturing and Operating Footprint
- 18.2.5 Production Capacity and Expansion Plans
- 18.2.6 Financial Performance and Investment
- 18.2.7 Market Share and Competitive Position
- 18.2.8 Technology and Innovation Capabilities
- 18.2.9 Strategic Alliances or Partnerships
- 18.2.10 Recent Developments
- 18.2.11 Growth Strategy and Outlook
- 18.3 3D Systems Corporation
- 18.4 EOS GmbH
- 18.5 HP Inc.
- 18.6 Farsoon Technologies
- 18.7 BLT (Xi'an Bright Laser Technologies)
- 18.8 Materialise NV
- 18.9 Nikon SLM Solutions
- 18.10 Bambu Lab
- 18.11 Formlabs
- 18.12 Other Relevant Market Participants
Note: Every listed company is profiled on the structure shown under the first company. The company list is preliminary and may change based on research findings, market developments, data availability and client requirements.
Chapter 19 Disclaimer
- 19.1 Research and Forecast Disclaimer
- 19.2 Data Source and Estimation Limitations
Note: The depth of individual sections depends on data availability for this market. Volume, capacity, trade and other unit-based metrics are included where applicable.

