
Grid build-out and factories set the pace for wiring demand
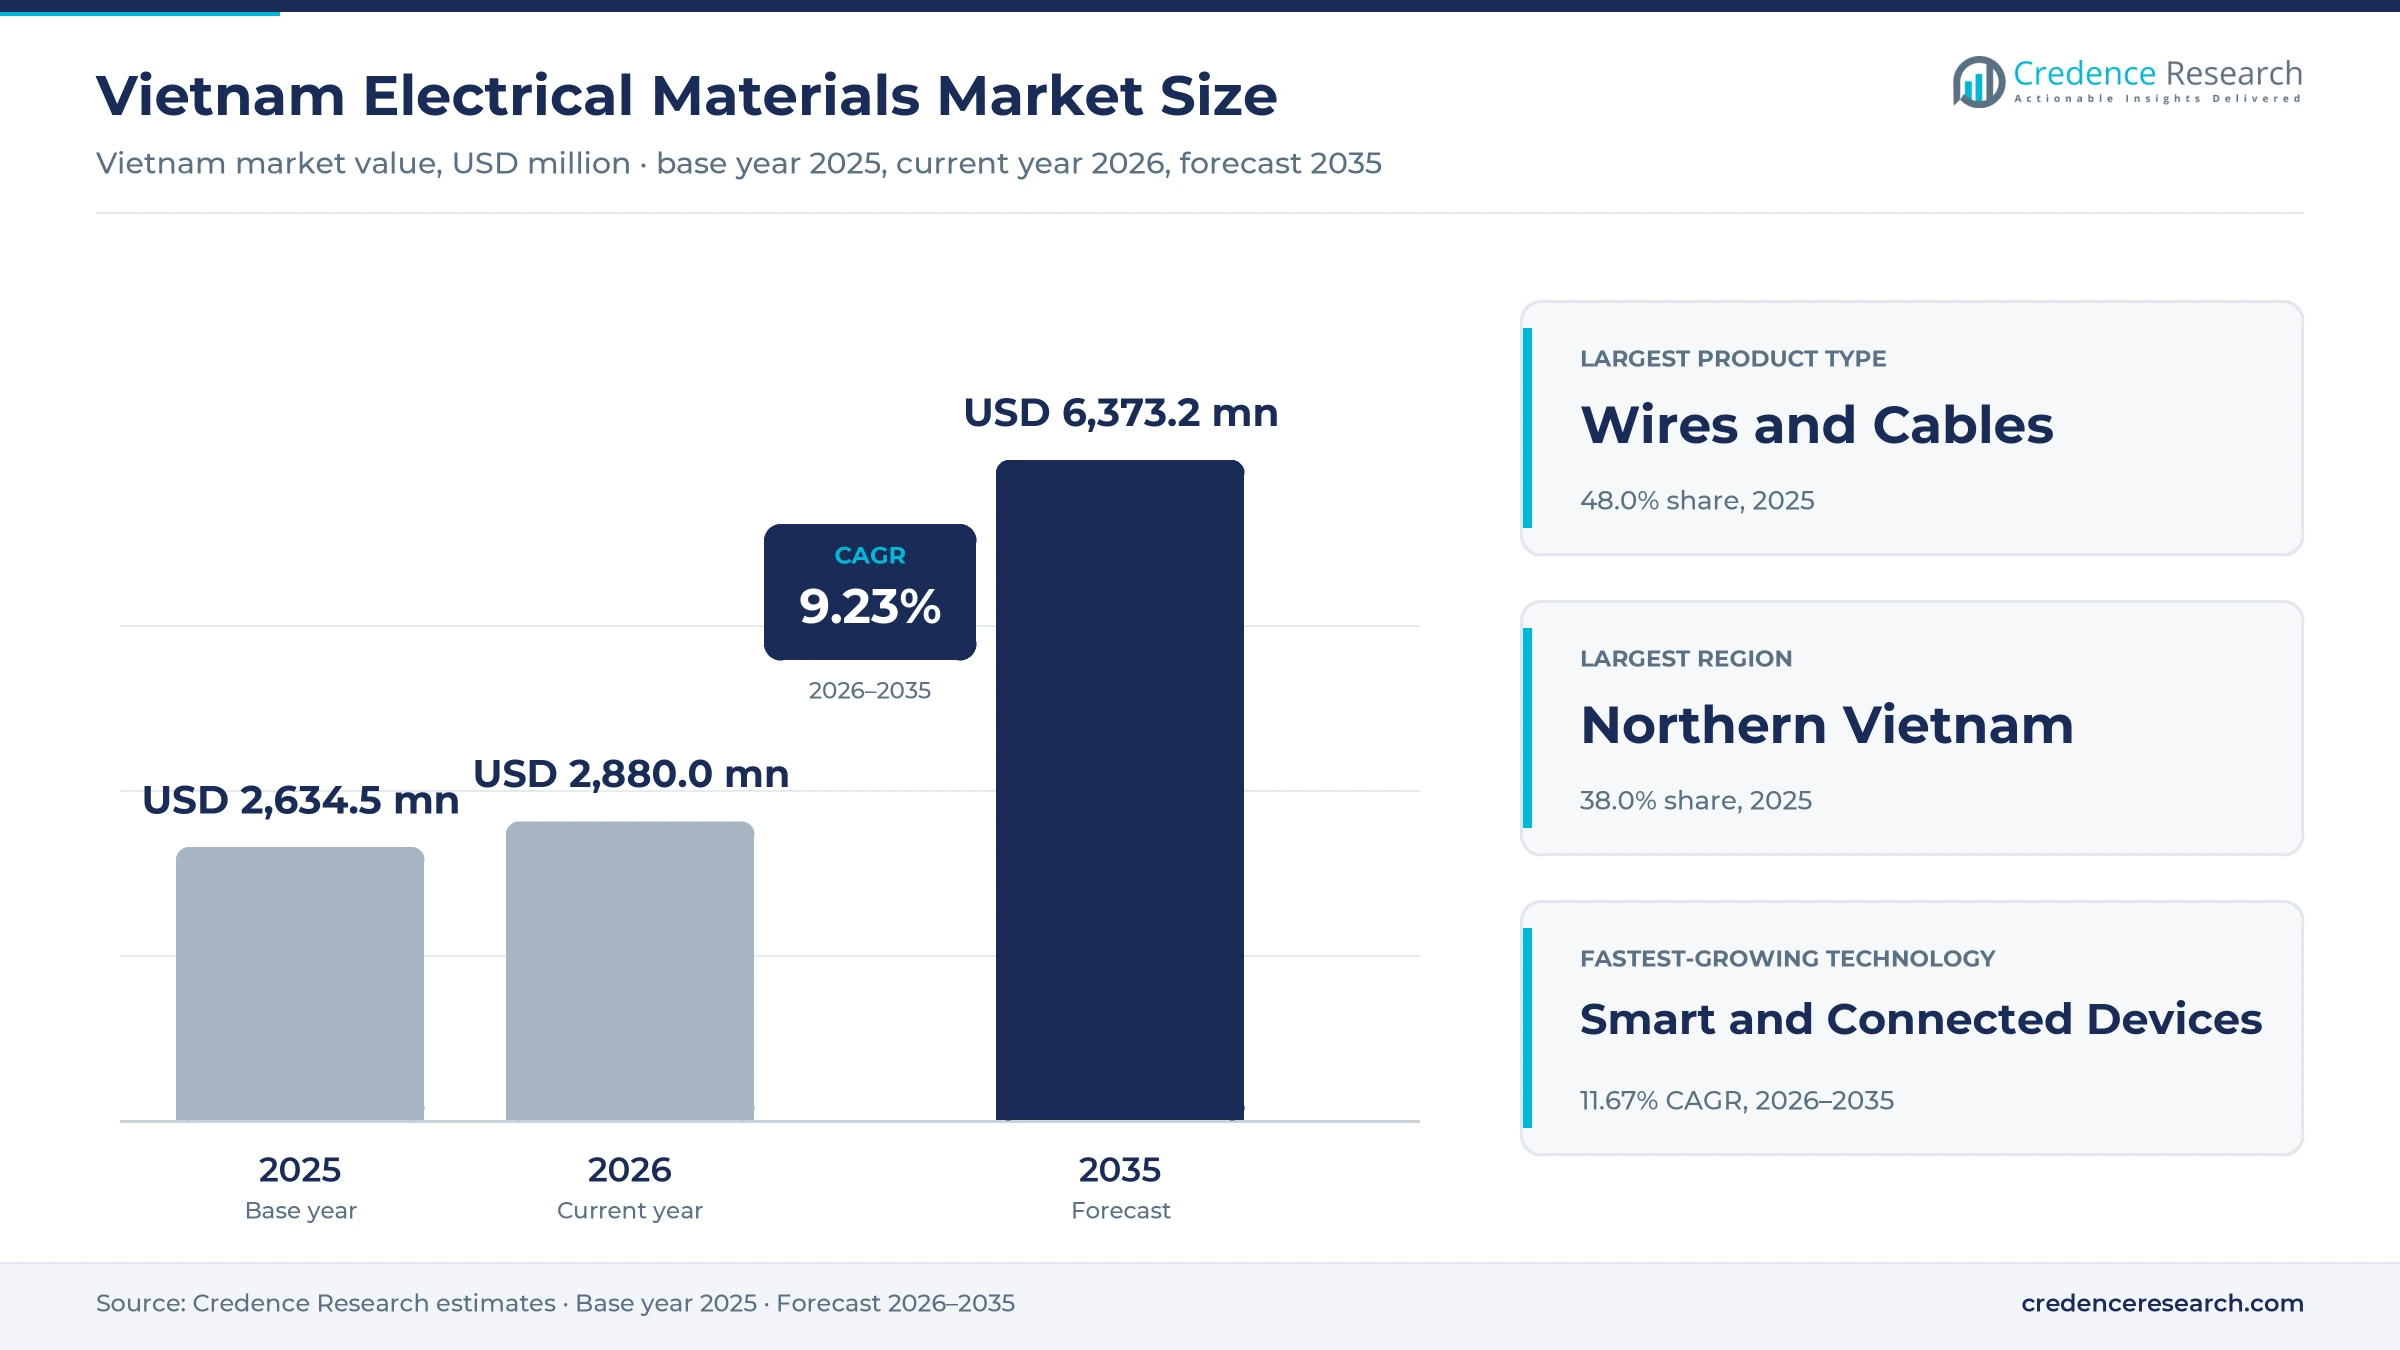
The Vietnam electrical materials market was valued at USD 2.63 billion in 2025 and is projected to increase from USD 2.88 billion in 2026 to USD 6.37 billion by 2035, registering a CAGR of 9.23% during 2026–2035. Demand comes from power-grid expansion, new factories funded by foreign investment, public infrastructure and a steady pipeline of housing. Northern Vietnam held the largest regional share, 38.0% in 2025, and is also the fastest-growing region at 9.52% a year, because electronics plants around Hanoi, Bac Ninh and Hai Phong keep adding capacity. Wires and cables form the largest product group, while circuit protection gains share as switchboards grow more complex. The revised national power plan approved in April 2025 sets USD 18.1 billion for transmission grids during 2026 to 2030. As a result, utilities, contractors and installers are expected to buy more cable, breakers and wiring devices each year through 2035.
Which cables, breakers and devices does the estimate cover?
The estimate measures sales value of low and medium voltage electrical materials used in Vietnam for transmission, distribution and building installation. It covers electrical wires and cables, circuit protection and distribution gear, wiring devices and connections, and conduits and cable management products. Values are stated in USD million at current prices and include direct project sales, distributor and dealer sales and retail sales.
The estimate excludes power transformers, generators, meters, lighting fixtures and household appliances. It also excludes exports of cable and wiring products made in Vietnam for overseas buyers. The value chain runs from copper, aluminum and polymer suppliers through cable and device plants to distributors, contractors, utilities and installers on building and grid sites.
Vietnam Electrical Materials Market Insights
- The Vietnam electrical materials market was valued at USD 2.63 billion in 2025 and is projected to reach USD 6.37 billion by 2035, registering a CAGR of 9.23% during 2026–2035.
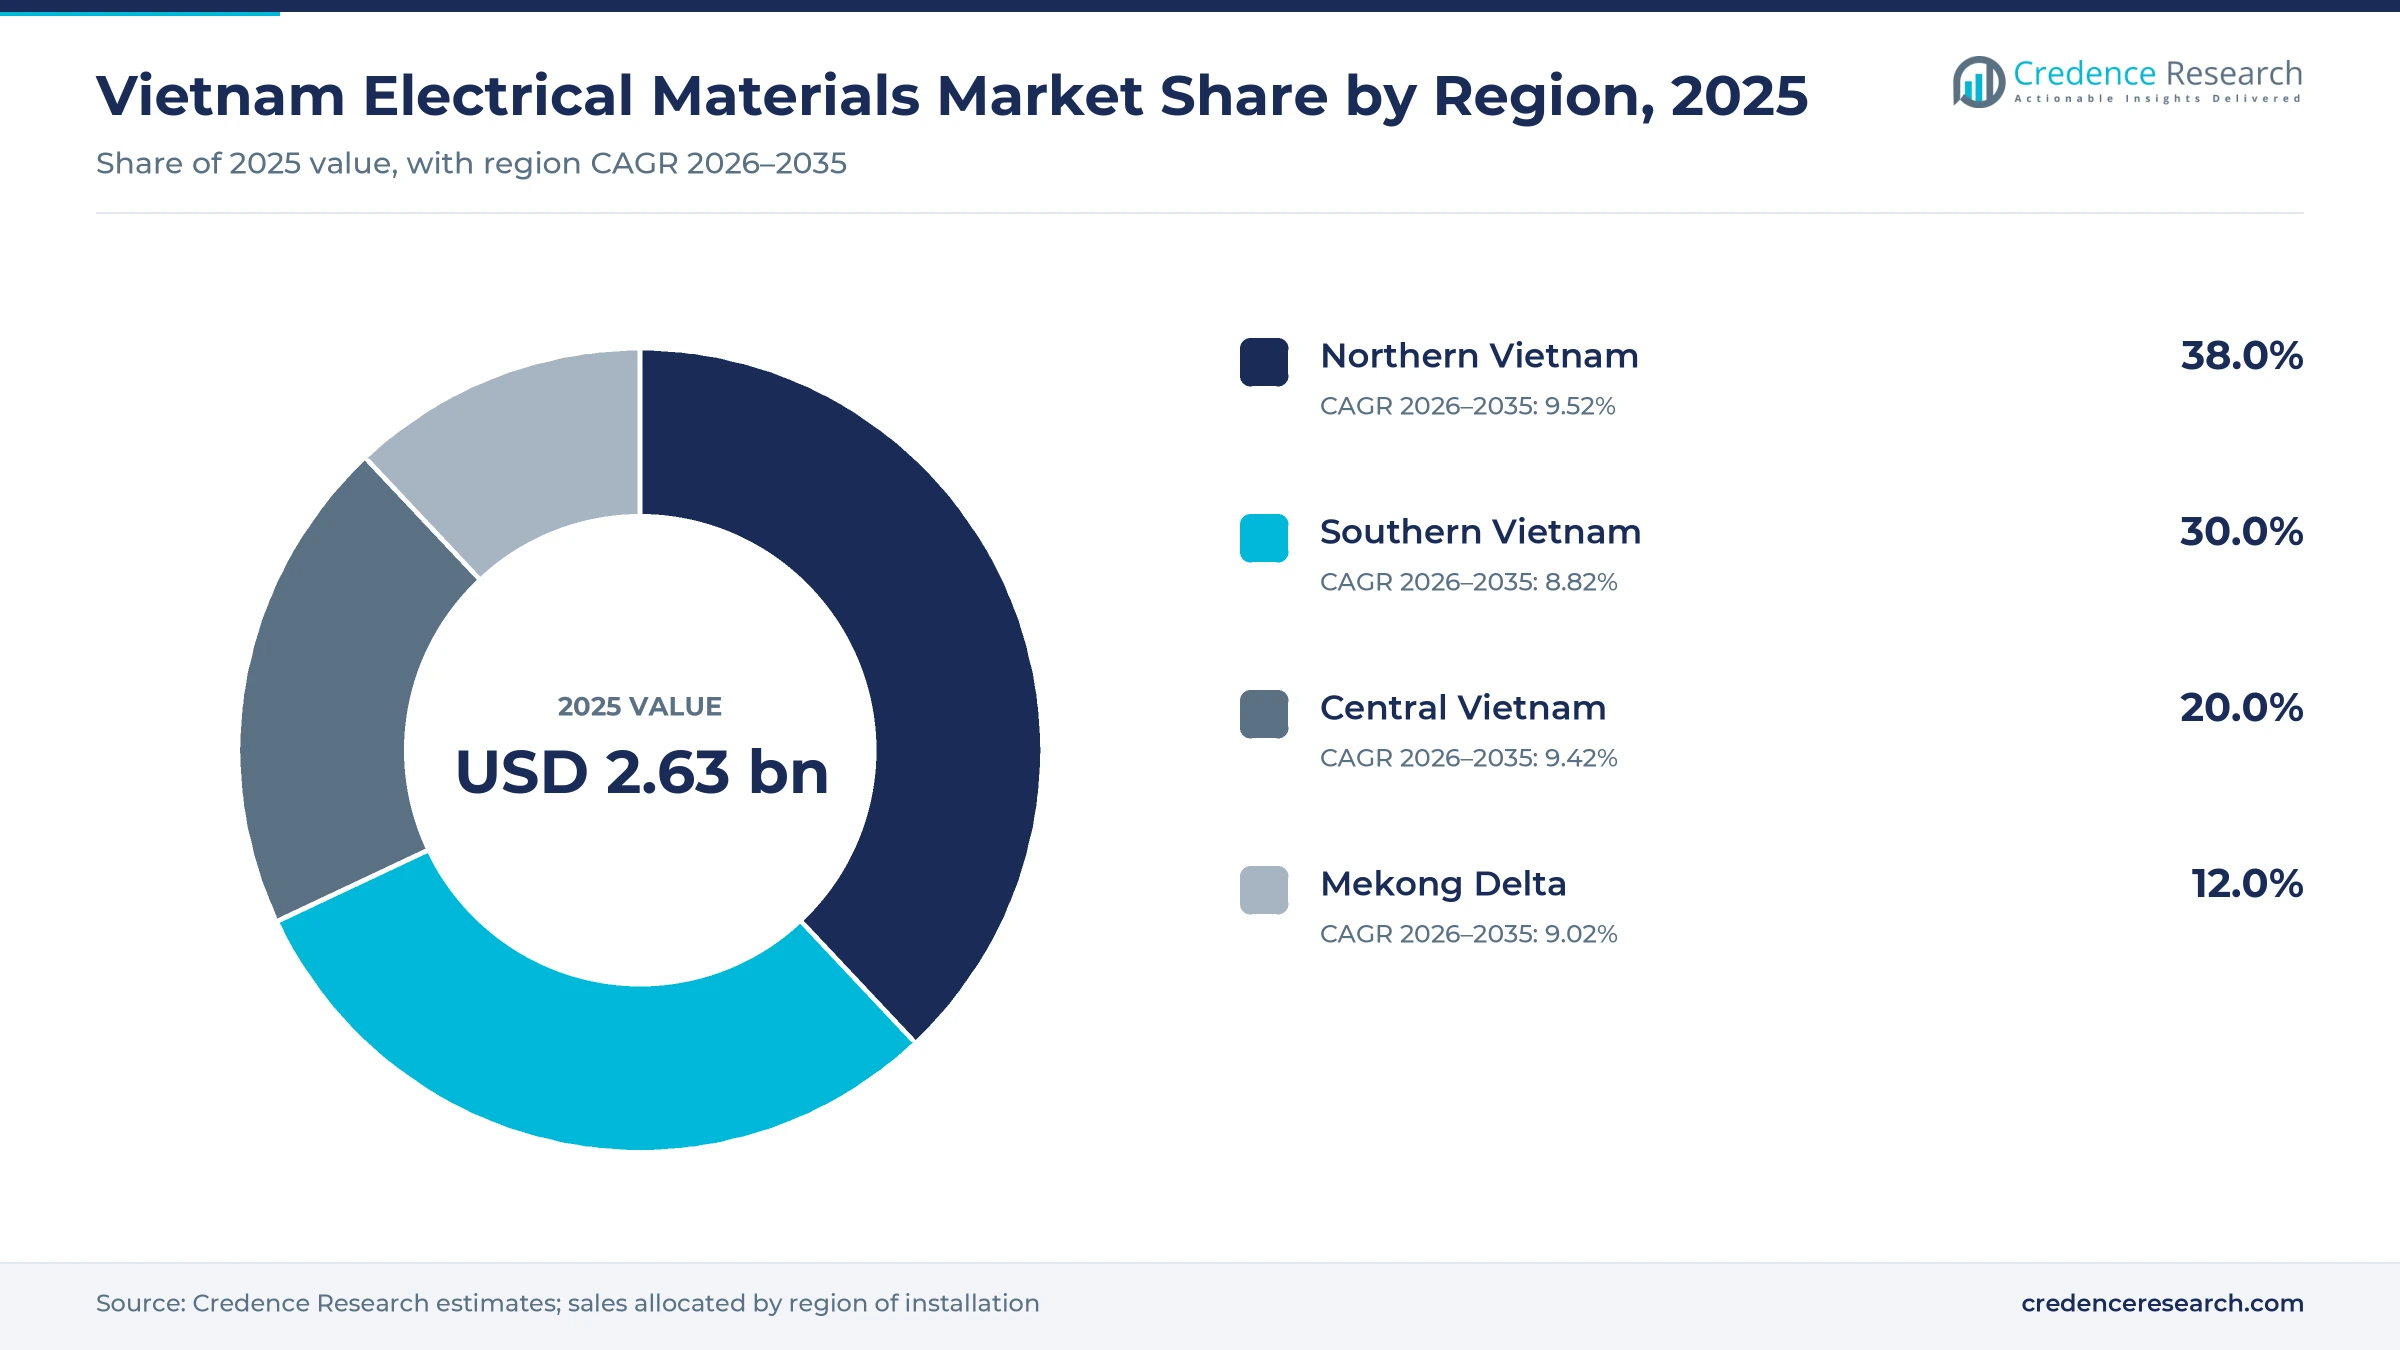
- Northern Vietnam held 38.0% of 2025 value, because electronics factories and grid projects around Hanoi and Bac Ninh buy the most cable and switchgear.
- Electrical wires and cables led with 48.0% of 2025 value, because every grid line, factory and apartment block needs power and control cable.
- The 519 km Quang Trach to Pho Noi 500kV circuit 3 line entered operation on Aug. 29, 2024, after six months of construction.
- Vietnam drew USD 27.6 billion of disbursed foreign investment in 2025, a five-year high, which keeps factory electrical fit-out demand strong.
Cables lead while circuit protection grows fastest
Why do wires and cables lead product demand?
Based on product type, the market is categorized into electrical wires and cables, circuit protection and distribution, wiring devices and connections, and conduits and cable management. Electrical Wires and Cables led with 48.0% of 2025 value, because grid lines, factories and buildings all need power and control cable. Circuit Protection and Distribution grows fastest at 9.80% a year, as switchboards in factories and data halls add more breakers and monitoring.
Which end-use industries buy the most?
Based on end-use industry, the market is categorized into residential construction, commercial buildings, industrial and manufacturing, and utilities and infrastructure. Residential Construction led with 30.0% of 2025 value, because apartments, townhouses and social housing need large volumes of building wire. Utilities and Infrastructure grow fastest at 9.82% a year, as transmission, rail and airport projects move into construction.
How fast are smart and safer materials growing?
Based on technology, the market is categorized into conventional electrical materials, energy-efficient materials, fire-safe and low-smoke materials, and smart and connected devices. Conventional Electrical Materials led with 62.0% of 2025 value, because standard PVC cable and basic breakers still dominate housing. Smart and Connected Devices grow fastest at 11.67% a year, as offices, hotels and premium homes add app-controlled switches and metering breakers.
| Segment Group | Leading Sub-segment | Share, 2025 | Fastest-growing Sub-segment | CAGR, 2026–2035 |
|---|---|---|---|---|
| By Product Type | Electrical Wires and Cables | 48.0% | Circuit Protection and Distribution | 9.80% |
| By End-Use Industry | Residential Construction | 30.0% | Utilities and Infrastructure | 9.82% |
| By Technology | Conventional Electrical Materials | 62.0% | Smart and Connected Devices | 11.67% |
Request a Free Sample
Fill in your details and we'll send you a free sample report.
- Sample data tables & charts
- Research methodology
Grid spending, factory projects and public works lift demand
How does grid expansion and electrification lift demand?
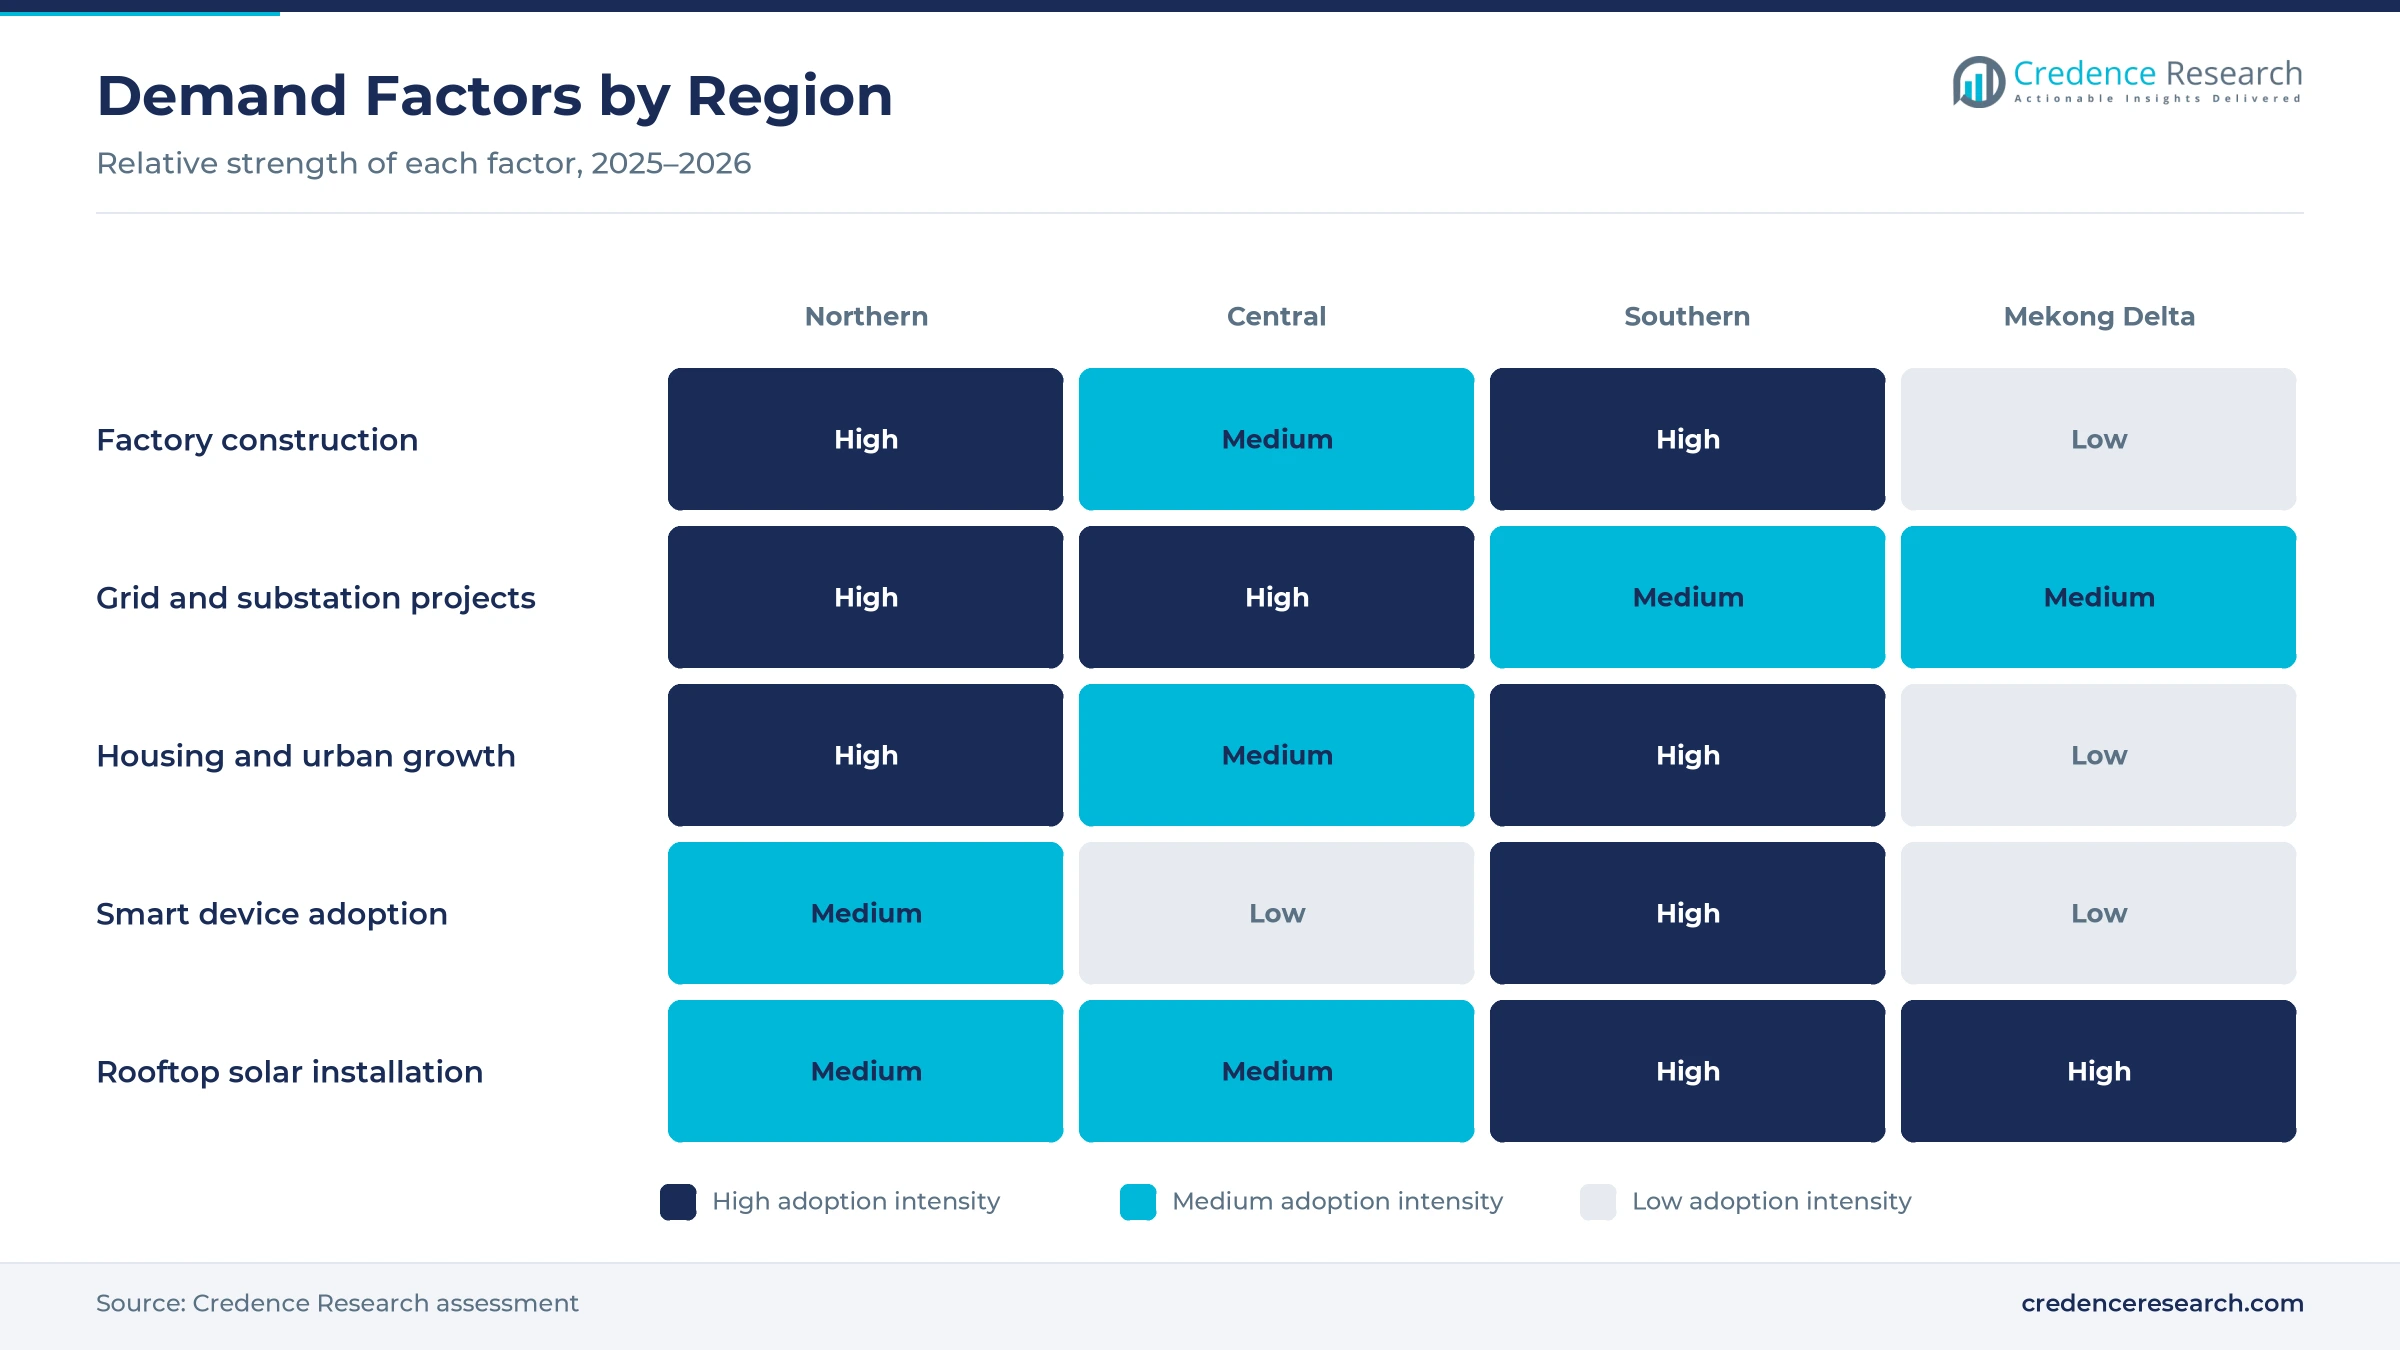
Power-grid expansion and electrification are the largest demand drivers, because each new line and substation needs cable, protection and connection hardware. The revised Power Development Plan VIII sets USD 136.3 billion of investment for 2026 to 2030, including USD 18.1 billion for transmission grids, according to Vietstock. EVN energized 260 projects from 110kV to 500kV in 2025, adding about 3,900 km of lines and 27,000 MVA of capacity, according to EVN. In turn, utilities and infrastructure grow at 9.82% a year, the fastest end-use rate, as distribution networks follow the new backbone lines. Grid demand for cable and switchgear should therefore stay high through 2030.
Why do new factories need large volumes of materials?
Industrial investment and factory construction drive steady orders, because each new plant needs medium voltage cable, switchboards, busways and thousands of wiring points. Vietnam recorded USD 27.6 billion of disbursed foreign investment in 2025, up 9% and the highest in five years, according to Viet Nam News. Manufacturing and processing took 56.5% of newly registered capital in 2025, based on National Statistics Office data. As a result, industrial and manufacturing buyers form a large share of demand, and Northern Vietnam leads regional growth as electronics clusters in Bac Ninh, Bac Giang and Hai Phong expand. Industrial and manufacturing demand grows faster than total market demand, based on Credence Research estimates.
How do public works and urban growth add demand?
Public infrastructure and urban development add long-running demand, because rail, airports and new housing need wiring for decades of service. The National Assembly approved the 1,541 km North-South high-speed railway on Nov. 30, 2024, with investment of about USD 67.6 billion and completion targeted by 2035. Vietnam completed 102,633 social housing units in 2025 and aims for at least one million units by 2030. In turn, residential construction keeps the largest end-use share, while signaling, traction and station power for rail projects lift demand for power transmission cables and protection gear. Public works demand alone keeps cable plants busy through the 2026 to 2035 forecast period.
Why does rising power use per person support demand?
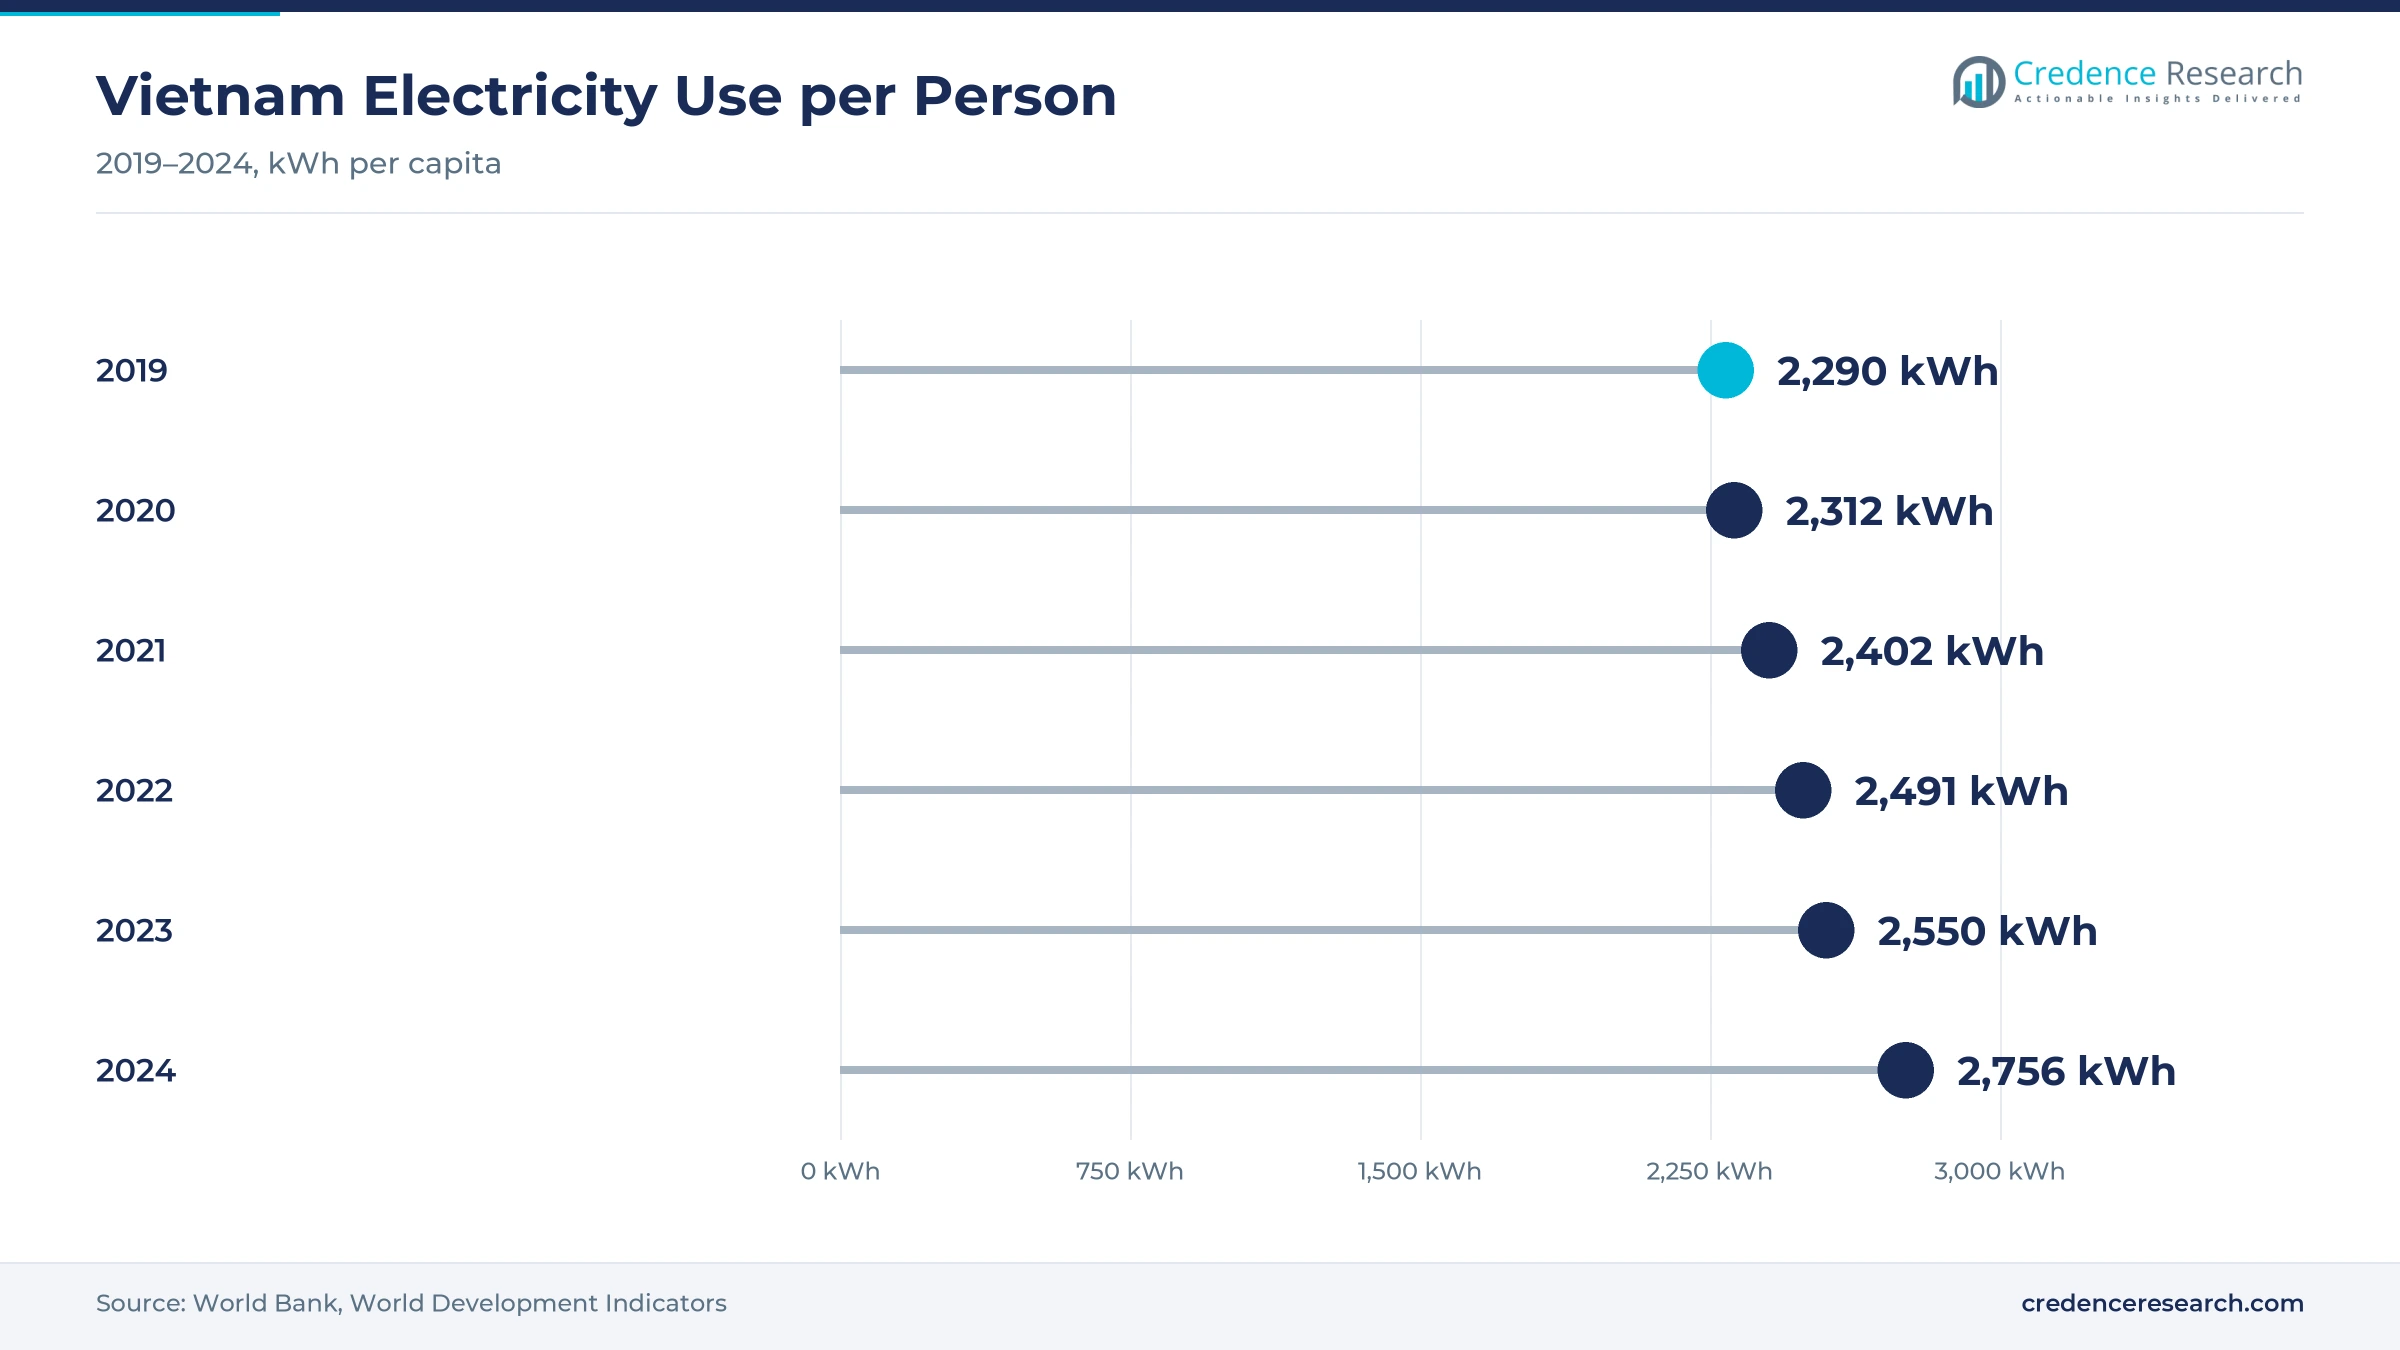
Rising electricity use per person supports replacement and upgrade demand, because households and shops add air conditioners, kitchen appliances and chargers that strain older wiring. Electricity use reached about 2,756 kWh per person in 2024, up from about 1,615 kWh in 2015, according to World Bank data. EVN also reported that 99.85% of households used electricity in 2025, so growth now comes from heavier loads rather than new connections. As a result, owners replace undersized cable and add residual current breakers, which supports wiring devices and protection sales through 2035. Replacement demand in older homes adds steady volume each year. EVN commercial power output reached 287.9 billion kWh in 2025, which underpins distribution cable demand.
Safer cables, smart devices and rooftop solar reshape demand
Why is the shift to rooftop solar changing installations?
A shift toward rooftop solar is changing low voltage installation, because each system needs DC cable, inverters, isolators and extra protection. The revised power plan targets self-produced, self-consumed rooftop solar on 50% of public buildings and 50% of households by 2030. The amended Electricity Law, passed on Nov. 30, 2024, took effect on Feb. 1, 2025, and set preferential mechanisms for renewable projects in rural, mountainous and island areas. In turn, installers need more surge protection, bidirectional metering and circuit breakers rated for solar feeds, which lifts circuit protection growth to 9.80% a year. Solar-related demand therefore rises fastest in Southern Vietnam and the Mekong Delta.
How is the rise of fire-safe cables affecting specifications?
The rise of fire-safe and low-smoke cables is changing specifications in high-rise buildings, hospitals, metro lines and airports. Designers now specify halogen-free sheathing in escape routes and tunnels, because smoke and toxic gases cause most fire deaths. Fire-safe and low-smoke materials grow at 11.67% or close to it in premium projects, faster than conventional products, based on Credence Research estimates. Local makers such as CADIVI focus on high-tech, higher-value products, according to GELEX Electric in April 2025. The 1,541 km North-South railway and urban metro lines will also require large volumes of fire-rated cable after construction starts in late 2027. Hospitals and high-rise buildings add 2 to 3 fire-rated circuits per floor in many designs, based on Credence Research estimates.
Can data centers and electronics plants open premium demand?
Data centers and electronics plants offer a premium opening, because they need redundant power paths, busways, monitored breakers and dense cable trays. Manufacturing took 56.5% of newly registered foreign capital in 2025, which points to more cleanroom and automated factory fit-outs. Panasonic Electric Works Vietnam began full-scale operation of a new wiring device and circuit breaker building in Binh Duong in January 2024, raising floor area about 1.6 times. In turn, suppliers of conduit systems and cable trays win larger packages when they offer design support and fast delivery to industrial parks. Premium industrial demand lifts average order values for protection and busway products.
Is there an opening in grid-scale cable supply?
Grid-scale cable supply is a second opening, because new 500kV and 220kV lines need conductors, insulators and substation cable on tight schedules. The 519 km Quang Trach to Pho Noi circuit 3 line cost over VND 22.3 trillion and entered service on Aug. 29, 2024, according to the Government news portal. EVN raised construction disbursement by 14.7% to VND 125,778 billion in 2025. As a result, local cable makers with type-tested products can compete with imports for EVN tenders, which supports utilities and infrastructure growth. The revised plan targets peak capacity of 89,655 to 99,934 MW by 2030, which requires many more substations and feeders.
Copper prices, imports and project delays squeeze suppliers
How do copper price swings hurt cable makers?
Copper price swings are the largest risk, because copper makes up most of the cost of power and building cable. Makers that sign fixed-price project contracts can lose money when metal prices rise before delivery, because margins on building wire are thin. In turn, distributors hold less stock and buyers delay orders when prices spike. Larger firms hedge through supplier contracts and price adjustment clauses, which smaller makers rarely negotiate, so the cost gap between large and small suppliers keeps widening.
Why do cheap imports pressure local suppliers?
Cheap imports pressure local suppliers, because low-priced breakers, sockets and cable enter through informal trade and online channels. Some products fail to meet Vietnamese standards, which raises fire risk in homes and shops. As a result, reputable brands lose share in retail and among small installers. Stronger market inspection and buyer awareness campaigns help, but enforcement remains uneven in rural provinces and online marketplaces, where counterfeit branded breakers also appear.
How do project delays slow material orders?
Project delays slow material orders, because land clearance, permits and funding approvals often push back grid, rail and industrial park schedules. The North-South railway sections are not expected to start before late 2027, which defers large cable orders. Therefore, suppliers face uneven demand, with peaks when several projects reach electrical fit-out at once. Firms manage this with flexible capacity, multi-year frame agreements and larger finished-goods stocks near major project sites.
Why do skills gaps limit smart device adoption?
Skills gaps limit smart device adoption, because many installers lack training in networked breakers, energy monitoring and app-controlled switches. Homeowners also worry about cost and compatibility with older wiring. As a result, smart and connected devices remain a small share of sales outside premium projects and new office towers. Brands respond with installer training centers, certification programs and simple plug-and-play product ranges for apartments. Smart device demand should still rise quickly from a small base as these programs mature.
Northern Vietnam leads on industrial and grid investment
| Region | Value, 2025 (USD billion) | Share, 2025 | CAGR, 2026–2035 |
|---|---|---|---|
| Northern Vietnam | 1.00 | 38.0% | 9.52% |
| Southern Vietnam | 0.79 | 30.0% | 8.82% |
| Central Vietnam | 0.53 | 20.0% | 9.42% |
| Mekong Delta | 0.32 | 12.0% | 9.02% |
Why does Northern Vietnam lead demand?
Northern Vietnam held 38.0% of 2025 value and grows fastest at 9.52% a year, because Hanoi, Bac Ninh, Bac Giang and Hai Phong host large electronics and component plants. The 500kV circuit 3 line ending at Pho Noi in Hung Yen was built to secure power for this area. In turn, factory fit-outs, industrial parks and new apartments around Hanoi buy the most cable, switchgear and wiring devices in the country.
How does Southern Vietnam balance housing and industry?
Southern Vietnam held 30.0% of 2025 value and grows at 8.82% a year, because Ho Chi Minh City, Binh Duong and Dong Nai combine large housing markets with industrial parks. Panasonic, Schneider Electric and LS Cable & System run plants or branches in this area. However, land shortages and rising costs slow new industrial projects, so growth trails the north even though the region remains a major cable and device hub.
What drives demand in central Vietnam?
Central Vietnam held 20.0% of 2025 value and grows at 9.42% a year, because Da Nang, Quang Ngai and Thanh Hoa add ports, refineries, steel plants and tourism projects. The Quang Trach end of the circuit 3 line sits in Quang Binh, which links central power plants to the north. As a result, grid substations, coastal resorts and industrial zones lift demand for cable and protection gear. Central Vietnam demand should rise further as 500kV links and coastal industrial zones add load after 2025.
How fast is the Mekong Delta growing?
The Mekong Delta held 12.0% of 2025 value and grows at 9.02% a year, because Can Tho and nearby provinces are building expressways, wind farms and food processing plants. Rural households already use grid power, so demand comes from upgrades and new commercial buildings. However, smaller project sizes and lower incomes keep the region the smallest buyer of electrical materials.
Power plan revisions and new laws marked 2024 to 2026
| Development | Status and market relevance |
|---|---|
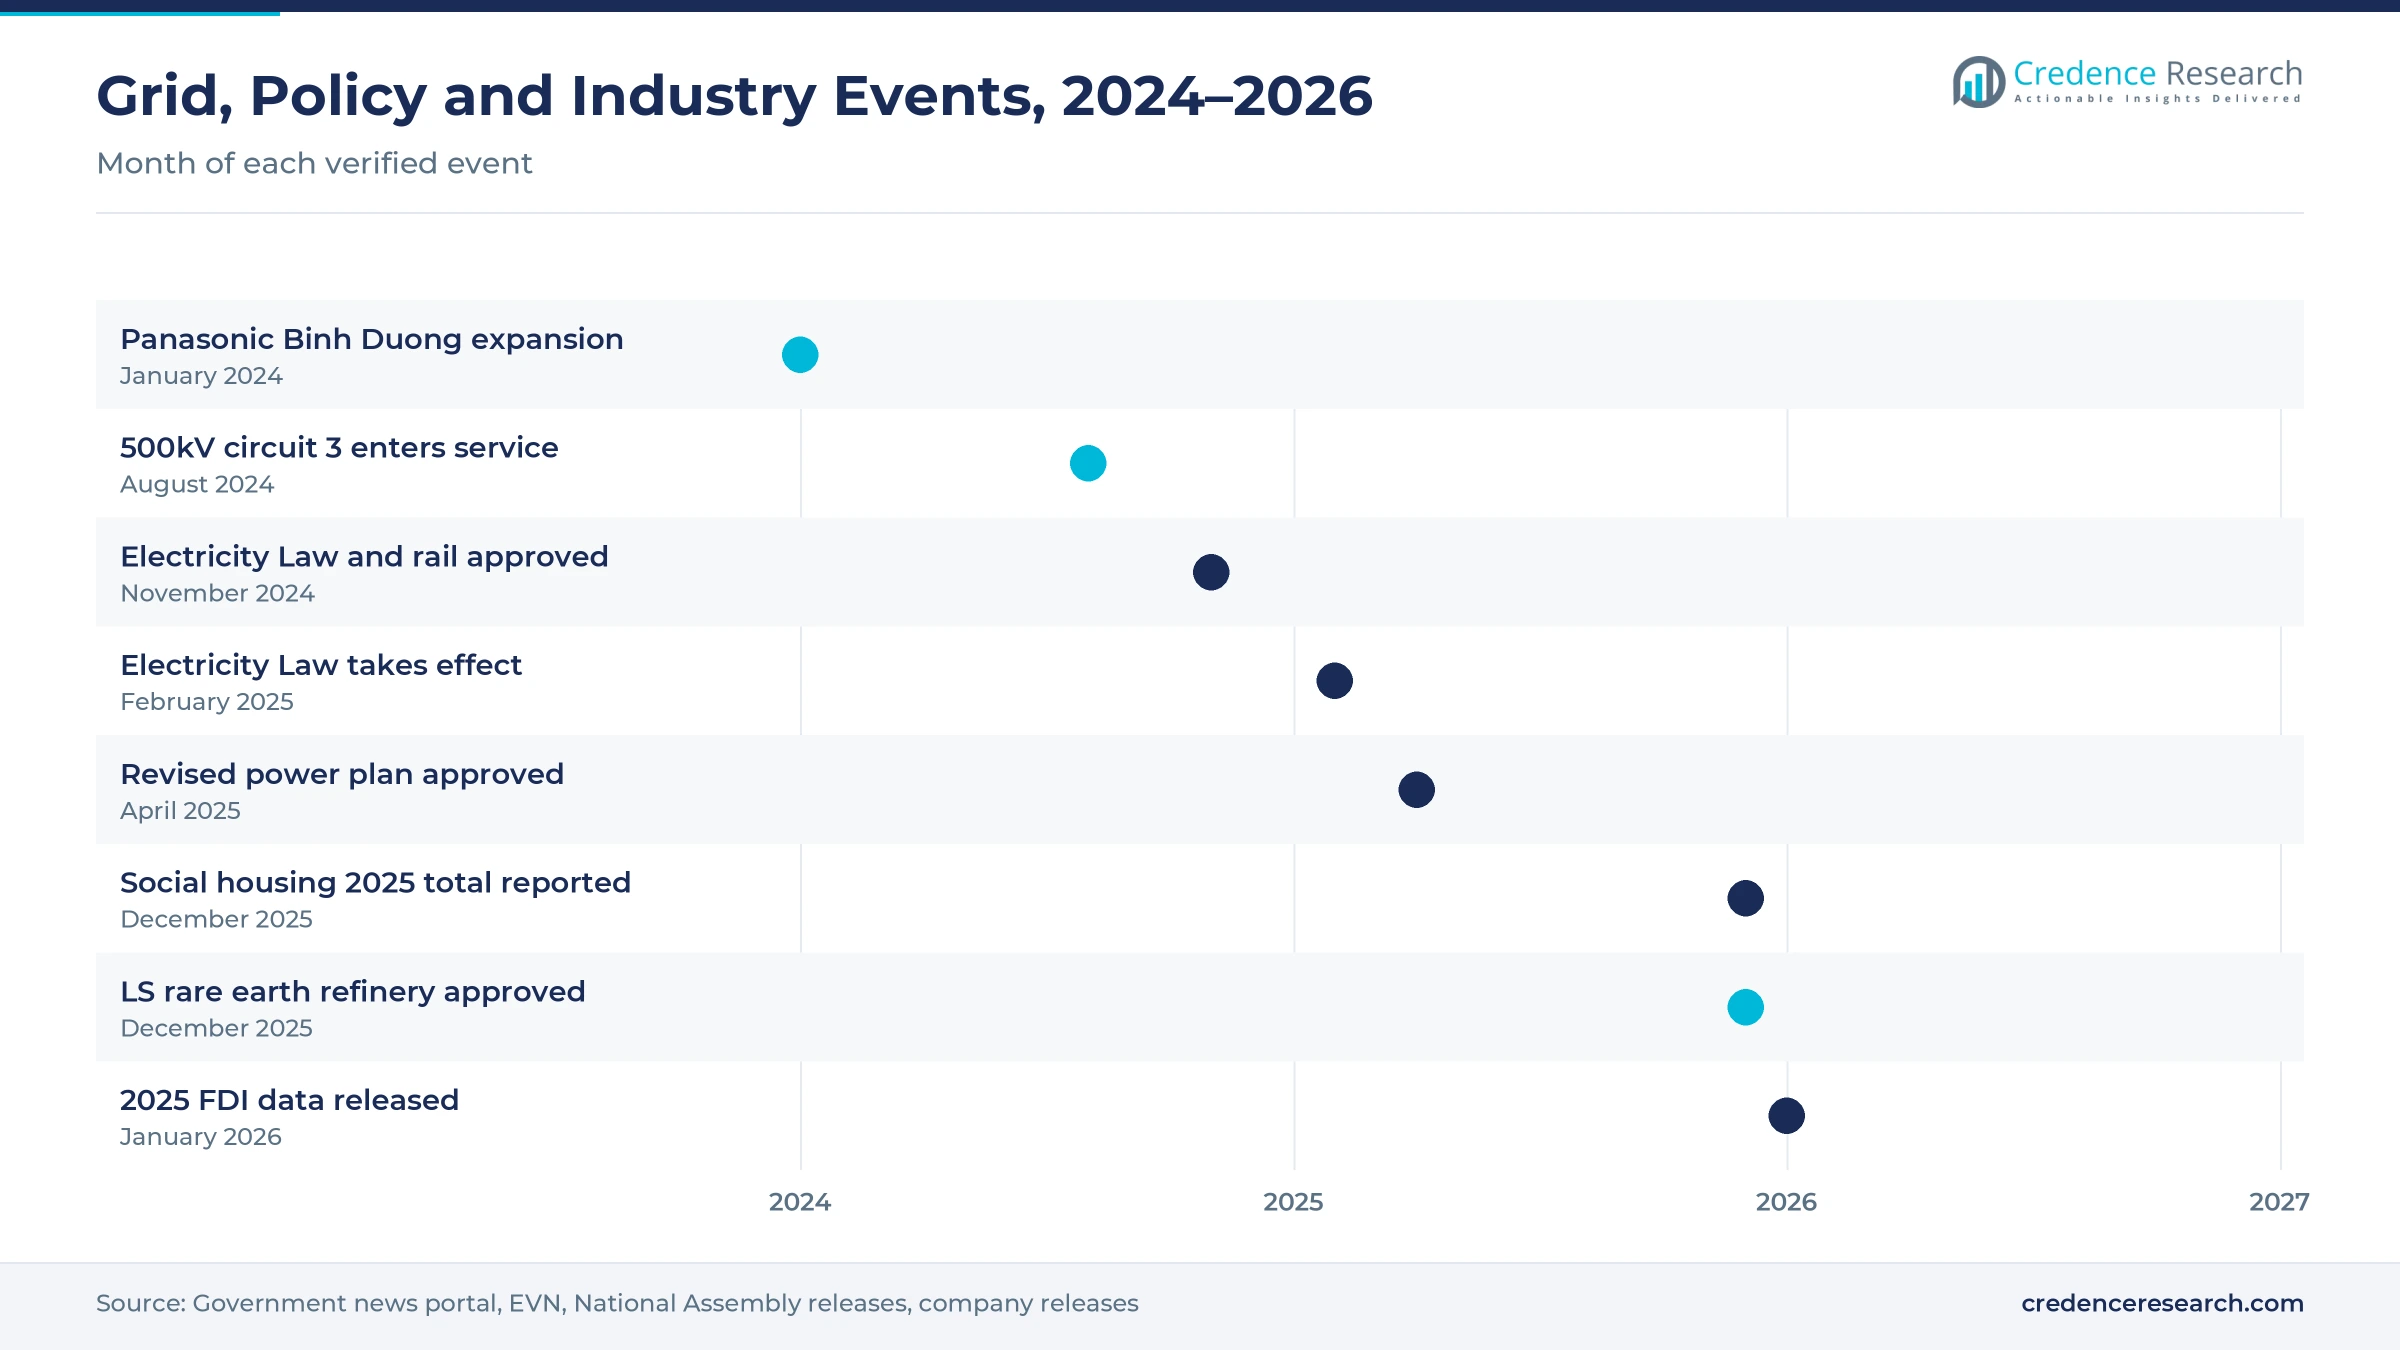
| In August 2024, the 519 km Quang Trach to Pho Noi 500kV circuit 3 line entered operation after six months of construction. | Strengthens north-south power transfer and drove large cable and hardware orders |
| In November 2024, the National Assembly passed the amended Electricity Law and approved the North-South high-speed railway. | Law took effect Feb. 1, 2025; rail sections expected to start in late 2027 |
| In April 2025, Decision 768/QD-TTg revised Power Development Plan VIII with USD 18.1 billion for transmission grids during 2026 to 2030. | Sets the grid investment path that underpins utility cable and protection demand |
| In December 2025, Vietnam reported 102,633 social housing units completed during the year, above the annual target. | Supports building wire and wiring device demand toward the one million unit goal |
| In December 2025, LS Eco Energy approved a rare earth metal refinery at LS Cable & System's Ho Chi Minh City branch. | Signals deeper LS group investment in Vietnam beyond cable production |
Low-smoke cables, smart breakers and digital panels spread
- Low-smoke halogen-free cables reduce toxic smoke in fires, which makes them standard in metro lines, hospitals, airports and high-rise escape routes.
- Smart breakers and switches report energy use and faults to building systems and phone apps, which suits offices, hotels and premium apartments.
- Modular switchgear panels such as medium voltage units built in Bac Ninh shorten installation time on factory and substation sites.
- Solar-rated DC components including cable, isolators and surge protectors, support the rooftop solar targets in the revised power plan.
Need a Custom Version of This Report?
Tailor the scope, geography, or segments to your exact requirements.
- Custom geography or segment scope
- Direct access to our analyst team
Local cable makers and global brands split the field
Competition combines strong local cable makers with global brands in protection and wiring devices. CADIVI, part of GELEX Electric, is the best-known domestic cable brand and focuses on the domestic market with high-quality products. LS Cable & System runs a branch in Ho Chi Minh City and in December 2025 approved a rare earth refinery there, showing long-term commitment. Panasonic Electric Works Vietnam expanded its Binh Duong plant for wiring devices and circuit breakers in January 2024. Schneider Electric makes smart home and wiring products at its Saigon Hi-Tech Park plant, while ABB builds medium voltage switchgear panels in Bac Ninh. Rivals compete on price, type-test certificates, distributor reach and delivery speed, while EVN tenders and large industrial projects reward makers with proven quality and local stock. In 2025, EVN energized 260 grid projects, which created steady demand for local cable makers.
Companies profiled and their roles in this market
| Company | Type | Role in the market |
|---|---|---|
| Vietnam Electric Cable Corporation (CADIVI) | Domestic cable maker | Flagship GELEX Electric cable brand focused on the domestic market and higher-value products |
| LS-VINA Cable & System | Cable maker | Part of the LS Cable & System group, which runs a Ho Chi Minh City branch and plans a rare earth refinery there |
| Panasonic Electric Works Vietnam | Device maker | Makes wiring devices and circuit breakers in Binh Duong, expanded in January 2024 |
| Schneider Electric Vietnam | Device maker | Produces smart home and wiring products at its Saigon Hi-Tech Park plant |
| ABB Vietnam | Switchgear maker | Builds UniGear medium voltage switchgear and modular power distribution systems in Bac Ninh |
Credence Research view on grid timing and copper risk
Credence Research's view is that Vietnam's electrical materials demand will track grid and factory investment more closely than housing over the next decade. The revised power plan and record foreign investment give suppliers a clear order pipeline through 2030. However, copper prices, project delays and cheap imports will keep margins thin for smaller makers. Firms that combine type-tested products, local stock and design support for industrial parks should gain share fastest, especially in Northern Vietnam. Utilities and infrastructure demand should grow faster than any other end-use group through 2035.
How the Vietnam wiring and protection estimate was built
The report uses 2025 as the base year on a calendar basis, and market values come from the Credence Research model. That model combines grid investment plans, construction and foreign investment data, power use statistics and typical prices for cable, protection and wiring products. Segment and regional splits are Credence Research estimates, with regional shares set by the client and growth tilts based on investment and infrastructure data. Sources used are government releases, utility reports, company releases and statistical databases, and no interviews or surveys were used.
Grid and industrial projects carry growth to 2035
Electrical materials sales are expected to reach USD 6.37 billion by 2035, a 9.23% CAGR during 2026–2035, as grid, factory and public works projects continue. Growth should stay strong through 2030 while the revised power plan funds transmission and distribution lines. After that, rail, metro and airport projects and the upgrade of older buildings will carry demand, with smart and fire-safe products taking a larger share. Faster project approvals would lift this outlook, while copper price spikes or weaker foreign investment would lower it. Market demand should rise from USD 2.88 billion in 2026 as grid and factory orders build.
Frequently Asked Questions
How big is the Vietnam electrical materials market?
Which product type leads electrical materials sales in Vietnam?
Which region leads the Vietnam electrical materials market?
How does the power development plan affect demand?
Which end-use industry grows fastest?
Which technology segment grows fastest?
Who are the main electrical materials companies in Vietnam?
What are the main challenges for suppliers?
Table of Content
Chapter 1 Market Segmentation
- 1.1 Segmentation Framework
- 1.1.1 Product and Service Classification
- 1.1.2 Application and End-Use Classification
- 1.1.3 Technology and Solution Classification
- 1.1.4 Customer and Distribution Channel Classification
- 1.1.5 Geographic Segmentation
- 1.1.6 Market Segment Definitions and Boundaries
- 1.2 By Product Type
- 1.2.1 Electrical Wires and Cables
- 1.2.2 Circuit Protection and Distribution
- 1.2.3 Wiring Devices and Connections
- 1.2.4 Conduits and Cable Management
- 1.3 By End-Use Industry
- 1.3.1 Residential Construction
- 1.3.2 Commercial Buildings
- 1.3.3 Industrial and Manufacturing
- 1.3.4 Utilities and Infrastructure
- 1.4 By Technology
- 1.4.1 Conventional Electrical Materials
- 1.4.2 Energy-Efficient Materials
- 1.4.3 Fire-Safe and Low-Smoke Materials
- 1.4.4 Smart and Connected Devices
Chapter 2 Introduction
- 2.1 Report Objectives and Scope
- 2.2 Product Definition and Industry Terminology
- 2.3 Market Inclusions and Exclusions
- 2.4 Research Process
- 2.4.1 Primary Research and Expert Interviews
- 2.4.2 Secondary Research and Source Review
- 2.4.3 Top-Down and Bottom-Up Estimation
- 2.4.4 Data Triangulation and Verification
- 2.5 Market Size Measurement Basis
- 2.5.1 2025: USD 2.63 billion → 2035: USD 6.37 billion
- 2.6 Historical and Forecast Reference Periods
- 2.6.1 Historical Period: 2018-2025
- 2.6.2 Base Year: 2025
- 2.6.3 Forecast Period: 2025-2035
- 2.7 Research Assumptions and Limitations
Chapter 3 Executive Summary
- 3.1 Market Snapshot and Key Findings
- 3.2 Base-Year Market Size, 2025
- 3.3 Forecast Market Size, 2035
- 3.4 Revenue and Volume Growth Outlook
- 3.5 Key Demand and Supply Indicators
- 3.6 Leading Market Segments
- 3.7 Fastest-Growing Market Opportunities
- 3.8 Regional Performance Highlights
- 3.9 Technology and Industry Transformation
- 3.10 Competitive Landscape Summary
- 3.11 Analyst View and Strategic Implications
Chapter 4 Vietnam Electrical Materials Market Trends and Developments
- 4.1 Historical Industry Development, 2018-2025
- 4.2 Recent Market Trends and Developments
- 4.3 Demand and Customer Behavior Trends
- 4.4 Technology and Product Innovation
- 4.5 Artificial Intelligence, Automation and Digitalization
- 4.6 Local Manufacturing and Supply Chain Realignment
- 4.7 Industry Partnerships, Mergers and Acquisitions
- 4.8 Sustainability and Circular Economy Developments
- 4.9 Government and Private Sector Investment Trends
- 4.10 Emerging Business Models and Commercialization
- 4.11 Industry Developments and Announcements
Chapter 5 Vietnam Electrical Materials Market Production, Supply and Demand Analysis
- 5.1 Demand Trend and Consumption Analysis, 2018-2025
- 5.2 Demand Forecast, 2025-2035
- 5.3 Production and Output Trend, 2018-2025
- 5.4 Production and Output Forecast, 2025-2035
- 5.5 Installed Capacity and Capacity Utilization
- 5.6 Company-Wise Production Plants and Statistics
- 5.6.1 Installed Production Capacity
- 5.6.2 Actual Production
- 5.6.3 Planned Capacity and Expansion Targets
- 5.7 Supply Chain Structure and Procurement Trends
- 5.8 Supply-Demand Gap and Bottlenecks
- 5.9 Import Dependence and Sourcing Structure
- 5.10 Contract Manufacturing and Outsourcing
- 5.11 Regional Supply and Demand Concentration
Chapter 6 Vietnam Electrical Materials Market Pricing Analysis
- 6.1 Pricing Structure and Measurement
- 6.2 Historical Pricing Trends, 2018-2025
- 6.3 Pricing Outlook, 2025-2035
- 6.4 Average Selling Price and Unit Economics
- 6.5 Pricing by Product and Market Segment
- 6.6 Geographic Pricing Differences
- 6.7 Key Input, Energy, Labor and Logistics Costs
- 6.8 Contract Pricing and Purchasing Models
- 6.9 Pricing Sensitivity and Competitive Positioning
- 6.10 Price, Margin and Profitability Implications
Chapter 7 Vietnam Electrical Materials Market Dynamics
- 7.1 Market Growth Drivers
- 7.1.1 Demand-Side Drivers
- 7.1.2 Technology and Innovation Drivers
- 7.1.3 Infrastructure and Investment Drivers
- 7.1.4 Regulatory and Policy Drivers
- 7.2 Market Restraints
- 7.2.1 Cost and Affordability Constraints
- 7.2.2 Technology and Adoption Barriers
- 7.2.3 Supply Chain and Operational Constraints
- 7.3 Market Challenges
- 7.3.1 Competitive Pressure and Margin Erosion
- 7.3.2 Skills, Infrastructure and Implementation Gaps
- 7.4 Emerging Market Opportunities
- 7.5 Market Dynamics Impact and Time-Horizon Assessment
Chapter 8 Vietnam Electrical Materials Value Chain Analysis
- 8.1 Industry Value Chain Overview
- 8.2 Upstream Suppliers and Critical Inputs
- 8.3 Technology and Component Providers
- 8.4 Manufacturing or Service Delivery
- 8.5 Distribution, Channel Partners and Integrators
- 8.6 Downstream Applications and End Users
- 8.7 Value Addition and Profit Pools
- 8.8 Vertical Integration and Outsourcing
- 8.9 Supplier Concentration and Risk
- 8.10 Supply Chain Localization and Resilience
Chapter 9 Vietnam Electrical Materials Market Regulations and Policies
- 9.1 Relevant Laws, Standards and Compliance Frameworks
- 9.2 Product, Service, Safety and Quality Requirements
- 9.3 Government Policies, Incentives and Subsidies
- 9.4 Imports, Exports and Trade Barriers
- 9.5 Public Procurement and Local Content Requirements
- 9.6 Environmental and Sustainability Compliance
- 9.7 Upcoming Policy Changes and Market Implications
Chapter 10 Vietnam Electrical Materials Market Hotspots and Opportunities
- 10.1 Market Opportunity Mapping and Growth Hotspots
- 10.2 High-Growth Applications and Customer Groups
- 10.3 Underserved Markets and White-Space Opportunities
- 10.4 Emerging Technology and Product Opportunities
- 10.5 New Capacity and Investment Hotspots
- 10.6 Market Entry and Expansion Opportunities
- 10.7 Distribution and Partnership Opportunities
- 10.8 Near-Term and Long-Term Commercial Potential
- 10.9 Opportunity Attractiveness and Execution Risks
Chapter 11 Vietnam Electrical Materials Market Outlook, 2025-2035
- 11.1 Market Size and Analysis
- 11.1.1 Revenue (Market Measurement: 2025: USD 2.63 billion → 2035: USD 6.37 billion)
- 11.1.2 Market Volume and Quantity Sold
- 11.1.3 Historical Market Size, 2018-2025
- 11.1.4 Base-Year Market Size, 2025
- 11.2 Market Forecast, 2025-2035
- 11.2.1 Revenue Forecast to 2035
- 11.2.2 Volume Forecast to 2035
- 11.2.3 CAGR and Year-on-Year Growth
- 11.2.4 Incremental Revenue Opportunity
- 11.3 Forecast Assumptions and Scenario Analysis
- 11.3.1 Base-Case Forecast
- 11.3.2 Optimistic and Conservative Scenarios
- 11.3.3 Technology, Pricing and Policy Sensitivities
- 11.4 Market Attractiveness and Growth Outlook
Chapter 12 Vietnam Electrical Materials Market Segmentation and Outlook
- 12.1 Segmentation Summary and Market Shares, 2025
- 12.2 Largest and Fastest-Growing Segments
- 12.3 By Product Type - Market Size and Forecast, 2025-2035
- 12.3.1 Segment Definition and Scope
- 12.3.2 Historical Market Size, 2018-2025
- 12.3.3 Revenue Forecast, 2025-2035
- 12.3.4 Volume Forecast, 2025-2035
- 12.3.5 Base-Year Market Share, 2025
- 12.3.6 Segment CAGR and Growth Drivers
- 12.3.7 Subsegment Market Size and Forecast
- 12.3.7.1 Electrical Wires and Cables
- 12.3.7.2 Circuit Protection and Distribution
- 12.3.7.3 Wiring Devices and Connections
- 12.3.7.4 Conduits and Cable Management
- 12.3.8 Subsegment Pricing and Adoption Trends
- 12.3.9 Leading Suppliers and Competition
- 12.3.10 Regional Demand and Opportunities
- 12.4 By End-Use Industry - Market Size and Forecast, 2025-2035
- 12.4.1 Segment Definition and Scope
- 12.4.2 Historical Market Size, 2018-2025
- 12.4.3 Revenue Forecast, 2025-2035
- 12.4.4 Volume Forecast, 2025-2035
- 12.4.5 Base-Year Market Share, 2025
- 12.4.6 Segment CAGR and Growth Drivers
- 12.4.7 Subsegment Market Size and Forecast
- 12.4.7.1 Residential Construction
- 12.4.7.2 Commercial Buildings
- 12.4.7.3 Industrial and Manufacturing
- 12.4.7.4 Utilities and Infrastructure
- 12.4.8 Subsegment Pricing and Adoption Trends
- 12.4.9 Leading Suppliers and Competition
- 12.4.10 Regional Demand and Opportunities
- 12.5 By Technology - Market Size and Forecast, 2025-2035
- 12.5.1 Segment Definition and Scope
- 12.5.2 Historical Market Size, 2018-2025
- 12.5.3 Revenue Forecast, 2025-2035
- 12.5.4 Volume Forecast, 2025-2035
- 12.5.5 Base-Year Market Share, 2025
- 12.5.6 Segment CAGR and Growth Drivers
- 12.5.7 Subsegment Market Size and Forecast
- 12.5.7.1 Conventional Electrical Materials
- 12.5.7.2 Energy-Efficient Materials
- 12.5.7.3 Fire-Safe and Low-Smoke Materials
- 12.5.7.4 Smart and Connected Devices
- 12.5.8 Subsegment Pricing and Adoption Trends
- 12.5.9 Leading Suppliers and Competition
- 12.5.10 Regional Demand and Opportunities
- 12.6 Segment Growth Comparison
- 12.7 Segment Attractiveness and Priority Matrix
Chapter 13 Vietnam Electrical Materials End-Use and Application Market Outlook
- 13.1 End-Use Industry and Customer Demand Structure
- 13.2 Leading Applications and Customer Groups
- 13.3 End-Use Market Size, Share and Forecast
- 13.4 Major End-Use Industry Deep Dives
- 13.4.1 Customer Requirements and Use Cases
- 13.4.2 Demand and Replacement Cycles
- 13.4.3 Technical and Regulatory Considerations
- 13.4.4 Purchasing and Procurement Models
- 13.4.5 Leading Vendors and Distribution Channels
- 13.4.6 Forecast and Commercial Opportunities
- 13.5 Emerging Applications and Cross-Segment Demand
- 13.6 End-Use Industry Investment Priorities
Chapter 14 Vietnam Electrical Materials Geographic Market Outlook, 2025-2035
- 14.1 Domestic Market Distribution and Demand Clusters
- 14.2 State- or Province-Wise Market Size and Forecast, 2025-2035
- 14.3 City and Metropolitan Market Outlook
- 14.4 Industrial, Manufacturing and Commercial Clusters
- 14.5 Geographic Concentration of Key End Users
- 14.6 Local Pricing and Purchasing Differences
- 14.7 Domestic Production Facilities and Capacity Map
- 14.8 Local Infrastructure and Project Pipeline
- 14.9 State-Level Policy and Incentive Differences
- 14.10 Subnational Investment Hotspots and Opportunities
- 14.11 Distribution and Logistics Networks
- 14.12 Domestic Competitive Footprint
Chapter 15 Vietnam Electrical Materials Technology, Innovation and Sustainability Outlook
- 15.1 Technology Landscape and Maturity
- 15.2 Product, Process and Service Innovation
- 15.3 AI, Automation and Digital Tools in the Industry
- 15.4 Technology Adoption and Performance Benchmarking
- 15.5 Innovation Pipeline and R&D Investment
- 15.6 Patent and Intellectual Property Trends
- 15.7 Energy Efficiency and Resource Management
- 15.8 Sustainability, Recycling and Circularity
- 15.9 Technology Roadmap, 2025-2035
- 15.10 Risks of Obsolescence and Technology Substitution
Chapter 16 Vietnam Electrical Materials Market Key Strategic Imperatives
- 16.1 Growth and Market Entry Priorities
- 16.2 High-Return Products and Segments
- 16.3 Pricing, Profitability and Cost Optimization
- 16.4 Technology Investment and Product Differentiation
- 16.5 Supply Chain Localization and Resilience
- 16.6 Distribution and Customer Acquisition
- 16.7 Partnership, Acquisition and Capacity Strategy
- 16.8 Regional Expansion Priorities
- 16.9 Short-, Medium- and Long-Term Actions
Chapter 17 Competition Outlook
- 17.1 Industry Competition Characteristics
- 17.2 Market Structure and Concentration
- 17.3 Market Share and Competitive Positioning, 2025
- 17.4 Company-Wise Revenue and Product Benchmarking
- 17.5 Production and Service Capacity Benchmarking
- 17.6 Technology, Pricing and Differentiation
- 17.7 Regional Footprint and Distribution Strength
- 17.8 Mergers, Acquisitions and Strategic Alliances
- 17.9 New Entrants and Competitive Threats
- 17.10 Porter's Five Forces and Industry Attractiveness
- 17.11 Competitive Outlook, 2025-2035
Chapter 18 Company Profiles
- 18.1 Company Coverage and Selection Criteria
- 18.2 Vietnam Electric Cable Corporation (CADIVI)
- 18.2.1 Business Description
- 18.2.2 Company Ownership and Geographic Presence
- 18.2.3 Product and Service Portfolio
- 18.2.4 Manufacturing and Operating Footprint
- 18.2.5 Production Capacity and Expansion Plans
- 18.2.6 Financial Performance and Investment
- 18.2.7 Market Share and Competitive Position
- 18.2.8 Technology and Innovation Capabilities
- 18.2.9 Strategic Alliances or Partnerships
- 18.2.10 Recent Developments
- 18.2.11 Growth Strategy and Outlook
- 18.3 LS-VINA Cable & System
- 18.4 THIPHA Cable
- 18.5 Schneider Electric Vietnam
- 18.6 Panasonic Electric Works Vietnam
- 18.7 ABB Vietnam
- 18.8 TAYA Vietnam Electric Wire and Cable
- 18.9 DAPHACO Electric Cable Corporation
- 18.10 Tran Phu Electric Mechanical
- 18.11 Sino Electric Equipment
- 18.12 Other Relevant Market Participants
Note: Every listed company is profiled on the structure shown under the first company. The company list is preliminary and may change based on research findings, market developments, data availability and client requirements.
Chapter 19 Disclaimer
- 19.1 Research and Forecast Disclaimer
- 19.2 Data Source and Estimation Limitations
Note: The depth of individual sections depends on data availability for this market. Volume, capacity, trade and other unit-based metrics are included where applicable.

