
PUE rules and new halls set airflow spending in Japan
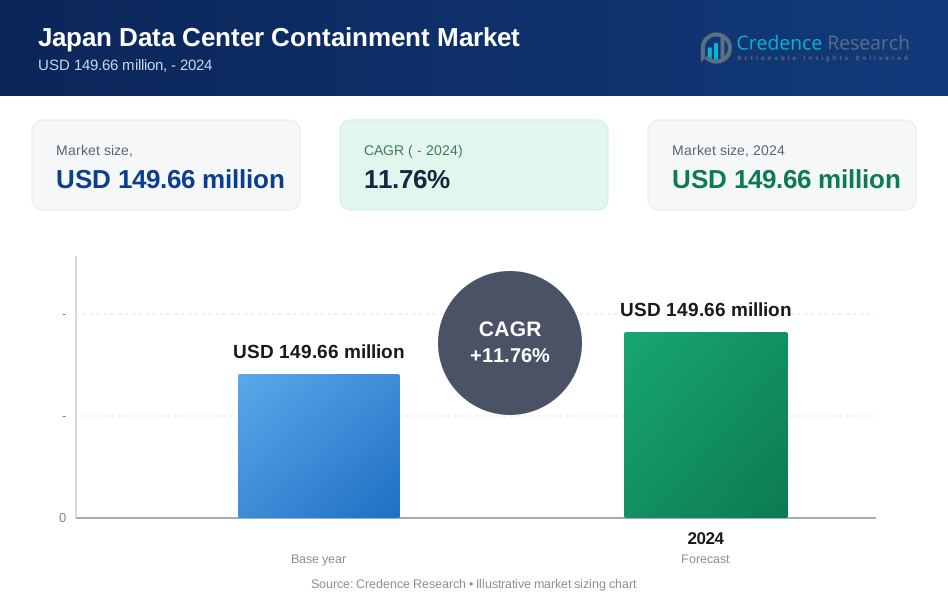
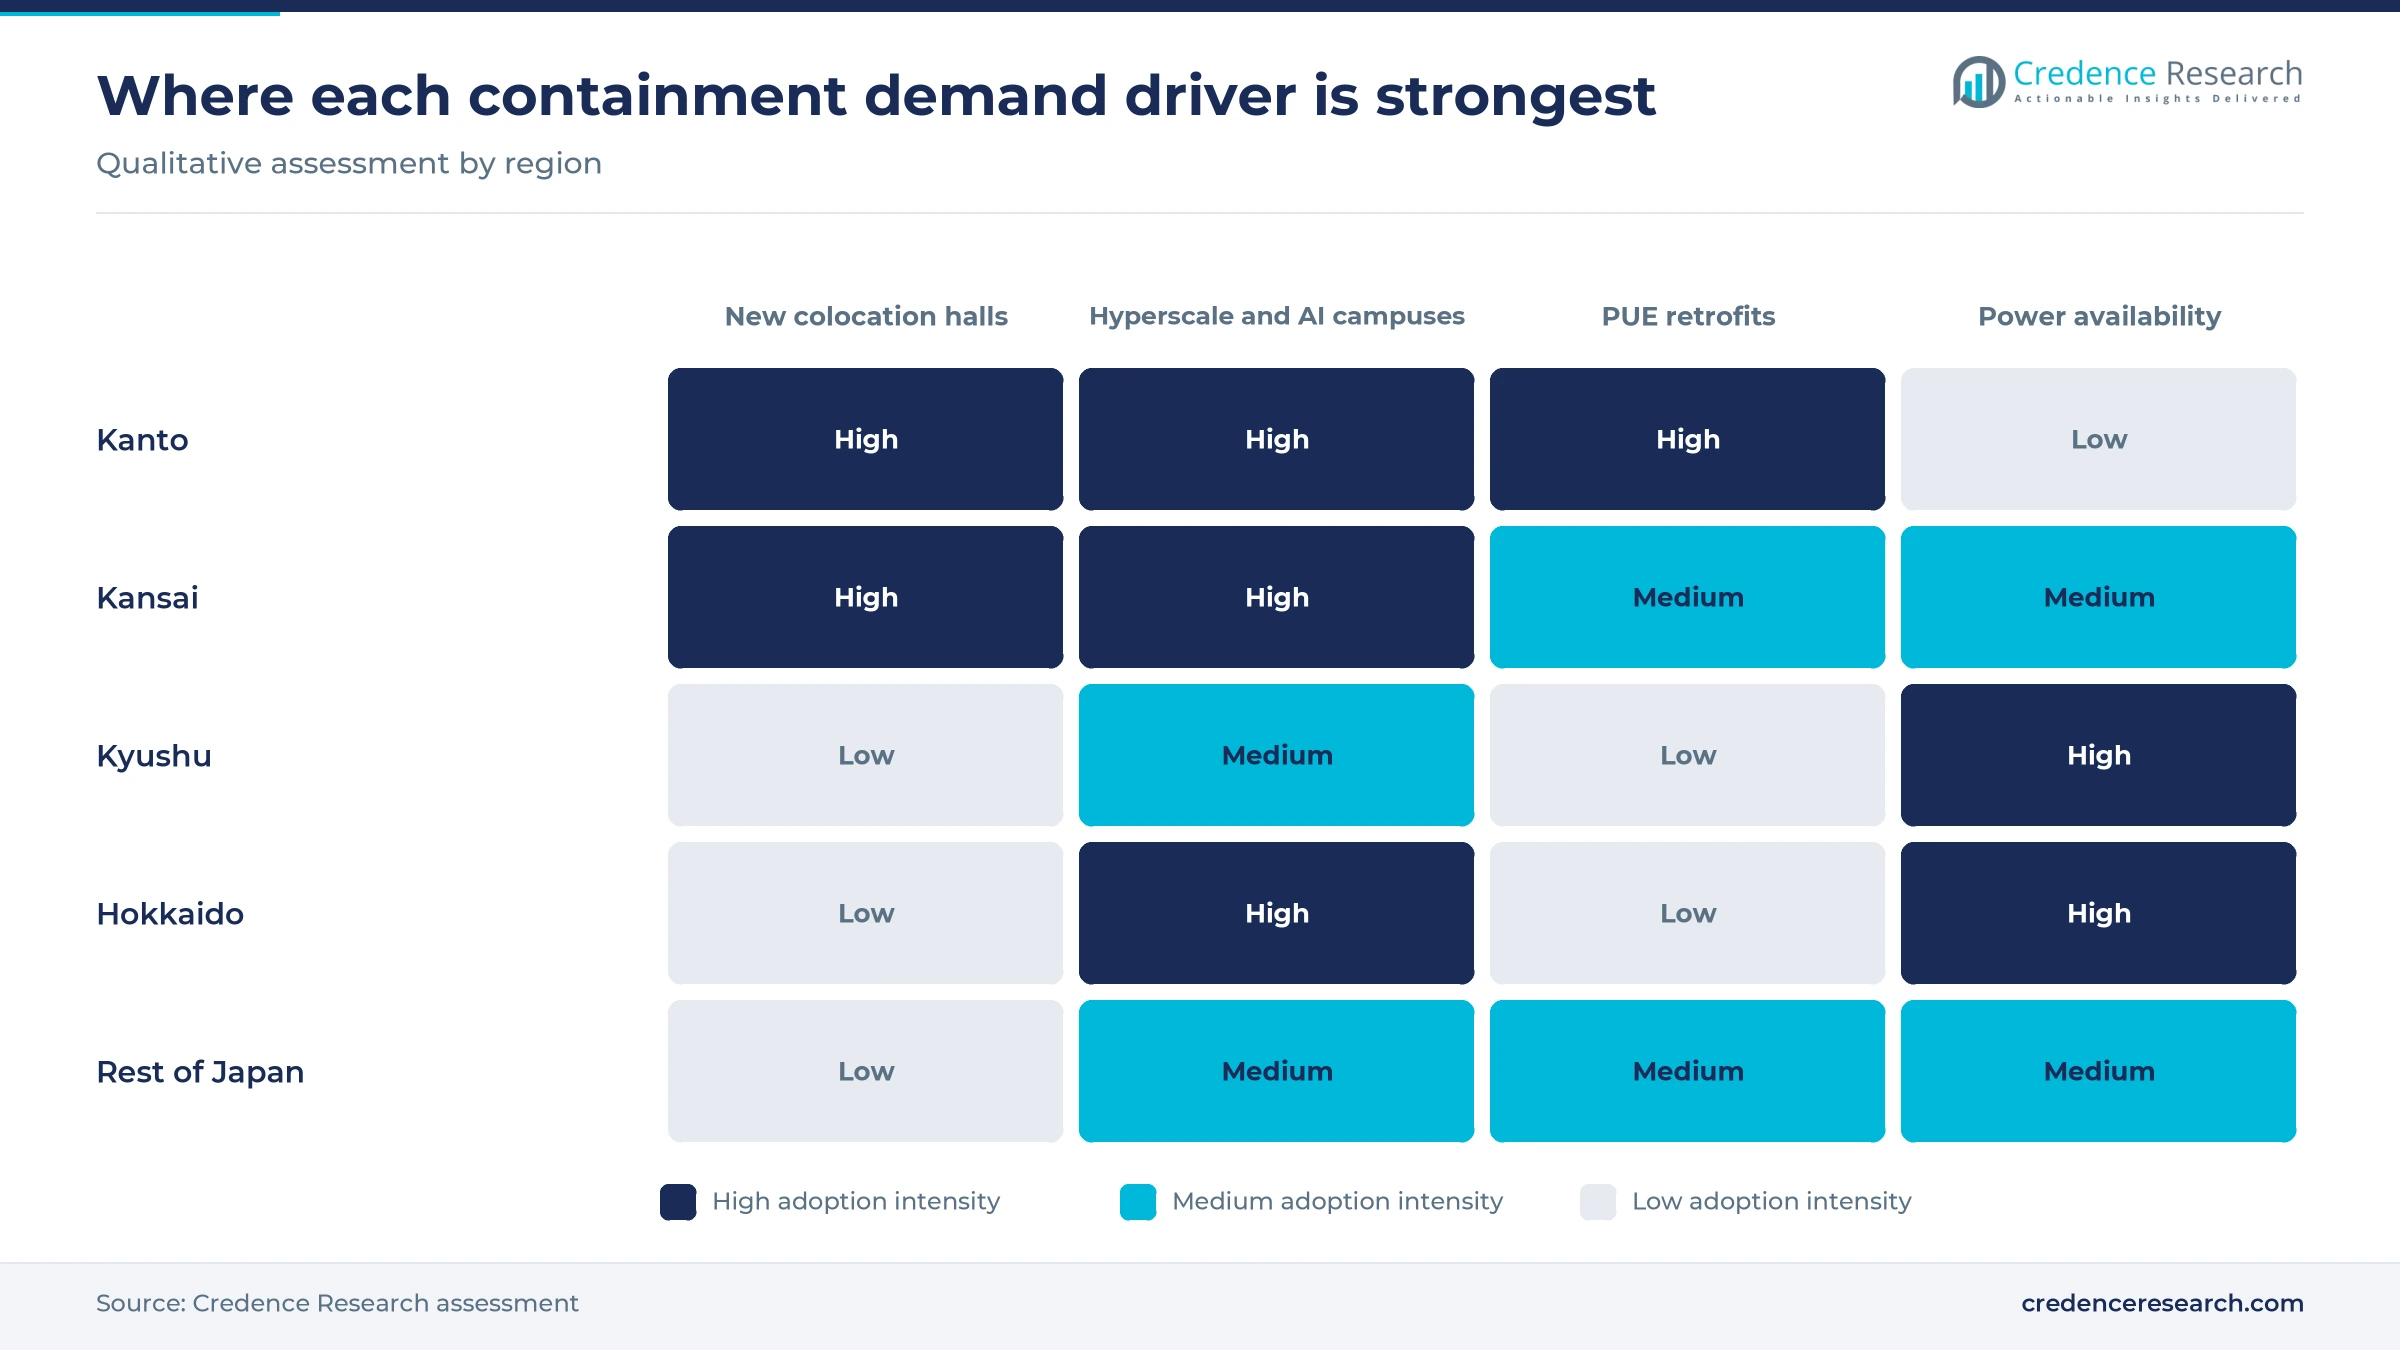
The Japan data center containment market was valued at USD 167.3 million in 2025 and is projected to increase from USD 186.9 million in 2026 to USD 508.5 million by 2035, registering a CAGR of 11.76% during 2026–2035. Demand comes from colocation operators fitting out new halls around Inzai and Osaka, from cloud providers expanding their Tokyo and Osaka regions, and from GPU cloud builders funded under national AI compute programs. Kanto held the largest regional share, 62.0% in 2025, because Greater Tokyo hosts most installed IT load. Hokkaido is the fastest-growing region, as cool climate and renewable power draw new AI campuses north. Efficiency rules under the energy conservation law took effect in April 2026 and require designated operators to report power usage effectiveness for each covered facility, which turns airflow containment from an optional upgrade into a compliance tool for older halls.
Aisle caps, doors and blanking hardware make up the count
The market counts the value of physical airflow containment installed in Japanese data centers. It covers cold aisle capping and hot aisle enclosures, aisle doors and roof panels, rack-based chimney ducts, in-row cooling pods, blanking panels, brush strips and the installation work that seals each rack row.
Cooling units, chillers, racks sold without containment and liquid cooling loops are excluded, although they decide which containment design a hall uses. Value moves from global and Japanese rack makers through electrical contractors and systems integrators to colocation operators, cloud providers and enterprise buyers.
Japan Data Center Containment Market Insights
- The Japan data center containment market rises from USD 167.3 million in 2025 to USD 508.5 million by 2035, an 11.76% CAGR during 2026–2035, as new halls and efficiency rules lift spending.
- Kanto held 62.0% of 2025 value, because Greater Tokyo had 1,086 MW of data center capacity in the first quarter of 2026, CBRE data show.
- Cold Aisle Containment held 40.0% of 2025 value, since raised-floor halls in Japan cap the cold aisle to stop supply air mixing with exhaust.
- Rules effective April 2026 set a PUE benchmark of 1.4 by fiscal 2030 and a 1.3 standard for data centers built from fiscal 2029.
- KDDI opened its 48 MW Osaka Sakai AI data center in January 2026 with water cooling for Nvidia GB200 NVL72 systems.
Cold aisle capping leads as in-row pods grow fastest
Cold aisle capping leads while in-row pods grow fastest
Based on containment type, the market is categorized into cold aisle containment, hot aisle containment, rack-based chimney containment and in-row cooling containment. Cold Aisle Containment led with 40.0% of 2025 value because most Japanese halls supply cool air through raised floors at moderate densities, and IDC Frontier still offers 6 or 8 kVA per rack as standard at Shirakawa and Kitakyushu. Capping the cold aisle above such racks is the cheapest way to stop mixing. In-Row Cooling Containment grows fastest at 13.3% a year, as GPU tenants push density past what floor tiles can deliver, and Equinix lists 8 kVA as the minimum cabinet density at its Tokyo TY15 site.
Colocation halls lead as hyperscale campuses grow faster
Based on data center type, the market is categorized into colocation data center, hyperscale data center, enterprise data center, cloud data center and others. Colocation Data Center led with 42.0% of 2025 value because multi-tenant operators fit out most new white space, and STACK Infrastructure delivered the first 18 MW building of a 36 MW Inzai campus in October 2024. Hyperscale Data Center grows fastest at 13.1% a year, as AirTrunk's TOK1 campus in Inzai is planned to scale beyond 300 MW for hyperscale anchor tenants, and each building phase needs sealed rows before cloud racks can be installed.
Modular kits lead while hybrid layouts grow fastest
Based on arrangement, the market is categorized into modular containment, rigid containment, hybrid containment and others. Modular Containment led with 45.0% of 2025 value because operators retrofit live halls without stopping servers, and Toa Electric Industry markets AisleLok panels that attach to racks with magnets and need no construction work. Hybrid Containment grows fastest at 13.0% a year, as operators mix air and liquid zones in one building, and the water-cooling system at KDDI's Sakai site covers only part of the floor space, Business Insider Japan reported in January 2026.
| Segment Group | Leading Sub-segment | Share, 2025 | Fastest-growing Sub-segment | CAGR, 2026–2035 |
|---|---|---|---|---|
| By Containment Type | Cold Aisle Containment | 40.0% | In-Row Cooling Containment | 13.3% |
| By Data Center Type | Colocation Data Center | 42.0% | Hyperscale Data Center | 13.1% |
| By Arrangement | Modular Containment | 45.0% | Hybrid Containment | 13.0% |
Rack positions and seismic scope set containment prices
Containment in Japan is priced per rack position or per contained row, and installation takes a large share because frames must be braced for earthquakes and panels must clear sprinkler or gas suppression paths. Large operators tender whole halls and push unit prices down, while enterprise rooms pay list prices for small orders. Imported hardware prices move with the yen, so suppliers with Japanese production or stock hold quotes longer. Margins are highest on engineered pods for GPU rows, where design work and sensors are bundled.
| Offer or input | Typical price or fee | Basis |
|---|---|---|
| Steel blanking panel, 1U, 19-inch rack | JPY 3,000 each, excluding tax | RS Components Japan list, November 2026 |
| Cold aisle capping kit per rack position | JPY 300,000 to JPY 500,000 installed | Credence Research estimate from list prices and installation inputs |
| Rack-based chimney duct per cabinet | JPY 80,000 to JPY 180,000 | Credence Research estimate from supplier price lists |
| Containment in a new colocation hall | USD 0.25 million to USD 0.6 million per MW of IT load | Credence Research estimate from 125 to 170 racks per MW |
Request a Free Sample
Fill in your details and we'll send you a free sample report.
- Sample data tables & charts
- Research methodology
Cloud capital, PUE targets and AI subsidies lift demand
Cloud capital commitments widen the build pipeline
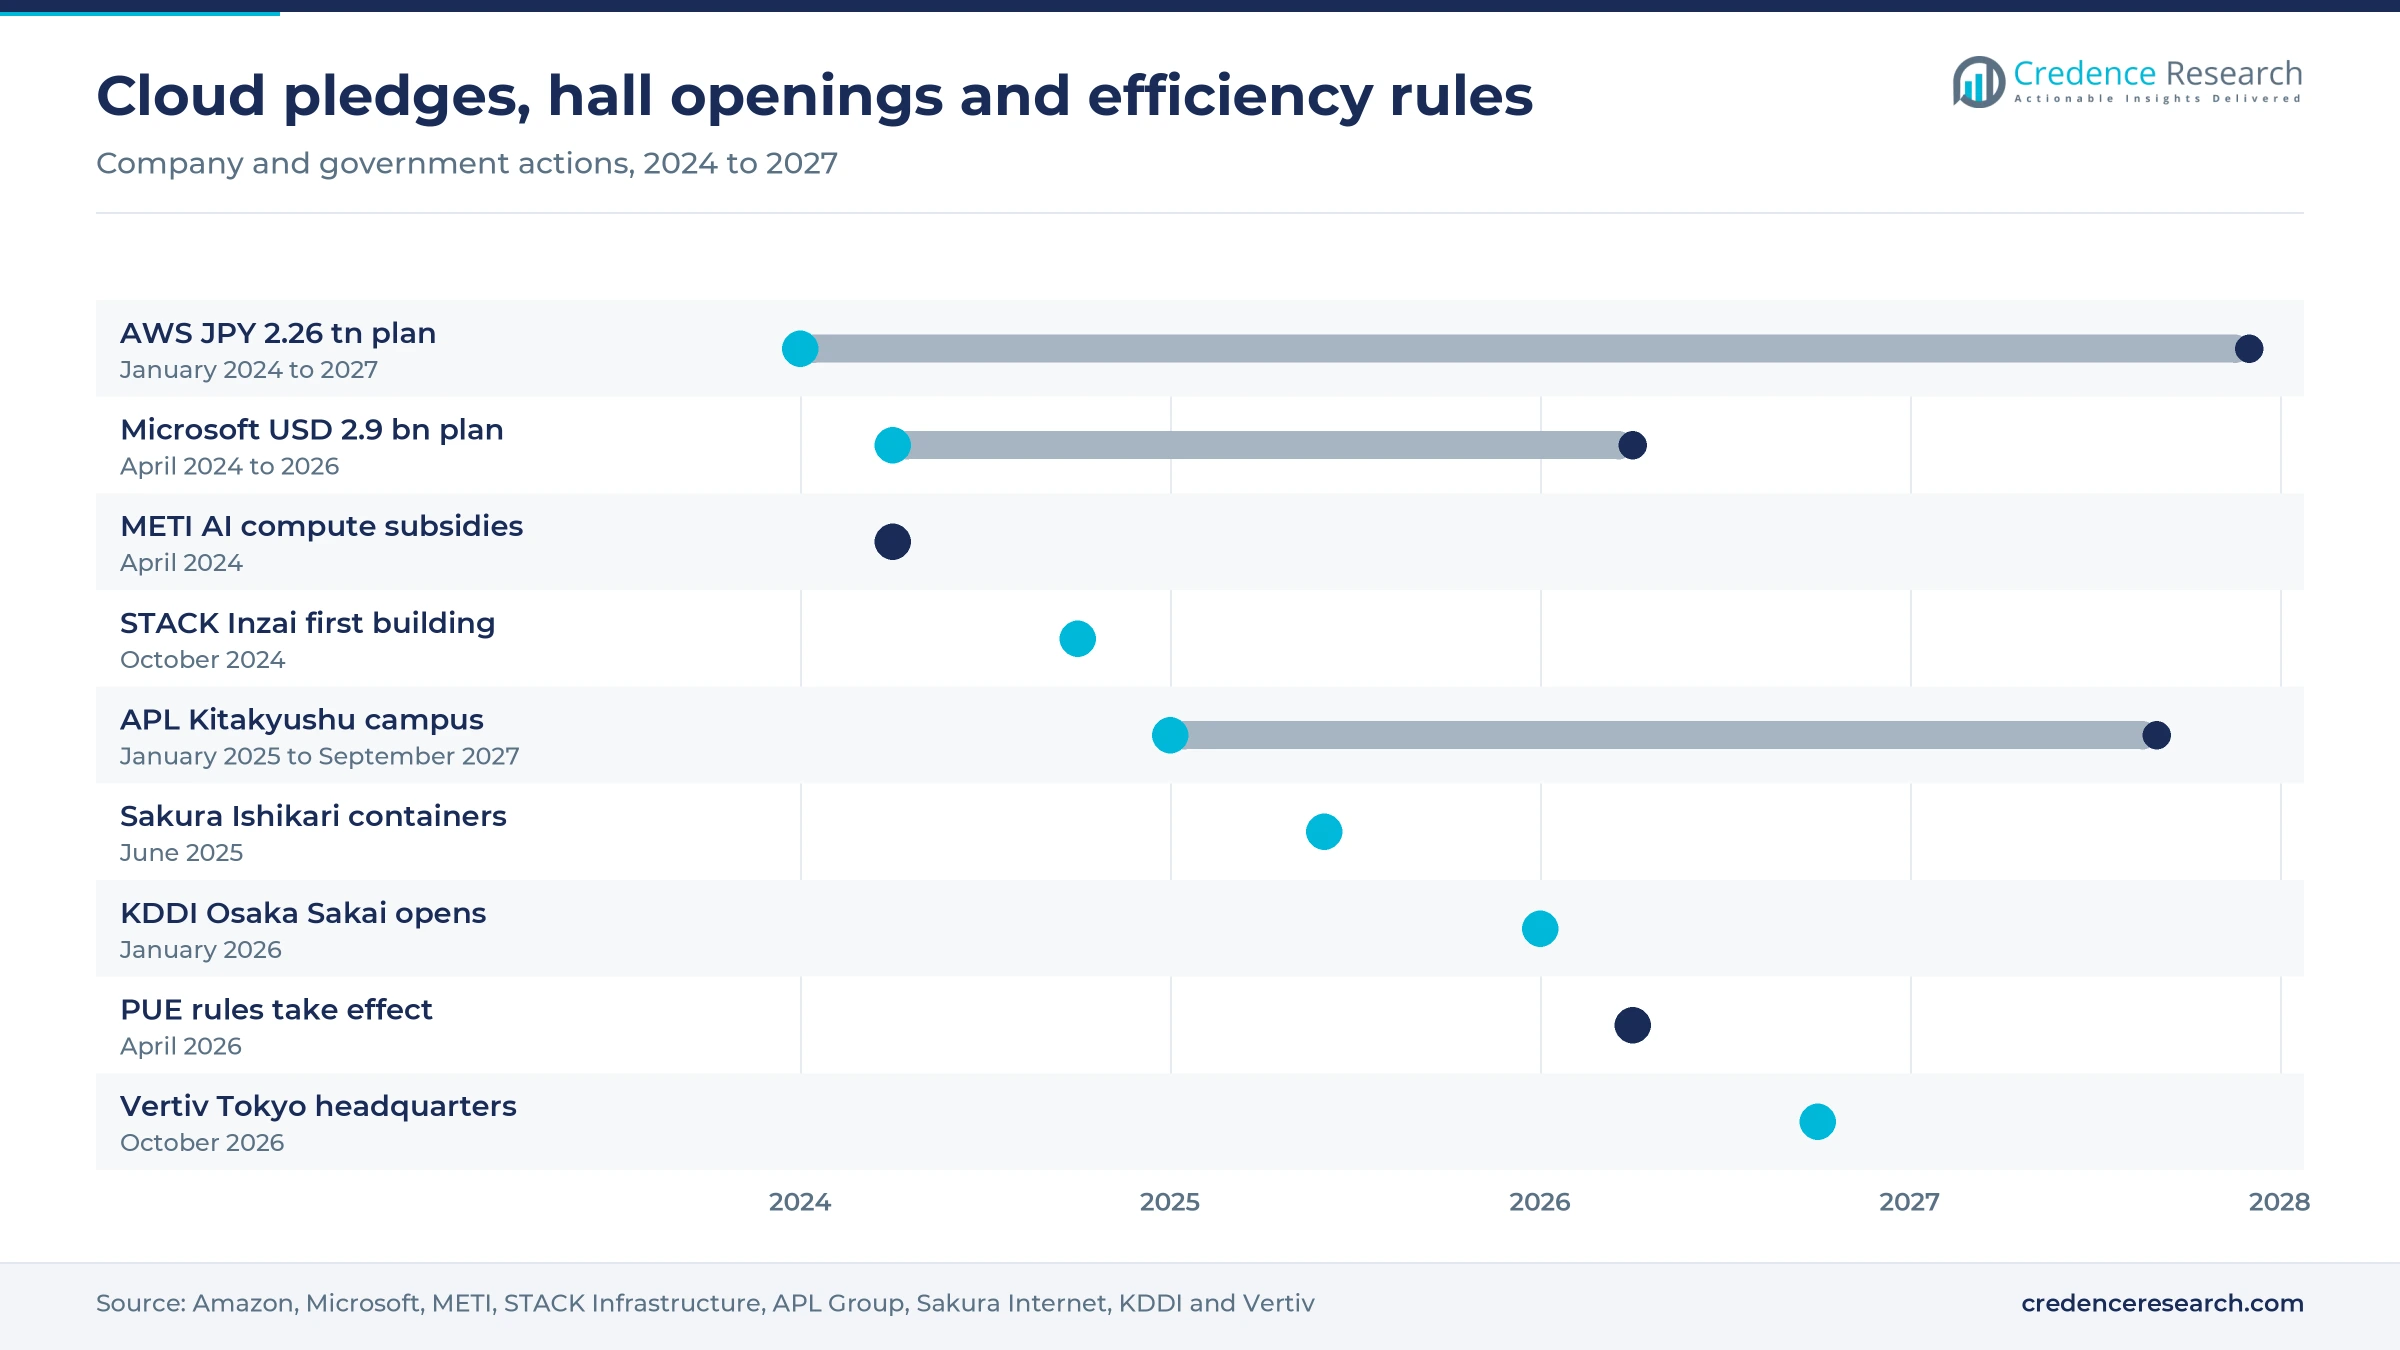
Hyperscale investment is funding capacity well beyond current tenant demand, and every committed megawatt becomes contained white space within two to four years. AWS plans to invest JPY 2.26 trillion in its Tokyo and Osaka regions through 2027, Amazon said in January 2024, after JPY 1.51 trillion between 2011 and 2022. Microsoft committed USD 2.9 billion over two years in April 2024 to expand hyperscale cloud and AI infrastructure in Japan, its largest single investment in the country. Greater Tokyo also has 2,544 MW of upcoming capacity, more than twice the operating base, CBRE data reported by Real Estate Asia show. Suppliers with hyperscale design approvals gain most, because these buyers order repeatable row packages across many halls.
Efficiency benchmarks turn containment into compliance
Binding efficiency targets give operators a measurable reason to seal aisles, since bypass air raises the power usage effectiveness they must now report. Designated data center operators must reach a PUE of 1.4 or lower by fiscal 2030, and data centers built from fiscal 2029 must reach 1.3 or lower, the Agency for Natural Resources and Energy says. Operators that miss the new standard must submit a rationalization plan and can face further administrative action. The rules took effect in April 2026, so demand from older halls now carries a compliance deadline. Older colocation halls with open aisles face the largest gap to 1.4, which favors suppliers that can retrofit live rows quickly and document the airflow gain.
National AI compute subsidies fund GPU halls
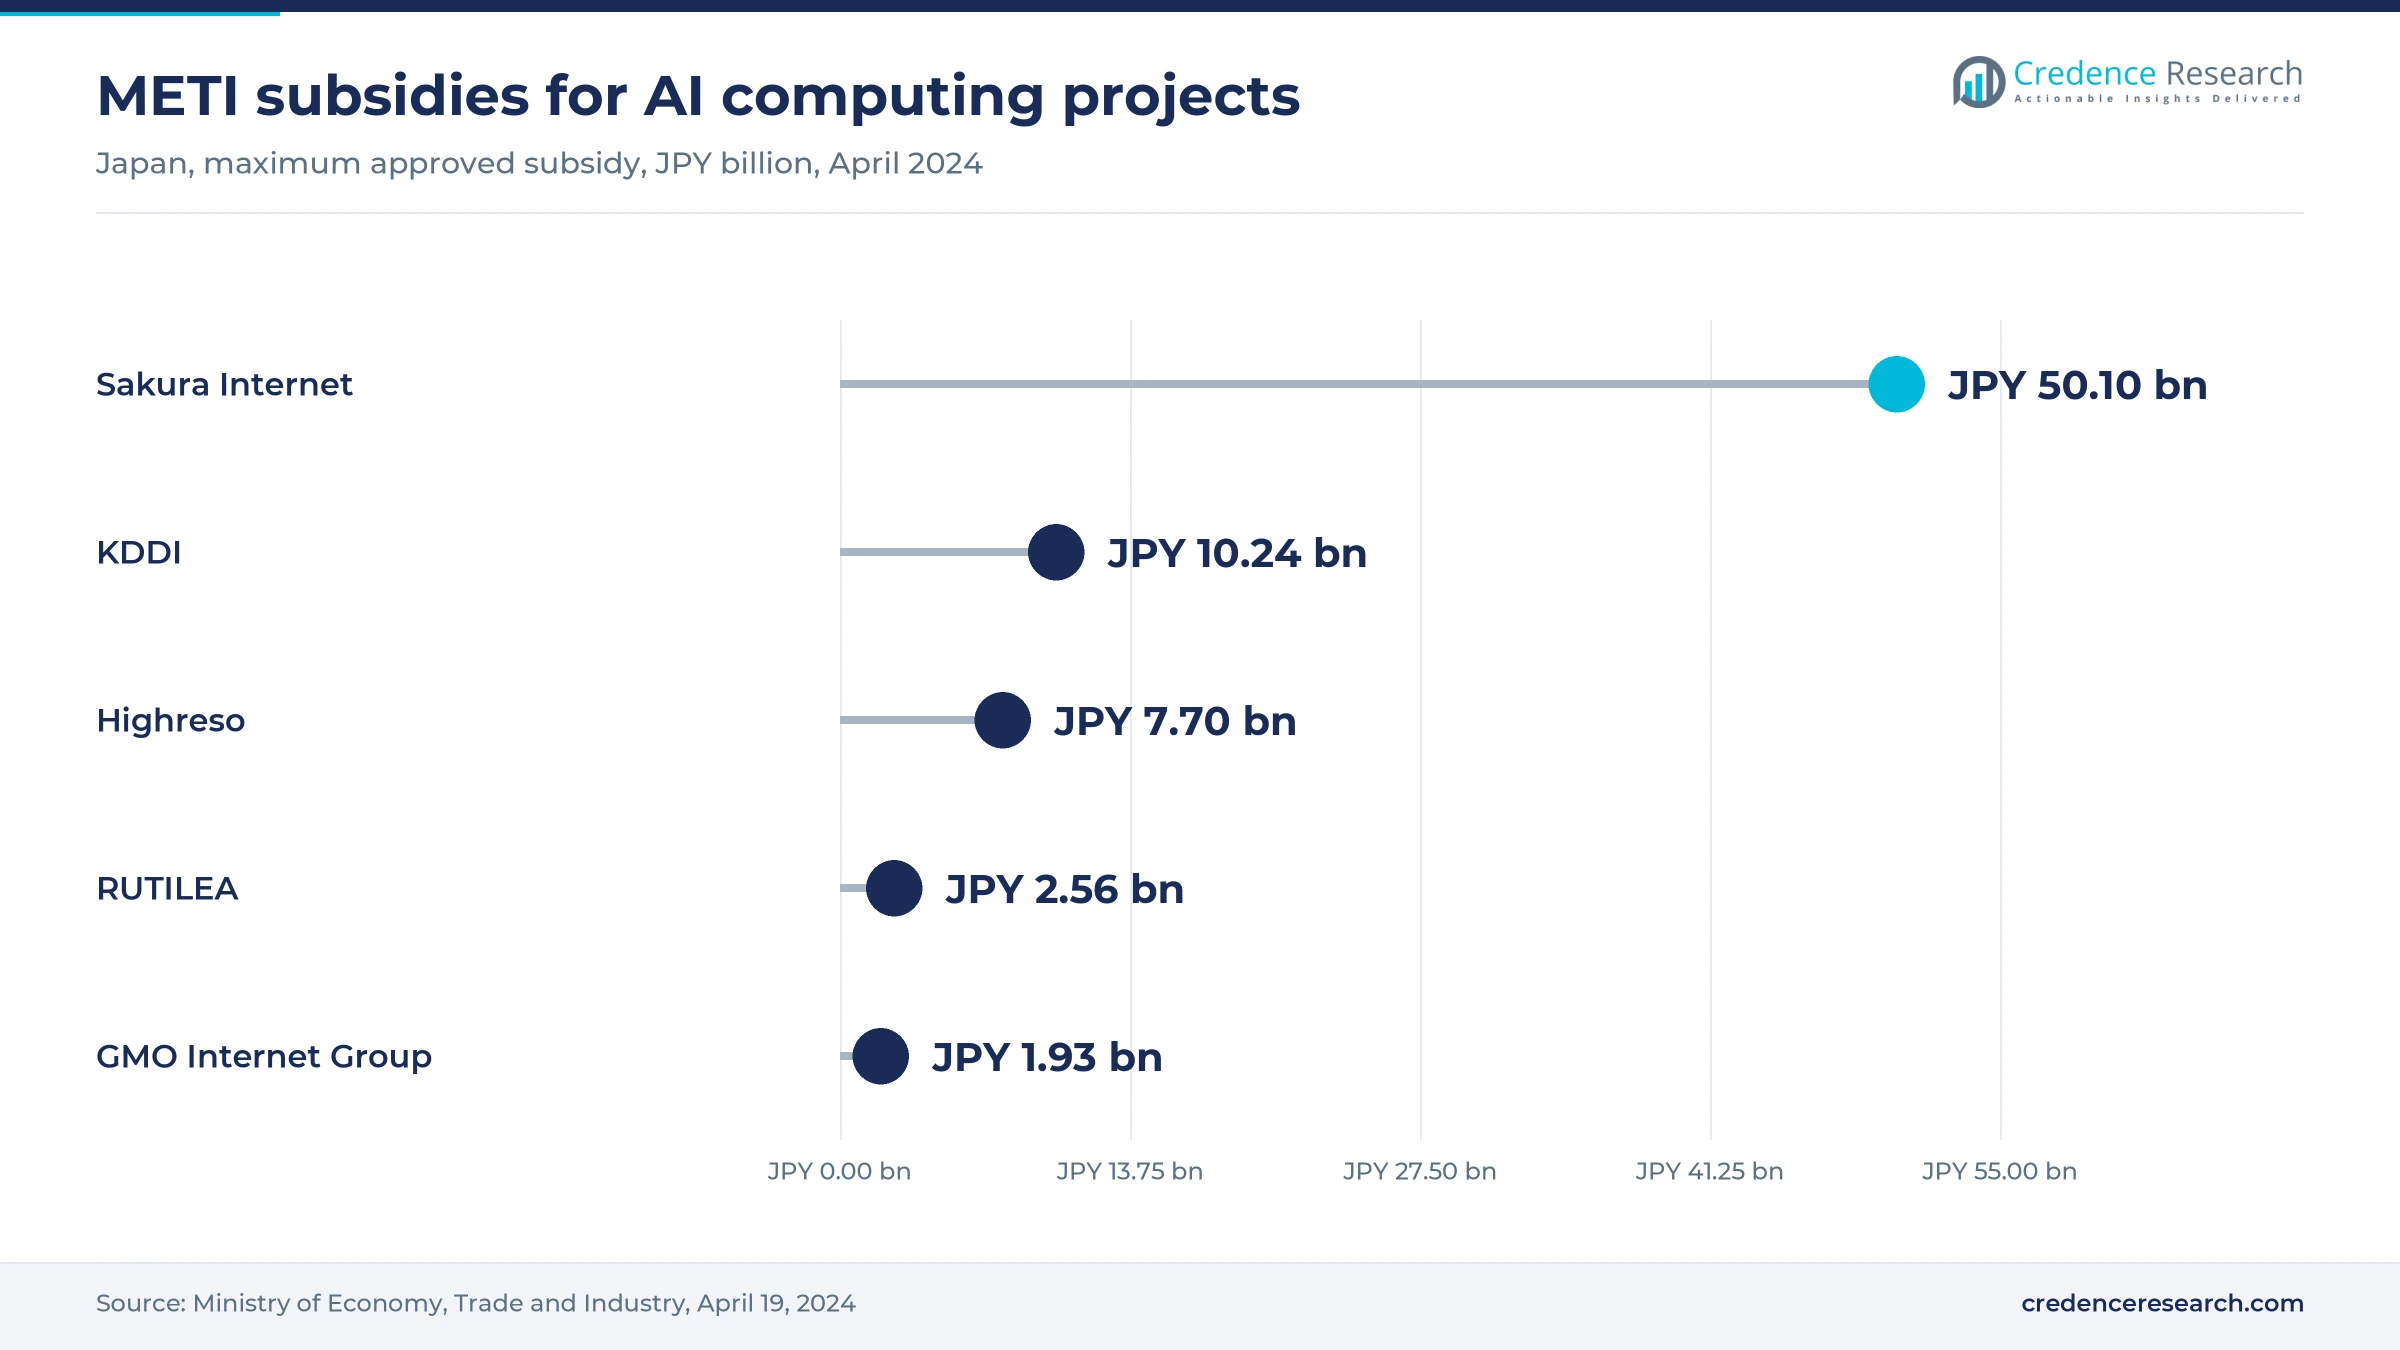
Public funding for domestic AI computing adds GPU halls that need sealed rows or liquid-ready enclosures. The Ministry of Economy, Trade and Industry approved subsidies of about JPY 72.5 billion for five AI computing projects in April 2024, led by up to JPY 50.1 billion for Sakura Internet and JPY 10.24 billion for KDDI. SoftBank's Tomakomai data center in Hokkaido also receives a METI subsidy and targets opening in the fiscal year ending March 2027, the company said in February 2026. These projects concentrate high heat loads in small areas, so they raise containment value per rack. Suppliers that pair containment with rear-door or in-row cooling benefit most from this subsidized demand.
Colocation hall openings add contained white space
Each new colocation hall needs containment before tenants move in, so the pace of hall completions sets much of annual demand. Equinix designed its Tokyo TY15 site with cold and hot aisle containment for about 1,200 cabinets in its first phase, the company said. ESR completed the first phase of its Cosmosquare campus in Osaka in August 2024, Mingtiandi reported, and STACK's second Inzai building remains under development. Each 18 MW building creates containment demand for roughly 2,250 to 3,050 rack positions, on Credence Research estimates. Hall-by-hall fit-outs reward suppliers that hold stock of standard doors and roof panels near Tokyo and Osaka.
GPU racks and no-build retrofits reshape containment
GPU racks shift halls toward sealed liquid-ready rows
Operators are shifting from capped air aisles toward sealed rows built around liquid cooling, because GPU racks exceed what raised floors can cool. KDDI opened its 48 MW Osaka Sakai site in January 2026 with water cooling for Nvidia GB200 NVL72 systems, Mingtiandi reported. Sakura Internet's container hall at Ishikari uses direct liquid cooling to raise GPU servers per rack from two to up to five, the company said. Schneider Electric told a September 2026 briefing in Tokyo that its Japanese liquid cooling sales had already reached a fivefold annual growth target in the first half. Containment suppliers that sell enclosures sized for manifolds and coolant distribution units gain from the shift.
No-build retrofit kits spread into live halls
Buyers are shifting toward containment that installs without construction, so live halls can cut cooling power without downtime or fire-system rework. Toa Electric Industry and Fujikawa Dendouki both distribute AisleLok panels from Upsite Technologies in Japan. Panduit Japan markets Net-Contain universal aisle containment as a freestanding frame for 42U to 52U cabinets and claims cooling energy cuts of up to 40%. Nikkabi sells Ailveil flame-retardant, static-resistant vinyl curtains that cap aisles in existing rooms and pair with underfloor fan units. These kits lower the entry cost of compliance projects, which widens the buyer base beyond large operators to enterprise and regional sites.
Hokkaido and Kyushu campuses open regional markets
AI campuses planned outside Tokyo and Osaka give containment suppliers new regional markets with different climate and power conditions. APL Group and Global Compute Infrastructure plan a 120 MW Kitakyushu campus with a first 60 MW phase once power arrives in September 2027, APL Group said, and aim for about 250 MW across Fukuoka Prefecture by 2029. Hokkaido offers subsidies of up to JPY 2.5 billion per project in zones such as Ishikari, White & Case noted in January 2026. These projects are plans rather than orders, so their timing remains uncertain. Installers with crews in Sapporo and Fukuoka can win work that Tokyo teams now travel to deliver.
Facility-level disclosure opens a measurement market
Public reporting of efficiency for each facility opens demand for containment that comes with sensors and verified airflow data. From fiscal 2026 submissions, operators must publish electricity use, PUE and targets for each covered data center on their websites by March 31, under the METI rules described above. Tenant-type hosting and cloud operators that lease space are now covered as well. Vertiv publishes Japanese reference designs for aisle-contained rows of five and eight racks at 40 kVA and 80 kVA. Suppliers that bundle containment with monitoring can sell measurable PUE gains, which tenants can then cite in their own disclosures.
Grid queues, liquid loops and seismic rules cap margins
Grid connection queues delay new Tokyo halls
Containment orders follow hall commissioning, so slow grid connections push supplier revenue into later years. Power connections in Tokyo take eight to 10 years, against three to five years in Osaka, and planned power supply in the Inzai and Shiroi area is reported to be fully allocated into the 2030s, JLL said in September 2025. Suppliers that stock doors and panels for announced Kanto halls are most exposed if connection dates slip.
Liquid cooling trims air containment per megawatt
Direct liquid cooling removes most heat at the chip, which lowers the air containment needed per megawatt in GPU halls. KDDI's Sakai team reported about a 60% cut in power use from water cooling, an early observation, Business Insider Japan said in January 2026. Schneider Electric now sells coolant distribution units, cold plates and rear-door units in Japan after buying Motivair in 2025. Makers of standard capping kits are most exposed as AI halls specify liquid loops.
Seismic and fire rules raise installed costs
Japanese halls require containment frames and panels that survive strong earthquakes and do not block fire suppression, which raises engineering and installation costs. Fujikawa Dendouki rates its earthquake-resistant data center racks to 1.25 times the Hyogo Southern Earthquake wave, or 1,000 gal. IDC Frontier asks customers to secure equipment to racks at Seismic Level 2 or higher. Imported kits designed for other markets often need local redesign, which squeezes margins for suppliers without Japanese engineering teams.
Construction labor shortages stretch delivery times
A shortage of construction workers slows hall fit-outs, and containment installation competes for the same electrical and interior crews. SoftBank said in February 2026 that the Hokkaido construction boom forced it to select contractors earlier than usual and use container-type UPS units and generators to cut on-site work. Regional projects in Hokkaido and Kyushu face the tightest labor markets. Suppliers without their own installation teams risk losing orders to integrated package vendors.
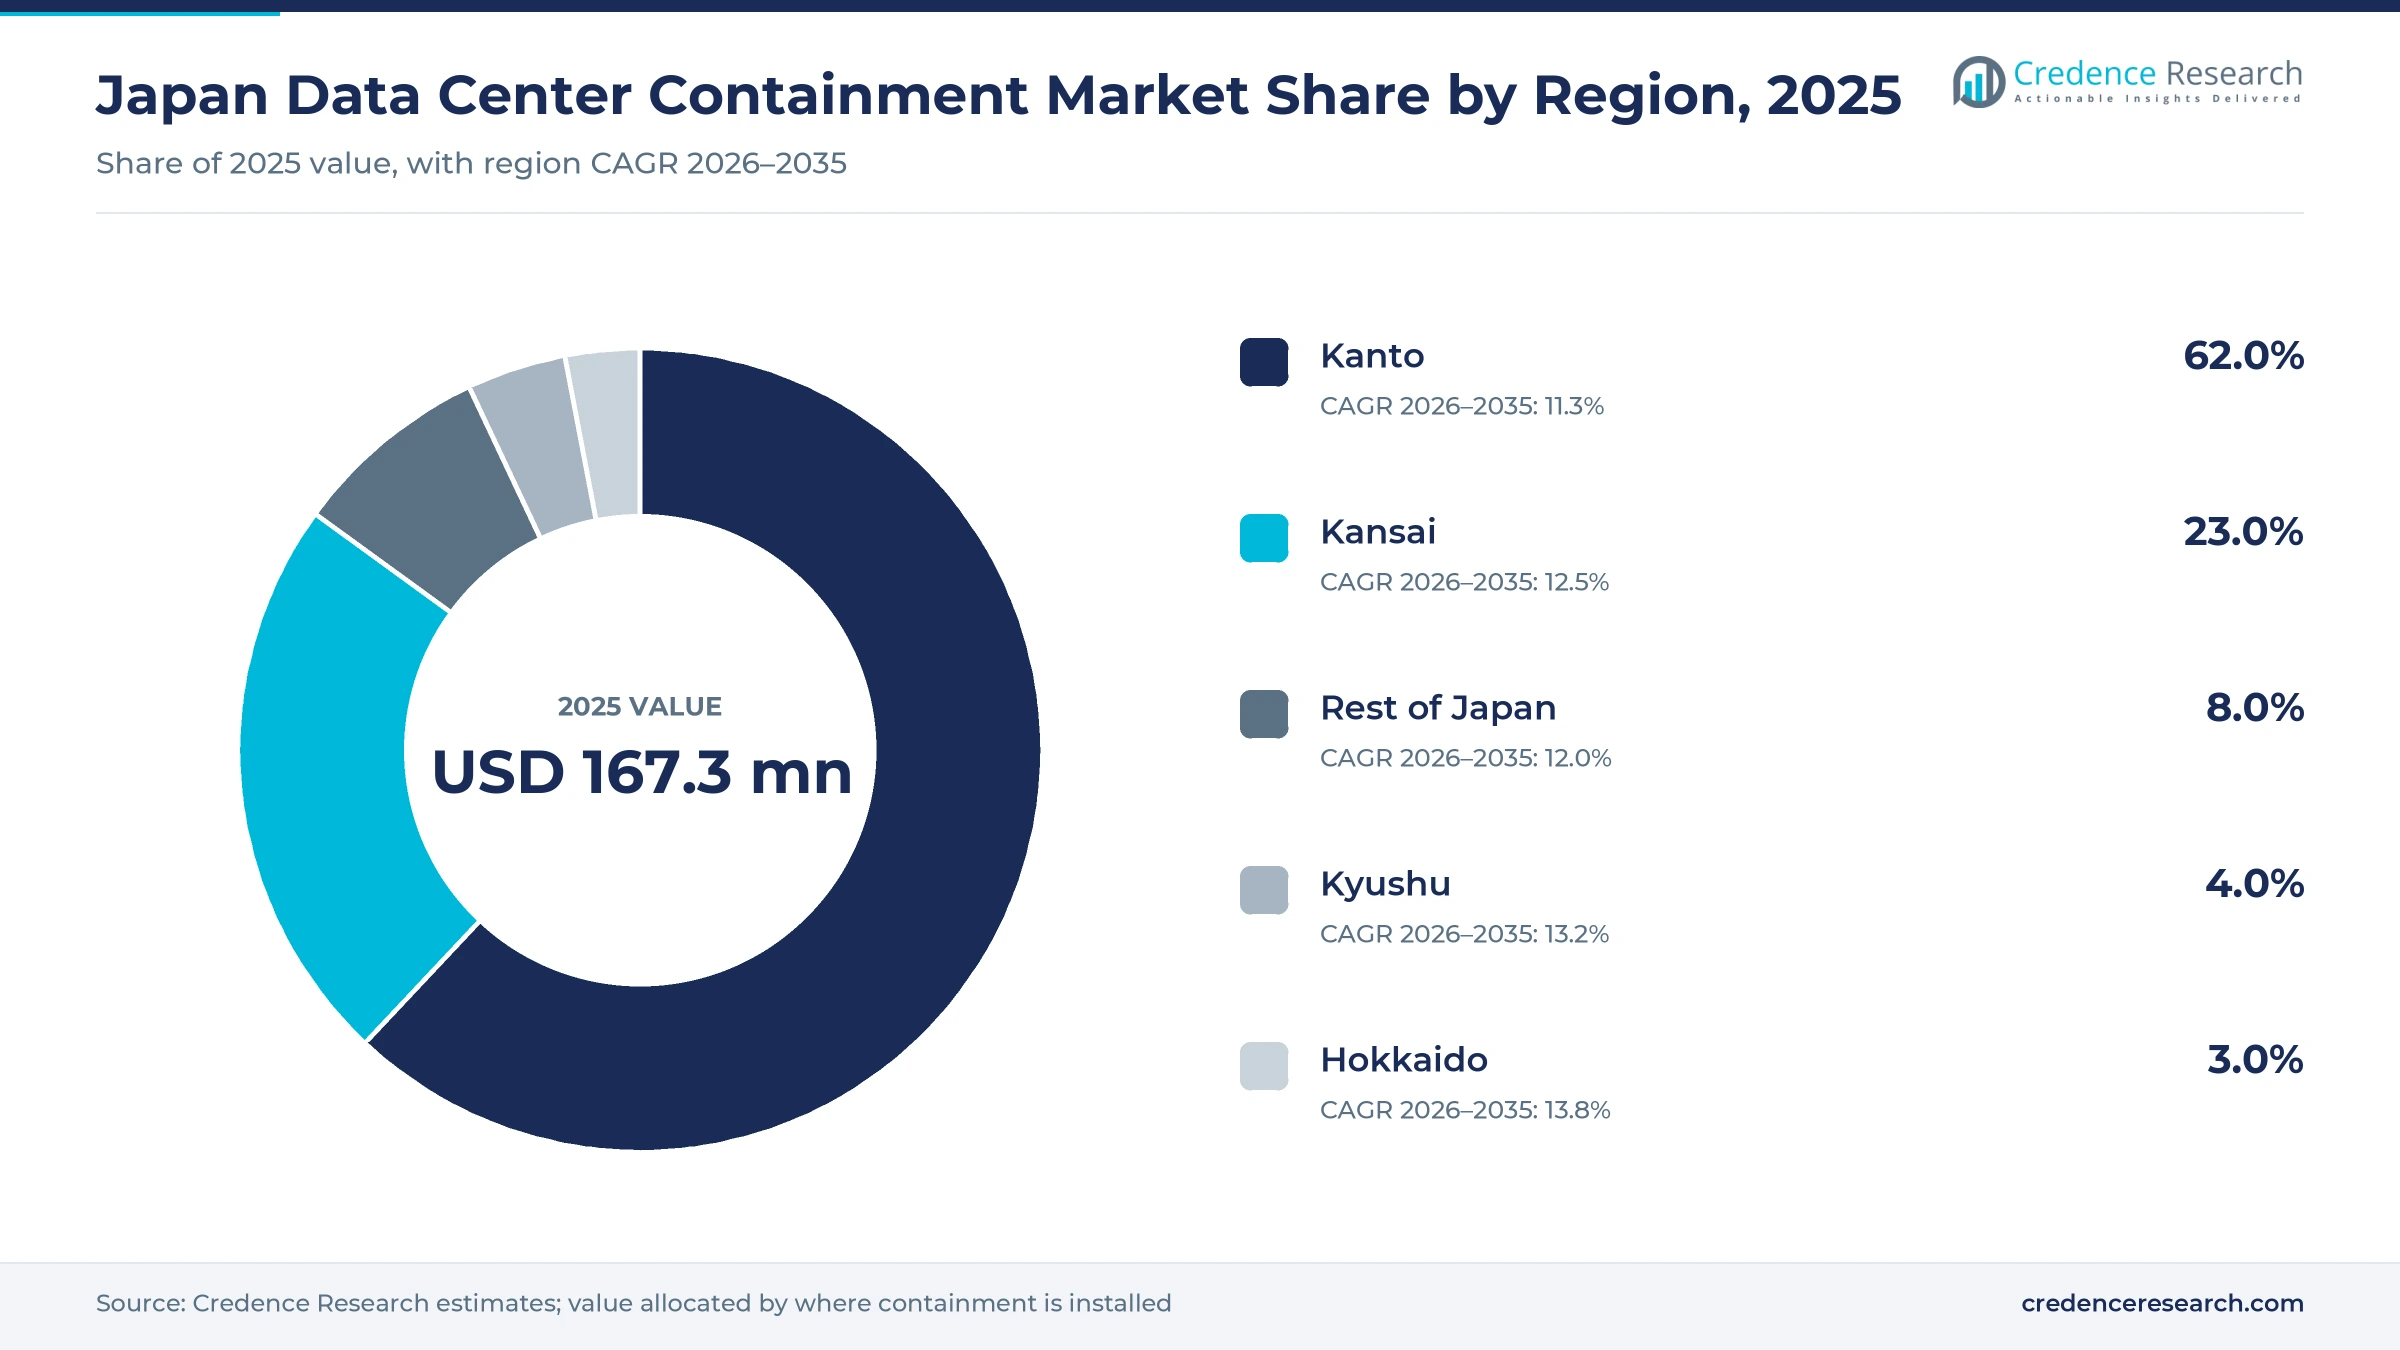
Kanto buys most as Hokkaido and Kyushu grow fastest
| Region | Value, 2025 (USD million) | Share, 2025 | CAGR, 2026–2035 |
|---|---|---|---|
| Kanto | 103.7 | 62.0% | 11.3% |
| Kansai | 38.5 | 23.0% | 12.5% |
| Rest of Japan | 13.4 | 8.0% | 12.0% |
| Kyushu | 6.7 | 4.0% | 13.2% |
| Hokkaido | 5.0 | 3.0% | 13.8% |
Kanto leads through Inzai and Tokyo campus clusters
Kanto held 62.0% of 2025 value and grows at 11.3% a year through 2035. Greater Tokyo carried 1,086 MW of data center capacity in the first quarter of 2026, CBRE data show, and Inzai in Chiba hosts the AirTrunk, STACK and hyperscale cloud campuses that order most new rows. The region grows below the national rate because grid queues cap how fast new halls open, so more of its value comes from retrofits that colocation operators need for PUE compliance.
Kansai grows faster as Osaka conversions add AI capacity
Kansai held 23.0% of 2025 value and grows at 12.5% a year. Osaka offers power connections in three to five years, well ahead of Tokyo, and SoftBank paid about JPY 100 billion for the larger part of the former Sharp Sakai plant to build an AI data center, while KDDI paid JPY 10 billion for its share. ESR's Cosmosquare campus adds further phases, so Kansai gains share from buyers that cannot wait for Kanto power and need hyperscale capacity sooner.
Hokkaido grows fastest on cool air and renewable power
Hokkaido held 3.0% of 2025 value and is the fastest-growing region at 13.8% a year. The Hokkaido and Honshu link is being raised from about 900 MW to 1.2 GW by fiscal 2028, and Equinix signed a 30 MW solar power purchase agreement in Hokkaido in 2025, White & Case noted. Cool outside air extends free-cooling hours, which raises the payback from tight containment and suits modular builds such as Sakura Internet's Ishikari containers.
Kyushu grows from a small base as Fukuoka campuses start
Kyushu held 4.0% of 2025 value and grows at 13.2% a year. IDC Frontier already runs an outside-air cooled facility in Kitakyushu, and the planned APL and Global Compute Infrastructure campus would add the first hyperscale-sized halls to the island. Kyushu Electric Power also joined a September 2025 demonstration of decentralized digital infrastructure with IIJ and QTnet, Japan Corporate News reported. Demand stays modest until the first large hall is commissioned, which is an evidence gap in public data.
Rest of Japan relies on enterprise rooms and AI pilots
Rest of Japan held 8.0% of 2025 value and grows at 12.0% a year. AI data centers are increasingly planned in Tohoku, Hokuriku and Shikoku, CBRE said in July 2025, and METI backed Highreso in Kagawa and RUTILEA in Fukushima under its AI compute subsidies. IDC Frontier's Shirakawa site in Fukushima also uses outside air for cooling. Much regional demand still comes from enterprise rooms that buy containment together with precision air conditioning units.
Hall openings, AI campuses and new efficiency rules
| Development | Status and market relevance |
|---|---|
| In October 2024, STACK Infrastructure delivered its first Japanese data center, an 18 MW building on a 36 MW campus in Inzai. | Completed; the second 18 MW building remains under development. |
| In January 2025, APL Group and Global Compute Infrastructure formed a joint venture to build a 120 MW campus in Kitakyushu. | Plan; construction could start in 2026 and power for 60 MW is due in September 2027. |
| In June 2025, Sakura Internet started operating a 40-rack container data center at Ishikari with direct liquid cooling. | Operational launch; about 3.5 MVA of power supply serves roughly 1,000 GPUs. |
| In January 2026, KDDI opened its 48 MW Osaka Sakai AI data center in the former Sharp LCD plant. | Operational launch; water cooling now covers part of the building, with room to expand. |
| In April 2026, new data center efficiency rules under the energy conservation law took effect across Japan. | In force; facility-level disclosure applies from fiscal 2026 submissions. |
Capped aisles, magnetic panels and sealed GPU rows
- Cold aisle capping seals the top and ends of a raised-floor aisle, which suits the moderate-density halls that still dominate Japanese colocation.
- Magnetic retrofit panels attach to existing racks without tools or construction, so live halls can close gaps without downtime.
- Sealed in-row pods enclose a short row with its own cooling units, which lets operators cool GPU cabinets without chilling the whole hall.
- Hybrid air and liquid layouts combine contained air aisles with liquid cooling loops, so one floor can host cloud racks and GPU servers.
Need a Custom Version of This Report?
Tailor the scope, geography, or segments to your exact requirements.
- Custom geography or segment scope
- Direct access to our analyst team
Global rack makers and Japanese specialists compete
Competition in the Japan data center containment market splits between global makers and Japanese specialists. Schneider Electric sells APC NetShelter racks and containment and set up a Japan One Solution Center of about 50 people in 2026 to design whole AI data center projects. Vertiv publishes aisle-contained reference designs for Japan and opened a Tokyo headquarters in October 2026. Rittal serves Japan from Yokohama with branches in Nagoya, Osaka and Fukuoka. Panduit and nVent sell aisle systems and in-row cooling through Japanese offices, while Upsite Technologies reaches buyers through distributors. Nikkabi, a Kanagawa rack maker, supplies aisle curtains and capping for existing server rooms and older halls. Buyers judge suppliers on seismic ratings, fire-code compliance, delivery lead times and whether containment ships with power and cooling.
How is the supply side organized?
The supply side serving Japanese buyers runs in three tiers. Global rack and cooling makers, led by Schneider Electric, Vertiv and Rittal, design containment systems and sell them through Japanese subsidiaries. Specialists such as Panduit, nVent and Upsite Technologies supply aisle systems and panels, often through Japanese distributors. Domestic rack makers such as Nikkabi build curtains and capping for existing rooms. Entry barriers sit in seismic certification, fire-code compliance and framework agreements with large operators, and margins are highest in engineered GPU rows.
Containment suppliers Japanese buyers shortlist
| Company | Type | Role in the market |
|---|---|---|
| Schneider Electric | Full-line supplier | Sells APC NetShelter racks, aisle containment and prefabricated modular data center rooms |
| Vertiv | Full-line supplier | Supplies rack-independent aisle containment with power and thermal systems in Japan |
| Rittal | Rack and enclosure maker | Sells IT racks, enclosures and cooling units through Rittal K.K. in Yokohama |
| Panduit | Specialist | Sells Net-Contain universal aisle containment for 42U to 52U cabinets |
| nVent | Specialist | Sells Schroff aisle containment and RackChiller in-row cooling through nVent Japan |
| Upsite Technologies | Specialist | Supplies AisleLok magnetic containment panels through Japanese distributors |
| Nikkabi | Local manufacturer | Makes 19-inch racks and Ailveil aisle curtains for existing data center rooms |
Efficiency reporting, not floor area, will set value
Credence Research's view is that facility-level efficiency reporting, not new floor area alone, will decide how much value the market adds by 2035. Cold aisle capping held 40.0% of 2025 demand because Japanese halls run raised floors at moderate densities. However, the PUE rules now in force push owners of older halls to seal and measure every row. GPU halls will lean on liquid loops after 2030, trimming air containment per megawatt. Suppliers that pair seismic-rated kits with sensors and local crews should gain the most share.
Estimates rest on capacity, price and company data
The report uses 2025 as the base year and 2026 to 2035 as the forecast period. The 2025 value brings the earlier Credence Research estimate for 2024 forward at its own growth rate and was checked against installed capacity, new hall completions, racks per megawatt and containment prices. Market values come from the Credence Research model, and the regional, containment type, data center type and arrangement splits are Credence Research estimates informed by public data. Sources include Agency for Natural Resources and Energy rules, METI subsidy notices, operator and supplier releases, and Japanese and regional business publishers. No interviews or surveys were used to build these estimates.
Power queues and liquid cooling shape value to 2035
Credence Research expects containment value to reach USD 508.5 million by 2035 as announced colocation, cloud and AI campuses move from land and power applications to fitted halls. Hokkaido should keep the fastest pace, while Kanto remains the largest source of value. In-row cooling pods grow at 13.3% a year during 2026–2035 as GPU racks spread and lift demand for sealed rows. The main risks are grid connection queues in Kanto and faster liquid cooling, while PUE-driven retrofits of older halls offer upside throughout the period.
Power queues and liquid cooling set the range
The range to 2035 depends mainly on how many announced megawatts receive grid connections and on how quickly GPU halls move heat removal into liquid loops. Colocation fit-outs and PUE retrofits support every case, but power allocation in Kanto decides how many halls open each year. Regional campuses in Hokkaido and Kyushu add upside if transmission upgrades arrive on time, while a weaker yen would raise imported hardware prices and slow smaller enterprise projects.
| Scenario | CAGR, 2026–2035 | Value, 2035 | What has to hold |
|---|---|---|---|
| Downside | 8.8% | USD 398.0 million | Kanto grid queues delay new halls and GPU halls adopt liquid loops quickly |
| Base | 11.76% | USD 508.5 million | Announced Inzai, Osaka and Hokkaido phases open broadly on schedule |
| Upside | 13.8% | USD 596.5 million | Regional campuses open early and older halls retrofit at scale for PUE targets |
Frequently Asked Questions
How big is the Japan data center containment market?
How much data center capacity does Greater Tokyo have?
Which containment type leads in Japan?
What does containment cost in Japan?
How do Japan's PUE rules affect containment demand?
Which region leads containment demand?
What are the main challenges for containment suppliers?
Who are the main companies in this market?
Table of Content
Chapter 1 Market Segmentation
- 1.1 Segmentation Framework
- 1.1.1 Product and Service Classification
- 1.1.2 Application and End-Use Classification
- 1.1.3 Technology and Solution Classification
- 1.1.4 Customer and Distribution Channel Classification
- 1.1.5 Geographic Segmentation
- 1.1.6 Market Segment Definitions and Boundaries
- 1.2 By Containment Type
- 1.2.1 Cold Aisle Containment
- 1.2.2 Hot Aisle Containment
- 1.2.3 In-Row Cooling Containment
- 1.2.4 Rack-Based Chimney Containment
- 1.3 By Data Center Type
- 1.3.1 Colocation Data Center
- 1.3.2 Hyperscale Data Center
- 1.3.3 Enterprise Data Center
- 1.3.4 Cloud Data Center
- 1.3.5 Others
- 1.4 By Arrangement
- 1.4.1 Modular Containment
- 1.4.2 Rigid Containment
- 1.4.3 Hybrid Containment
- 1.4.4 Others
Chapter 2 Introduction
- 2.1 Report Objectives and Scope
- 2.2 Product Definition and Industry Terminology
- 2.3 Market Inclusions and Exclusions
- 2.4 Research Process
- 2.4.1 Primary Research and Expert Interviews
- 2.4.2 Secondary Research and Source Review
- 2.4.3 Top-Down and Bottom-Up Estimation
- 2.4.4 Data Triangulation and Verification
- 2.5 Market Size Measurement Basis
- 2.5.1 2025: USD 167.3 million → 2035: USD 508.5 million
- 2.6 Historical and Forecast Reference Periods
- 2.6.1 Historical Period: 2018-2025
- 2.6.2 Base Year: 2025
- 2.6.3 Forecast Period: 2025-2035
- 2.7 Research Assumptions and Limitations
Chapter 3 Executive Summary
- 3.1 Market Snapshot and Key Findings
- 3.2 Base-Year Market Size, 2025
- 3.3 Forecast Market Size, 2035
- 3.4 Revenue and Volume Growth Outlook
- 3.5 Key Demand and Supply Indicators
- 3.6 Leading Market Segments
- 3.7 Fastest-Growing Market Opportunities
- 3.8 Regional Performance Highlights
- 3.9 Technology and Industry Transformation
- 3.10 Competitive Landscape Summary
- 3.11 Analyst View and Strategic Implications
Chapter 4 Japan Data Center Containment Market Trends and Developments
- 4.1 Historical Industry Development, 2018-2025
- 4.2 Recent Market Trends and Developments
- 4.3 Demand and Customer Behavior Trends
- 4.4 Technology and Product Innovation
- 4.5 Artificial Intelligence, Automation and Digitalization
- 4.6 Local Manufacturing and Supply Chain Realignment
- 4.7 Industry Partnerships, Mergers and Acquisitions
- 4.8 Sustainability and Circular Economy Developments
- 4.9 Government and Private Sector Investment Trends
- 4.10 Emerging Business Models and Commercialization
- 4.11 Industry Developments and Announcements
Chapter 5 Japan Data Center Containment Market Production, Supply and Demand Analysis
- 5.1 Demand Trend and Consumption Analysis, 2018-2025
- 5.2 Demand Forecast, 2025-2035
- 5.3 Production and Output Trend, 2018-2025
- 5.4 Production and Output Forecast, 2025-2035
- 5.5 Installed Capacity and Capacity Utilization
- 5.6 Company-Wise Production Plants and Statistics
- 5.6.1 Installed Production Capacity
- 5.6.2 Actual Production
- 5.6.3 Planned Capacity and Expansion Targets
- 5.7 Supply Chain Structure and Procurement Trends
- 5.8 Supply-Demand Gap and Bottlenecks
- 5.9 Import Dependence and Sourcing Structure
- 5.10 Contract Manufacturing and Outsourcing
- 5.11 Regional Supply and Demand Concentration
Chapter 6 Japan Data Center Containment Market Pricing Analysis
- 6.1 Pricing Structure and Measurement
- 6.2 Historical Pricing Trends, 2018-2025
- 6.3 Pricing Outlook, 2025-2035
- 6.4 Average Selling Price and Unit Economics
- 6.5 Pricing by Product and Market Segment
- 6.6 Geographic Pricing Differences
- 6.7 Key Input, Energy, Labor and Logistics Costs
- 6.8 Contract Pricing and Purchasing Models
- 6.9 Pricing Sensitivity and Competitive Positioning
- 6.10 Price, Margin and Profitability Implications
Chapter 7 Japan Data Center Containment Market Dynamics
- 7.1 Market Growth Drivers
- 7.1.1 Demand-Side Drivers
- 7.1.2 Technology and Innovation Drivers
- 7.1.3 Infrastructure and Investment Drivers
- 7.1.4 Regulatory and Policy Drivers
- 7.2 Market Restraints
- 7.2.1 Cost and Affordability Constraints
- 7.2.2 Technology and Adoption Barriers
- 7.2.3 Supply Chain and Operational Constraints
- 7.3 Market Challenges
- 7.3.1 Competitive Pressure and Margin Erosion
- 7.3.2 Skills, Infrastructure and Implementation Gaps
- 7.4 Emerging Market Opportunities
- 7.5 Market Dynamics Impact and Time-Horizon Assessment
Chapter 8 Japan Data Center Containment Value Chain Analysis
- 8.1 Industry Value Chain Overview
- 8.2 Upstream Suppliers and Critical Inputs
- 8.3 Technology and Component Providers
- 8.4 Manufacturing or Service Delivery
- 8.5 Distribution, Channel Partners and Integrators
- 8.6 Downstream Applications and End Users
- 8.7 Value Addition and Profit Pools
- 8.8 Vertical Integration and Outsourcing
- 8.9 Supplier Concentration and Risk
- 8.10 Supply Chain Localization and Resilience
Chapter 9 Japan Data Center Containment Market Regulations and Policies
- 9.1 Relevant Laws, Standards and Compliance Frameworks
- 9.2 Product, Service, Safety and Quality Requirements
- 9.3 Government Policies, Incentives and Subsidies
- 9.4 Imports, Exports and Trade Barriers
- 9.5 Public Procurement and Local Content Requirements
- 9.6 Environmental and Sustainability Compliance
- 9.7 Data Protection, AI and Cybersecurity Compliance
- 9.8 Upcoming Policy Changes and Market Implications
Chapter 10 Japan Data Center Containment Market Hotspots and Opportunities
- 10.1 Market Opportunity Mapping and Growth Hotspots
- 10.2 High-Growth Applications and Customer Groups
- 10.3 Underserved Markets and White-Space Opportunities
- 10.4 Emerging Technology and Product Opportunities
- 10.5 New Capacity and Investment Hotspots
- 10.6 Market Entry and Expansion Opportunities
- 10.7 Distribution and Partnership Opportunities
- 10.8 Near-Term and Long-Term Commercial Potential
- 10.9 Opportunity Attractiveness and Execution Risks
Chapter 11 Japan Data Center Containment Market Outlook, 2025-2035
- 11.1 Market Size and Analysis
- 11.1.1 Revenue (Market Measurement: 2025: USD 167.3 million → 2035: USD 508.5 million)
- 11.1.2 Market Volume and Quantity Sold
- 11.1.3 Historical Market Size, 2018-2025
- 11.1.4 Base-Year Market Size, 2025
- 11.2 Market Forecast, 2025-2035
- 11.2.1 Revenue Forecast to 2035
- 11.2.2 Volume Forecast to 2035
- 11.2.3 CAGR and Year-on-Year Growth
- 11.2.4 Incremental Revenue Opportunity
- 11.3 Forecast Assumptions and Scenario Analysis
- 11.3.1 Base-Case Forecast
- 11.3.2 Optimistic and Conservative Scenarios
- 11.3.3 Technology, Pricing and Policy Sensitivities
- 11.4 Market Attractiveness and Growth Outlook
Chapter 12 Japan Data Center Containment Market Segmentation and Outlook
- 12.1 Segmentation Summary and Market Shares, 2025
- 12.2 Largest and Fastest-Growing Segments
- 12.3 By Containment Type - Market Size and Forecast, 2025-2035
- 12.3.1 Segment Definition and Scope
- 12.3.2 Historical Market Size, 2018-2025
- 12.3.3 Revenue Forecast, 2025-2035
- 12.3.4 Volume Forecast, 2025-2035
- 12.3.5 Base-Year Market Share, 2025
- 12.3.6 Segment CAGR and Growth Drivers
- 12.3.7 Subsegment Market Size and Forecast
- 12.3.7.1 Cold Aisle Containment
- 12.3.7.2 Hot Aisle Containment
- 12.3.7.3 In-Row Cooling Containment
- 12.3.7.4 Rack-Based Chimney Containment
- 12.3.8 Subsegment Pricing and Adoption Trends
- 12.3.9 Leading Suppliers and Competition
- 12.3.10 Regional Demand and Opportunities
- 12.4 By Data Center Type - Market Size and Forecast, 2025-2035
- 12.4.1 Segment Definition and Scope
- 12.4.2 Historical Market Size, 2018-2025
- 12.4.3 Revenue Forecast, 2025-2035
- 12.4.4 Volume Forecast, 2025-2035
- 12.4.5 Base-Year Market Share, 2025
- 12.4.6 Segment CAGR and Growth Drivers
- 12.4.7 Subsegment Market Size and Forecast
- 12.4.7.1 Colocation Data Center
- 12.4.7.2 Hyperscale Data Center
- 12.4.7.3 Enterprise Data Center
- 12.4.7.4 Cloud Data Center
- 12.4.7.5 Others
- 12.4.8 Subsegment Pricing and Adoption Trends
- 12.4.9 Leading Suppliers and Competition
- 12.4.10 Regional Demand and Opportunities
- 12.5 By Arrangement - Market Size and Forecast, 2025-2035
- 12.5.1 Segment Definition and Scope
- 12.5.2 Historical Market Size, 2018-2025
- 12.5.3 Revenue Forecast, 2025-2035
- 12.5.4 Volume Forecast, 2025-2035
- 12.5.5 Base-Year Market Share, 2025
- 12.5.6 Segment CAGR and Growth Drivers
- 12.5.7 Subsegment Market Size and Forecast
- 12.5.7.1 Modular Containment
- 12.5.7.2 Rigid Containment
- 12.5.7.3 Hybrid Containment
- 12.5.7.4 Others
- 12.5.8 Subsegment Pricing and Adoption Trends
- 12.5.9 Leading Suppliers and Competition
- 12.5.10 Regional Demand and Opportunities
- 12.6 Segment Growth Comparison
- 12.7 Segment Attractiveness and Priority Matrix
Chapter 13 Japan Data Center Containment Geographic Market Outlook, 2025-2035
- 13.1 Domestic Market Distribution and Demand Clusters
- 13.2 State- or Province-Wise Market Size and Forecast, 2025-2035
- 13.3 City and Metropolitan Market Outlook
- 13.4 Industrial, Manufacturing and Commercial Clusters
- 13.5 Geographic Concentration of Key End Users
- 13.6 Local Pricing and Purchasing Differences
- 13.7 Domestic Production Facilities and Capacity Map
- 13.8 Local Infrastructure and Project Pipeline
- 13.9 State-Level Policy and Incentive Differences
- 13.10 Subnational Investment Hotspots and Opportunities
- 13.11 Distribution and Logistics Networks
- 13.12 Domestic Competitive Footprint
Chapter 14 Japan Data Center Containment Technology, Innovation and Sustainability Outlook
- 14.1 Technology Landscape and Maturity
- 14.2 Product, Process and Service Innovation
- 14.3 AI, Automation and Digital Tools in the Industry
- 14.4 Technology Adoption and Performance Benchmarking
- 14.5 Innovation Pipeline and R&D Investment
- 14.6 Patent and Intellectual Property Trends
- 14.7 Energy Efficiency and Resource Management
- 14.8 Sustainability, Recycling and Circularity
- 14.9 Technology Roadmap, 2025-2035
- 14.10 Risks of Obsolescence and Technology Substitution
Chapter 15 Japan Data Center Containment Market Key Strategic Imperatives
- 15.1 Growth and Market Entry Priorities
- 15.2 High-Return Products and Segments
- 15.3 Pricing, Profitability and Cost Optimization
- 15.4 Technology Investment and Product Differentiation
- 15.5 Supply Chain Localization and Resilience
- 15.6 Distribution and Customer Acquisition
- 15.7 Partnership, Acquisition and Capacity Strategy
- 15.8 Regional Expansion Priorities
- 15.9 Short-, Medium- and Long-Term Actions
Chapter 16 Competition Outlook
- 16.1 Industry Competition Characteristics
- 16.2 Market Structure and Concentration
- 16.3 Market Share and Competitive Positioning, 2025
- 16.4 Company-Wise Revenue and Product Benchmarking
- 16.5 Production and Service Capacity Benchmarking
- 16.6 Technology, Pricing and Differentiation
- 16.7 Regional Footprint and Distribution Strength
- 16.8 Mergers, Acquisitions and Strategic Alliances
- 16.9 New Entrants and Competitive Threats
- 16.10 Porter's Five Forces and Industry Attractiveness
- 16.11 Competitive Outlook, 2025-2035
Chapter 17 Company Profiles
- 17.1 Company Coverage and Selection Criteria
- 17.2 Schneider Electric
- 17.2.1 Business Description
- 17.2.2 Company Ownership and Geographic Presence
- 17.2.3 Product and Service Portfolio
- 17.2.4 Manufacturing and Operating Footprint
- 17.2.5 Production Capacity and Expansion Plans
- 17.2.6 Financial Performance and Investment
- 17.2.7 Market Share and Competitive Position
- 17.2.8 Technology and Innovation Capabilities
- 17.2.9 Strategic Alliances or Partnerships
- 17.2.10 Recent Developments
- 17.2.11 Growth Strategy and Outlook
- 17.3 Vertiv
- 17.4 Rittal
- 17.5 Panduit
- 17.6 nVent
- 17.7 Upsite Technologies
- 17.8 Nikkabi
- 17.9 Other Relevant Market Participants
Note: Every listed company is profiled on the structure shown under the first company. The company list is preliminary and may change based on research findings, market developments, data availability and client requirements.
Chapter 18 Disclaimer
- 18.1 Research and Forecast Disclaimer
- 18.2 Data Source and Estimation Limitations
Note: The depth of individual sections depends on data availability for this market. Volume, capacity, trade and other unit-based metrics are included where applicable.

