
AI clusters, local clouds and fleet renewal lift spending
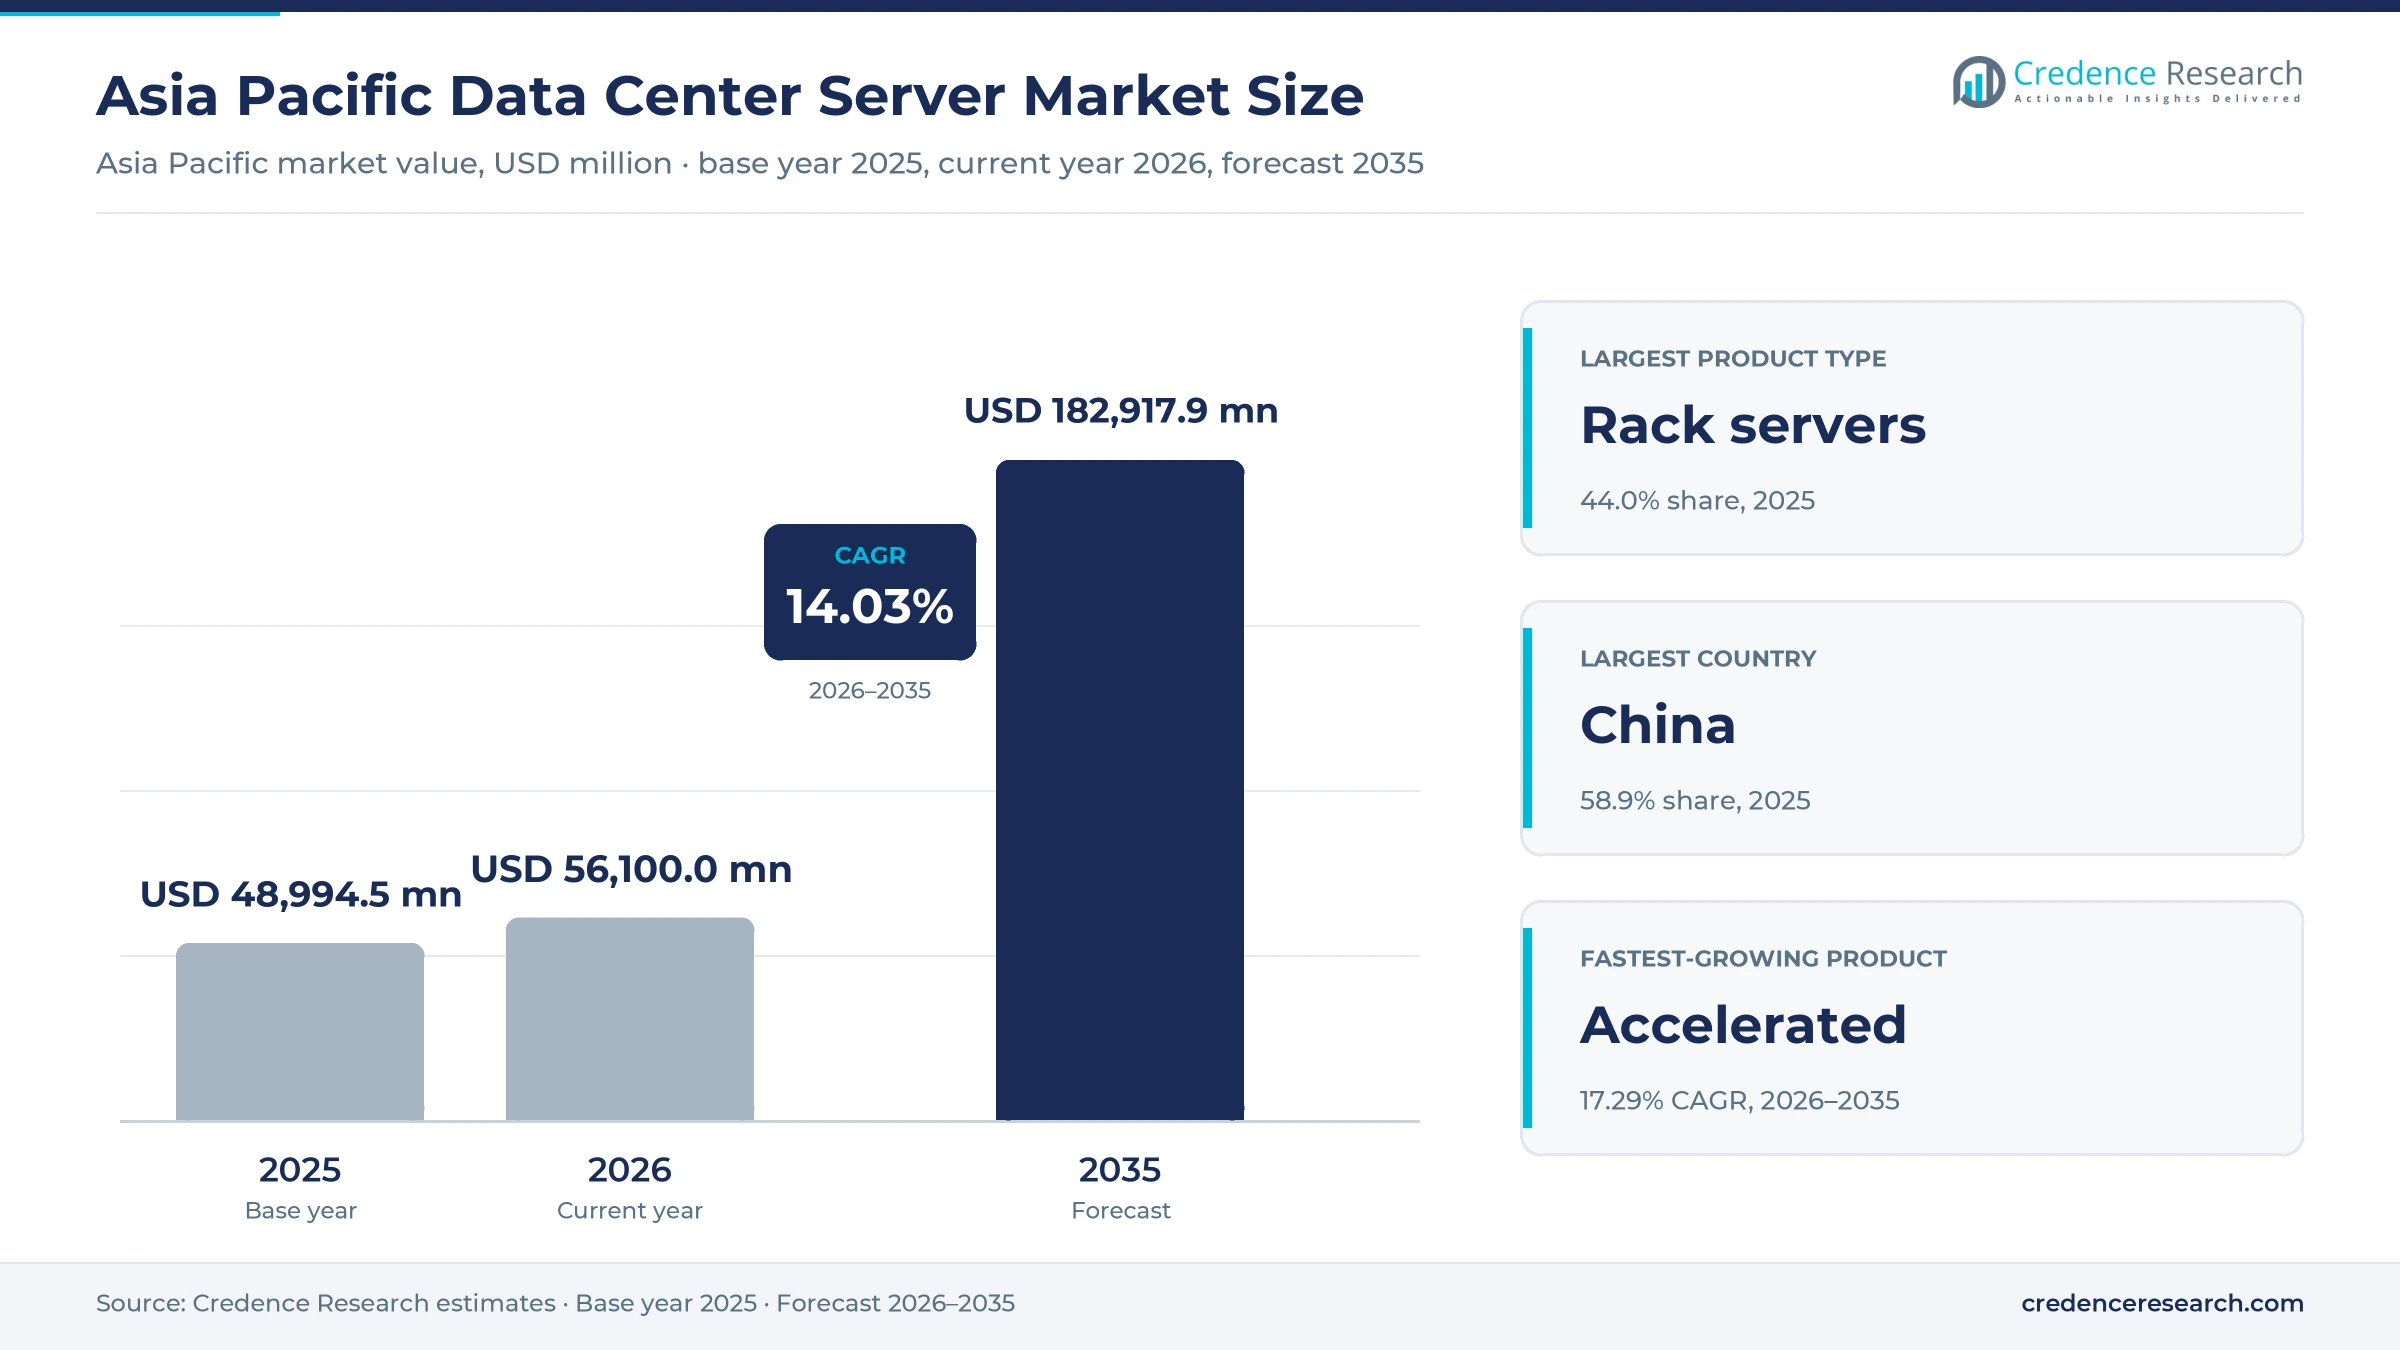
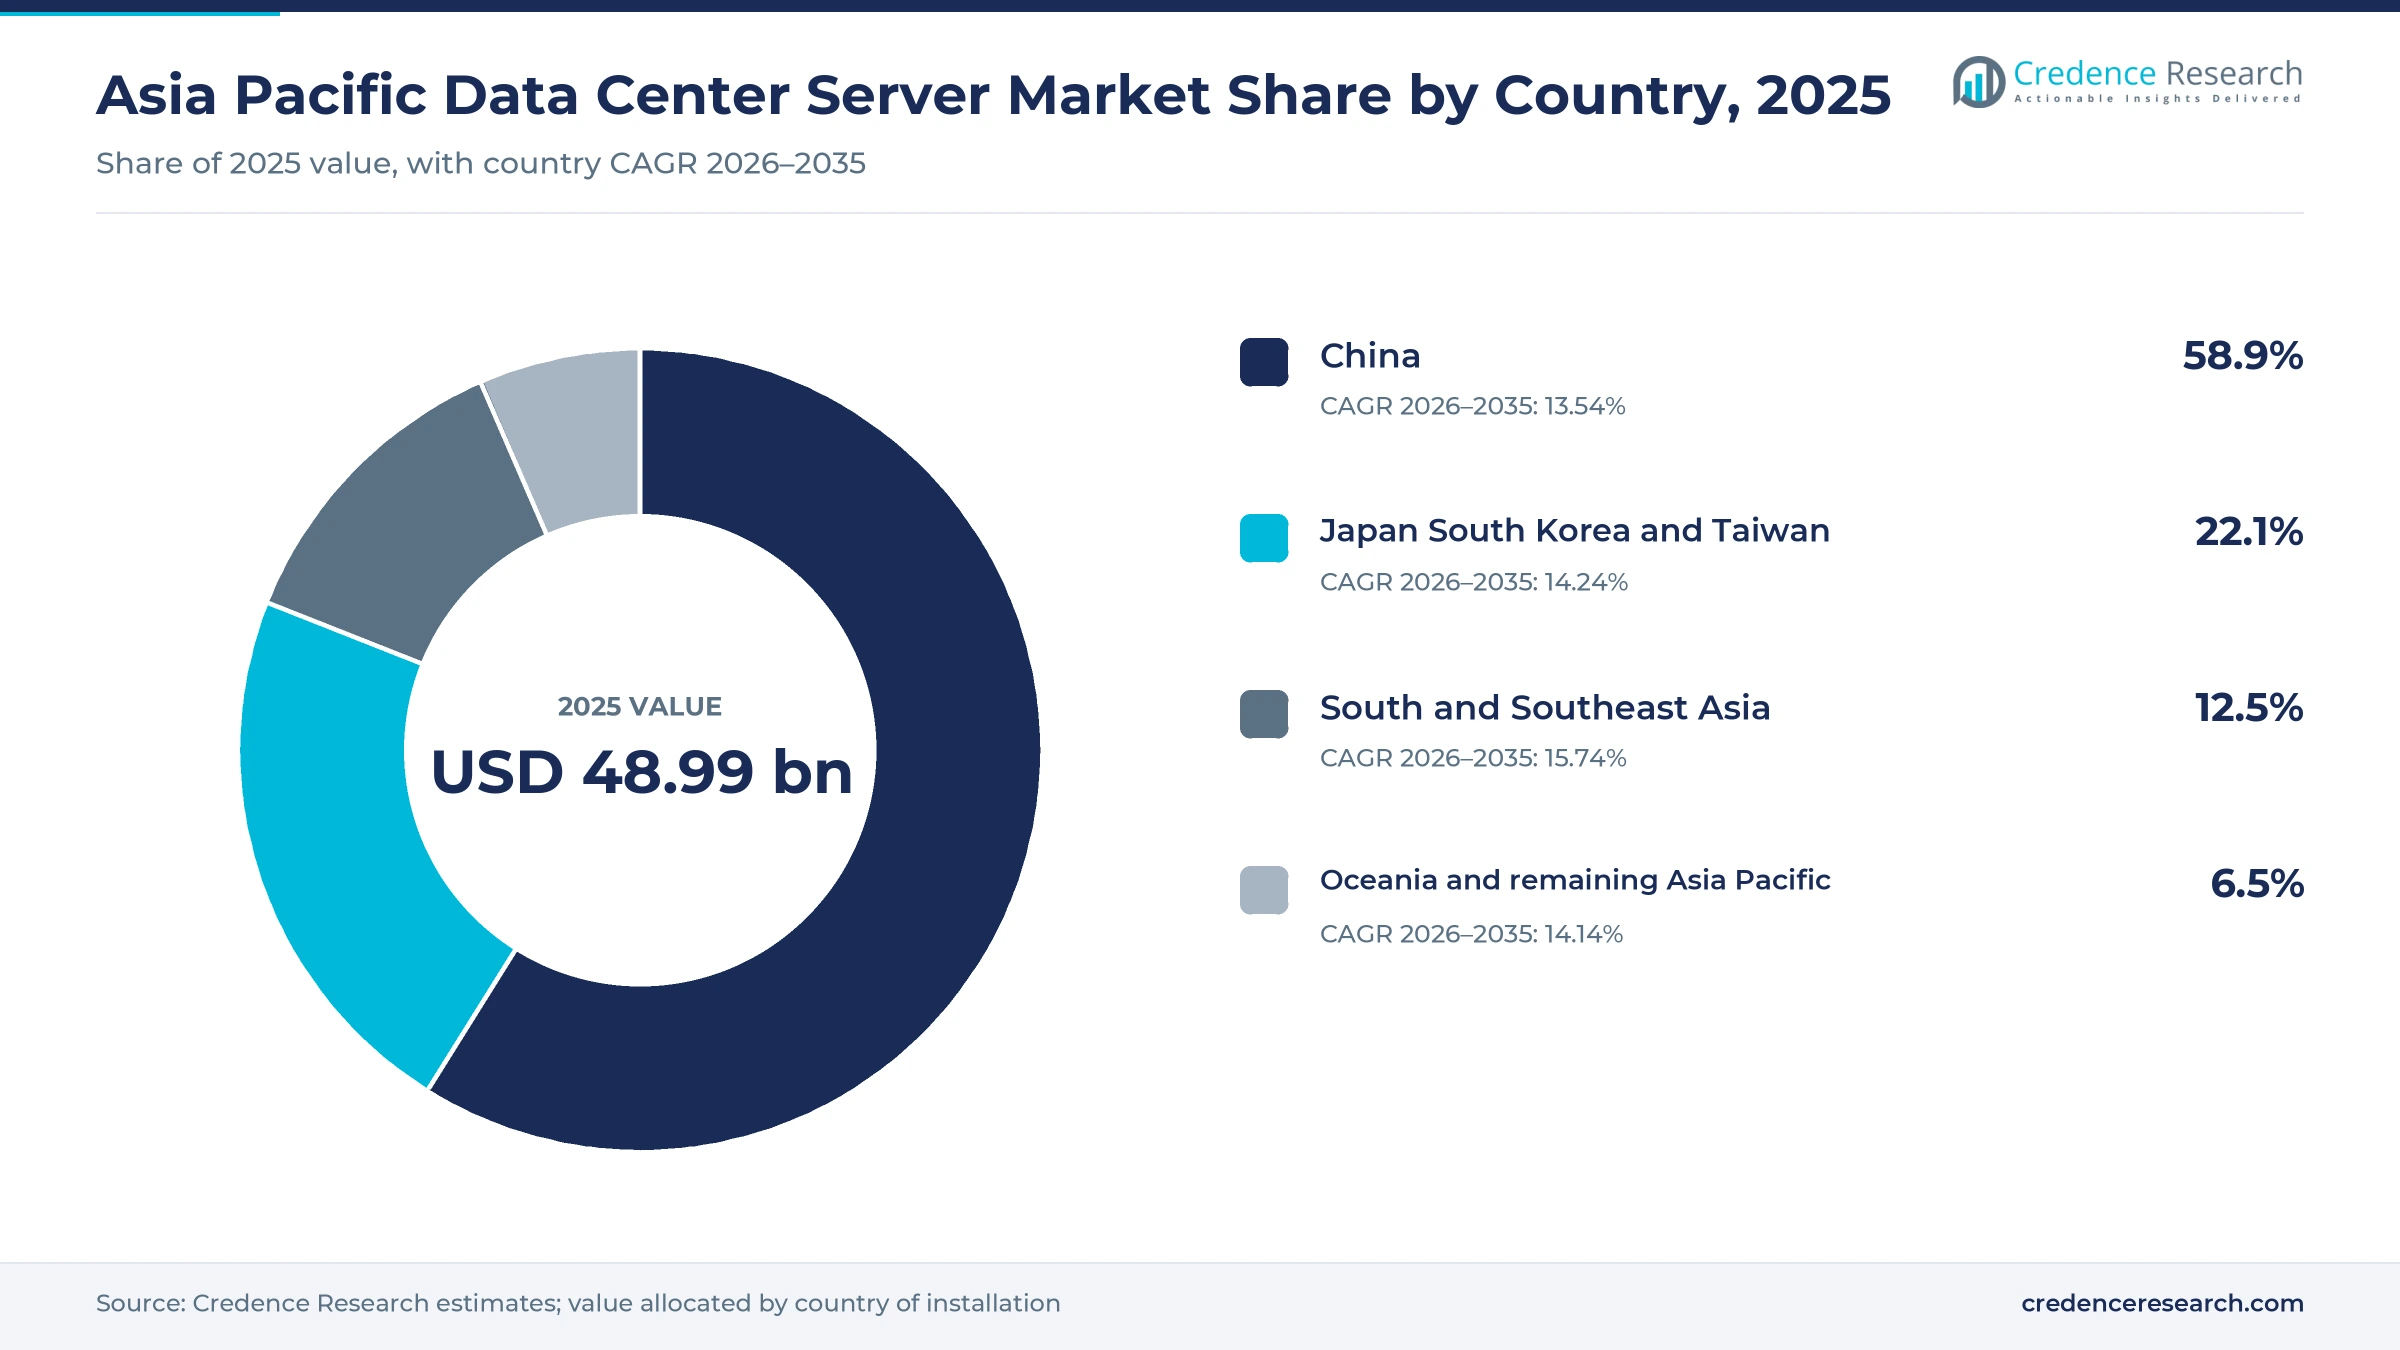
The Asia Pacific data center server market was valued at USD 48.99 billion in 2025 and is projected to increase from USD 56.10 billion in 2026 to USD 182.92 billion by 2035, registering a CAGR of 14.03% during 2026–2035. Demand comes from rack, accelerated, blade and tower servers that cloud operators, enterprises, telecom operators and public research bodies install in data centers across the region. China held the largest regional share, 58.9% in 2025, because its cloud providers and state computing programs run the largest installed base in Asia Pacific. South and Southeast Asia is the fastest-growing area at 15.74% a year, as India and Southeast Asian countries add cloud regions and national GPU capacity. In turn, buyers are shifting spending toward accelerated systems with GPUs and liquid cooling, while governments in South Korea, India and Japan fund sovereign AI computing.
Which server products and buyers does the estimate cover?
The estimate measures the value of general-purpose rack servers, accelerated servers, non-accelerated blade and modular servers and non-accelerated tower servers installed in data centers in Asia Pacific. It covers systems sold by branded makers, original design manufacturers and distributors to cloud operators, enterprises, telecom operators and public institutions.
The estimate excludes storage arrays, network switches, software licenses and services. The value chain runs from processor, accelerator and memory suppliers through server makers and contract manufacturers to integrators, cloud operators and enterprise data center owners across China, Japan, South Korea, Taiwan, India, Southeast Asia and Oceania.
Asia Pacific Data Center Server Market Insights
- The Asia Pacific data center server market was valued at USD 48.99 billion in 2025 and is projected to reach USD 182.92 billion by 2035, registering a CAGR of 14.03% during 2026–2035.
- China held a 58.9% share of 2025 value, because its cloud providers and state computing programs run the largest installed base.
- General-purpose rack servers led with a 44.0% share of 2025 value, because cloud and enterprise workloads still run mostly on them.
- South Korea arranged in late 2025 to receive more than 260,000 Nvidia GPUs, including 50,000 for sovereign AI models.
- Accelerated servers grow fastest by product type at 17.29% a year during 2026–2035, as AI training and inference clusters expand.
Rack servers lead while accelerated systems rise fastest
Why do rack servers still lead product demand?
Based on product type, the market is categorized into general-purpose rack servers, accelerated servers, non-accelerated blade and modular servers, and non-accelerated tower servers. General-purpose rack servers led with a 44.0% share of 2025 value, because cloud and enterprise workloads still run mostly on standard racks. Accelerated servers grow fastest at 17.29% a year, as GPU clusters for AI training and inference expand.
How do cloud and AI workloads split demand?
Based on application, the market is categorized into cloud service delivery, enterprise business workloads, AI and high-performance computing, and telecommunications network workloads. Cloud service delivery led with a 46.0% share of 2025 value, because public cloud regions host most new compute. AI and high-performance computing grows fastest at 16.87% a year, as national GPU programs and AI model builders add capacity.
Why do hyperscalers dominate purchases?
Based on customer type, the market is categorized into hyperscaler and cloud operators, private enterprises, telecommunications operators and government and research institutions. Hyperscaler and cloud operators led with a 52.0% share of 2025 value, because they buy servers by the thousand for each new region. Hyperscaler and cloud operators grow fastest at 14.92% a year, as cloud providers expand AI capacity.
How fast are ARM host processors gaining?
Based on technology, the market is categorized into x86 host architecture, ARM host architecture and non-x86 non-ARM host architecture. x86 host architecture led with 81.0% of 2025 value, because most enterprise software and cloud instances run on Intel and AMD processors. ARM host architecture grows fastest at 17.09% a year, as cloud operators and Chinese vendors adopt custom ARM chips.
| Segment Group | Leading Sub-segment | Share, 2025 | Fastest-growing Sub-segment | CAGR, 2026–2035 |
|---|---|---|---|---|
| By Product Type | General-purpose rack servers | 44.0% | Accelerated servers | 17.29% |
| By Application | Cloud service delivery | 46.0% | AI and high-performance computing | 16.87% |
| By Customer Type | Hyperscaler and cloud operators | 52.0% | Hyperscaler and cloud operators | 14.92% |
| By Technology | x86 host architecture | 81.0% | ARM host architecture | 17.09% |
Request a Free Sample
Fill in your details and we'll send you a free sample report.
- Sample data tables & charts
- Research methodology
GPU buying, cloud build-outs and refresh cycles drive demand
How does accelerated computing procurement lift spending?
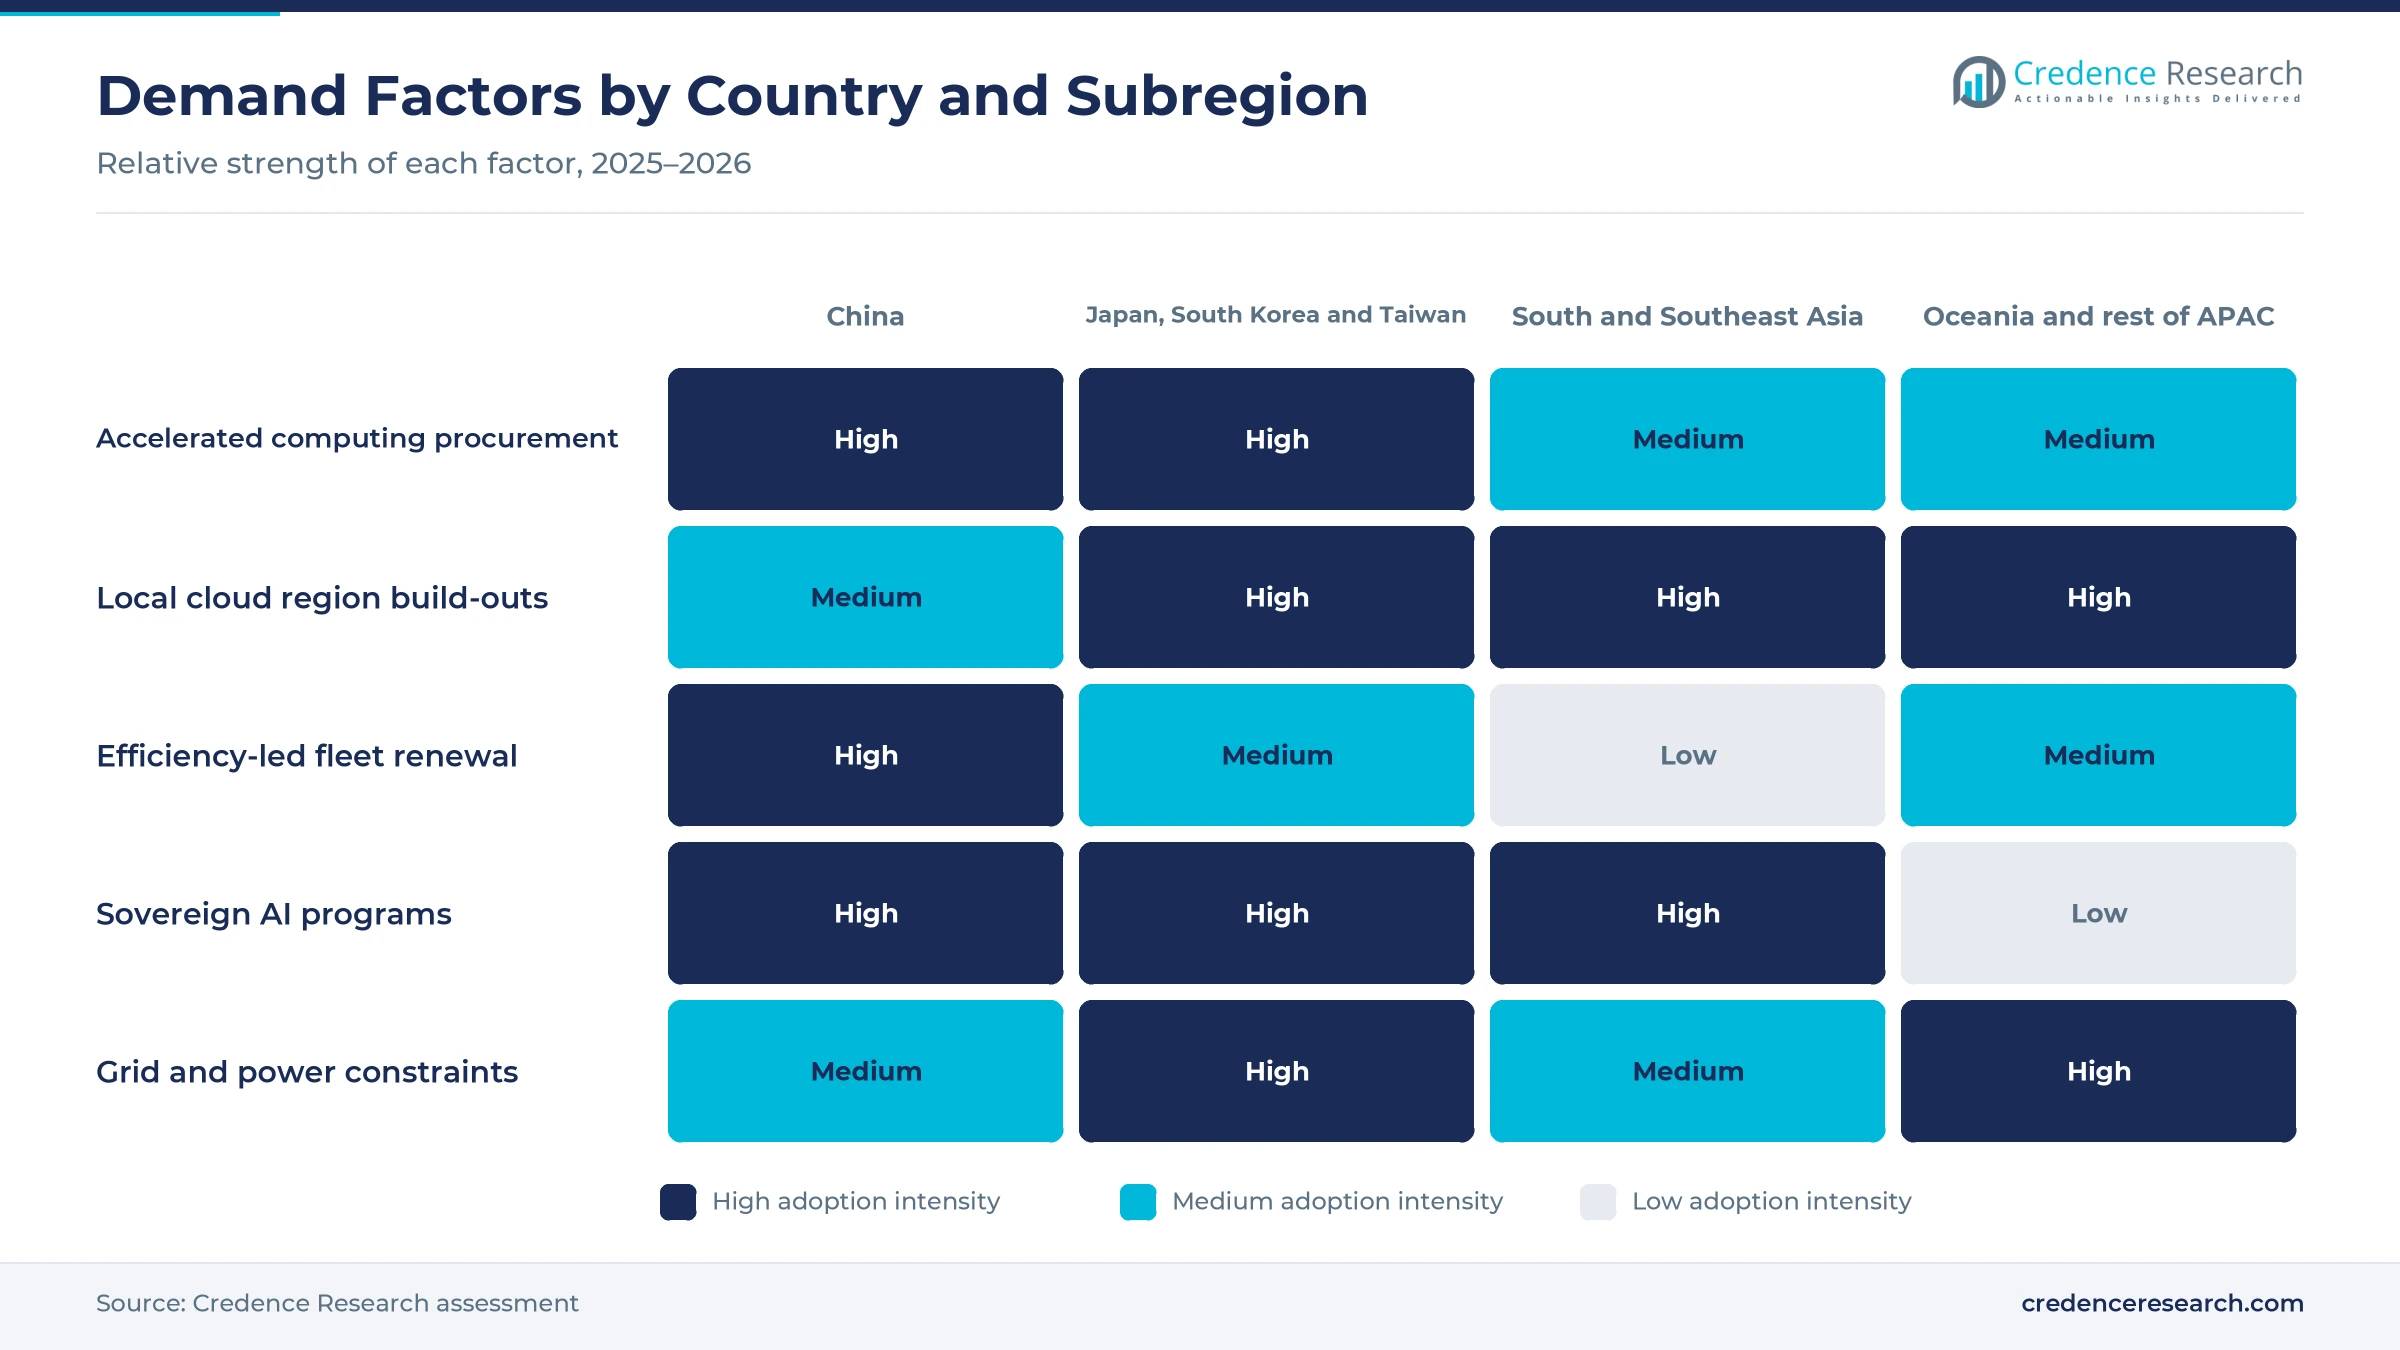
Accelerated computing procurement lifts spending, because each GPU server costs far more than a standard rack system and governments are buying them at national scale. South Korea arranged at the APEC summit in late 2025 to receive more than 260,000 Nvidia GPUs, including 50,000 for sovereign AI models, according to Data Center Knowledge. India's IT minister said on Feb. 18, 2026, that the national AI program had more than 38,000 GPUs and would add 20,000 within a week. KDDI also signed with Hewlett Packard Enterprise in June 2025 for GB200 NVL72 racks in Sakai. As a result, accelerated servers grow at 17.29% a year.
Why does localized cloud infrastructure expansion add demand?
Localized cloud infrastructure expansion adds demand, because data residency rules and latency needs push cloud providers to build regions inside each country. Amazon announced on June 14, 2025, that it would invest AU$20 billion in Australian data centers from 2025 to 2029, according to Amazon. Microsoft announced in April 2024 a USD 2.9 billion investment over two years in cloud and AI infrastructure in Japan, including the latest GPUs. Lenovo announced in September 2024 that it would build 50,000 AI rack servers a year in Puducherry, India. In turn, hyperscaler and cloud operators hold 52.0% of 2025 value, as they fill new hyperscale campuses.
How does efficiency-led fleet renewal drive replacements?
Efficiency-led fleet renewal drives replacements, because older servers use more power for each unit of work and data center operators face strict energy targets. China's planning agency and industry ministry issued a plan in July 2024 that sets an average PUE below 1.5 by the end of 2025, according to the Chinese government. The same plan expects data center power use to grow 15% a year and puts racks in use above 8.1 million at the end of 2023. H3C launched a cold-plate liquid-cooled R4900 G7 server in November 2025 that targets a PUE below 1.1. As a result, buyers replace older fleets with denser and more efficient systems.
Why does Taiwanese supply capacity support regional output?
Taiwanese supply capacity supports regional output, because contract makers in Taiwan assemble a large share of the world's cloud and AI servers. Taiwan's information and communication product exports rose 171% in November 2025 to USD 28.36 billion, driven by servers and graphics cards, according to the Taipei Times. Exports to the United States rose to a record USD 24.42 billion that month, or 38.1% of Taiwan's total. Lenovo also plans to export 60% of its Indian server output across Asia Pacific. In turn, Japan South Korea and Taiwan hold 22.1% of 2025 value, as their makers and cloud buyers scale AI capacity.
Liquid cooling, ARM hosts and local assembly gain ground
How is the shift to liquid cooling changing server design?
The shift to liquid cooling is changing server design, because GPU racks now produce more heat than air can remove efficiently. H3C's R4900 G7 server, launched in November 2025, cools nearly 100% of heat sources with cold plates, supports processors of up to 650W and targets a data center PUE below 1.1. KDDI's Sakai AI data center uses hybrid air and direct liquid cooling for its HPE racks. Dell supplies liquid-cooled PowerEdge XE9685L servers with Nvidia Blackwell GPUs to NxtGen for an AI factory in India, announced in January 2026. As a result, buyers pair new servers with liquid cooling systems, which raises the value of each rack.
Why is the rise of ARM host processors notable?
The rise of ARM host processors is notable, because cloud operators want lower power per core and Chinese vendors want supply that does not depend on imported x86 chips. Alibaba Cloud said in 2022 that it planned to run one in five of its servers on its own Arm chips by 2025. Its Yitian 710 processor packs 128 Armv9 cores built on a 5nm process, with eight DDR5 memory channels and 96 PCIe 5.0 lanes. In turn, ARM host architecture grows at 17.09% a year, the fastest technology rate. However, x86 host architecture still holds 81.0% of 2025 value, because most enterprise software is written for it and migration takes years of testing and porting work.
Can sovereign AI programs open new public demand?
Sovereign AI programs open new public demand, because governments want national computing capacity for local language models and research. South Korea plans to deploy 50,000 of its new Nvidia GPUs at a National AI Computing Center and at Naver Cloud, NHN Cloud and Kakao facilities. India's national AI program passed 38,000 GPUs by early 2026 and planned to add 20,000 more. China's total computing power reached 280 EFLOPS at the end of 2024, with intelligent computing making up 32% of the total. As a result, government and research institutions grow at 14.92% a year, the fastest customer rate.
Will local server assembly open new supply hubs?
Local server assembly opens new supply hubs, because governments and buyers want shorter supply chains and local jobs. Lenovo announced in September 2024 plans to build 50,000 AI rack servers and 2,400 high-end GPU systems a year in Puducherry, India, along with a server research lab in Bengaluru. About 60% of that output is planned for export across Asia Pacific. Dell is supplying an AI factory for NxtGen in India with liquid-cooled GPU servers. In turn, South and Southeast Asia holds 12.5% of 2025 value, and makers that assemble locally can win public and enterprise contracts faster.
Power limits, chip controls and memory costs test buyers
How do power limits slow new server deployments?
Power limits slow new server deployments, because GPU racks need far more electricity than grids in many cities can supply quickly. In many large metro areas, operators must wait for new grid connections before they can install more racks. As a result, server orders can slip by quarters even when budgets are approved. Operators respond with liquid cooling, on-site power and new campuses in regions with spare grid capacity.
Why do export controls complicate accelerator supply?
Export controls complicate accelerator supply, because the most advanced GPUs need licenses for some buyers in China. Chinese cloud providers and server makers therefore shift to domestic accelerators and older chips, which changes how many servers they need for the same work. In turn, vendors must certify and support more server platforms for each buyer. Many respond with dual supply plans, local processor supply and software that runs across several chip types.
How do memory and component costs squeeze budgets?
Memory and component costs squeeze budgets, because high-bandwidth memory, DDR5 modules and fast SSDs make up a large part of an AI server bill of materials. When AI buyers absorb supply, prices rise for every other server customer. As a result, enterprises delay refreshes or buy smaller configurations. Vendors respond with longer supply agreements, flexible configurations and financing that spreads costs over several years.
Why do skills gaps delay AI cluster operation?
Skills gaps delay AI cluster operation, because GPU clusters need specialists in networking, cooling and scheduling software. Many enterprises and public bodies in the region lack these teams, so new systems sit idle or run below capacity. In turn, buyers turn to cloud providers and colocation operators to run their AI workloads. Vendors respond with managed services, reference designs and training programs.
China leads while South and Southeast Asia grows fastest
| Country | Value, 2025 (USD billion) | Share, 2025 | CAGR, 2026–2035 |
|---|---|---|---|
| China | 28.86 | 58.9% | 13.54% |
| Japan South Korea and Taiwan | 10.83 | 22.1% | 14.24% |
| South and Southeast Asia | 6.12 | 12.5% | 15.74% |
| Oceania and remaining Asia Pacific | 3.18 | 6.5% | 14.14% |
Why does China keep the top share?
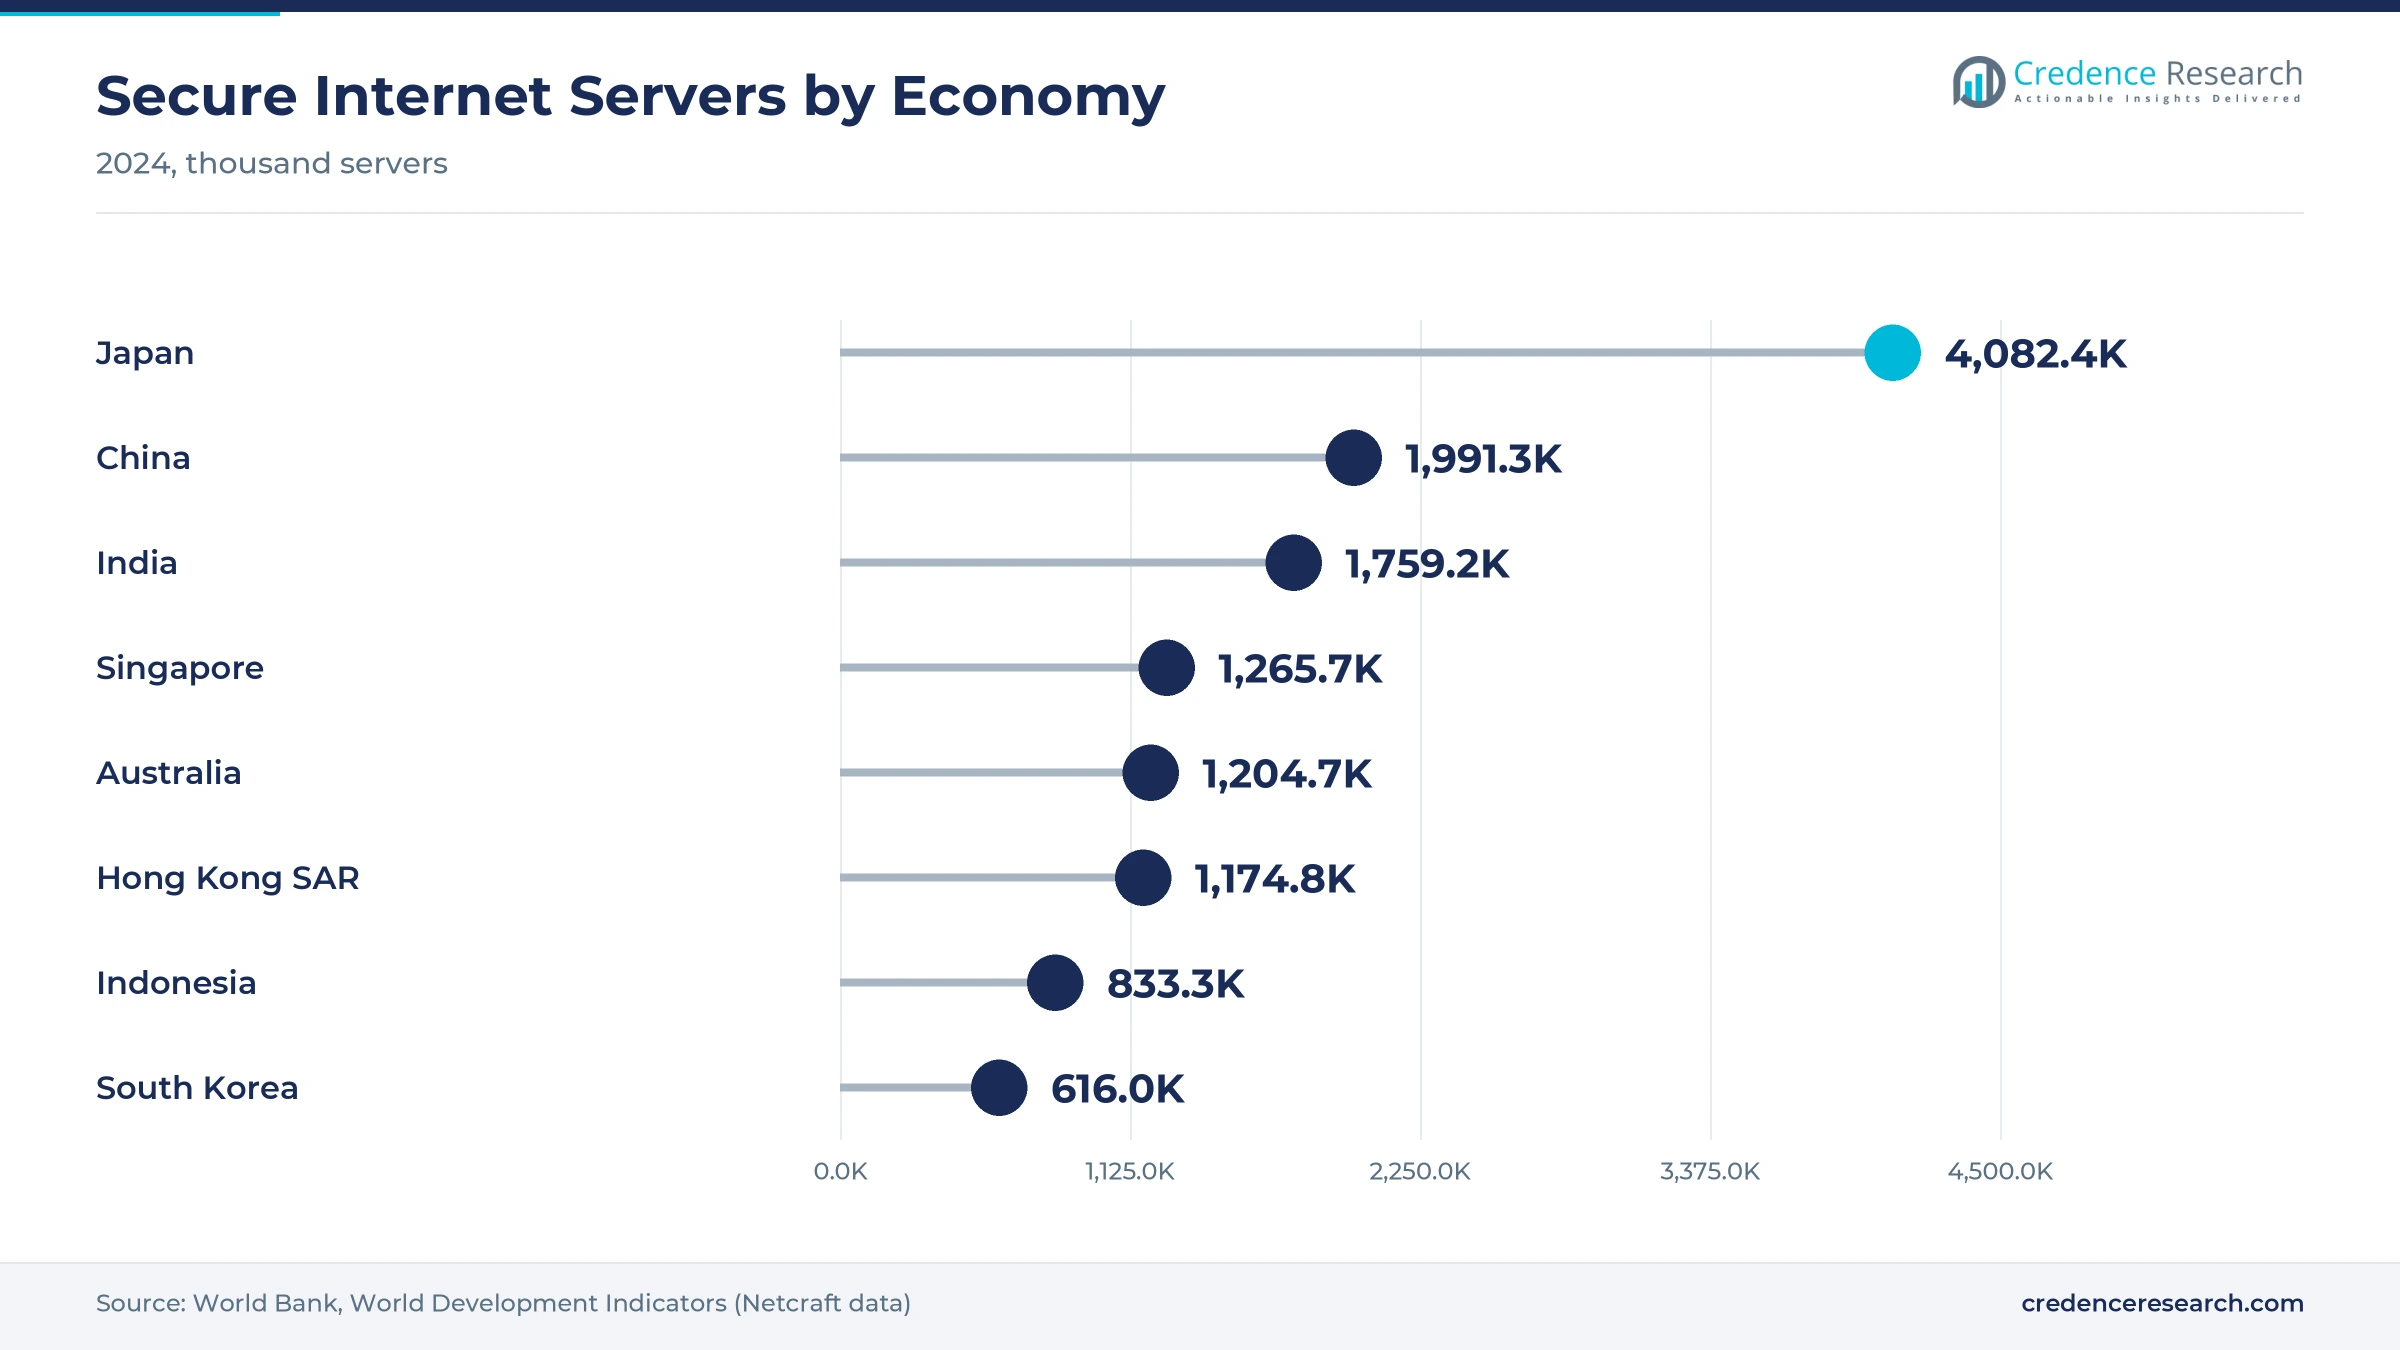
China held a 58.9% share of 2025 value and grows at 13.54% a year, because its cloud providers and state computing programs run the largest installed base in the region. China's total computing power reached 280 EFLOPS at the end of 2024, and China counted 1.99 million secure internet servers in 2024, according to World Bank data. However, growth is slower than in South Asia, because export controls limit access to the most advanced accelerators and PUE targets push operators to consolidate older sites.
How do Japan, South Korea and Taiwan add AI capacity?
Japan South Korea and Taiwan held a 22.1% share of 2025 value and grows at 14.24% a year, because cloud providers, telecom operators and governments are building AI clusters. South Korea arranged for more than 260,000 Nvidia GPUs in late 2025, while Microsoft is investing USD 2.9 billion in Japanese cloud and AI infrastructure. KDDI planned to bring its HPE GB200 racks in Sakai into service by March 2026.
Why is South and Southeast Asia the fastest-growing area?
South and Southeast Asia held a 12.5% share of 2025 value and grows fastest at 15.74% a year, because India and Southeast Asian countries are adding cloud regions and national GPU capacity from a low base. India's national AI program passed 38,000 GPUs by early 2026, and Lenovo plans to build 50,000 AI rack servers a year in Puducherry. Dell is also supplying liquid-cooled GPU servers for an Indian AI factory.
What role do Oceania and the rest of the region play?
Oceania and remaining Asia Pacific held a 6.5% share of 2025 value, because Australia hosts large cloud regions. Amazon plans to invest AU$20 billion in Australian data centers from 2025 to 2029, along with three new solar farms.
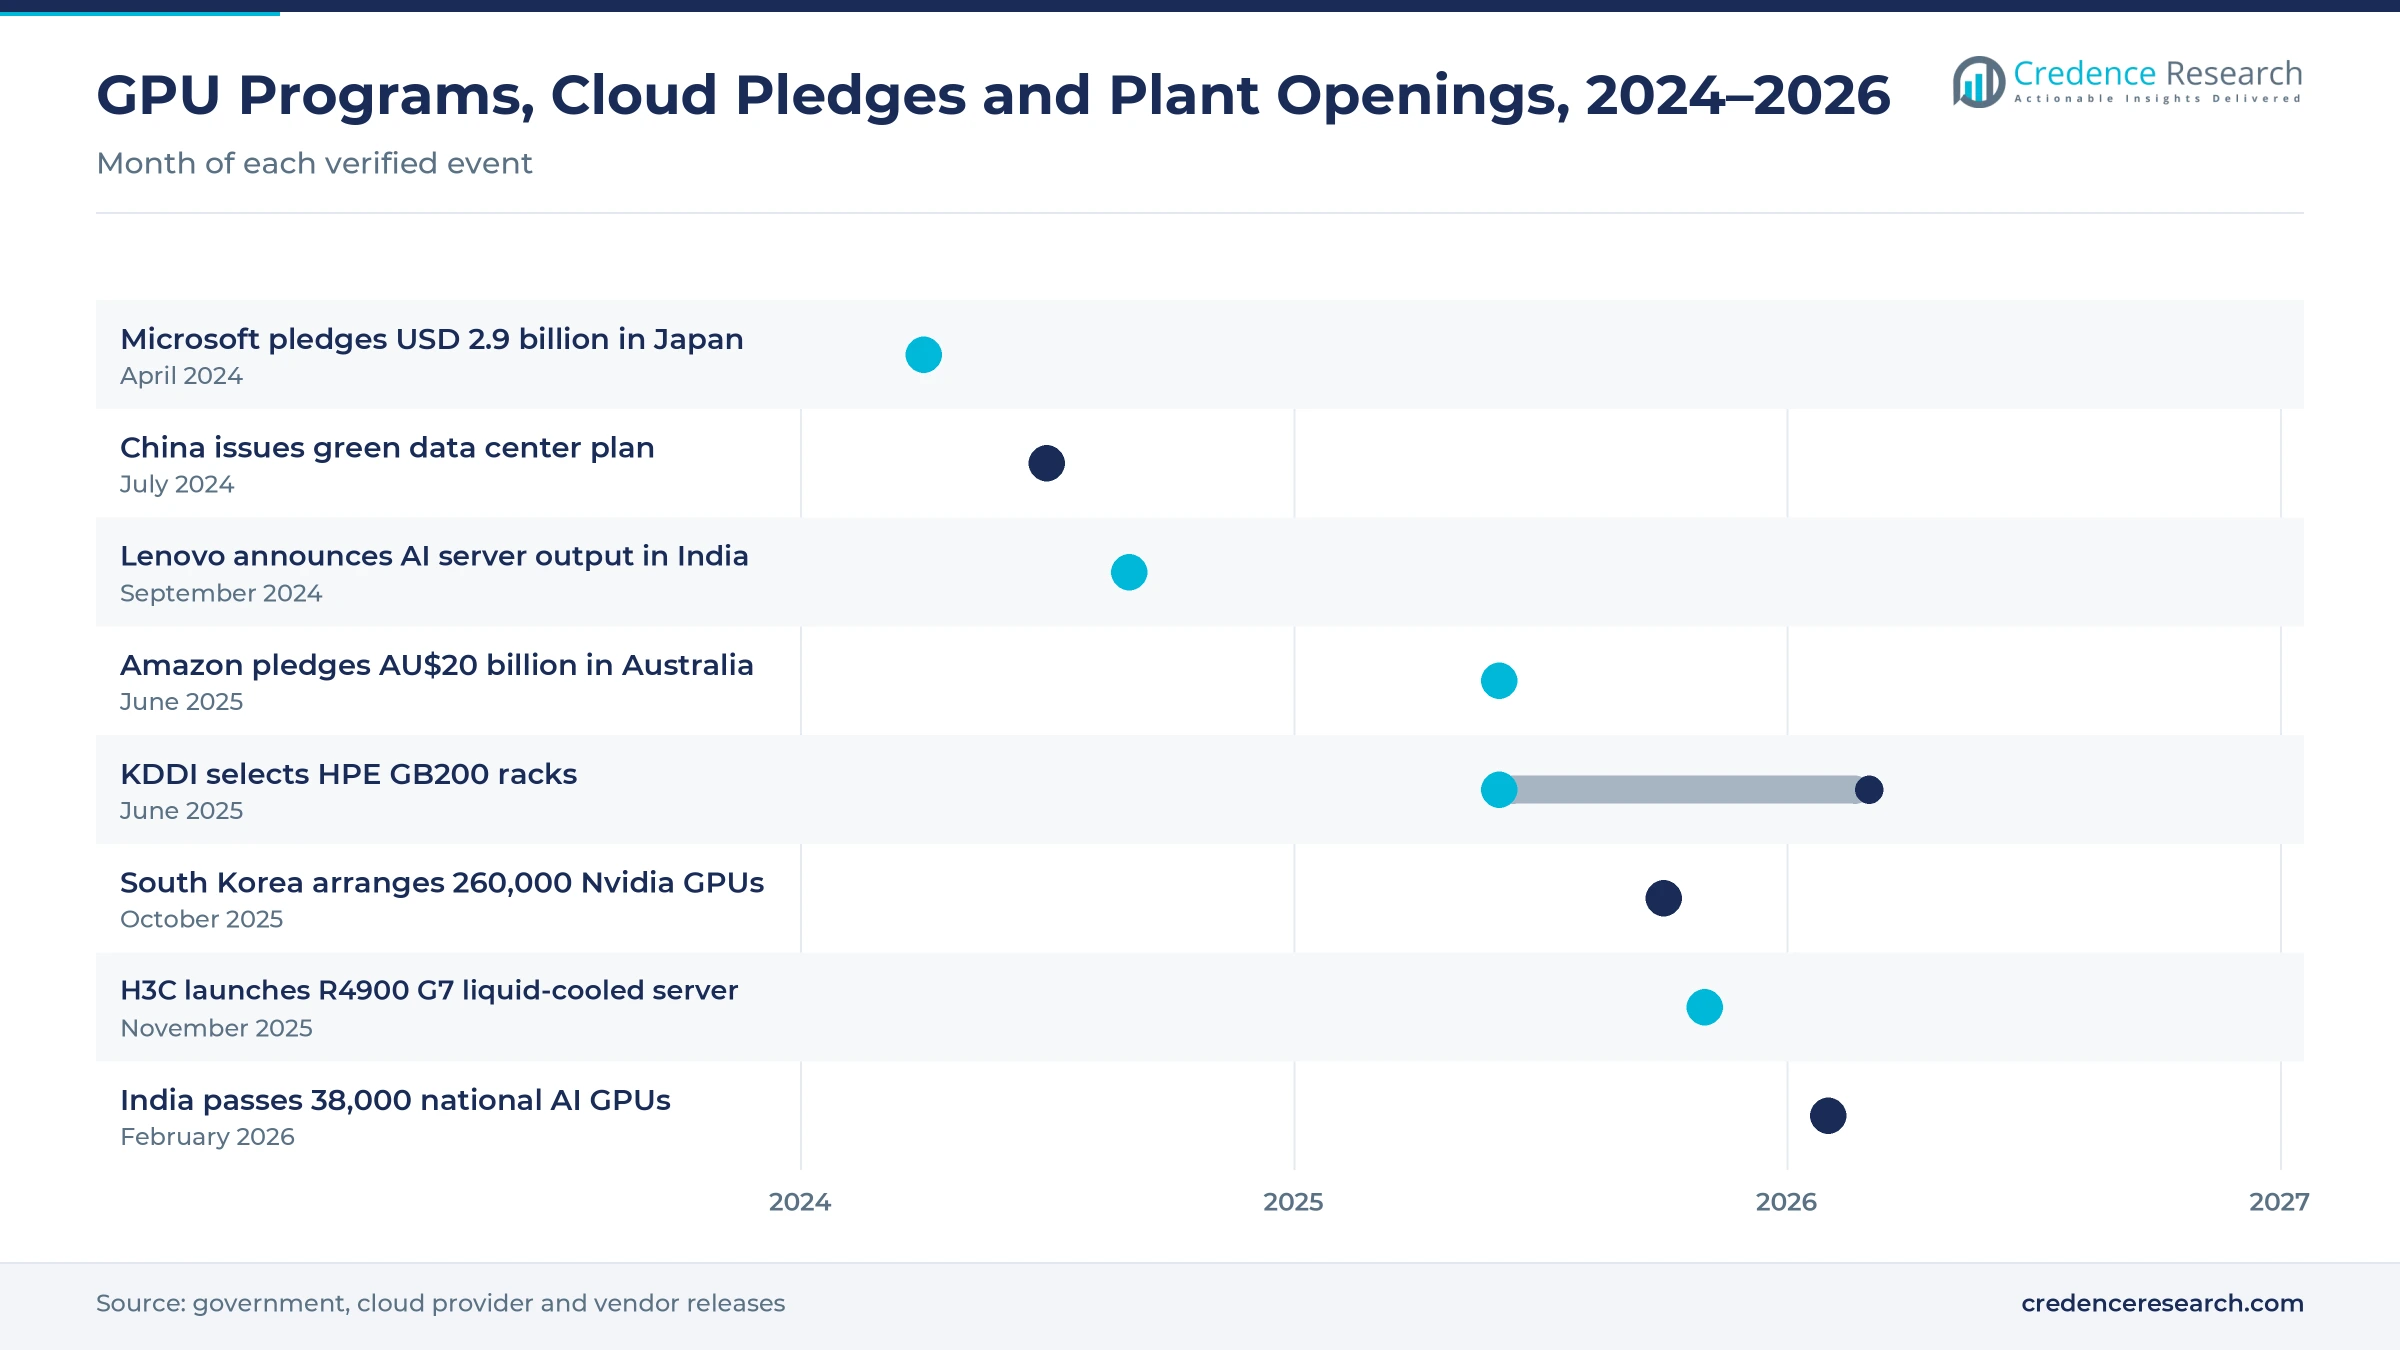
GPU programs, cloud pledges and plant openings, 2024–2026
| Development | Status and market relevance |
|---|---|
| In April 2024, Microsoft announced a USD 2.9 billion investment in cloud and AI infrastructure in Japan. | Adds GPU capacity over two years |
| In September 2024, Lenovo announced AI rack server production in Puducherry, India. | 50,000 rack servers and 2,400 GPU systems a year |
| In June 2025, Amazon announced AU$20 billion of data center investment in Australia for 2025 to 2029. | Expands cloud regions with three new solar farms |
| In June 2025, KDDI selected Hewlett Packard Enterprise GB200 NVL72 racks for its Sakai AI data center. | Service planned by March 2026 |
| In November 2025, H3C launched the cold-plate liquid-cooled R4900 G7 server. | Targets a data center PUE below 1.1 |
Accelerators, cold plates and new host chips reshape racks
- GPU-accelerated rack systems pack eight or more accelerators per server or 72 GPUs per rack, which suits the AI clusters that KDDI, Korean cloud providers and Indian AI programs are building.
- Cold-plate liquid cooling moves heat from processors, memory and drives into water loops, which lets operators such as those using H3C R4900 G7 servers target a PUE below 1.1.
- ARM host processors offer lower power per core for cloud instances and give Chinese vendors an alternative to imported x86 chips.
- Open rack and ODM designs let hyperscalers buy standard boards and racks from Taiwanese contract makers at scale, which lowers cost for each new cloud region.
Need a Custom Version of This Report?
Tailor the scope, geography, or segments to your exact requirements.
- Custom geography or segment scope
- Direct access to our analyst team
Chinese brands, global OEMs and Taiwanese ODMs compete
Competition is split between Chinese brands that lead in their home market, global OEMs that serve multinational enterprises and public buyers, and Taiwanese ODMs that build servers directly for hyperscalers. Lenovo is adding AI rack server production in Puducherry, India and runs a server research lab in Bengaluru alongside labs in Beijing and Taipei. H3C launched the liquid-cooled R4900 G7 in China in November 2025. Hewlett Packard Enterprise supplies GB200 NVL72 racks to KDDI in Japan, while Dell Technologies supplies liquid-cooled PowerEdge servers to NxtGen in India. Rivals compete on accelerator access, cooling design, delivery time and local support. Because buyers sign multiyear frame agreements, vendors with local assembly and proven AI reference designs win the largest new programs.
Companies profiled and their roles in this market
| Company | Type | Role in the market |
|---|---|---|
| Lenovo | Global server OEM | AI rack server production in Puducherry; server R&D lab in Bengaluru |
| H3C | Chinese server and network maker | Cold-plate liquid-cooled R4900 G7 server launched in November 2025 |
| Hewlett Packard Enterprise | Global server OEM | GB200 NVL72 rack systems for KDDI in Sakai, Japan |
| Dell Technologies | Global server OEM | Liquid-cooled PowerEdge XE9685L servers for NxtGen in India |
Credence Research view on regional server demand
Credence Research's view is that Asia Pacific demand for data center servers will grow fast because cloud providers, telecom operators and governments are all adding AI capacity at the same time. China remains the largest buyer, while India and Southeast Asia add the most new capacity from a low base. Accelerated systems take a rising share of each server budget across the region. Data center server vendors that combine accelerator access, liquid cooling and local assembly should gain share fastest. Power limits, export controls and memory costs remain the main risks to this view.
How the regional server estimate was built
The report uses 2025 as the base year on a calendar basis, and market values come from the Credence Research model. That model combines cloud and AI investment announcements, national GPU programs, trade statistics, energy policy and company releases on server launches and plants. Segment splits and country growth rates are Credence Research estimates, while country shares follow the client-defined split. Sources used are public reports, official statistics, trade press and company releases, and no interviews or surveys were used for this data center server estimate.
AI clusters and sovereign clouds carry growth to 2035
Server value is expected to reach USD 182.92 billion by 2035, a 14.03% CAGR during 2026–2035, as AI clusters and sovereign clouds expand. Growth should stay strong through 2030 while Korean, Indian and Japanese GPU programs and Australian cloud regions are built. After that, inference workloads and efficiency-led renewal will carry more growth. Faster grid connections would support deployment, while export controls or memory shortages would slow it. Vendors with liquid cooling and local assembly are expected to gain the most.
Frequently Asked Questions
How big is the Asia Pacific data center server market?
Which product type leads regional demand?
Which country leads the Asia Pacific server market?
How many GPUs is South Korea adding?
How large is India's national AI computing program?
Why are operators moving to liquid cooling?
Who are the leading companies in Asia Pacific data center servers?
What are the main challenges for server buyers?
Table of Content
Chapter 1 Market Segmentation
- 1.1 Segmentation Framework
- 1.1.1 Product and Service Classification
- 1.1.2 Application and End-Use Classification
- 1.1.3 Technology and Solution Classification
- 1.1.4 Customer and Distribution Channel Classification
- 1.1.5 Geographic Segmentation
- 1.1.6 Market Segment Definitions and Boundaries
- 1.2 By Product Type
- 1.2.1 General-purpose rack servers
- 1.2.2 Accelerated servers
- 1.2.3 Non-accelerated blade and modular servers
- 1.2.4 Non-accelerated tower servers
- 1.3 By Application
- 1.3.1 Cloud service delivery
- 1.3.2 Enterprise business workloads
- 1.3.3 AI and high-performance computing
- 1.3.4 Telecommunications network workloads
- 1.4 By Customer Type
- 1.4.1 Hyperscaler and cloud operators
- 1.4.2 Private enterprises
- 1.4.3 Telecommunications operators
- 1.4.4 Government and research institutions
- 1.5 By Technology
- 1.5.1 x86 host architecture
- 1.5.2 ARM host architecture
- 1.5.3 Non-x86 non-ARM host architecture
- 1.6 By Country
- 1.6.1 China
- 1.6.2 Japan South Korea and Taiwan
- 1.6.3 South and Southeast Asia
- 1.6.4 Oceania and remaining Asia Pacific
Chapter 2 Introduction
- 2.1 Report Objectives and Scope
- 2.2 Product Definition and Industry Terminology
- 2.3 Market Inclusions and Exclusions
- 2.4 Research Process
- 2.4.1 Primary Research and Expert Interviews
- 2.4.2 Secondary Research and Source Review
- 2.4.3 Top-Down and Bottom-Up Estimation
- 2.4.4 Data Triangulation and Verification
- 2.5 Market Size Measurement Basis
- 2.5.1 2025: USD 48.99 billion → 2035: USD 182.92 billion
- 2.6 Historical and Forecast Reference Periods
- 2.6.1 Historical Period: 2018-2025
- 2.6.2 Base Year: 2025
- 2.6.3 Forecast Period: 2025-2035
- 2.7 Research Assumptions and Limitations
Chapter 3 Executive Summary
- 3.1 Market Snapshot and Key Findings
- 3.2 Base-Year Market Size, 2025
- 3.3 Forecast Market Size, 2035
- 3.4 Revenue and Volume Growth Outlook
- 3.5 Key Demand and Supply Indicators
- 3.6 Leading Market Segments
- 3.7 Fastest-Growing Market Opportunities
- 3.8 Regional Performance Highlights
- 3.9 Technology and Industry Transformation
- 3.10 Competitive Landscape Summary
- 3.11 Analyst View and Strategic Implications
Chapter 4 Asia Pacific Data Center Server Market Trends and Developments
- 4.1 Historical Industry Development, 2018-2025
- 4.2 Recent Market Trends and Developments
- 4.3 Demand and Customer Behavior Trends
- 4.4 Technology and Product Innovation
- 4.5 Artificial Intelligence, Automation and Digitalization
- 4.6 Local Manufacturing and Supply Chain Realignment
- 4.7 Industry Partnerships, Mergers and Acquisitions
- 4.8 Sustainability and Circular Economy Developments
- 4.9 Government and Private Sector Investment Trends
- 4.10 Emerging Business Models and Commercialization
- 4.11 Industry Developments and Announcements
Chapter 5 Asia Pacific Data Center Server Market Production, Supply and Demand Analysis
- 5.1 Demand Trend and Consumption Analysis, 2018-2025
- 5.2 Demand Forecast, 2025-2035
- 5.3 Production and Output Trend, 2018-2025
- 5.4 Production and Output Forecast, 2025-2035
- 5.5 Installed Capacity and Capacity Utilization
- 5.6 Company-Wise Production Plants and Statistics
- 5.6.1 Installed Production Capacity
- 5.6.2 Actual Production
- 5.6.3 Planned Capacity and Expansion Targets
- 5.7 Supply Chain Structure and Procurement Trends
- 5.8 Supply-Demand Gap and Bottlenecks
- 5.9 Import Dependence and Sourcing Structure
- 5.10 Contract Manufacturing and Outsourcing
- 5.11 Regional Supply and Demand Concentration
Chapter 6 Asia Pacific Data Center Server Market Pricing Analysis
- 6.1 Pricing Structure and Measurement
- 6.2 Historical Pricing Trends, 2018-2025
- 6.3 Pricing Outlook, 2025-2035
- 6.4 Average Selling Price and Unit Economics
- 6.5 Pricing by Product and Market Segment
- 6.6 Geographic Pricing Differences
- 6.7 Key Input, Energy, Labor and Logistics Costs
- 6.8 Contract Pricing and Purchasing Models
- 6.9 Pricing Sensitivity and Competitive Positioning
- 6.10 Price, Margin and Profitability Implications
Chapter 7 Asia Pacific Data Center Server Market Dynamics
- 7.1 Market Growth Drivers
- 7.1.1 Demand-Side Drivers
- 7.1.2 Technology and Innovation Drivers
- 7.1.3 Infrastructure and Investment Drivers
- 7.1.4 Regulatory and Policy Drivers
- 7.2 Market Restraints
- 7.2.1 Cost and Affordability Constraints
- 7.2.2 Technology and Adoption Barriers
- 7.2.3 Supply Chain and Operational Constraints
- 7.3 Market Challenges
- 7.3.1 Competitive Pressure and Margin Erosion
- 7.3.2 Skills, Infrastructure and Implementation Gaps
- 7.4 Emerging Market Opportunities
- 7.5 Market Dynamics Impact and Time-Horizon Assessment
Chapter 8 Asia Pacific Data Center Server Value Chain Analysis
- 8.1 Industry Value Chain Overview
- 8.2 Upstream Suppliers and Critical Inputs
- 8.3 Technology and Component Providers
- 8.4 Manufacturing or Service Delivery
- 8.5 Distribution, Channel Partners and Integrators
- 8.6 Downstream Applications and End Users
- 8.7 Value Addition and Profit Pools
- 8.8 Vertical Integration and Outsourcing
- 8.9 Supplier Concentration and Risk
- 8.10 Supply Chain Localization and Resilience
Chapter 9 Asia Pacific Data Center Server Market Regulations and Policies
- 9.1 Relevant Laws, Standards and Compliance Frameworks
- 9.2 Product, Service, Safety and Quality Requirements
- 9.3 Government Policies, Incentives and Subsidies
- 9.4 Imports, Exports and Trade Barriers
- 9.5 Public Procurement and Local Content Requirements
- 9.6 Environmental and Sustainability Compliance
- 9.7 Data Protection, AI and Cybersecurity Compliance
- 9.8 Upcoming Policy Changes and Market Implications
Chapter 10 Asia Pacific Data Center Server Market Hotspots and Opportunities
- 10.1 Market Opportunity Mapping and Growth Hotspots
- 10.2 High-Growth Applications and Customer Groups
- 10.3 Underserved Markets and White-Space Opportunities
- 10.4 Emerging Technology and Product Opportunities
- 10.5 New Capacity and Investment Hotspots
- 10.6 Market Entry and Expansion Opportunities
- 10.7 Distribution and Partnership Opportunities
- 10.8 Near-Term and Long-Term Commercial Potential
- 10.9 Opportunity Attractiveness and Execution Risks
Chapter 11 Asia Pacific Data Center Server Market Outlook, 2025-2035
- 11.1 Market Size and Analysis
- 11.1.1 Revenue (Market Measurement: 2025: USD 48.99 billion → 2035: USD 182.92 billion)
- 11.1.2 Market Volume and Quantity Sold
- 11.1.3 Historical Market Size, 2018-2025
- 11.1.4 Base-Year Market Size, 2025
- 11.2 Market Forecast, 2025-2035
- 11.2.1 Revenue Forecast to 2035
- 11.2.2 Volume Forecast to 2035
- 11.2.3 CAGR and Year-on-Year Growth
- 11.2.4 Incremental Revenue Opportunity
- 11.3 Forecast Assumptions and Scenario Analysis
- 11.3.1 Base-Case Forecast
- 11.3.2 Optimistic and Conservative Scenarios
- 11.3.3 Technology, Pricing and Policy Sensitivities
- 11.4 Market Attractiveness and Growth Outlook
Chapter 12 Asia Pacific Data Center Server Market Segmentation and Outlook
- 12.1 Segmentation Summary and Market Shares, 2025
- 12.2 Largest and Fastest-Growing Segments
- 12.3 By Product Type - Market Size and Forecast, 2025-2035
- 12.3.1 Segment Definition and Scope
- 12.3.2 Historical Market Size, 2018-2025
- 12.3.3 Revenue Forecast, 2025-2035
- 12.3.4 Volume Forecast, 2025-2035
- 12.3.5 Base-Year Market Share, 2025
- 12.3.6 Segment CAGR and Growth Drivers
- 12.3.7 Subsegment Market Size and Forecast
- 12.3.7.1 General-purpose rack servers
- 12.3.7.2 Accelerated servers
- 12.3.7.3 Non-accelerated blade and modular servers
- 12.3.7.4 Non-accelerated tower servers
- 12.3.8 Subsegment Pricing and Adoption Trends
- 12.3.9 Leading Suppliers and Competition
- 12.3.10 Regional Demand and Opportunities
- 12.4 By Application - Market Size and Forecast, 2025-2035
- 12.4.1 Segment Definition and Scope
- 12.4.2 Historical Market Size, 2018-2025
- 12.4.3 Revenue Forecast, 2025-2035
- 12.4.4 Volume Forecast, 2025-2035
- 12.4.5 Base-Year Market Share, 2025
- 12.4.6 Segment CAGR and Growth Drivers
- 12.4.7 Subsegment Market Size and Forecast
- 12.4.7.1 Cloud service delivery
- 12.4.7.2 Enterprise business workloads
- 12.4.7.3 AI and high-performance computing
- 12.4.7.4 Telecommunications network workloads
- 12.4.8 Subsegment Pricing and Adoption Trends
- 12.4.9 Leading Suppliers and Competition
- 12.4.10 Regional Demand and Opportunities
- 12.5 By Customer Type - Market Size and Forecast, 2025-2035
- 12.5.1 Segment Definition and Scope
- 12.5.2 Historical Market Size, 2018-2025
- 12.5.3 Revenue Forecast, 2025-2035
- 12.5.4 Volume Forecast, 2025-2035
- 12.5.5 Base-Year Market Share, 2025
- 12.5.6 Segment CAGR and Growth Drivers
- 12.5.7 Subsegment Market Size and Forecast
- 12.5.7.1 Hyperscaler and cloud operators
- 12.5.7.2 Private enterprises
- 12.5.7.3 Telecommunications operators
- 12.5.7.4 Government and research institutions
- 12.5.8 Subsegment Pricing and Adoption Trends
- 12.5.9 Leading Suppliers and Competition
- 12.5.10 Regional Demand and Opportunities
- 12.6 By Technology - Market Size and Forecast, 2025-2035
- 12.6.1 Segment Definition and Scope
- 12.6.2 Historical Market Size, 2018-2025
- 12.6.3 Revenue Forecast, 2025-2035
- 12.6.4 Volume Forecast, 2025-2035
- 12.6.5 Base-Year Market Share, 2025
- 12.6.6 Segment CAGR and Growth Drivers
- 12.6.7 Subsegment Market Size and Forecast
- 12.6.7.1 x86 host architecture
- 12.6.7.2 ARM host architecture
- 12.6.7.3 Non-x86 non-ARM host architecture
- 12.6.8 Subsegment Pricing and Adoption Trends
- 12.6.9 Leading Suppliers and Competition
- 12.6.10 Regional Demand and Opportunities
- 12.7 By Country - Market Size and Forecast, 2025-2035
- 12.7.1 Segment Definition and Scope
- 12.7.2 Historical Market Size, 2018-2025
- 12.7.3 Revenue Forecast, 2025-2035
- 12.7.4 Volume Forecast, 2025-2035
- 12.7.5 Base-Year Market Share, 2025
- 12.7.6 Segment CAGR and Growth Drivers
- 12.7.7 Subsegment Market Size and Forecast
- 12.7.7.1 China
- 12.7.7.2 Japan South Korea and Taiwan
- 12.7.7.3 South and Southeast Asia
- 12.7.7.4 Oceania and remaining Asia Pacific
- 12.7.8 Subsegment Pricing and Adoption Trends
- 12.7.9 Leading Suppliers and Competition
- 12.7.10 Regional Demand and Opportunities
- 12.8 Segment Growth Comparison
- 12.9 Segment Attractiveness and Priority Matrix
Chapter 13 Asia Pacific Data Center Server End-Use and Application Market Outlook
- 13.1 End-Use Industry and Customer Demand Structure
- 13.2 Leading Applications and Customer Groups
- 13.3 End-Use Market Size, Share and Forecast
- 13.4 Major End-Use Industry Deep Dives
- 13.4.1 Customer Requirements and Use Cases
- 13.4.2 Demand and Replacement Cycles
- 13.4.3 Technical and Regulatory Considerations
- 13.4.4 Purchasing and Procurement Models
- 13.4.5 Leading Vendors and Distribution Channels
- 13.4.6 Forecast and Commercial Opportunities
- 13.5 Emerging Applications and Cross-Segment Demand
- 13.6 End-Use Industry Investment Priorities
Chapter 14 Asia Pacific Data Center Server Geographic Market Outlook, 2025-2035
- 14.1 Regional Market Size and Country-Level Shares, 2025
- 14.2 Country Market Size Comparison, 2025
- 14.3 Country Market Forecasts, 2025-2035
- 14.4 Subregional Industrial and Demand Clusters
- 14.5 Intra-Regional Pricing and Cost Differences
- 14.6 Cross-Border Trade and Supply Networks
- 14.7 Regional Supply and Demand Balances
- 14.8 Country Opportunity Comparison and Prioritization
Note: Every listed country is covered on the structure shown under the first country.
Chapter 15 Asia Pacific Data Center Server Technology, Innovation and Sustainability Outlook
- 15.1 Technology Landscape and Maturity
- 15.2 Product, Process and Service Innovation
- 15.3 AI, Automation and Digital Tools in the Industry
- 15.4 Technology Adoption and Performance Benchmarking
- 15.5 Innovation Pipeline and R&D Investment
- 15.6 Patent and Intellectual Property Trends
- 15.7 Energy Efficiency and Resource Management
- 15.8 Sustainability, Recycling and Circularity
- 15.9 Technology Roadmap, 2025-2035
- 15.10 Risks of Obsolescence and Technology Substitution
Chapter 16 Asia Pacific Data Center Server Market Key Strategic Imperatives
- 16.1 Growth and Market Entry Priorities
- 16.2 High-Return Products and Segments
- 16.3 Pricing, Profitability and Cost Optimization
- 16.4 Technology Investment and Product Differentiation
- 16.5 Supply Chain Localization and Resilience
- 16.6 Distribution and Customer Acquisition
- 16.7 Partnership, Acquisition and Capacity Strategy
- 16.8 Regional Expansion Priorities
- 16.9 Short-, Medium- and Long-Term Actions
Chapter 17 Competition Outlook
- 17.1 Industry Competition Characteristics
- 17.2 Market Structure and Concentration
- 17.3 Market Share and Competitive Positioning, 2025
- 17.4 Company-Wise Revenue and Product Benchmarking
- 17.5 Production and Service Capacity Benchmarking
- 17.6 Technology, Pricing and Differentiation
- 17.7 Regional Footprint and Distribution Strength
- 17.8 Mergers, Acquisitions and Strategic Alliances
- 17.9 New Entrants and Competitive Threats
- 17.10 Porter's Five Forces and Industry Attractiveness
- 17.11 Competitive Outlook, 2025-2035
Chapter 18 Company Profiles
- 18.1 Company Coverage and Selection Criteria
- 18.2 IEIT Systems
- 18.2.1 Business Description
- 18.2.2 Company Ownership and Geographic Presence
- 18.2.3 Product and Service Portfolio
- 18.2.4 Manufacturing and Operating Footprint
- 18.2.5 Production Capacity and Expansion Plans
- 18.2.6 Financial Performance and Investment
- 18.2.7 Market Share and Competitive Position
- 18.2.8 Technology and Innovation Capabilities
- 18.2.9 Strategic Alliances or Partnerships
- 18.2.10 Recent Developments
- 18.2.11 Growth Strategy and Outlook
- 18.3 Lenovo
- 18.4 H3C
- 18.5 Dell Technologies
- 18.6 Hewlett Packard Enterprise
- 18.7 Other Relevant Market Participants
Note: Every listed company is profiled on the structure shown under the first company. The company list is preliminary and may change based on research findings, market developments, data availability and client requirements.
Chapter 19 Disclaimer
- 19.1 Research and Forecast Disclaimer
- 19.2 Data Source and Estimation Limitations
Note: The depth of individual sections depends on data availability for this market. Volume, capacity, trade and other unit-based metrics are included where applicable.

