Market Overview
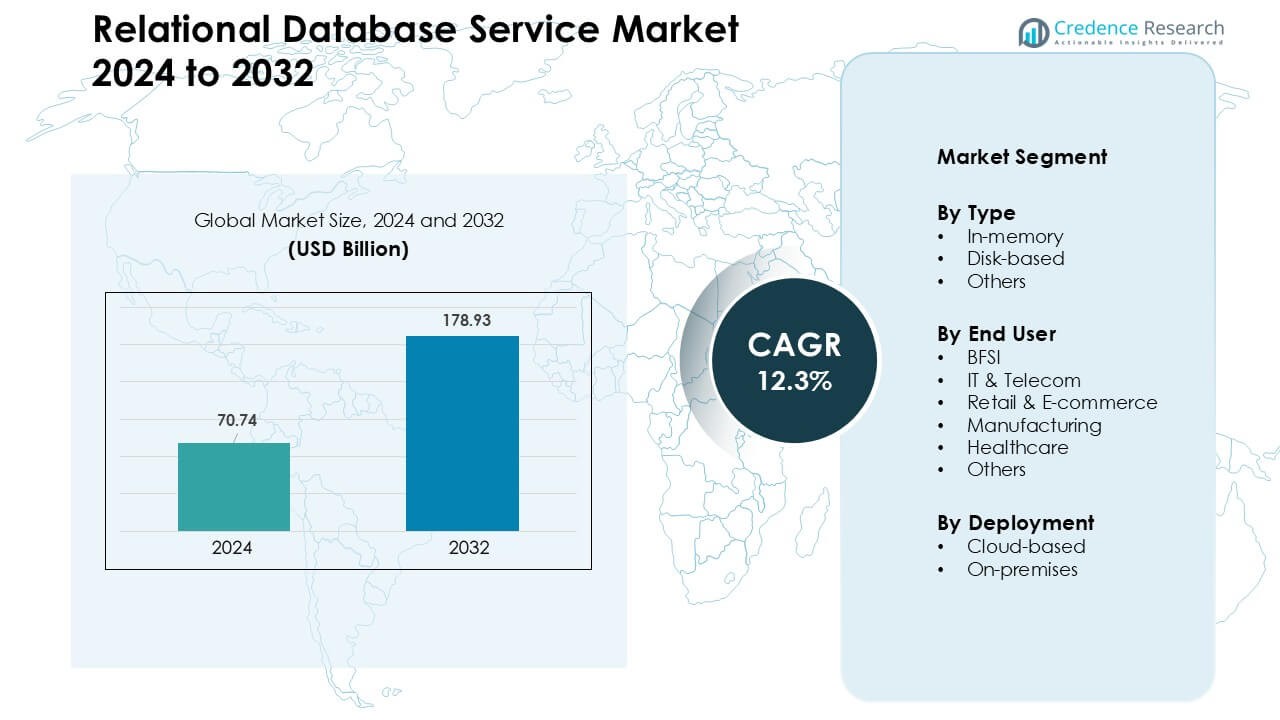
Relational Database Service Market was valued at USD 70.74 billion in 2024 and is anticipated to reach USD 178.93 billion by 2032, growing at a CAGR of 12.3 % during the forecast period.
| REPORT ATTRIBUTE |
DETAILS |
| Historical Period |
2020-2023 |
| Base Year |
2024 |
| Forecast Period |
2025-2032 |
| Relational Database Service Market Size 2024 |
USD 70.74 Billion |
| Relational Database Service Market, CAGR |
12.3 % |
| Relational Database Service Market Size 2032 |
USD 178.93 Billion |
Major players in the relational database service market include Alibaba Cloud, Microsoft, Nutanix, Teradata, Google LLC, Amazon Web Services, Inc., IBM Corporation, SAP SE, MongoDB, Inc., and Oracle, each expanding cloud-native architectures and automation capabilities to support large transactional and analytical workloads. These companies compete through enhanced scalability, stronger security frameworks, and wider integration with AI and multi-cloud ecosystems. North America emerged as the leading region in 2024 with 38% share, supported by rapid cloud migration across BFSI, telecom, healthcare, and digital commerce, along with strong presence of global hyperscalers that continue to drive innovation and adoption.
Access crucial information at unmatched prices!
Request your sample report today & start making informed decisions powered by Credence Research Inc.!
Download Sample
Market Insights
- The relational database service market reached at USD 70.74 billion in 2024 and is anticipated to reach USD 178.93 billion by 2032, growing at a CAGR of 12.3 % during the forecast period.
- Growth is driven by increased cloud migration, real-time analytics needs, and higher transaction loads in BFSI, retail, and telecom, pushing enterprises toward automated, secure, and high-availability database systems.
- Key trends include wider adoption of multi-cloud architectures, AI-driven database automation, and growing demand for industry-specific data platforms that enhance performance and compliance.
- Competition intensified as leading vendors expanded global data-center networks, strengthened security features, and improved hybrid integration, while cloud-based deployment led the market with the highest segment share.
- North America held the dominant regional share at 38%, supported by strong digital infrastructure, while Asia Pacific grew fastest due to rapid adoption among SMEs and rising investments in cloud-native enterprise applications.
Market Segmentation Analysis:
By Type
In-memory databases dominated the type segment in 2024 with about 48% share, driven by rising demand for real-time analytics, faster transaction processing, and reduced latency across digital platforms. Enterprises in banking, e-commerce, and telecom favored in-memory systems because these tools support quick scaling for dynamic workloads. Disk-based databases maintained steady use in legacy systems that require structured storage at lower cost, while the “others” category grew through hybrid and purpose-built engines adopted for mixed analytical and operational needs.
- For instance, Misys (now part of Finastra), a global fintech firm, used the GridGain in-memory computing platform to process trade and transaction data, achieving significant performance improvements compared to legacy disk-based approaches.
By End User
BFSI led the end-user segment in 2024 with nearly 34% share, supported by high-volume transaction systems and strict requirements for data integrity and compliance. Financial institutions adopted advanced relational database services to manage fraud detection workflows, customer analytics, and digital banking operations. IT & telecom and retail & e-commerce expanded adoption as digital platforms scaled user traffic, while healthcare and manufacturing increased usage for patient data management, supply-chain tracking, and production planning.
- For instance, IT & telecom and retail & e-commerce expanded adoption as digital platforms scaled user traffic, while healthcare and manufacturing increased usage for patient data management, supply-chain tracking, and production planning.
By Deployment
Cloud-based deployment dominated the deployment segment in 2024 with around 63% share, driven by rapid migration toward scalable, managed database services. Organizations selected cloud models to reduce infrastructure costs, improve automatic backups, and streamline global accessibility for applications. On-premises databases retained demand in regulated sectors and organizations with legacy workloads that require strict data residency and control. Growth of cloud-native applications, multi-region availability, and pay-as-you-use models continued to strengthen the cloud segment’s leadership.
Key Growth Drivers
Growing Demand for Scalable Data Management
Rapid expansion of digital services increased the need for scalable relational database systems across sectors such as BFSI, telecom, retail, and healthcare. Companies now generate larger structured datasets through payments, supply chains, connected devices, and online transactions. This growth pushed enterprises to adopt relational database services that offer high availability, real-time processing, and seamless scaling without heavy infrastructure investment. Cloud platforms strengthened this shift by delivering managed services that reduce maintenance efforts and speed up deployment. The rising use of analytics and automation also created a stronger need for stable data structures, which relational engines support well. As digital workloads rise, scalable RDS platforms continue to help organizations improve data speed, reliability, and compliance while supporting modern applications.
- For instance, Amazon Aurora is a managed relational database service on AWS, it can scale its storage automatically (in 10 GB increments), and it removes the need for manual storage provisioning.
Rise of Cloud Migration Across Enterprises
Global cloud adoption accelerated as companies pursued better flexibility, cost efficiency, and operational reliability. Many enterprises migrated mission-critical workloads from legacy on-prem systems to cloud-hosted relational database services to streamline performance. This shift helped reduce hardware spending and allowed teams to focus more on core development tasks rather than infrastructure upkeep. Cloud-based RDS platforms also improved resilience through automated backups, multi-region replication, and quick failover. The rapid rise of SaaS platforms, remote work, and distributed applications further increased demand for cloud-managed databases. As businesses expand digital operations, cloud migration continues to be a major driver for relational database service adoption.
- For instance, Amazon Aurora’s Global Database architecture now supports cross-Region switchover operations in typically under 30 seconds, enabling enterprises to migrate mission-critical databases across AWS Regions with minimal downtime during regional rotations.
Growing Use of Analytics and Real-Time Insights
Organizations increased their focus on analytics, business intelligence, and real-time decision making, which strengthened demand for relational database services. Modern applications rely on stable, structured data models for reporting, forecasting, and operational monitoring. RDS platforms support these needs with faster query performance, optimized indexing, and integrated tools for visualization and analysis. Real-time insights also improved customer experience and operational accuracy across sectors like retail, banking, and manufacturing. With rising data-driven strategies and higher performance expectations, enterprises continue to invest in relational database systems that support rapid querying, strong consistency, and dependable analytical outputs. This trend remains a core driver for long-term market growth.
Key Trends & Opportunities
Integration of AI and Automation in Database Operations
AI-driven automation gained strong momentum as vendors introduced self-optimizing features for database tuning, security updates, and workload balancing. Automated tools now monitor query patterns, detect anomalies, and recommend indexing improvements. These capabilities reduce manual management and help enterprises maintain consistent performance across growing datasets. AI integration also strengthened security by identifying suspicious activity and tightening access controls. As automation advances, relational database platforms continue to evolve toward “self-driving” systems that simplify administration and improve uptime.
- For instance, Oracle AI Database 26ai (the next-gen AI-native database) integrates deeply with its SQL engine to run agentic AI workflows, vector search, and anomaly detection within relational data, enabling AI-driven operations and self-governance across mission-critical systems.
Growing Adoption of Multi-Cloud and Hybrid Architectures
Companies increasingly adopted multi-cloud and hybrid setups to reduce vendor lock-in and improve resiliency. These architectures allow enterprises to run relational databases across multiple cloud platforms or combine cloud and on-prem systems for flexible deployment. Multi-cloud strategies support better disaster recovery, workload distribution, and compliance management. Vendors responded by offering cross-platform compatibility, unified dashboards, and tools for seamless data movement. This trend is creating new opportunities for RDS providers to deliver more interoperable and adaptive services.
- For instance, Cockroach DB is deployed in production across multiple clouds (AWS, GCP, and Azure) with a single logical cluster, enabling geographically distributed SQL operations.
Expansion of Industry-Specific Data Platforms
Demand rose for relational database services designed for industry-specific workflows such as digital banking, healthcare records, e-commerce personalization, and telecom billing. Vendors began offering tailor-made engines with built-in compliance tools, optimized schemas, and sector-focused analytics. These solutions help companies accelerate deployment while meeting strict regulatory and performance requirements. As more industries digitize complex operations, specialized RDS platforms present a large growth opportunity.
Key Challenge
Rising Security and Compliance Requirements
Enterprises face increasing pressure to protect sensitive data from breaches and unauthorized access. Sectors such as BFSI, healthcare, and government require strict compliance with data protection laws, encryption standards, and audit controls. Managing these requirements across distributed, cloud-hosted environments becomes complex, especially as cyberattacks grow more advanced. Vendors must continually update security features, including identity management, encryption, and access monitoring. Meeting global compliance rules remains a persistent challenge for both providers and end users.
Legacy System Integration and Migration Complexity
Many organizations still rely on large, outdated on-prem databases that are difficult to migrate to modern RDS platforms. These systems often have custom code, outdated schemas, and limited documentation, increasing migration risks. Data transfer, downtime, and compatibility issues slow adoption and raise project costs. Enterprises also face skill gaps in managing hybrid environments that combine legacy and cloud-based systems. As digital transformation accelerates, overcoming migration and integration hurdles remains a major challenge for market expansion.
Regional Analysis
North America
North America dominated the relational database service market in 2024 with about 38% share, driven by strong cloud adoption across banking, telecom, and digital commerce. Enterprises in the United States scaled managed database platforms to support advanced analytics, AI-based workloads, and large transactional systems. The region benefited from the presence of major cloud vendors that expanded multiregion availability zones and strengthened compliance frameworks. Rising modernization of legacy IT systems and rapid digital transformation across government and healthcare also boosted demand. Canada’s growing technology ecosystem further supported adoption, making North America the leading market.
Europe
Europe held nearly 27% share of the market in 2024, supported by expanding cloud migration across financial services, manufacturing, and public sector organizations. Strict data protection laws such as GDPR increased demand for secure, compliant, and regionally hosted relational database services. Countries including Germany, France, and the United Kingdom invested heavily in digital infrastructure and hybrid cloud setups. The growth of e-commerce, Industry 4.0 initiatives, and cross-border data-sharing frameworks also strengthened the market. Increasing adoption of automation and analytics platforms kept Europe a key contributor to global demand.
Asia Pacific
Asia Pacific accounted for approximately 24% share in 2024 and remained the fastest-growing region due to rapid digitalization across China, India, Japan, and Southeast Asia. Expanding e-commerce platforms, fintech services, and telecom networks generated heavy demand for scalable relational database systems. Cloud service providers enlarged regional data centers to support local workloads and compliance requirements. Government-led digital initiatives and rising investments in AI and analytics further boosted adoption. Small and medium enterprises also accelerated cloud database usage to enhance performance and reduce infrastructure cost, driving strong regional momentum.
Latin America
Latin America captured close to 6% share in 2024, driven by increasing adoption of cloud-based database services among retail, banking, and telecom companies. Countries such as Brazil, Mexico, and Colombia invested in digital transformation programs that encouraged managed database deployment. Cloud providers expanded regional infrastructure to address latency and compliance needs. Growing use of mobile payments, online retail, and analytics tools pushed organizations to upgrade traditional databases. Although adoption remains moderate, improving connectivity and rising enterprise automation efforts are expected to support steady regional growth.
Middle East & Africa
The Middle East & Africa region held around 5% share in 2024, supported by digital modernization efforts in the UAE, Saudi Arabia, and South Africa. Government cloud-first strategies and rising investment in smart city programs boosted adoption of relational database services. Enterprises in BFSI, energy, and telecom sectors adopted managed database platforms to enhance operational reliability and secure data handling. Expanding regional cloud availability zones and partnerships with global vendors strengthened the market. While adoption levels are lower than other regions, rising digital infrastructure spending continues to create steady growth opportunities.
Market Segmentations:
By Type
- In-memory
- Disk-based
- Others
By End User
- BFSI
- IT & Telecom
- Retail & E-commerce
- Manufacturing
- Healthcare
- Others
By Deployment
By Geography
- North America
- Europe
- Germany
- France
- U.K.
- Italy
- Spain
- Rest of Europe
- Asia Pacific
- China
- Japan
- India
- South Korea
- South-east Asia
- Rest of Asia Pacific
- Latin America
- Brazil
- Argentina
- Rest of Latin America
- Middle East & Africa
- GCC Countries
- South Africa
- Rest of the Middle East and Africa
Competitive Landscape
Major players in the relational database service market Alibaba Cloud, Microsoft, Nutanix, Teradata, Google LLC, Amazon Web Services, Inc., IBM Corporation, SAP SE, MongoDB, Inc., and Oracle compete by expanding cloud-native capabilities, strengthening security, and improving automation features. These companies focus on scalable architectures, multi-cloud compatibility, and AI-driven optimization to support high-volume transactional and analytical workloads. Vendors invest in global data-center expansion, low-latency infrastructure, and advanced compliance frameworks to meet regional regulatory needs. Many providers also enhance integration with analytics, machine learning tools, and development platforms to attract enterprises modernizing legacy systems. Strategic partnerships with telecom operators, SaaS providers, and industry-specific platforms further help broaden market reach. The competitive environment remains intense as vendors emphasize faster performance, lower operational cost, and seamless migration tools to retain and grow their user base.
Shape Your Report to Specific Countries or Regions & Enjoy 30% Off!
Key Player Analysis
- Alibaba Cloud
- Microsoft
- Nutanix
- Teradata
- Google LLC
- Amazon Web Services, Inc.
- IBM Corporation
- SAP SE
- MongoDB, Inc.
- Oracle
Recent Developments
- In November 2025, Microsoft announced SQL Server 2025 is generally available (GA) a major relational-engine release that Microsoft positions to run consistently on-premises and in cloud (Azure SQL compatibility and cross-deployment scenarios). This is a platform-level development that impacts Azure’s relational database story and hybrid DB deployments.
- In August 2025, Nutanix published blog/marketing material positioning Nutanix Database Service (NDB) as a next-gen DBaaS (formerly Era) promoting one-click provisioning, support for popular SQL/NoSQL engines, and hybrid/on-prem control signalling Nutanix’s push to compete in managed database/platform services.
- In July 2025, Alibaba Cloud: Published another monthly “database new features” infographic (July) listing further ApsaraDB/PolarDB enhancements and release notes showing a cadence of monthly DB feature rolls and bugfixes for its relational services
Report Coverage
The research report offers an in-depth analysis based on Type, End-User, Deployment and Geography. It details leading market players, providing an overview of their business, product offerings, investments, revenue streams, and key applications. Additionally, the report includes insights into the competitive environment, SWOT analysis, current market trends, as well as the primary drivers and constraints. Furthermore, it discusses various factors that have driven market expansion in recent years. The report also explores market dynamics, regulatory scenarios, and technological advancements that are shaping the industry. It assesses the impact of external factors and global economic changes on market growth. Lastly, it provides strategic recommendations for new entrants and established companies to navigate the complexities of the market.
Future Outlook
- The market will see stronger adoption of cloud-native relational databases across all major industries.
- AI-driven automation will enhance query optimization, security monitoring, and performance tuning.
- Multi-cloud usage will expand as enterprises seek flexibility and reduced vendor lock-in.
- Real-time analytics demand will push vendors to improve speed, consistency, and scalability.
- Industry-specific database solutions will gain traction in BFSI, healthcare, and telecom.
- Hybrid deployments will remain important as companies balance legacy systems with cloud migration.
- Data governance and compliance requirements will drive investment in advanced security features.
- Global data-center expansion will support lower latency and localized infrastructure.
- Integration with low-code and no-code platforms will simplify database development.
- Rising use of AI and machine learning models will increase demand for structured, reliable relational data.


