
Welding shielding and lab purity shape Australian argon use
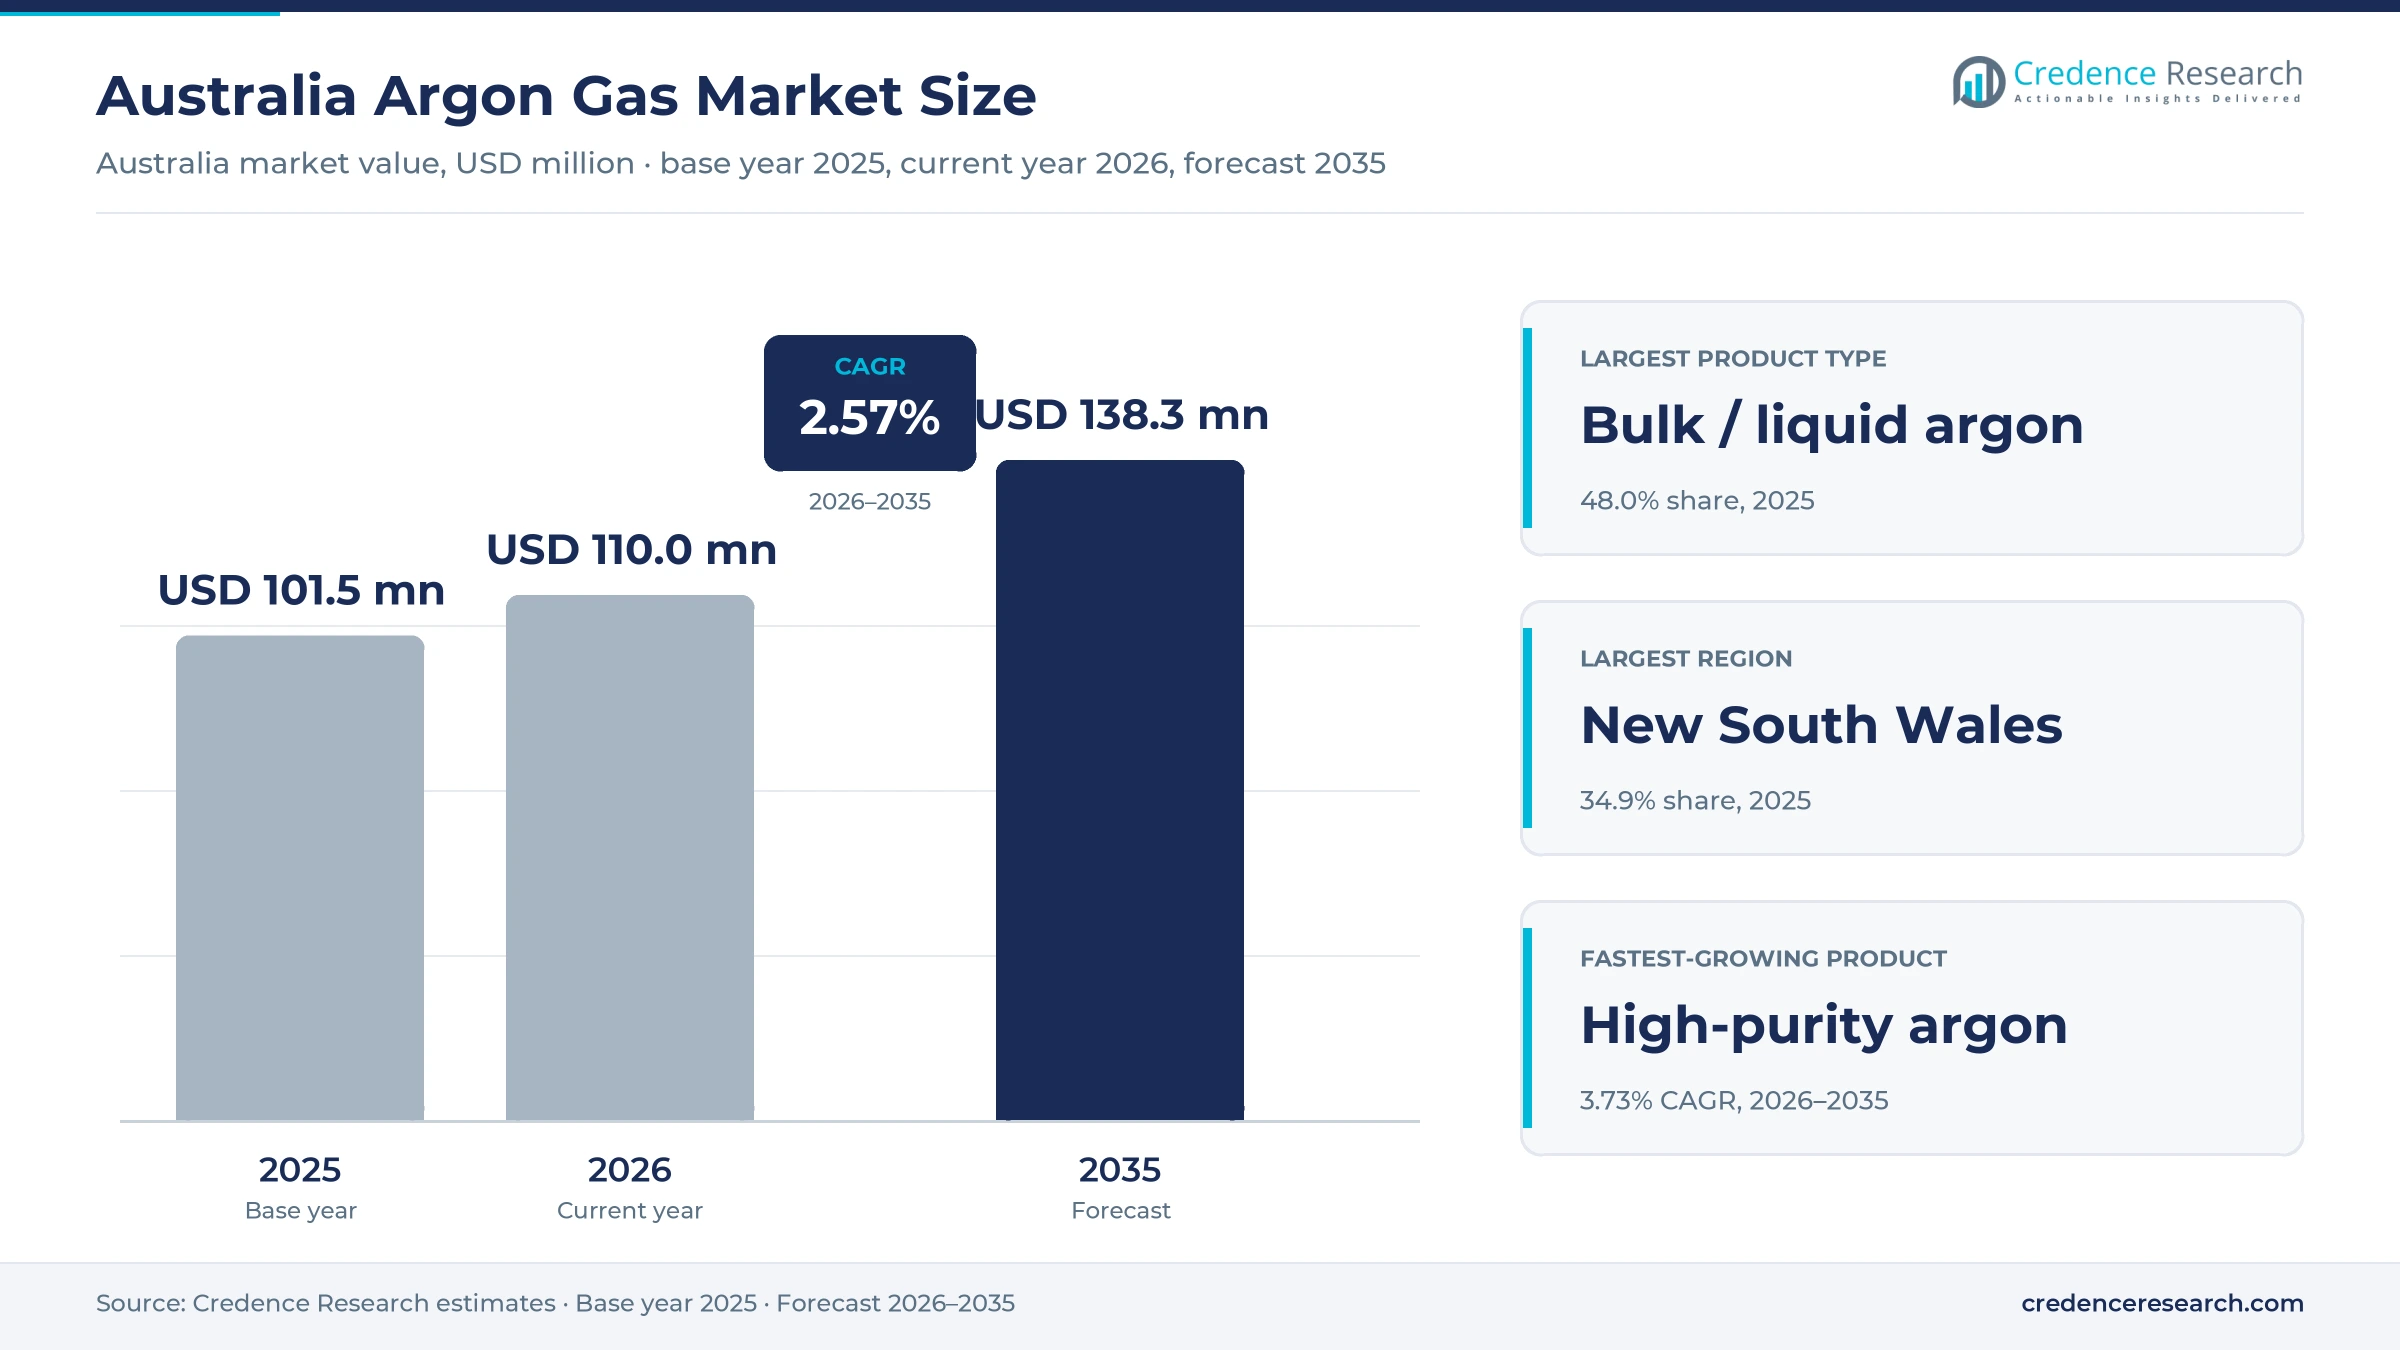
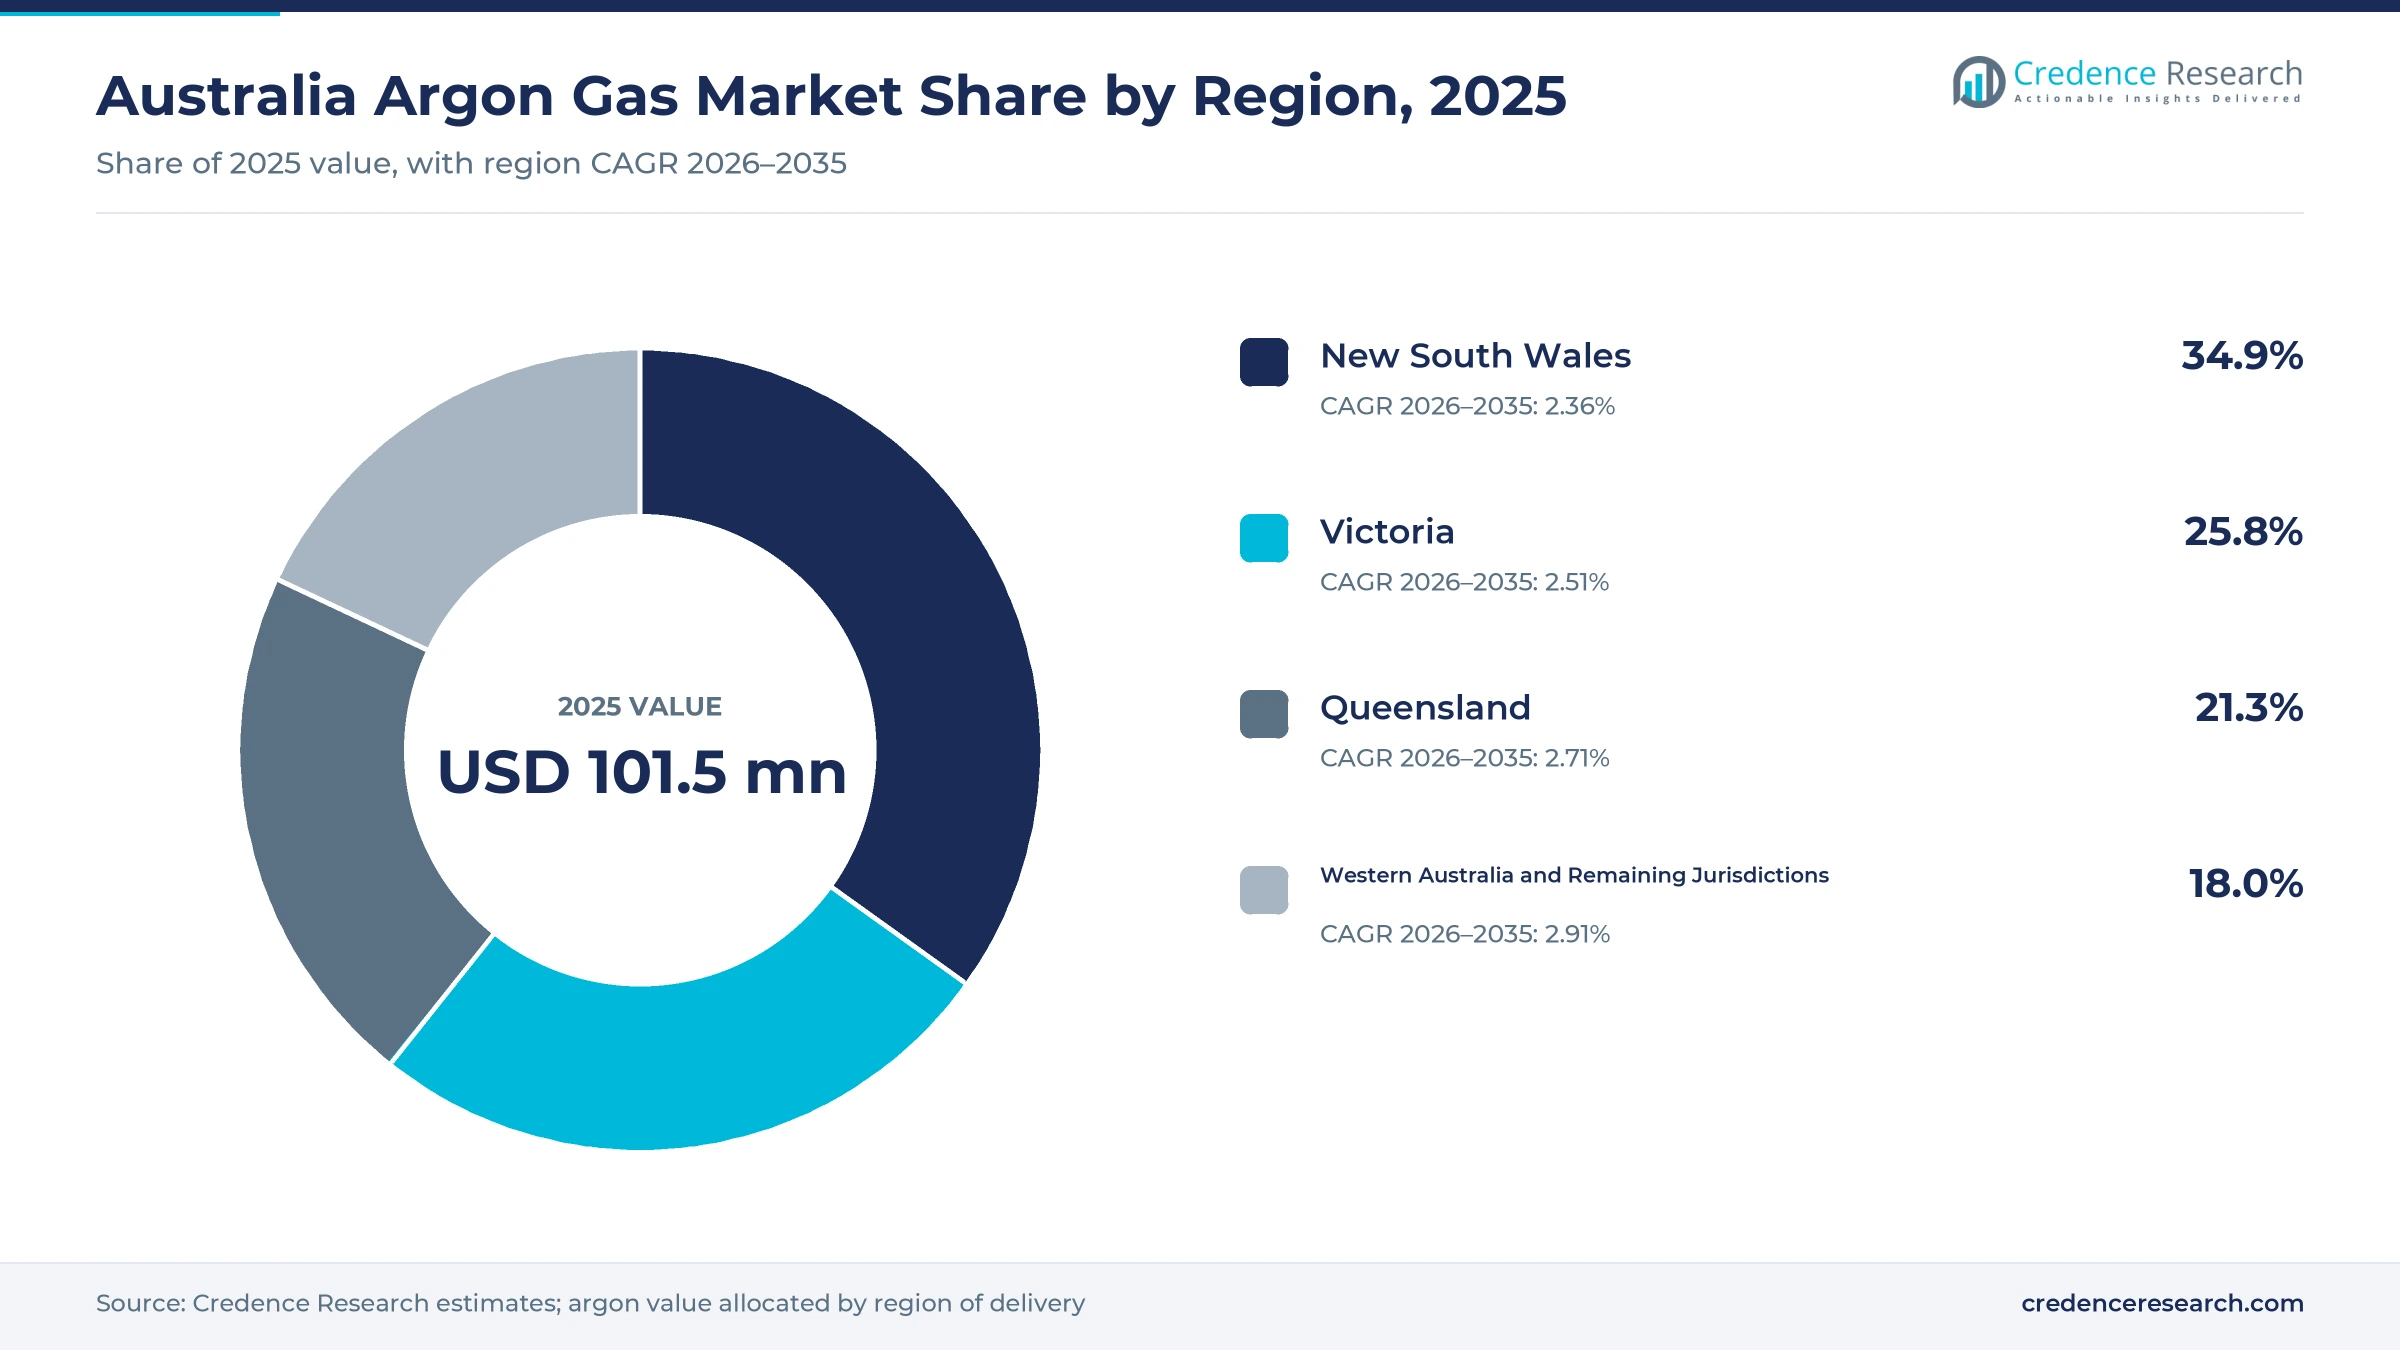
The Australia argon gas market was valued at USD 101.5 million in 2025 and is projected to increase from USD 110.0 million in 2026 to USD 138.3 million by 2035, registering a CAGR of 2.57% during 2026–2035. Demand comes from fabricators, mine maintenance crews, laboratories, food processors and manufacturers that use argon to shield welds, carry samples through analyzers and keep oxygen away from hot metal and sensitive products. New South Wales held the largest regional share, 34.9% in 2025, because the state hosts argon production at Port Kembla and large specialty gas operations in western Sydney. Western Australia and the remaining jurisdictions form the fastest-growing zone at 2.91% a year, as resource work and population growth lift welding activity. Supply also changed in July 2025, when Nippon Sanso Holdings completed its purchase of Coregas, which placed two large cylinder suppliers in one group.
Which argon grades and supply formats does the estimate cover?
The estimate measures the value of argon sold for use in Australia as bulk liquid, compressed gas in cylinders and cylinder packs, and high-purity or specialty grades for laboratories and precision processes. Values are stated at supplier and distributor selling prices, and they include delivery, cylinder rental and managed supply charges that customers pay with the gas.
The estimate excludes argon blended into welding mixtures sold under other gas names, argon used inside producer plants, and welding equipment or consumables. The value chain runs from air separation plants that recover argon by cryogenic distillation through bulk tankers, filling stations, branches, distributors and hardware trade counters to fabricators, mines, laboratories, hospitals and process plants across the country.
Australia Argon Gas Market Insights
- The Australia argon gas market was valued at USD 101.5 million in 2025 and is projected to reach USD 138.3 million by 2035, registering a CAGR of 2.57% during 2026–2035.
- New South Wales held a 34.9% share of 2025 value, because the state hosts argon production at Port Kembla and large specialty gas operations in western Sydney.
- Bulk and liquid argon led with a 48.0% share of 2025 value, because large fabrication, mining and process sites buy liquid deliveries under managed supply contracts.
- The competition regulator decided on June 24, 2025, not to oppose the Coregas acquisition by the parent of Supagas, after it reviewed overlaps in cylinder gases including argon.
- Air Liquide plans a new air separation unit at Yennora in New South Wales, with operations expected to begin in 2028, which adds local air gas capacity.
Bulk liquid leads while high-purity grades grow fastest
Why does bulk liquid argon lead product demand?
Based on product type, the market is categorized into bulk / liquid argon, package / cylinder argon and high-purity / specialty argon. Bulk / Liquid Argon led with a 48.0% share of 2025 value, because large fabrication, mining and process sites take liquid deliveries into on-site tanks. High-Purity / Specialty Argon grows fastest at 3.73% a year, as laboratories and precision manufacturers specify tighter impurity limits.
How does metal fabrication dominate argon use?
Based on end-use industry, the market is categorized into metal fabrication and welding, mining and resources, healthcare, electronics and research, and food, energy and process manufacturing. Metal Fabrication and Welding led with a 52.0% share of 2025 value, because MIG and TIG welders use argon to shield weld metal. Healthcare, Electronics and Research grows fastest at 3.33% a year, as testing and research work expands.
Why does welding remain the main argon application?
Based on application, the market is categorized into welding and thermal processing, analytical instrumentation, controlled-atmosphere processing and medical and product preservation. Welding and Thermal Processing led with a 62.0% share of 2025 value, because shielding, cutting and heat treatment run every working day. Controlled-Atmosphere Processing grows fastest at 3.30% a year, as metal printing and inert blanketing spread.
How do direct accounts and trade counters reach buyers?
Based on sales channel, the market is categorized into direct supplier accounts, specialist gas distributors and trade counter and cylinder exchange. Direct Supplier Accounts led with a 55.0% share of 2025 value, because large users sign bulk and rental contracts with producers. Trade Counter and Cylinder Exchange grows fastest at 2.93% a year, as hardware stores and exchange programs reach small workshops.
| Segment Group | Leading Sub-segment | Share, 2025 | Fastest-growing Sub-segment | CAGR, 2026–2035 |
|---|---|---|---|---|
| By Product Type | Bulk / Liquid Argon | 48.0% | High-Purity / Specialty Argon | 3.73% |
| By End-Use Industry | Metal Fabrication and Welding | 52.0% | Healthcare, Electronics and Research | 3.33% |
| By Application | Welding and Thermal Processing | 62.0% | Controlled-Atmosphere Processing | 3.30% |
| By Sales Channel | Direct Supplier Accounts | 55.0% | Trade Counter and Cylinder Exchange | 2.93% |
Request a Free Sample
Fill in your details and we'll send you a free sample report.
- Sample data tables & charts
- Research methodology
Fabrication work, lab purity and supply reach lift demand
How does recurring fabrication and maintenance work lift demand?
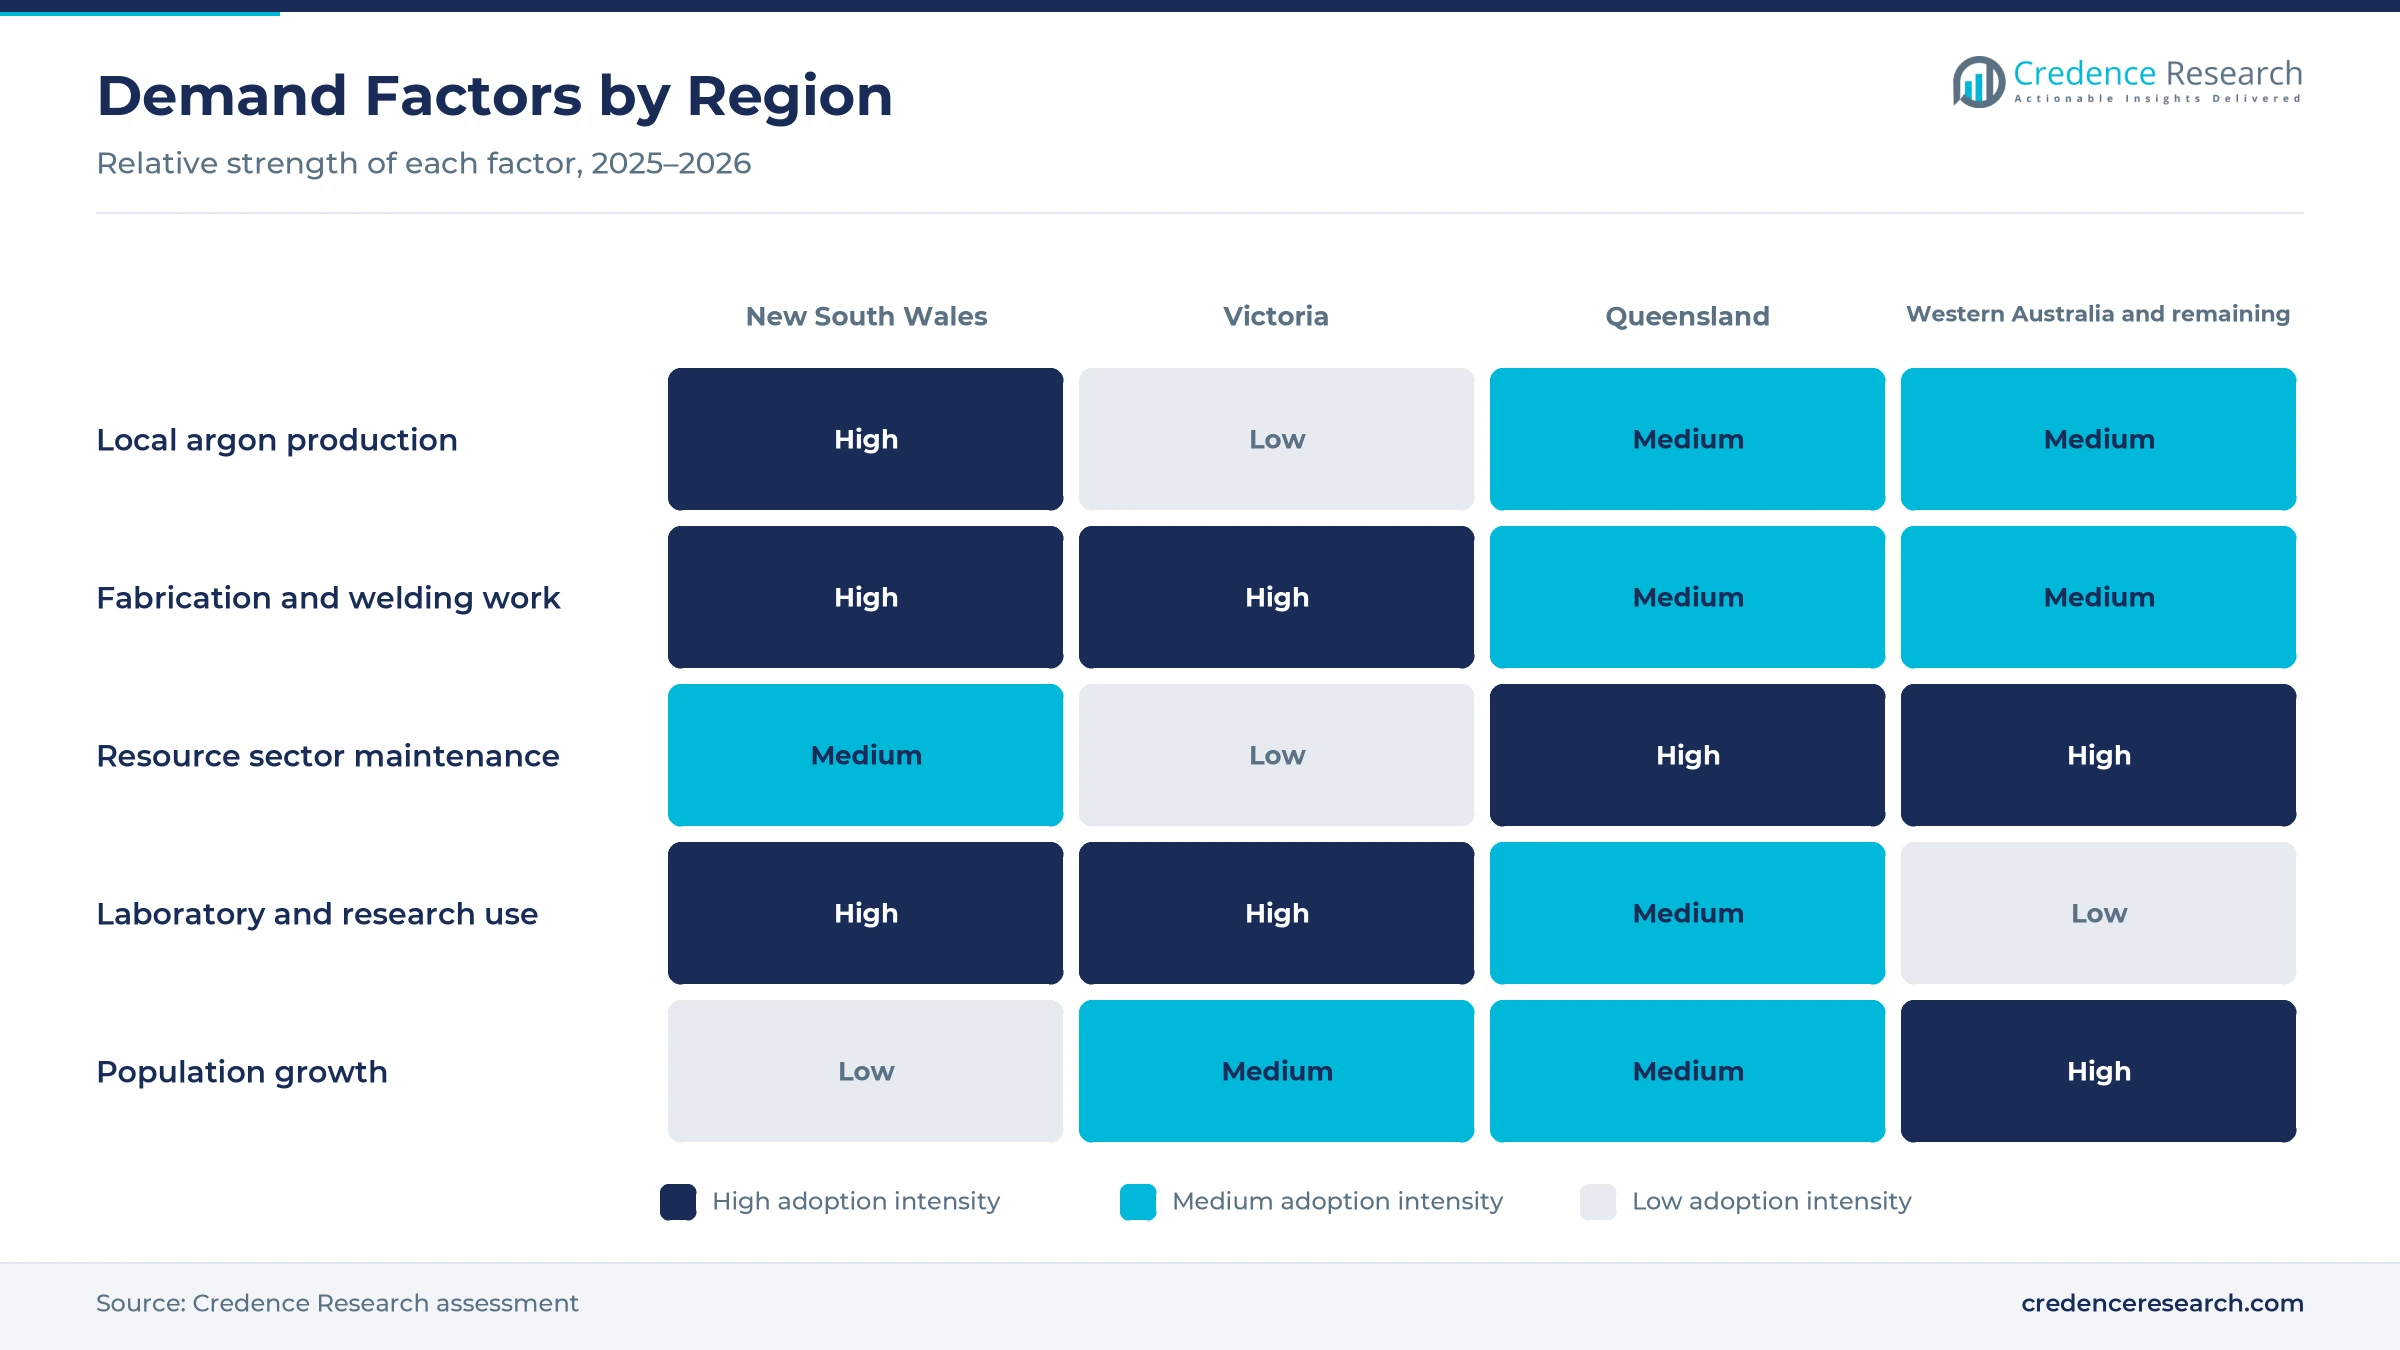
Recurring fabrication and maintenance work anchors argon sales, because MIG and TIG welders use the gas to shield weld metal from oxidation and contamination. Australia faces a projected shortfall of 70,000 skilled welders by 2030, according to Weld Australia, which shows how much welding work major projects require. Projects named in that warning include the $9.9 billion Torrens to Darlington road project in South Australia, the AUKUS submarine program and other shipbuilding work. Manufacturing value added also held at about 5.3% of GDP in 2025, according to World Bank data, which keeps workshop and maintenance welding active. As a result, metal fabrication and welding hold a 52.0% share of 2025 value, as fabricators buy welding consumables alongside shielding gas.
Why do analytical and high-purity needs raise value?
Analytical and high-purity process requirements raise the value of each cylinder, because laboratories and precision manufacturers need argon with tighter impurity limits than standard welding grades. Coregas sells argon 5.0 at 99.999% purity as a laboratory grade, against 99.997% for its industrial 4.7 grade, according to its argon product page. The same supplier lists argon as a carrier or balancing gas in gas chromatography and spectroscopy, and it markets argon 5.0 for additive manufacturing. BOC also built a $20 million specialty gases facility at Wetherill Park in Sydney to produce over 8,000 high-purity and specialty gases locally. In turn, high-purity and specialty argon grows at 3.73% a year, the fastest product rate, as research and testing demand expands.
How do regional plants and networks widen supply reach?
Regional supply infrastructure and network reach widen demand, because argon users outside major cities buy only when cylinders and bulk liquid arrive reliably. Coregas announced a $16 million air separation unit at its Darra site in Brisbane in December 2023, with commissioning planned for mid-2025, because Queensland demand had been supplied from Port Kembla. BOC said its Kwinana liquefaction plant would make it self-sufficient in Western Australia and end the need to import product from its eastern states plants. Coregas also operates 32 branches and works with more than 620 channel partners across Australia and New Zealand. As a result, Queensland grows at 2.71% a year, as local production shortens delivery routes for welding and mining customers.
Why does resource sector activity sustain argon use?
Resource sector activity sustains argon use, because mines, processing plants and their contractors weld, cut and repair heavy equipment throughout the year. Resources and energy export earnings were forecast at $405 billion in 2025-26 and $416 billion in 2026-27 in the June 2026 Resources and Energy Quarterly, according to the Resources Minister. Gold export earnings are expected to peak at about $73 billion in 2026-27, which supports active mines and processing sites. Western Australia also recorded a 4.0% quarterly rise in private new capital expenditure in the June 2026 quarter, while the national figure fell 3.6%. In turn, mining and resources demand stays firm through the forecast period, as owners of underground mining equipment keep repairing buckets and truck bodies.
Consolidation and retail access reshape cylinder supply
How is the shift to consolidated cylinder supply changing rivalry?
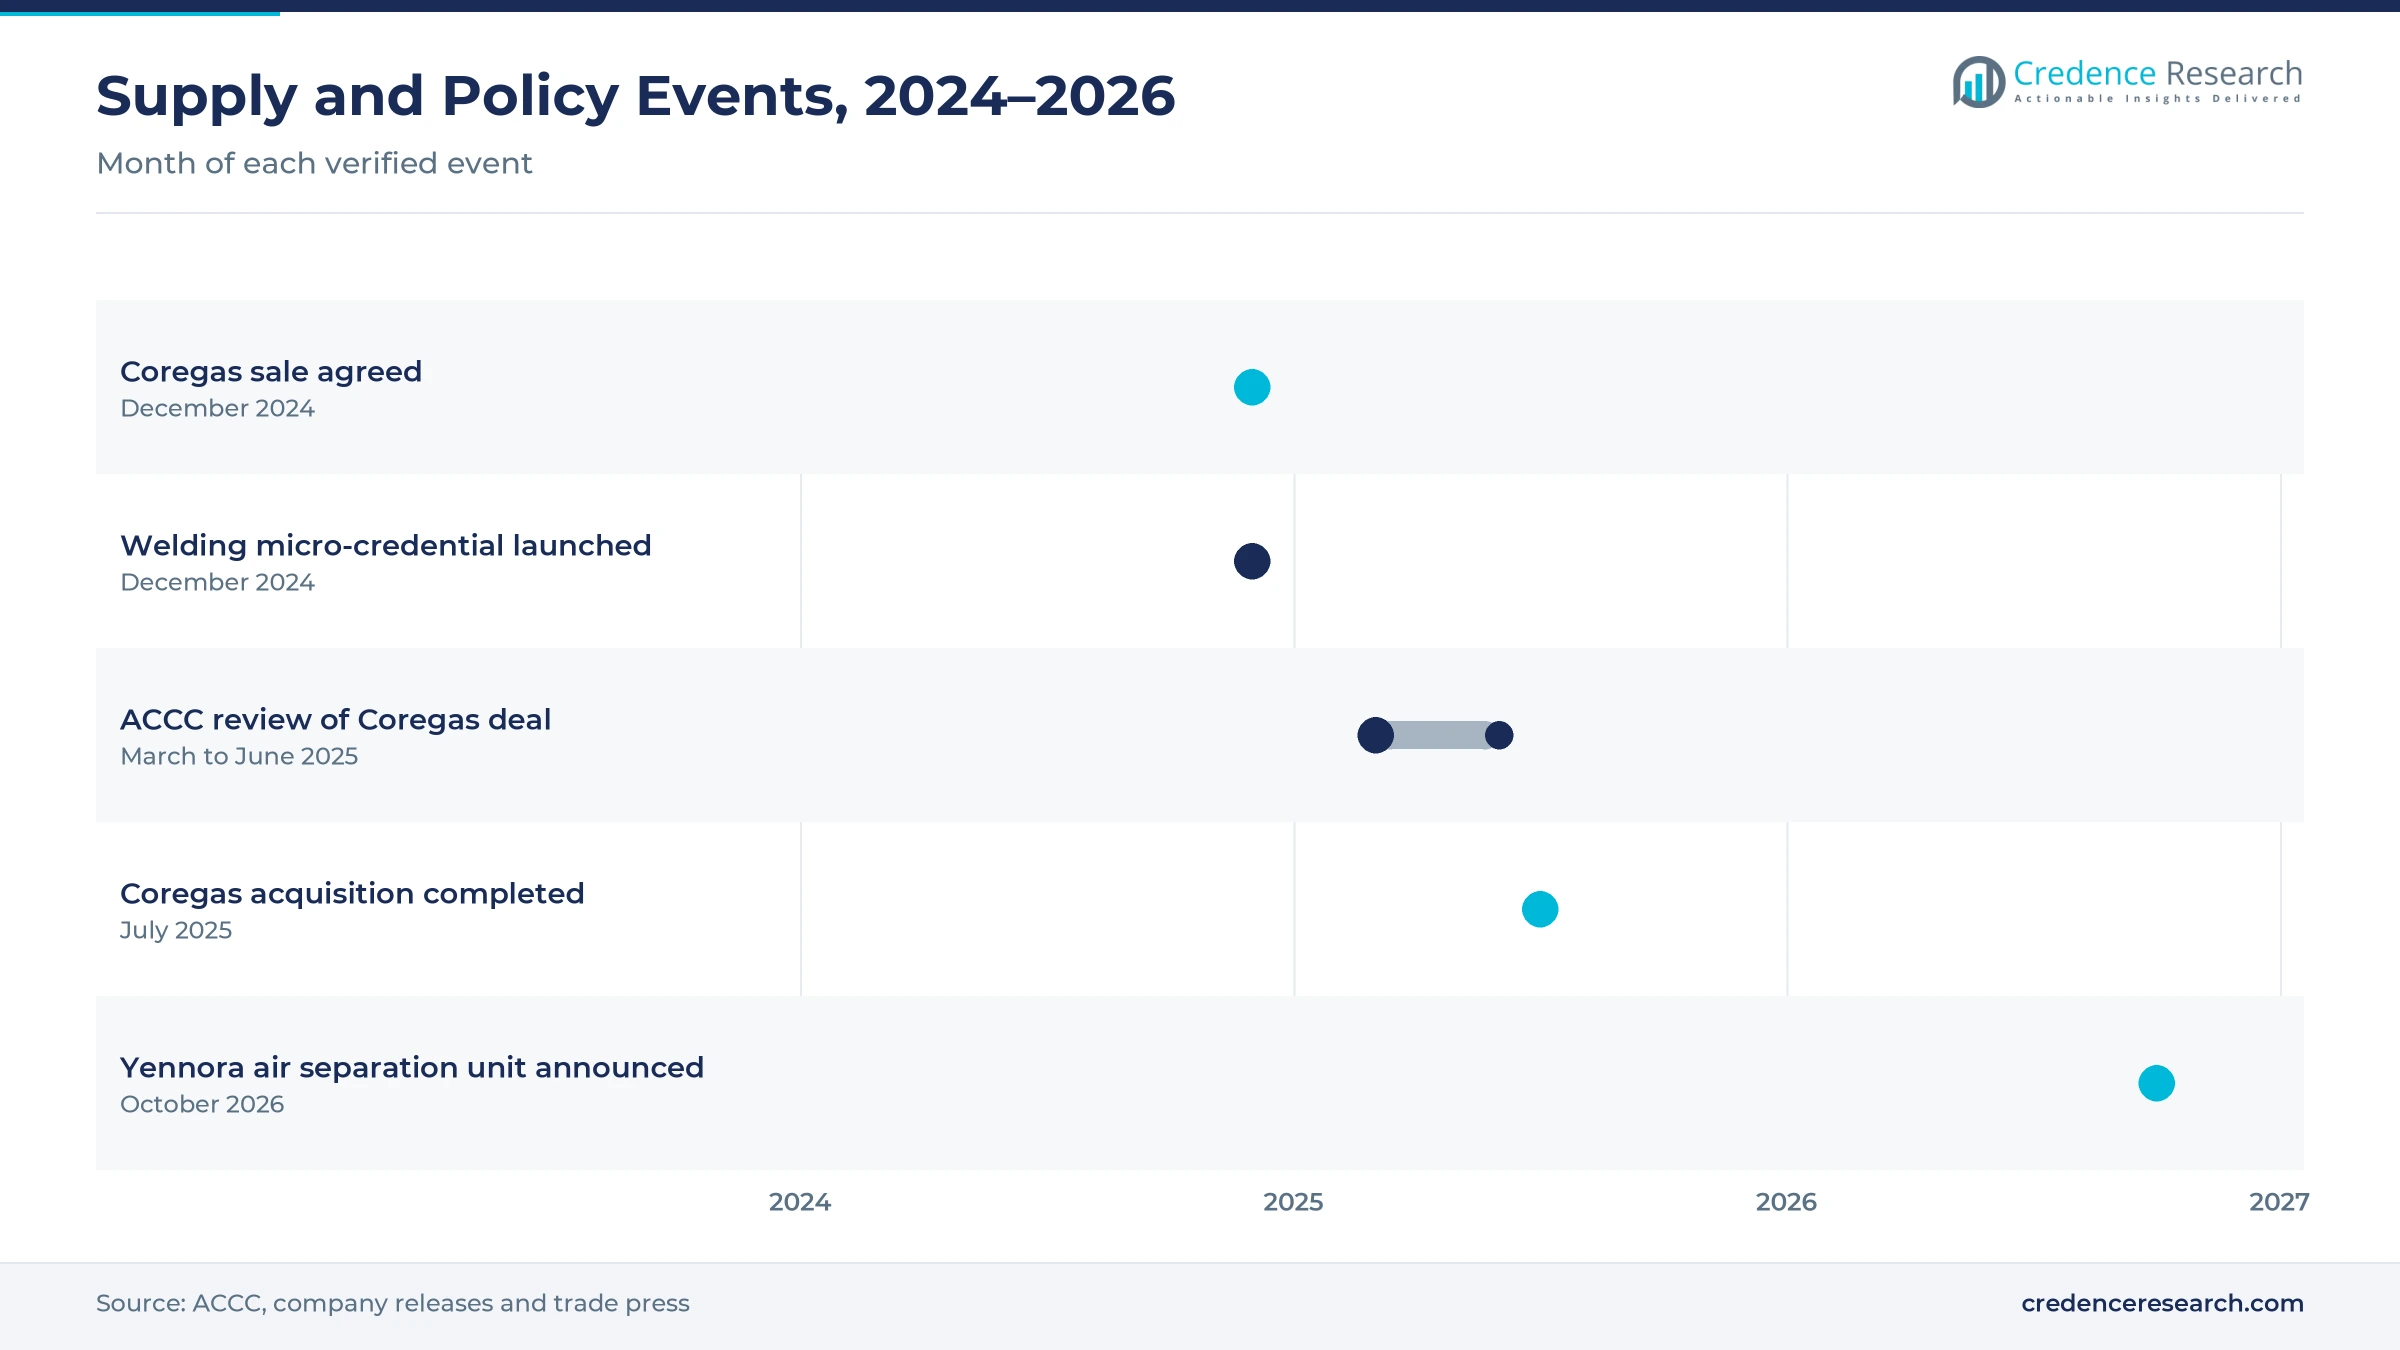
The shift toward consolidated cylinder supply is changing rivalry, because two of the larger suppliers now sit inside one corporate group. Nippon Sanso Holdings, the parent of Supagas, agreed in December 2024 to buy Coregas from Wesfarmers for A$770 million. The competition regulator began its review on March 12, 2025, and it listed argon among the cylinder gases where the parties overlap, according to the ACCC. The regulator said on June 24, 2025, that it would not oppose the deal, which was completed on July 1, 2025. However, Coregas said it would keep operating independently from Supagas, because the two serve different customer segments. As a result, direct supplier accounts keep a 55.0% share of 2025 value, as group buyers renegotiate contracts.
Why is the rise of retail cylinder access widening the buyer base?
The rise of retail cylinder access is widening the buyer base, because hobby welders and small workshops now buy argon through hardware stores as well as gas branches. Coregas sells its Trade N Go Gas argon 4.7 range through Bunnings, which brings industrial-grade shielding gas into a trade counter setting. A 10.6 cubic meter cylinder lasts about 15 to 21 hours at flow rates of 0.5 to 0.7 cubic meters an hour, according to the supplier, which suits intermittent workshop jobs. Weld Australia also launched a 12-week micro-credential that trains new welders to the ISO 9606 standard, which adds new users over time. In turn, trade counter and cylinder exchange grows at 2.93% a year, the fastest channel rate.
Can metal printing and inert processing open a new outlet?
Metal printing and controlled-atmosphere processing open a higher-value outlet, because both need inert gas that keeps oxygen away from hot metal. Coregas markets argon 5.0 for additive manufacturing and lists heat treatment, metallurgy, inerting and blanketing among the main uses of the gas. The same supplier offers on-site microbulk storage and cryogenic liquid tanks, which suit sites that move beyond cylinder packs as volumes rise. Australian research and development spending also stood at about 1.86% of GDP in 2021, according to World Bank data, which supports laboratory and pilot plant demand. As a result, controlled-atmosphere processing grows at 3.30% a year, the fastest application rate, as printing and heat treatment users adopt microbulk supply.
Is there room to grow through new plants near customers?
New air separation capacity near customers leaves room to grow, because shorter delivery routes lower the cost of supplying bulk and microbulk users. Air Liquide announced in October 2026 a new air separation unit at its Fairfield facility in Yennora, New South Wales, with operations expected to begin in 2028. BOC added a $15 million robotic cylinder automation system at its Wetherill Park site, which raises filling capacity for packaged gases. Private new capital expenditure in New South Wales also rose 26.6% over the year to the June 2026 quarter, which lifts fabrication and construction work. In turn, New South Wales keeps the largest regional share through the forecast, as supply investment clusters around Sydney and plastic welding equipment users expand.
Welder shortages and plant distance constrain suppliers
How does the welder shortage cap argon volumes?
A shortage of skilled welders caps argon volume growth, because each unfilled welding job removes a regular buyer of shielding gas. Weld Australia projected a shortfall of 70,000 welders by 2030, and larger firms absorb much of the available talent. As a result, small and medium-sized workshops struggle to keep jobs moving and buy less gas. Training providers respond with 12-week micro-credential courses that certify new welders to the ISO 9606 standard.
Why does plant distance raise delivered argon costs?
Plant distance raises delivered argon costs, because producers recover the gas by cryogenic distillation of ambient air at a small number of large sites. Coregas, for example, produces argon at its Port Kembla facility in New South Wales and had supplied Queensland customers from there. In turn, long transport routes add freight cost and emissions for distant buyers. Producers respond by building plants closer to demand, as Coregas did with its Darra unit in Brisbane.
How do handling and storage rules add cost for small users?
Handling and storage rules add cost for small users, because argon is denser than air and can displace oxygen near the ground in enclosed spaces. Liquid argon also carries cold-burn risks, while cylinders must be stored upright in cool, dry and well-ventilated areas. As a result, workshops must invest in ventilation, storage cages and staff training before they hold stock. Suppliers respond with handling guidance, safety data sheets and smaller cylinder options.
Why does supplier consolidation worry cylinder buyers?
Supplier consolidation worries cylinder buyers, because fewer independent groups now compete for rental and exchange accounts in several states. The regulator examined the supply of industrial gas cylinders to end customers across various states and territories during its 2025 review. However, it decided not to oppose the Coregas acquisition, so buyers rely on remaining rivals and distributors for choice. Large users respond by tendering contracts and comparing rental, delivery and exchange terms.
New South Wales leads while the west grows fastest
| Region | Value, 2025 (USD million) | Share, 2025 | CAGR, 2026–2035 |
|---|---|---|---|
| New South Wales | 35.4 | 34.9% | 2.36% |
| Victoria | 26.2 | 25.8% | 2.51% |
| Queensland | 21.6 | 21.3% | 2.71% |
| Western Australia and Remaining Jurisdictions | 18.3 | 18.0% | 2.91% |
Why does New South Wales hold the largest share?
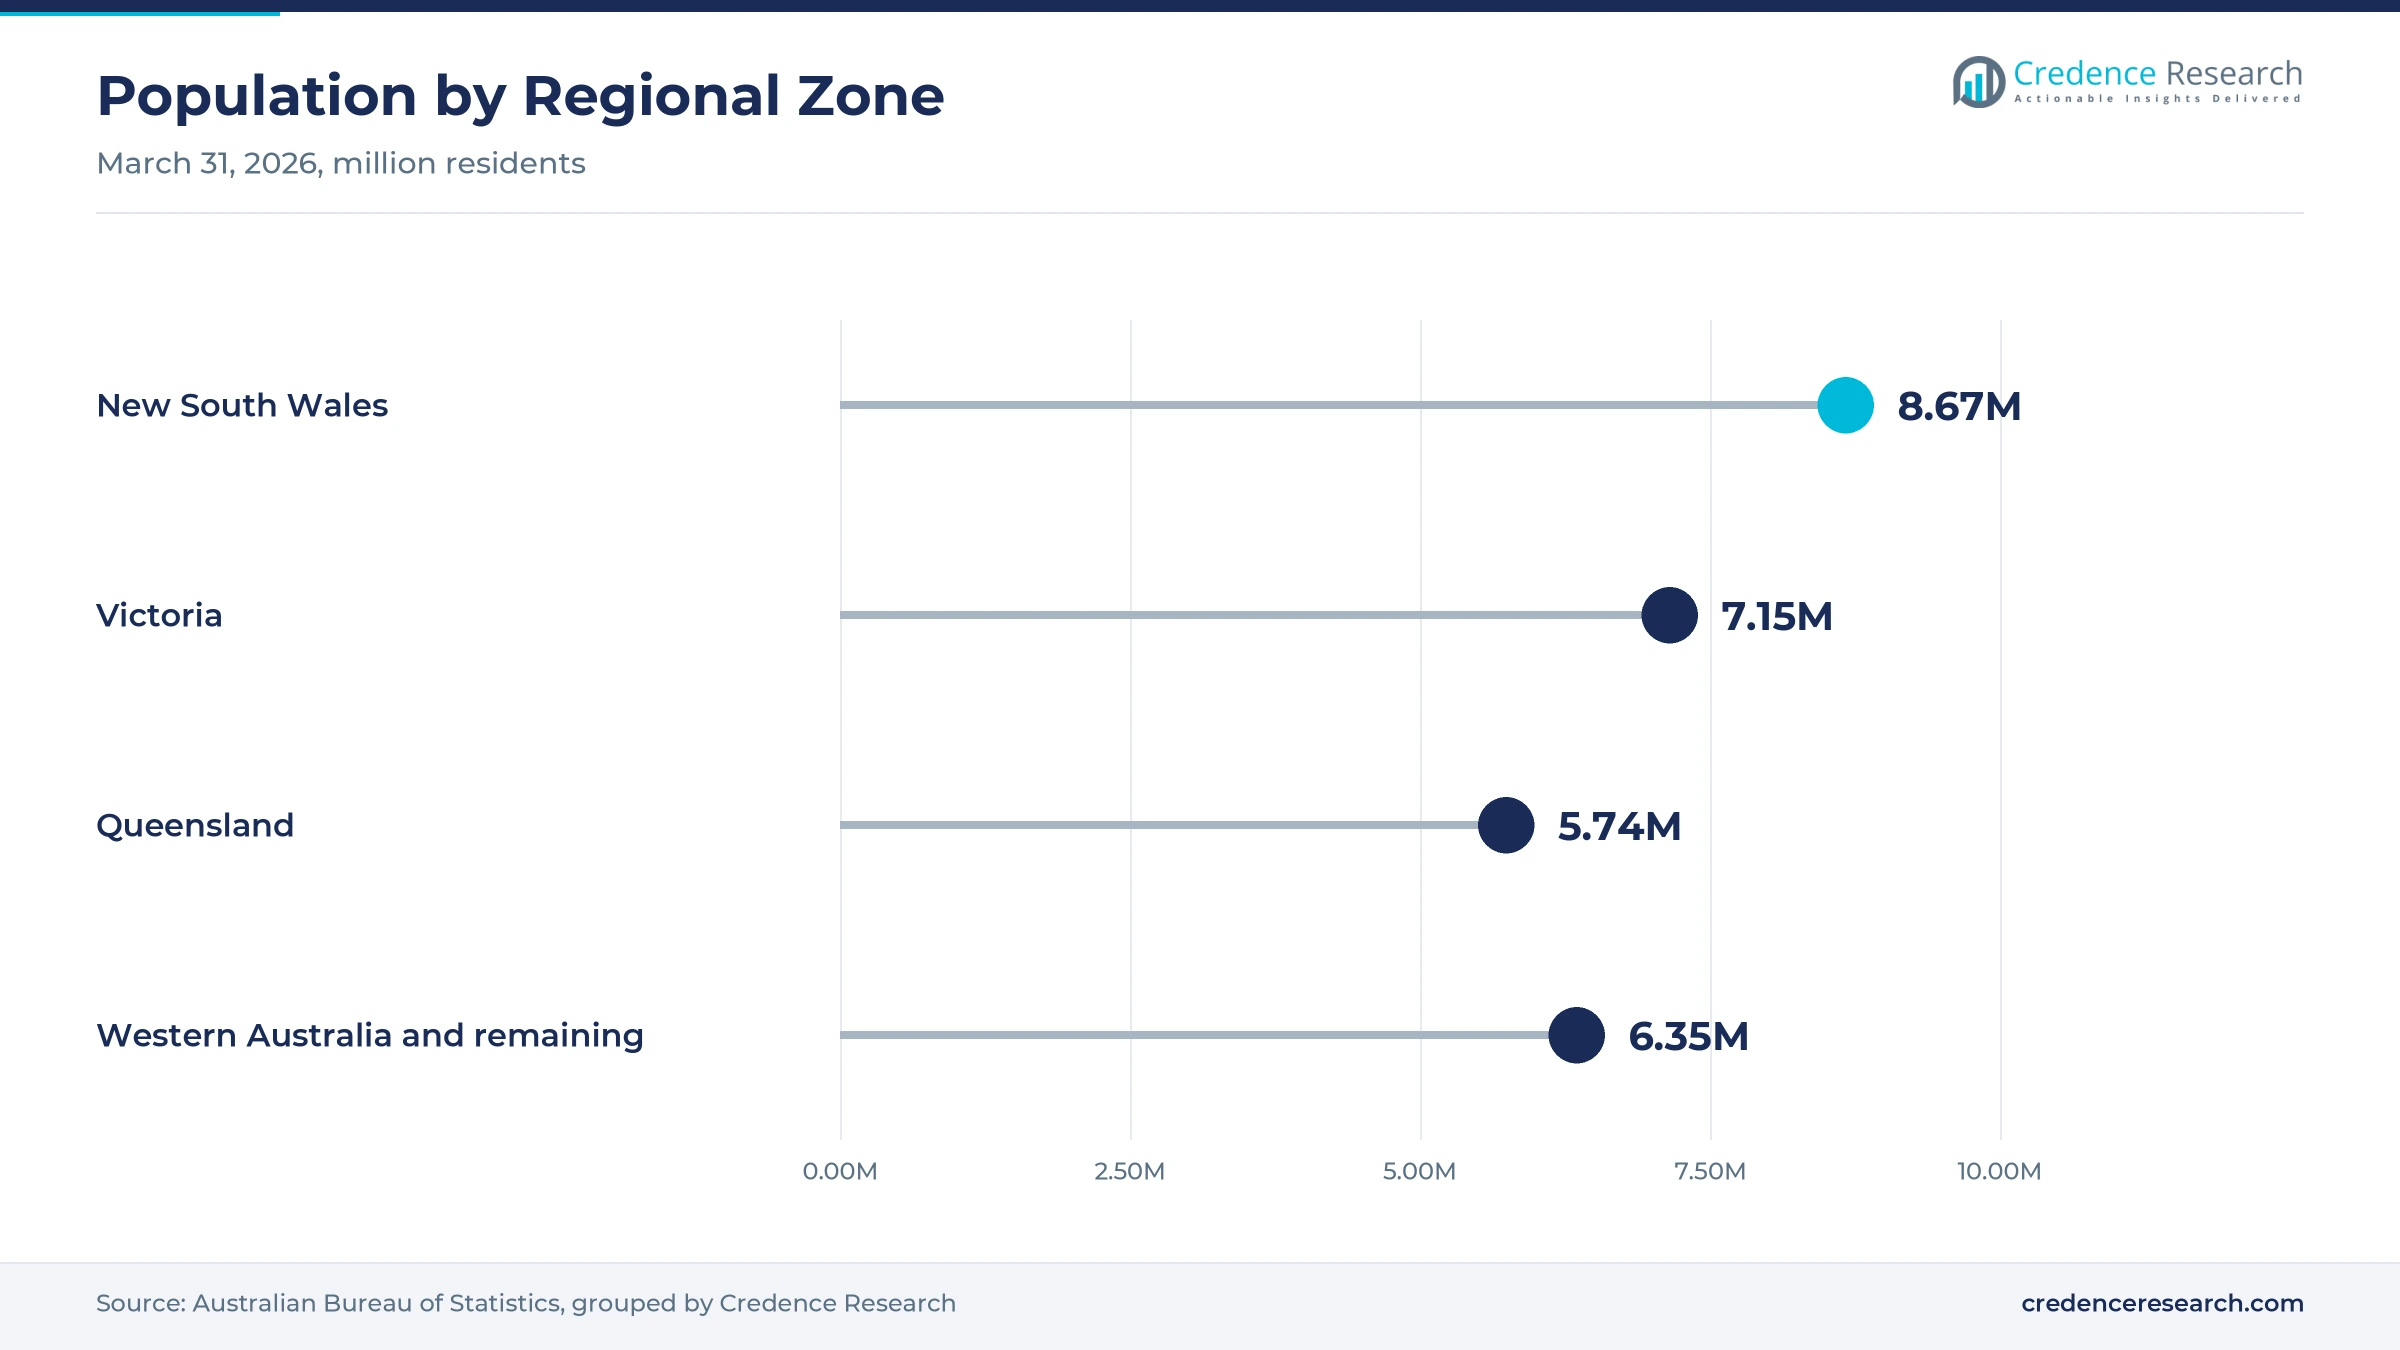
New South Wales held a 34.9% share of 2025 value and grows at 2.36% a year, because the state hosts argon production at Port Kembla and large specialty gas operations in western Sydney. Coregas produces argon at Port Kembla, while BOC runs its Sydney Operations Centre at Wetherill Park. The state had about 8.67 million residents at March 31, 2026. However, its population grew only 1.1% over the year, which is slower than Victoria, Queensland and Western Australia.
How does Victoria sustain cylinder and bulk demand?
Victoria held a 25.8% share of 2025 value and grows at 2.51% a year, because manufacturers, food processors and research users buy cylinder and bulk argon across Melbourne and regional centers. The state added about 109,500 residents in the year to March 2026, the largest increase of any state. However, private new capital expenditure in Victoria fell 13.9% in the June 2026 quarter, which slows new plant installations and keeps growth below the national rate.
Why is Queensland gaining from local production?
Queensland held a 21.3% share of 2025 value and grows at 2.71% a year, because a new air separation unit at Darra in Brisbane brings production closer to welding and mining customers. Coregas planned that $16 million unit for commissioning in mid-2025. The state also added about 90,100 residents in the year to March 2026, which lifts construction and fabrication work. As a result, local supply reduces the freight cost that had come with deliveries from New South Wales.
What makes the west and remaining states the fastest zone?
Western Australia and the remaining jurisdictions held 18.0% of 2025 value and grow fastest at 2.91% a year, because resource work and population growth lift welding activity. Western Australia had the fastest population growth at 2.1% in the year to March 2026. BOC runs a Karratha air separation unit that has operated since 2012, and South Australia is building the $9.9 billion Torrens to Darlington project.
Coregas deal and new plant plans marked 2024 to 2026
| Development | Status and market relevance |
|---|---|
| In December 2024, Nippon Sanso Holdings agreed to buy Coregas from Wesfarmers for A$770 million. | Brought Coregas into the group that owns Supagas |
| In December 2024, Weld Australia launched a 12-week welding micro-credential to address a projected shortfall of welders. | Aims to add certified welders who buy shielding gas |
| In June 2025, the ACCC decided not to oppose the Coregas acquisition after reviewing cylinder gas overlaps. | Cleared the deal, including overlaps in argon cylinders |
| In July 2025, Nippon Sanso Holdings completed the Coregas acquisition. | Coregas continues to operate independently from Supagas |
| In October 2026, Air Liquide announced a new air separation unit at Yennora, New South Wales. | Operations expected to begin in 2028 |
Air separation and cylinder automation shape supply
- Cryogenic air separation cools and distills ambient air to recover argon alongside oxygen and nitrogen, which sets the base supply for the whole market.
- Microbulk and liquid storage lets mid-sized users hold argon on site in tanks, which cuts cylinder handling and delivery visits.
- Robotic cylinder filling automates the filling and handling of packaged gases, which raises throughput at large fill plants such as Wetherill Park.
- High-purity grading separates laboratory argon at 99.999% from industrial argon at 99.997%, which supports pricing for analytical and printing users.
Need a Custom Version of This Report?
Tailor the scope, geography, or segments to your exact requirements.
- Custom geography or segment scope
- Direct access to our analyst team
Producers with air separation plants anchor competition
Competition centers on producers that own air separation plants and on the branch and distributor networks that carry cylinders to small users. BOC runs a Sydney Operations Centre at Wetherill Park with a specialty gases facility and robotic cylinder automation, and it operates plants at Kwinana and Karratha in Western Australia. Coregas produces argon at Port Kembla, added a Darra unit in Brisbane and sells retail cylinders through Bunnings. Coregas became part of Nippon Sanso Holdings in July 2025, the same group that owns Supagas, although the two businesses operate independently. Air Liquide Australia plans a new air separation unit at Yennora in New South Wales for 2028. Rivals compete on purity range, delivery reliability, cylinder rental terms, branch coverage and technical support for welding and laboratory users.
Companies profiled and their roles in this market
| Company | Type | Role in the market |
|---|---|---|
| BOC Limited | Producer | Runs Wetherill Park specialty gases site and Western Australian plants |
| Coregas | Producer | Produces argon at Port Kembla and runs a Darra unit in Brisbane |
| Supagas | Distributor | Sister company of Coregas within Nippon Sanso Holdings |
| Air Liquide Australia | Producer | Plans a new air separation unit at Yennora for 2028 |
Credence Research view on Australian argon supply
Credence Research's view is that Australian argon demand will grow steadily because welding and maintenance remain the core use while laboratory and printing users add higher-value volume. Bulk liquid keeps the largest share, while high-purity grades gain ground. New plants at Darra and Yennora improve supply reach, and the Coregas deal reshapes cylinder competition. However, welder shortages and freight costs will keep pressure on volumes and margins. Suppliers with local plants, wide branch networks and certified purity grades should gain share fastest.
Supplier releases and state data anchor the argon model
The report uses 2025 as the base year on a calendar basis, and market values come from the Credence Research model. That model combines competition regulator findings, supplier product information, company announcements on plant investment, resources export forecasts, capital expenditure statistics, population statistics and World Bank manufacturing and research data. Segment splits and regional growth rates are Credence Research estimates, while regional shares follow the client-defined split. Sources used are public reports, official statistics, trade press, government releases and company releases, and no interviews or surveys were used.
Steady fabrication use and lab grades carry demand to 2035
Argon sales are expected to reach USD 138.3 million by 2035, a 2.57% CAGR during 2026–2035, as welding work, laboratory testing and resource maintenance keep demand rising. Growth should hold steady through 2027 as the Darra unit serves Queensland and cylinder networks settle after the Coregas deal. After that, high-purity grades and controlled-atmosphere uses will carry more growth as welding matures. A long slowdown in fabrication would lower this outlook, while faster defense and infrastructure building would raise it.
Frequently Asked Questions
How big is the Australia argon gas market?
Which product type leads argon demand in Australia?
Which region leads the Australia argon gas market?
Why is welding the largest end use?
How did the Coregas acquisition affect argon supply?
Which sales channel grows fastest?
Who are the leading argon suppliers in Australia?
What are the main challenges for argon suppliers?
Table of Content
Chapter 1 Market Segmentation
- 1.1 Segmentation Framework
- 1.1.1 Product and Service Classification
- 1.1.2 Application and End-Use Classification
- 1.1.3 Technology and Solution Classification
- 1.1.4 Customer and Distribution Channel Classification
- 1.1.5 Geographic Segmentation
- 1.1.6 Market Segment Definitions and Boundaries
- 1.2 By Product Type
- 1.2.1 Bulk / Liquid Argon
- 1.2.2 Package / Cylinder Argon
- 1.2.3 High-Purity / Specialty Argon
- 1.3 By End-Use Industry
- 1.3.1 Metal Fabrication and Welding
- 1.3.2 Mining and Resources
- 1.3.3 Healthcare, Electronics and Research
- 1.3.4 Food, Energy and Process Manufacturing
- 1.4 By Application
- 1.4.1 Welding and Thermal Processing
- 1.4.2 Analytical Instrumentation
- 1.4.3 Controlled-Atmosphere Processing
- 1.4.4 Medical and Product Preservation
- 1.5 By Sales Channel
- 1.5.1 Direct Supplier Accounts
- 1.5.2 Specialist Gas Distributors
- 1.5.3 Trade Counter and Cylinder Exchange
Chapter 2 Introduction
- 2.1 Report Objectives and Scope
- 2.2 Product Definition and Industry Terminology
- 2.3 Market Inclusions and Exclusions
- 2.4 Research Process
- 2.4.1 Primary Research and Expert Interviews
- 2.4.2 Secondary Research and Source Review
- 2.4.3 Top-Down and Bottom-Up Estimation
- 2.4.4 Data Triangulation and Verification
- 2.5 Market Size Measurement Basis
- 2.5.1 2025: USD 101.5 million → 2035: USD 138.3 million
- 2.6 Historical and Forecast Reference Periods
- 2.6.1 Historical Period: 2018-2025
- 2.6.2 Base Year: 2025
- 2.6.3 Forecast Period: 2025-2035
- 2.7 Research Assumptions and Limitations
Chapter 3 Executive Summary
- 3.1 Market Snapshot and Key Findings
- 3.2 Base-Year Market Size, 2025
- 3.3 Forecast Market Size, 2035
- 3.4 Revenue and Volume Growth Outlook
- 3.5 Key Demand and Supply Indicators
- 3.6 Leading Market Segments
- 3.7 Fastest-Growing Market Opportunities
- 3.8 Regional Performance Highlights
- 3.9 Technology and Industry Transformation
- 3.10 Competitive Landscape Summary
- 3.11 Analyst View and Strategic Implications
Chapter 4 Australia Argon Gas Market Trends and Developments
- 4.1 Historical Industry Development, 2018-2025
- 4.2 Recent Market Trends and Developments
- 4.3 Demand and Customer Behavior Trends
- 4.4 Technology and Product Innovation
- 4.5 Artificial Intelligence, Automation and Digitalization
- 4.6 Local Manufacturing and Supply Chain Realignment
- 4.7 Industry Partnerships, Mergers and Acquisitions
- 4.8 Sustainability and Circular Economy Developments
- 4.9 Government and Private Sector Investment Trends
- 4.10 Emerging Business Models and Commercialization
- 4.11 Industry Developments and Announcements
Chapter 5 Australia Argon Gas Market Production, Supply and Demand Analysis
- 5.1 Demand Trend and Consumption Analysis, 2018-2025
- 5.2 Demand Forecast, 2025-2035
- 5.3 Production and Output Trend, 2018-2025
- 5.4 Production and Output Forecast, 2025-2035
- 5.5 Installed Capacity and Capacity Utilization
- 5.6 Company-Wise Production Plants and Statistics
- 5.6.1 Installed Production Capacity
- 5.6.2 Actual Production
- 5.6.3 Planned Capacity and Expansion Targets
- 5.7 Supply Chain Structure and Procurement Trends
- 5.8 Supply-Demand Gap and Bottlenecks
- 5.9 Import Dependence and Sourcing Structure
- 5.10 Contract Manufacturing and Outsourcing
- 5.11 Regional Supply and Demand Concentration
Chapter 6 Australia Argon Gas Market Pricing Analysis
- 6.1 Pricing Structure and Measurement
- 6.2 Historical Pricing Trends, 2018-2025
- 6.3 Pricing Outlook, 2025-2035
- 6.4 Average Selling Price and Unit Economics
- 6.5 Pricing by Product and Market Segment
- 6.6 Geographic Pricing Differences
- 6.7 Key Input, Energy, Labor and Logistics Costs
- 6.8 Contract Pricing and Purchasing Models
- 6.9 Pricing Sensitivity and Competitive Positioning
- 6.10 Price, Margin and Profitability Implications
Chapter 7 Australia Argon Gas Market Dynamics
- 7.1 Market Growth Drivers
- 7.1.1 Demand-Side Drivers
- 7.1.2 Technology and Innovation Drivers
- 7.1.3 Infrastructure and Investment Drivers
- 7.1.4 Regulatory and Policy Drivers
- 7.2 Market Restraints
- 7.2.1 Cost and Affordability Constraints
- 7.2.2 Technology and Adoption Barriers
- 7.2.3 Supply Chain and Operational Constraints
- 7.3 Market Challenges
- 7.3.1 Competitive Pressure and Margin Erosion
- 7.3.2 Skills, Infrastructure and Implementation Gaps
- 7.4 Emerging Market Opportunities
- 7.5 Market Dynamics Impact and Time-Horizon Assessment
Chapter 8 Australia Argon Gas Value Chain Analysis
- 8.1 Industry Value Chain Overview
- 8.2 Upstream Suppliers and Critical Inputs
- 8.3 Technology and Component Providers
- 8.4 Manufacturing or Service Delivery
- 8.5 Distribution, Channel Partners and Integrators
- 8.6 Downstream Applications and End Users
- 8.7 Value Addition and Profit Pools
- 8.8 Vertical Integration and Outsourcing
- 8.9 Supplier Concentration and Risk
- 8.10 Supply Chain Localization and Resilience
Chapter 9 Australia Argon Gas Market Regulations and Policies
- 9.1 Relevant Laws, Standards and Compliance Frameworks
- 9.2 Product, Service, Safety and Quality Requirements
- 9.3 Government Policies, Incentives and Subsidies
- 9.4 Imports, Exports and Trade Barriers
- 9.5 Public Procurement and Local Content Requirements
- 9.6 Environmental and Sustainability Compliance
- 9.7 Upcoming Policy Changes and Market Implications
Chapter 10 Australia Argon Gas Market Hotspots and Opportunities
- 10.1 Market Opportunity Mapping and Growth Hotspots
- 10.2 High-Growth Applications and Customer Groups
- 10.3 Underserved Markets and White-Space Opportunities
- 10.4 Emerging Technology and Product Opportunities
- 10.5 New Capacity and Investment Hotspots
- 10.6 Market Entry and Expansion Opportunities
- 10.7 Distribution and Partnership Opportunities
- 10.8 Near-Term and Long-Term Commercial Potential
- 10.9 Opportunity Attractiveness and Execution Risks
Chapter 11 Australia Argon Gas Market Outlook, 2025-2035
- 11.1 Market Size and Analysis
- 11.1.1 Revenue (Market Measurement: 2025: USD 101.5 million → 2035: USD 138.3 million)
- 11.1.2 Market Volume and Quantity Sold
- 11.1.3 Historical Market Size, 2018-2025
- 11.1.4 Base-Year Market Size, 2025
- 11.2 Market Forecast, 2025-2035
- 11.2.1 Revenue Forecast to 2035
- 11.2.2 Volume Forecast to 2035
- 11.2.3 CAGR and Year-on-Year Growth
- 11.2.4 Incremental Revenue Opportunity
- 11.3 Forecast Assumptions and Scenario Analysis
- 11.3.1 Base-Case Forecast
- 11.3.2 Optimistic and Conservative Scenarios
- 11.3.3 Technology, Pricing and Policy Sensitivities
- 11.4 Market Attractiveness and Growth Outlook
Chapter 12 Australia Argon Gas Market Segmentation and Outlook
- 12.1 Segmentation Summary and Market Shares, 2025
- 12.2 Largest and Fastest-Growing Segments
- 12.3 By Product Type - Market Size and Forecast, 2025-2035
- 12.3.1 Segment Definition and Scope
- 12.3.2 Historical Market Size, 2018-2025
- 12.3.3 Revenue Forecast, 2025-2035
- 12.3.4 Volume Forecast, 2025-2035
- 12.3.5 Base-Year Market Share, 2025
- 12.3.6 Segment CAGR and Growth Drivers
- 12.3.7 Subsegment Market Size and Forecast
- 12.3.7.1 Bulk / Liquid Argon
- 12.3.7.2 Package / Cylinder Argon
- 12.3.7.3 High-Purity / Specialty Argon
- 12.3.8 Subsegment Pricing and Adoption Trends
- 12.3.9 Leading Suppliers and Competition
- 12.3.10 Regional Demand and Opportunities
- 12.4 By End-Use Industry - Market Size and Forecast, 2025-2035
- 12.4.1 Segment Definition and Scope
- 12.4.2 Historical Market Size, 2018-2025
- 12.4.3 Revenue Forecast, 2025-2035
- 12.4.4 Volume Forecast, 2025-2035
- 12.4.5 Base-Year Market Share, 2025
- 12.4.6 Segment CAGR and Growth Drivers
- 12.4.7 Subsegment Market Size and Forecast
- 12.4.7.1 Metal Fabrication and Welding
- 12.4.7.2 Mining and Resources
- 12.4.7.3 Healthcare, Electronics and Research
- 12.4.7.4 Food, Energy and Process Manufacturing
- 12.4.8 Subsegment Pricing and Adoption Trends
- 12.4.9 Leading Suppliers and Competition
- 12.4.10 Regional Demand and Opportunities
- 12.5 By Application - Market Size and Forecast, 2025-2035
- 12.5.1 Segment Definition and Scope
- 12.5.2 Historical Market Size, 2018-2025
- 12.5.3 Revenue Forecast, 2025-2035
- 12.5.4 Volume Forecast, 2025-2035
- 12.5.5 Base-Year Market Share, 2025
- 12.5.6 Segment CAGR and Growth Drivers
- 12.5.7 Subsegment Market Size and Forecast
- 12.5.7.1 Welding and Thermal Processing
- 12.5.7.2 Analytical Instrumentation
- 12.5.7.3 Controlled-Atmosphere Processing
- 12.5.7.4 Medical and Product Preservation
- 12.5.8 Subsegment Pricing and Adoption Trends
- 12.5.9 Leading Suppliers and Competition
- 12.5.10 Regional Demand and Opportunities
- 12.6 By Sales Channel - Market Size and Forecast, 2025-2035
- 12.6.1 Segment Definition and Scope
- 12.6.2 Historical Market Size, 2018-2025
- 12.6.3 Revenue Forecast, 2025-2035
- 12.6.4 Volume Forecast, 2025-2035
- 12.6.5 Base-Year Market Share, 2025
- 12.6.6 Segment CAGR and Growth Drivers
- 12.6.7 Subsegment Market Size and Forecast
- 12.6.7.1 Direct Supplier Accounts
- 12.6.7.2 Specialist Gas Distributors
- 12.6.7.3 Trade Counter and Cylinder Exchange
- 12.6.8 Subsegment Pricing and Adoption Trends
- 12.6.9 Leading Suppliers and Competition
- 12.6.10 Regional Demand and Opportunities
- 12.7 Segment Growth Comparison
- 12.8 Segment Attractiveness and Priority Matrix
Chapter 13 Australia Argon Gas End-Use and Application Market Outlook
- 13.1 End-Use Industry and Customer Demand Structure
- 13.2 Leading Applications and Customer Groups
- 13.3 End-Use Market Size, Share and Forecast
- 13.4 Major End-Use Industry Deep Dives
- 13.4.1 Customer Requirements and Use Cases
- 13.4.2 Demand and Replacement Cycles
- 13.4.3 Technical and Regulatory Considerations
- 13.4.4 Purchasing and Procurement Models
- 13.4.5 Leading Vendors and Distribution Channels
- 13.4.6 Forecast and Commercial Opportunities
- 13.5 Emerging Applications and Cross-Segment Demand
- 13.6 End-Use Industry Investment Priorities
Chapter 14 Australia Argon Gas Geographic Market Outlook, 2025-2035
- 14.1 Domestic Market Distribution and Demand Clusters
- 14.2 State- or Province-Wise Market Size and Forecast, 2025-2035
- 14.3 City and Metropolitan Market Outlook
- 14.4 Industrial, Manufacturing and Commercial Clusters
- 14.5 Geographic Concentration of Key End Users
- 14.6 Local Pricing and Purchasing Differences
- 14.7 Domestic Production Facilities and Capacity Map
- 14.8 Local Infrastructure and Project Pipeline
- 14.9 State-Level Policy and Incentive Differences
- 14.10 Subnational Investment Hotspots and Opportunities
- 14.11 Distribution and Logistics Networks
- 14.12 Domestic Competitive Footprint
Chapter 15 Australia Argon Gas Technology, Innovation and Sustainability Outlook
- 15.1 Technology Landscape and Maturity
- 15.2 Product, Process and Service Innovation
- 15.3 AI, Automation and Digital Tools in the Industry
- 15.4 Technology Adoption and Performance Benchmarking
- 15.5 Innovation Pipeline and R&D Investment
- 15.6 Patent and Intellectual Property Trends
- 15.7 Energy Efficiency and Resource Management
- 15.8 Sustainability, Recycling and Circularity
- 15.9 Technology Roadmap, 2025-2035
- 15.10 Risks of Obsolescence and Technology Substitution
Chapter 16 Australia Argon Gas Market Key Strategic Imperatives
- 16.1 Growth and Market Entry Priorities
- 16.2 High-Return Products and Segments
- 16.3 Pricing, Profitability and Cost Optimization
- 16.4 Technology Investment and Product Differentiation
- 16.5 Supply Chain Localization and Resilience
- 16.6 Distribution and Customer Acquisition
- 16.7 Partnership, Acquisition and Capacity Strategy
- 16.8 Regional Expansion Priorities
- 16.9 Short-, Medium- and Long-Term Actions
Chapter 17 Competition Outlook
- 17.1 Industry Competition Characteristics
- 17.2 Market Structure and Concentration
- 17.3 Market Share and Competitive Positioning, 2025
- 17.4 Company-Wise Revenue and Product Benchmarking
- 17.5 Production and Service Capacity Benchmarking
- 17.6 Technology, Pricing and Differentiation
- 17.7 Regional Footprint and Distribution Strength
- 17.8 Mergers, Acquisitions and Strategic Alliances
- 17.9 New Entrants and Competitive Threats
- 17.10 Porter's Five Forces and Industry Attractiveness
- 17.11 Competitive Outlook, 2025-2035
Chapter 18 Company Profiles
- 18.1 Company Coverage and Selection Criteria
- 18.2 BOC Limited
- 18.2.1 Business Description
- 18.2.2 Company Ownership and Geographic Presence
- 18.2.3 Product and Service Portfolio
- 18.2.4 Manufacturing and Operating Footprint
- 18.2.5 Production Capacity and Expansion Plans
- 18.2.6 Financial Performance and Investment
- 18.2.7 Market Share and Competitive Position
- 18.2.8 Technology and Innovation Capabilities
- 18.2.9 Strategic Alliances or Partnerships
- 18.2.10 Recent Developments
- 18.2.11 Growth Strategy and Outlook
- 18.3 Air Liquide Australia
- 18.4 Supagas
- 18.5 Coregas
- 18.6 Speed Gas
- 18.7 Scientific Gas Australia
- 18.8 Argon Xpress
- 18.9 Bigweld Australia (KGAS)
- 18.10 Gentronics
- 18.11 CAC Gas & Instrumentation
- 18.12 Other Relevant Market Participants
Note: Every listed company is profiled on the structure shown under the first company. The company list is preliminary and may change based on research findings, market developments, data availability and client requirements.
Chapter 19 Disclaimer
- 19.1 Research and Forecast Disclaimer
- 19.2 Data Source and Estimation Limitations
Note: The depth of individual sections depends on data availability for this market. Volume, capacity, trade and other unit-based metrics are included where applicable.

