
Skin care and food makers keep moisture control in demand
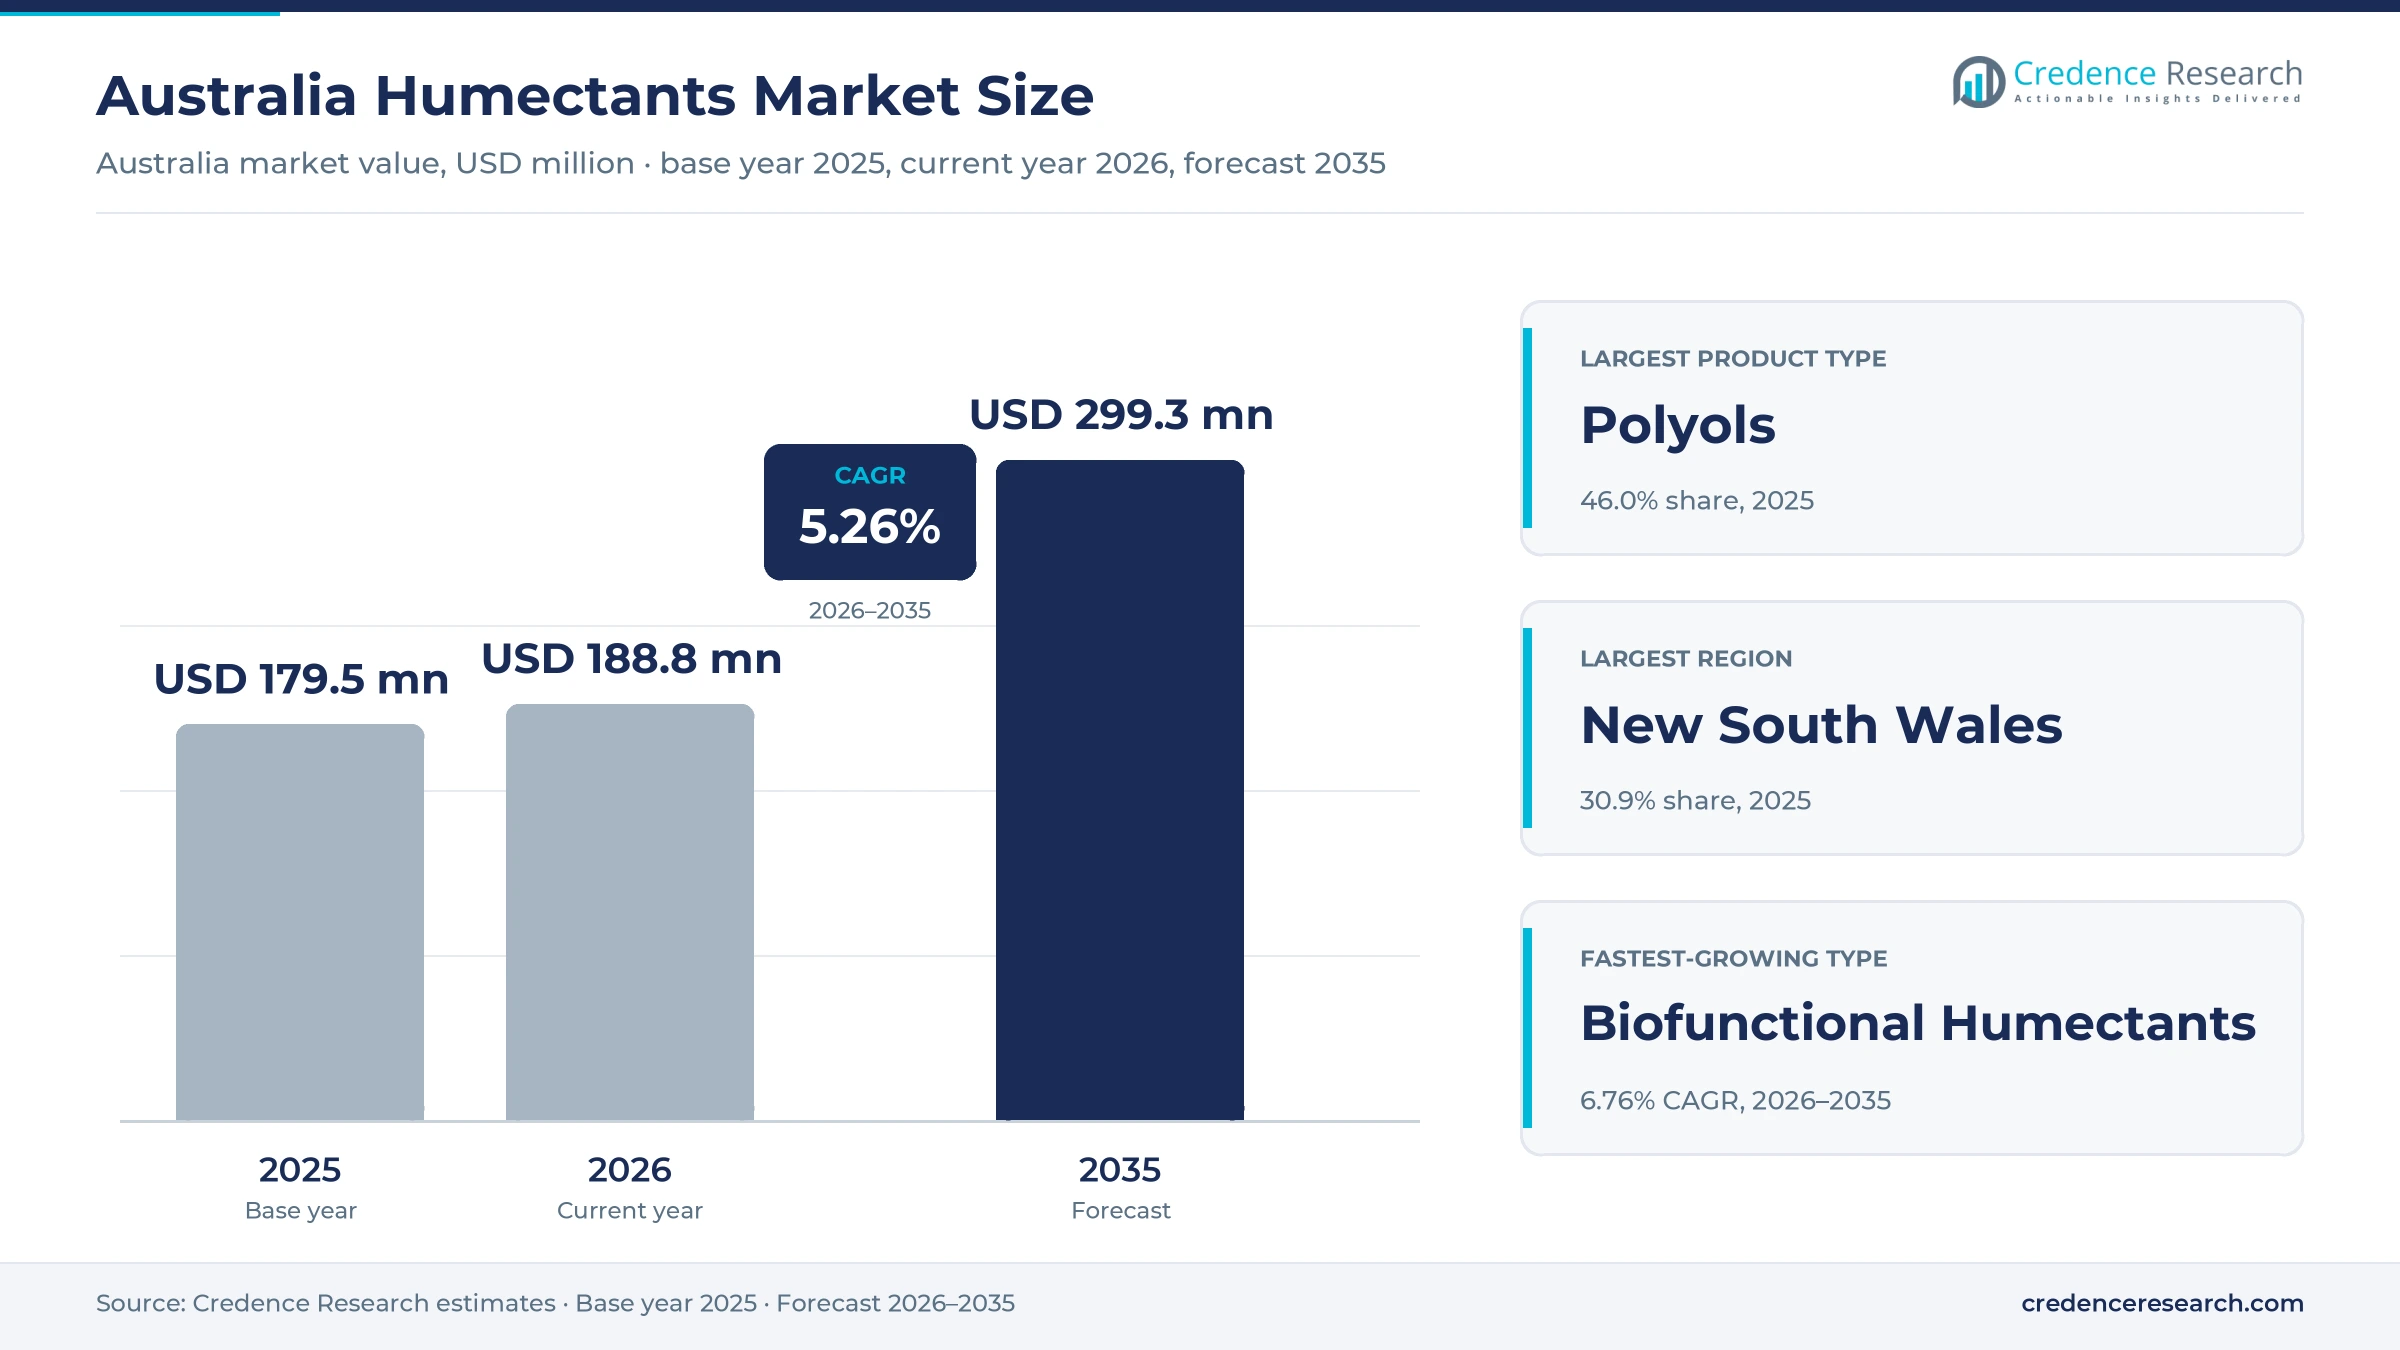
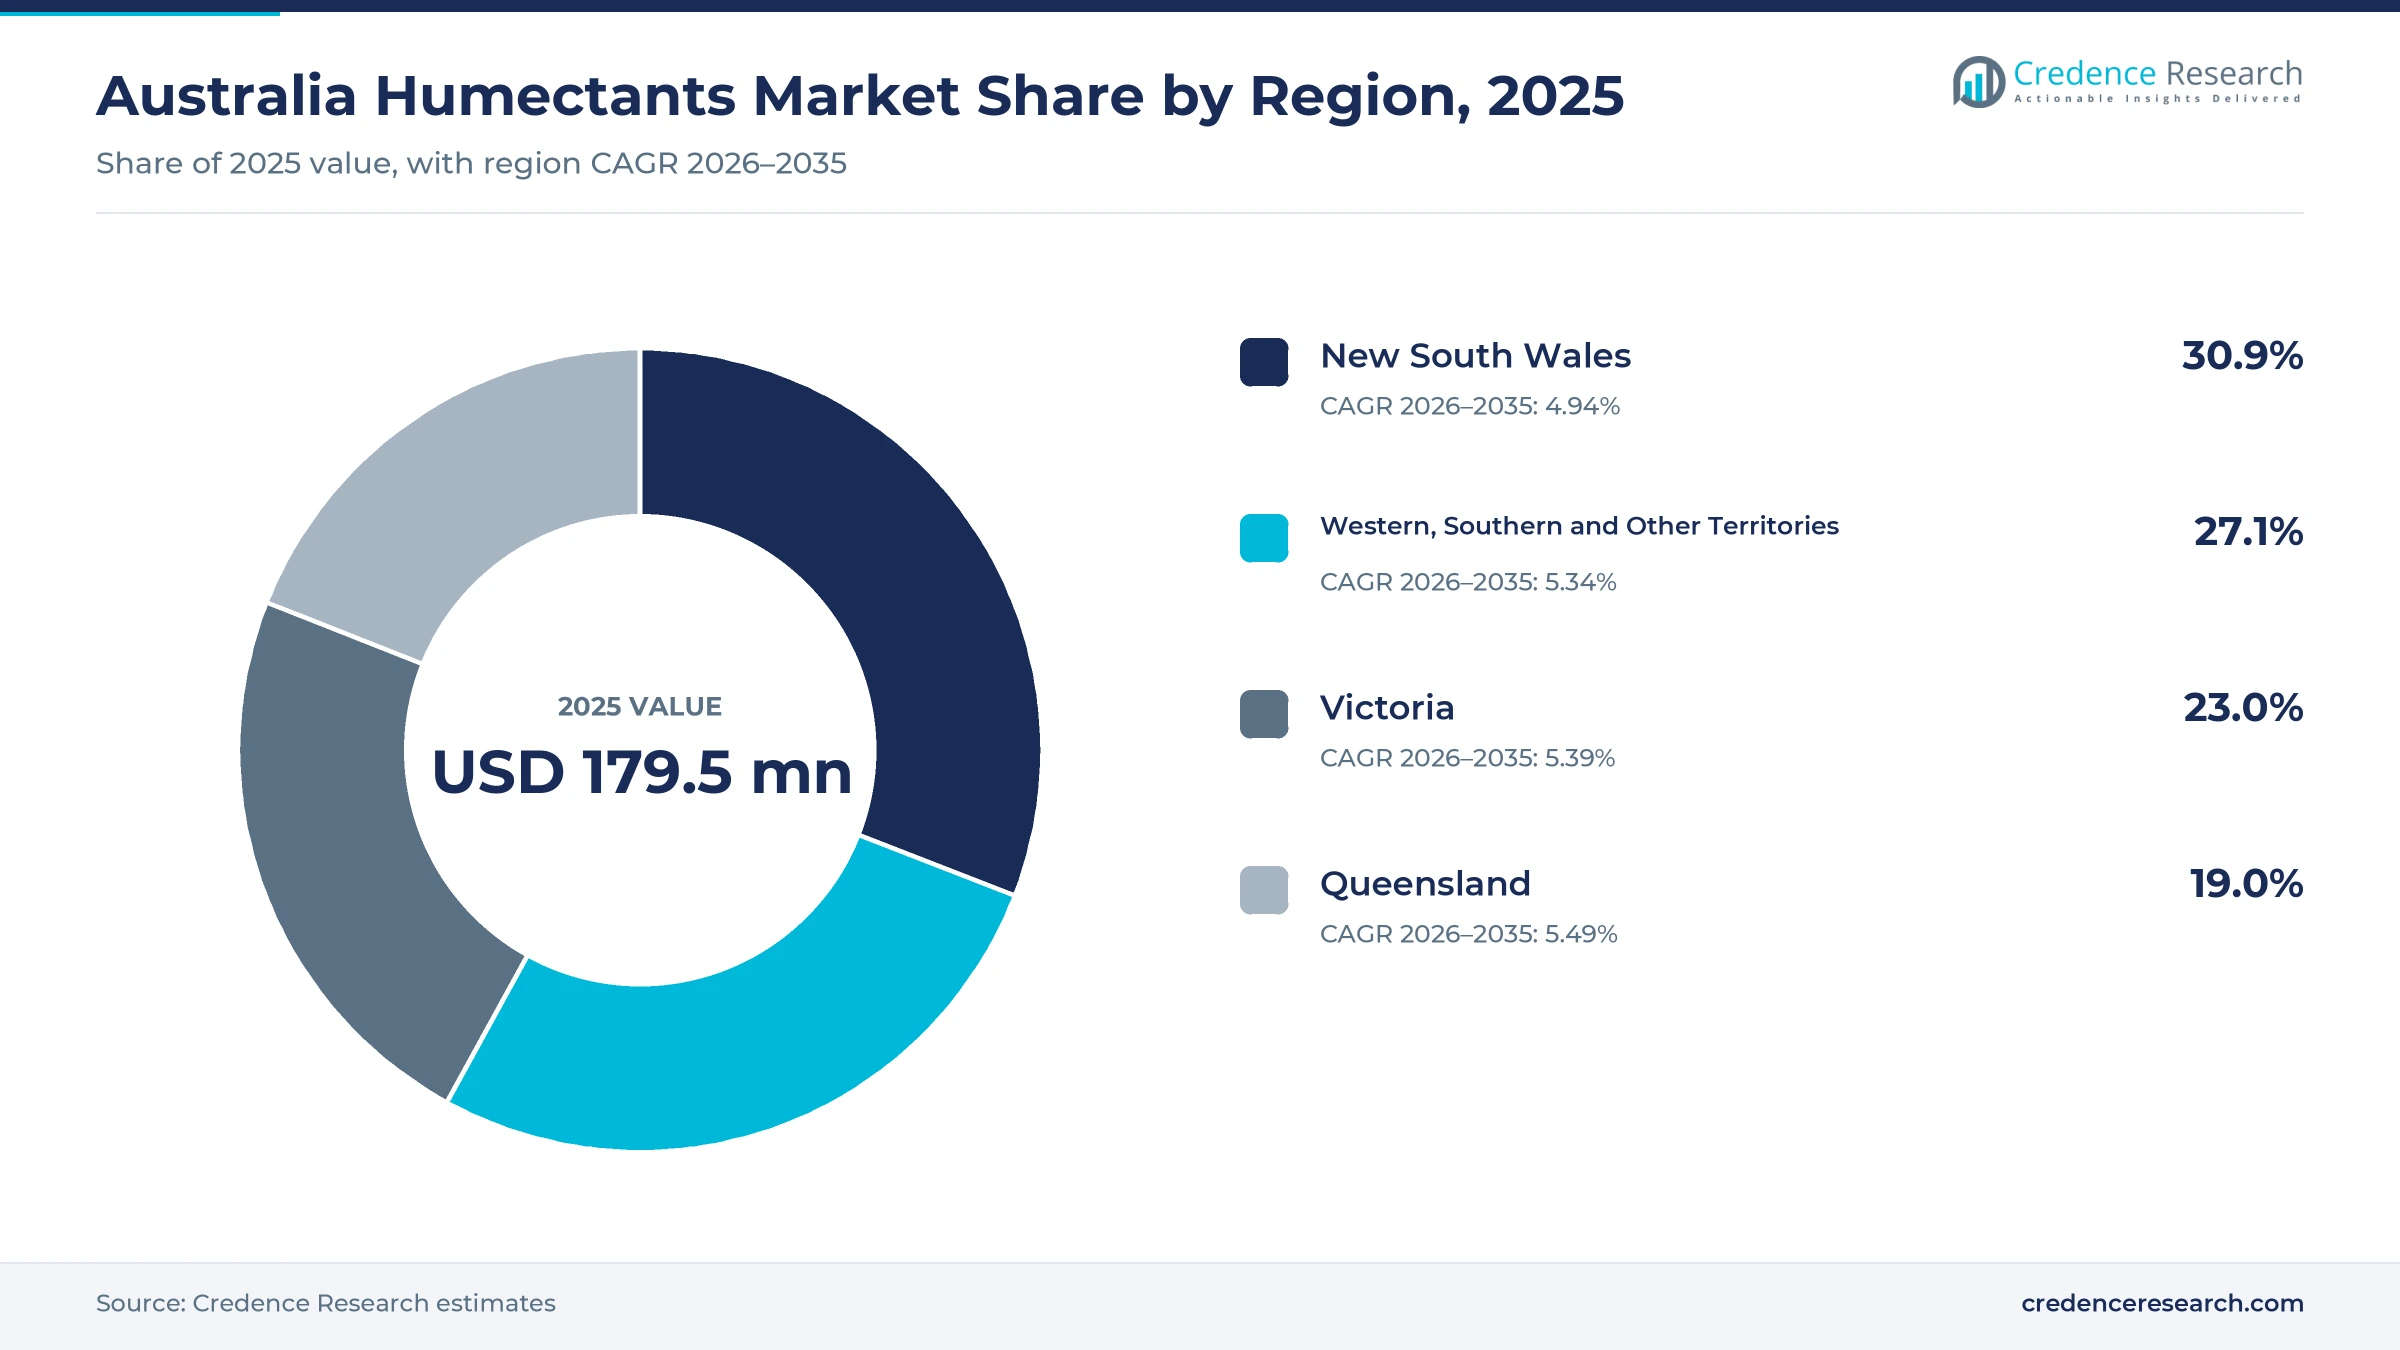
The Australia humectants market was valued at USD 179.5 million in 2025 and is projected to increase from USD 188.8 million in 2026 to USD 299.3 million by 2035, registering a CAGR of 5.26% during 2026–2035. Demand comes from skin care, hair care, bakery, confectionery, oral care and medicine makers that need ingredients to hold water in finished products. New South Wales held the largest regional share, 30.9% in 2025, because Sydney concentrates formulators, contract manufacturers and ingredient distributor offices. Queensland is the fastest-growing region at 5.49% a year, as population growth lifts local food and personal care output. National food standards define these additives as substances that retard moisture loss from food, which keeps glycerol and sorbitol in steady use across packaged foods. In turn, specialty distributors have widened local portfolios, and BASF moved its personal care range to Alchemy Agencies from May 1, 2025.
Which moisture-holding ingredients are counted in Australia?
The estimate measures spending in Australia on polyols such as glycerol and sorbitol, glycol-based grades such as propylene glycol, specialty hydration ingredients and biofunctional grades made by fermentation or extraction. It covers purchases by personal care, food and beverage, pharmaceutical and animal nutrition manufacturers through technical distributors, direct supply contracts and online small-lot stores. Values are stated in USD million at current prices and exclude goods and services tax.
The estimate excludes finished consumer products, ingredients that are re-exported without local processing and grades used only as industrial solvents or antifreeze. The value chain runs from refiners, chemical converters and fermentation producers through importers and technical distributors to formulators, contract manufacturers and brand owners across the country.
Australia Humectants Market Insights
- The Australia humectants market was valued at USD 179.5 million in 2025 and is projected to reach USD 299.3 million by 2035, at a 5.26% CAGR during 2026–2035.
- New South Wales held 30.9% of 2025 value, because Sydney concentrates formulators, contract manufacturers and ingredient distributor offices.
- Polyols led product types with 46.0% of 2025 value, since glycerol and sorbitol serve skin care, oral care, bakery and confectionery recipes.
- BASF appointed Alchemy Agencies as exclusive distributor of its personal care portfolio in Australia and New Zealand from May 1, 2025.
- Biofunctional humectants grow fastest at 6.76% a year during 2026–2035, as Australian skin care brands seek fermentation-derived ingredients that support premium hydration claims.
Polyols lead while biofunctional grades grow fastest
Why do polyols lead moisture-control spending?
Based on product type, the market is categorized into polyols, glycol-based humectants, specialty hydration ingredients and biofunctional humectants. Polyols led with 46.0% of 2025 value, because glycerol and sorbitol are low-cost, familiar and approved across skin care, toothpaste, bakery and confectionery. Biofunctional Humectants grow fastest at 6.76% a year, as brands seek fermentation-derived ingredients that support premium hydration claims.
Which industries buy the most moisture-control grades?
Based on end-use industry, the market is categorized into personal care and cosmetics, food and beverage, pharmaceuticals and animal nutrition. Personal Care & Cosmetics led with 41.0% of 2025 value, because creams, serums, shampoos and toothpaste use high loadings of water-binding ingredients. Personal Care & Cosmetics also grows fastest at 5.59% a year, as local brands launch more hydration-focused skin care ranges.
How do buyers source moisture-control ingredients?
Based on sales channel, the market is categorized into technical distributor sales, direct manufacturer procurement and digital small-lot sales. Technical Distributor Sales led with 56.0% of 2025 value, because most formulators need local stock, documents and application support. Digital Small-Lot Sales grows fastest at 6.66% a year, as independent brands and small makers order glycerine and propylene glycol online.
| Segment Group | Leading Sub-segment | Share, 2025 | Fastest-growing Sub-segment | CAGR, 2026–2035 |
|---|---|---|---|---|
| By Product Type | Polyols | 46.0% | Biofunctional Humectants | 6.76% |
| By End-Use Industry | Personal Care & Cosmetics | 41.0% | Personal Care & Cosmetics | 5.59% |
| By Sales Channel | Technical Distributor Sales | 56.0% | Digital Small-Lot Sales | 6.66% |
Request a Free Sample
Fill in your details and we'll send you a free sample report.
- Sample data tables & charts
- Research methodology
Hydration claims, food rules and distributors lift demand
How does hydration-led formulation lift ingredient demand?
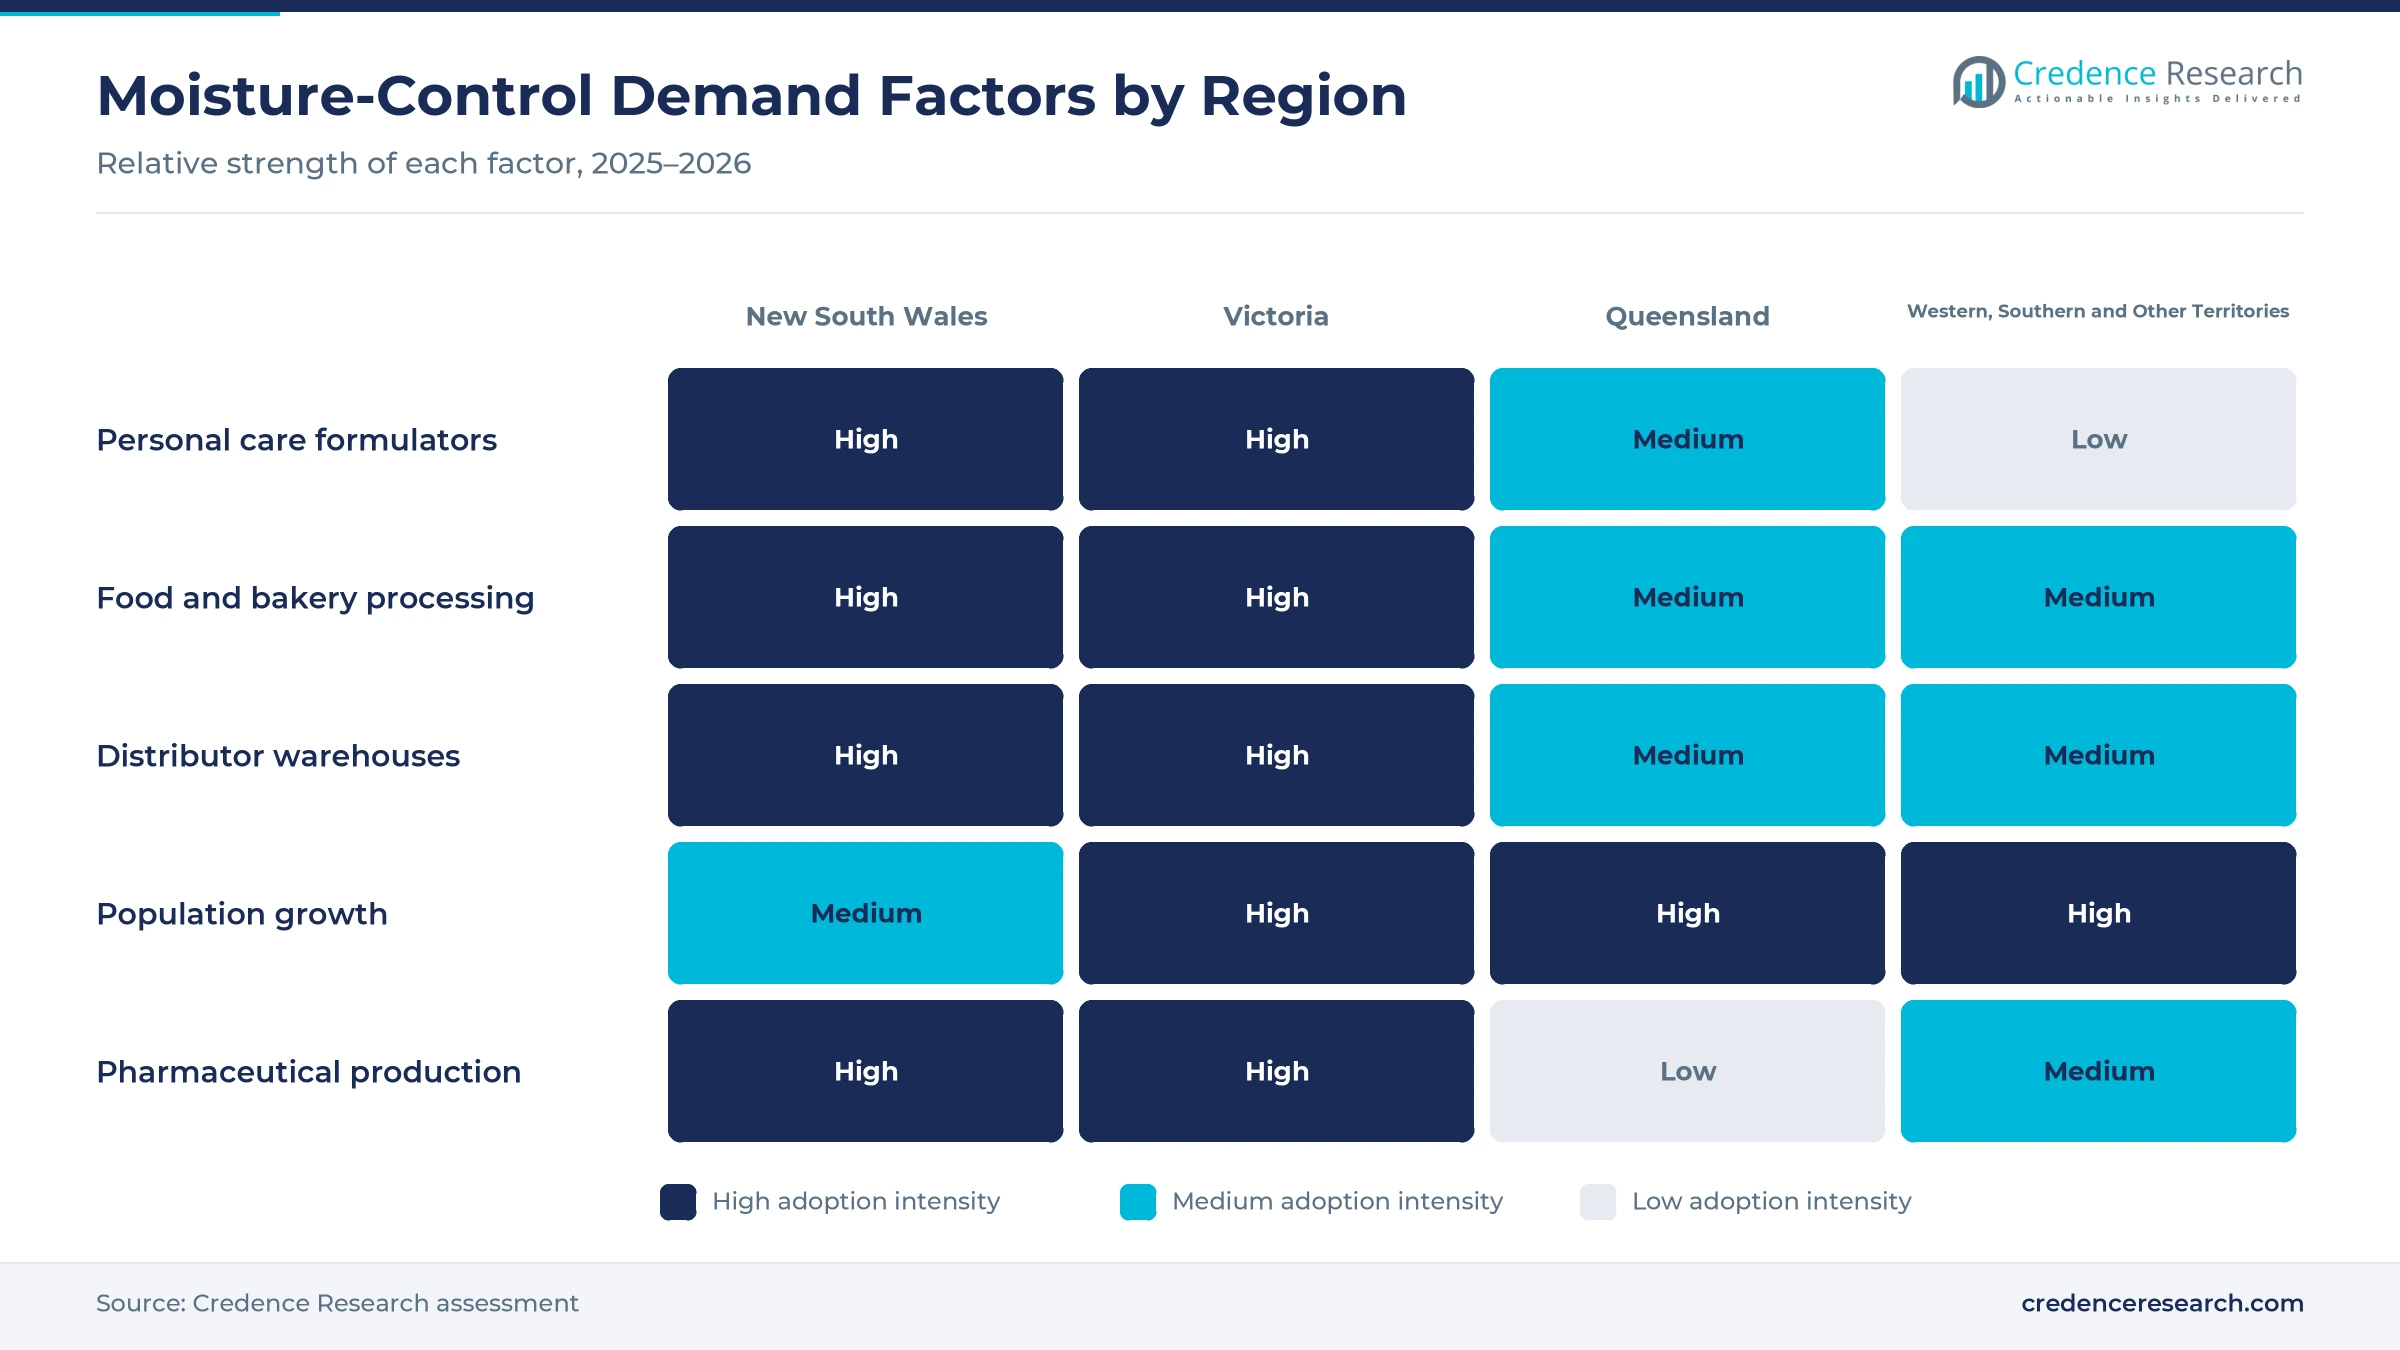
Hydration-led formulation lifts ingredient demand, because moisturizing claims now appear across face, body, hair and sun care ranges. People aged 65 and above made up 18.1% of the population in 2025, up from 17.7% in 2024, according to World Bank data, and older skin needs richer moisturizers and barrier-repair creams. The national population also reached 27.9 million at March 31, 2026, after growth of 1.4% over the year. Since June 16, 2023, DKSH has held exclusive Australian distribution of bitop Ectoin natural and Glycoin natural. As a result, personal care and cosmetics lead end uses with 41.0% of 2025 value and keep the fastest end-use growth in the Australia humectants market.
Why do food moisture-control rules support steady volumes?
Food moisture-control requirements support steady volumes, because bakery, confectionery and snack makers must keep texture and shelf life stable. National food standards define these additives as substances that retard moisture loss from food, according to Schedule 14 of the food standards code. Food and grocery turnover rose 5.3% to AUD 173 billion in 2023-24, while employment grew 4.4% to 294,212, according to the national food and grocery council. Food, beverages and tobacco also made up 25.7% of manufacturing value added in 2024, up from 22.9% in 2023, according to World Bank data. Consequently, polyols such as glycerol and sorbitol hold the largest product share at 46.0% of 2025 value nationwide.
How does technical distribution investment widen supply?
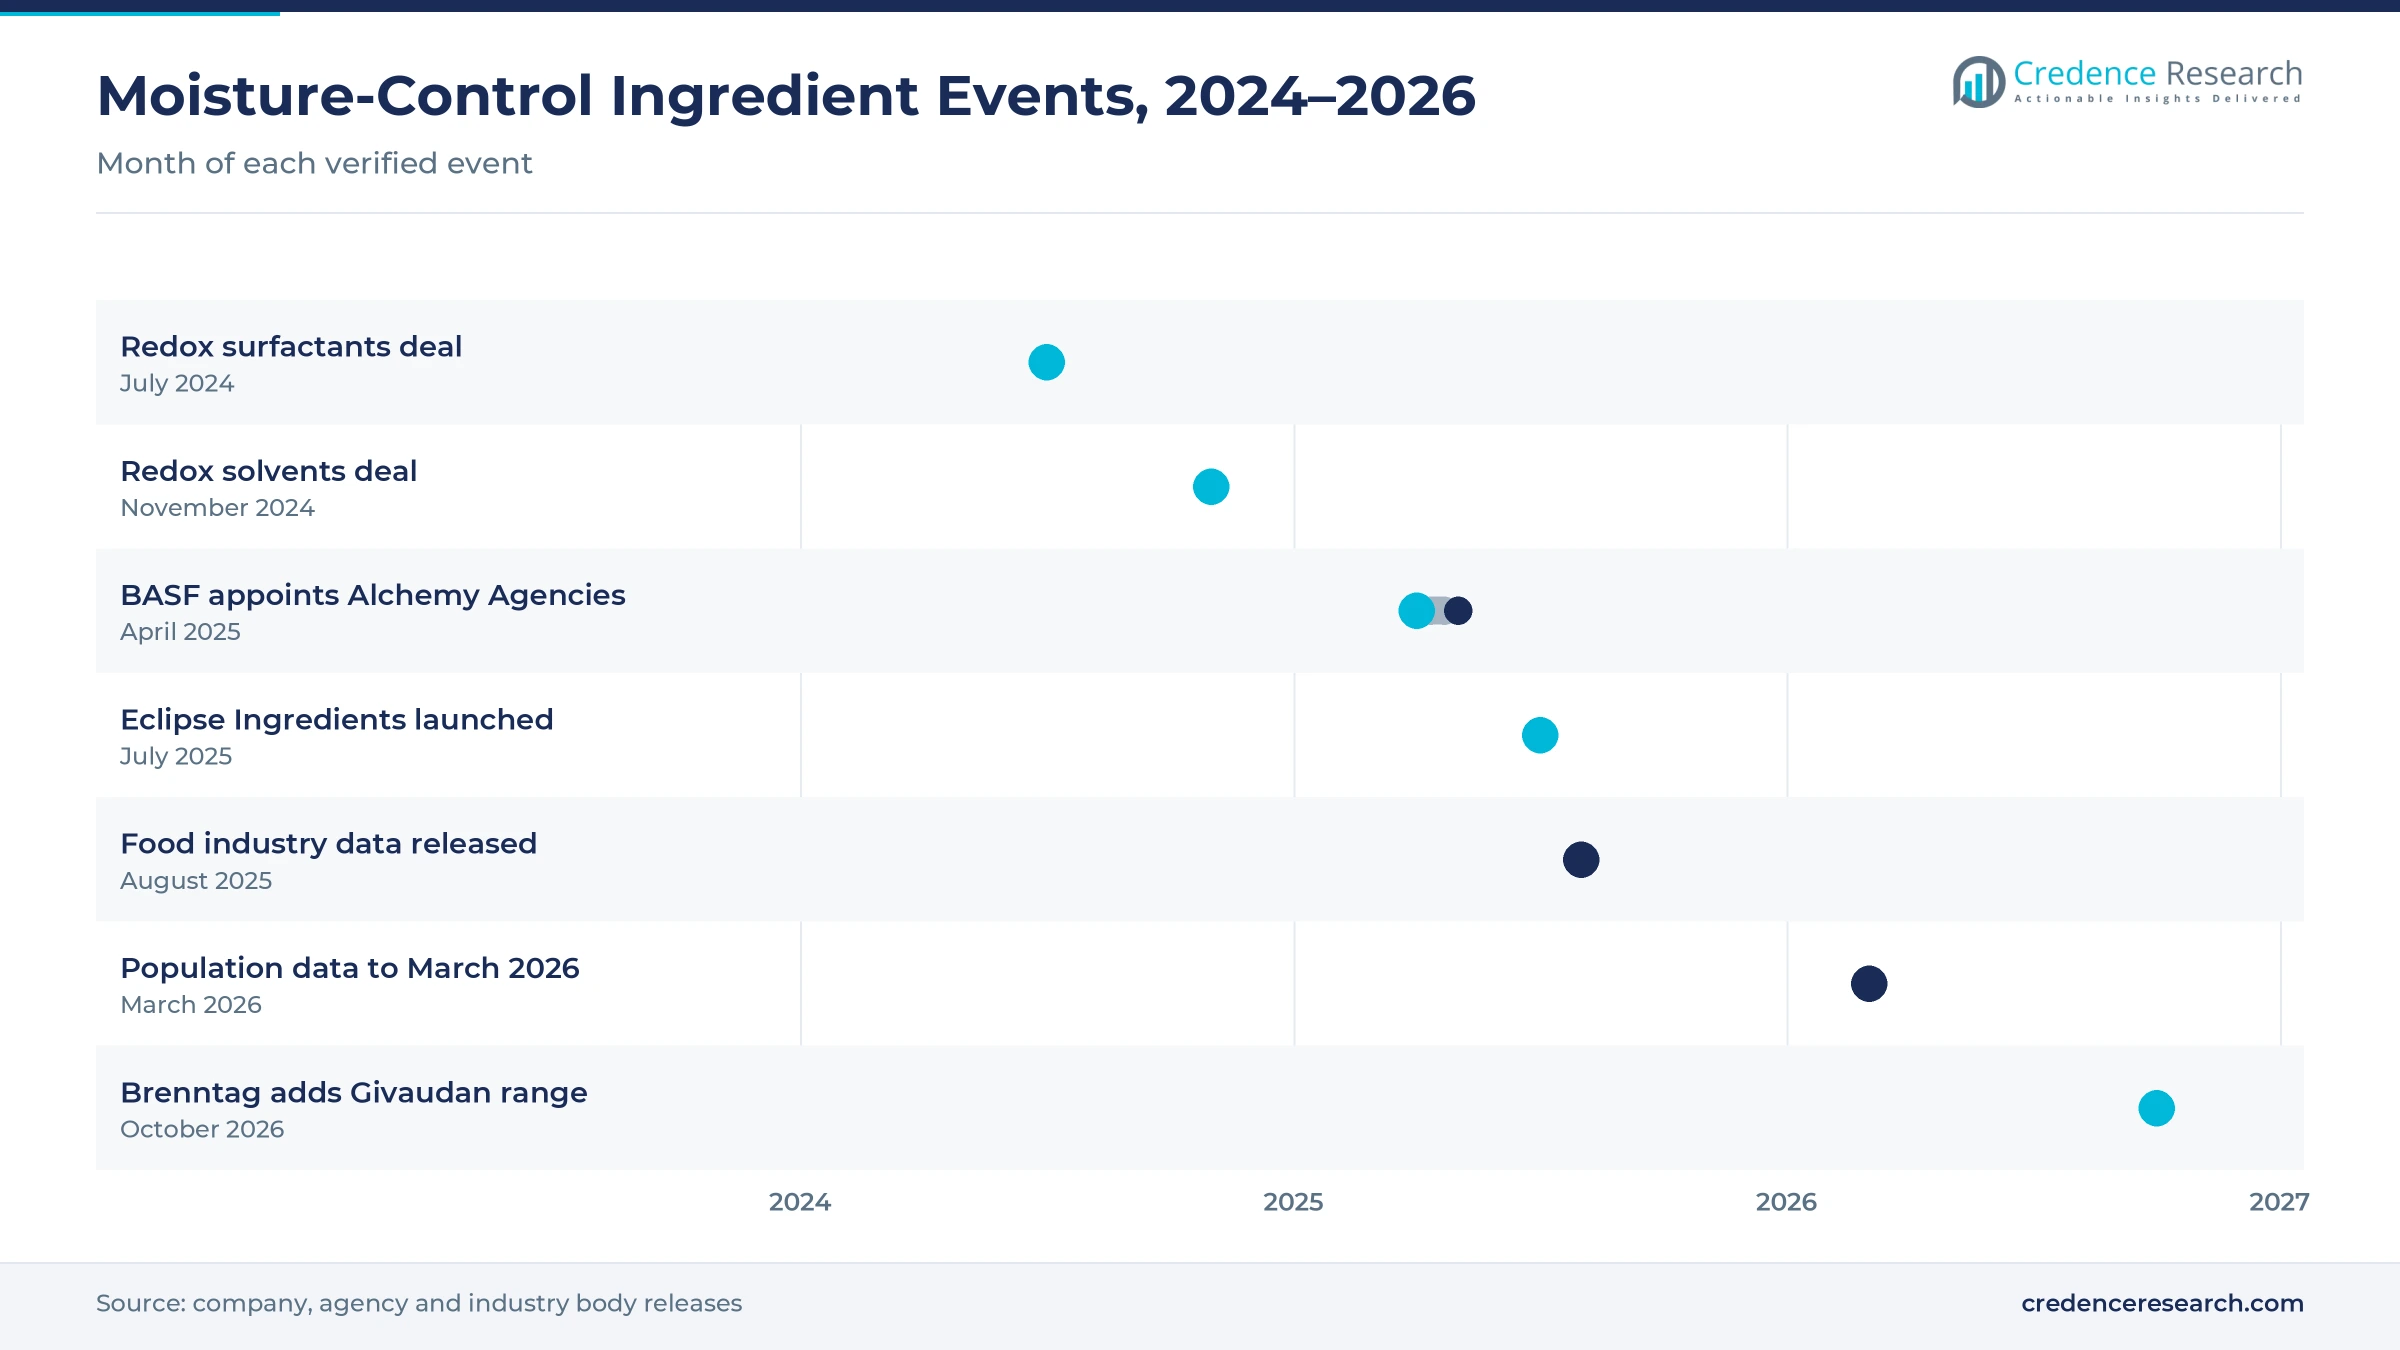
Technical distribution investment widens supply, because formulators rely on local stock, technical documents and laboratory support before they switch any moisture-control grade. On April 30, 2025, BASF appointed Alchemy Agencies as exclusive distributor of its personal care portfolio from May 1, 2025, covering emollients, emulsifiers, actives and polymers. Redox reported more than 8,000 active customers, more than 1,000 suppliers and more than 5,000 product lines in fiscal 2025. Redox also acquired a specialty surfactants distributor in July 2024 and a solvents distributor in November 2024. As a result, technical distributor sales lead channels with 56.0% of 2025 value across the country.
Why does population growth widen the consumer base?
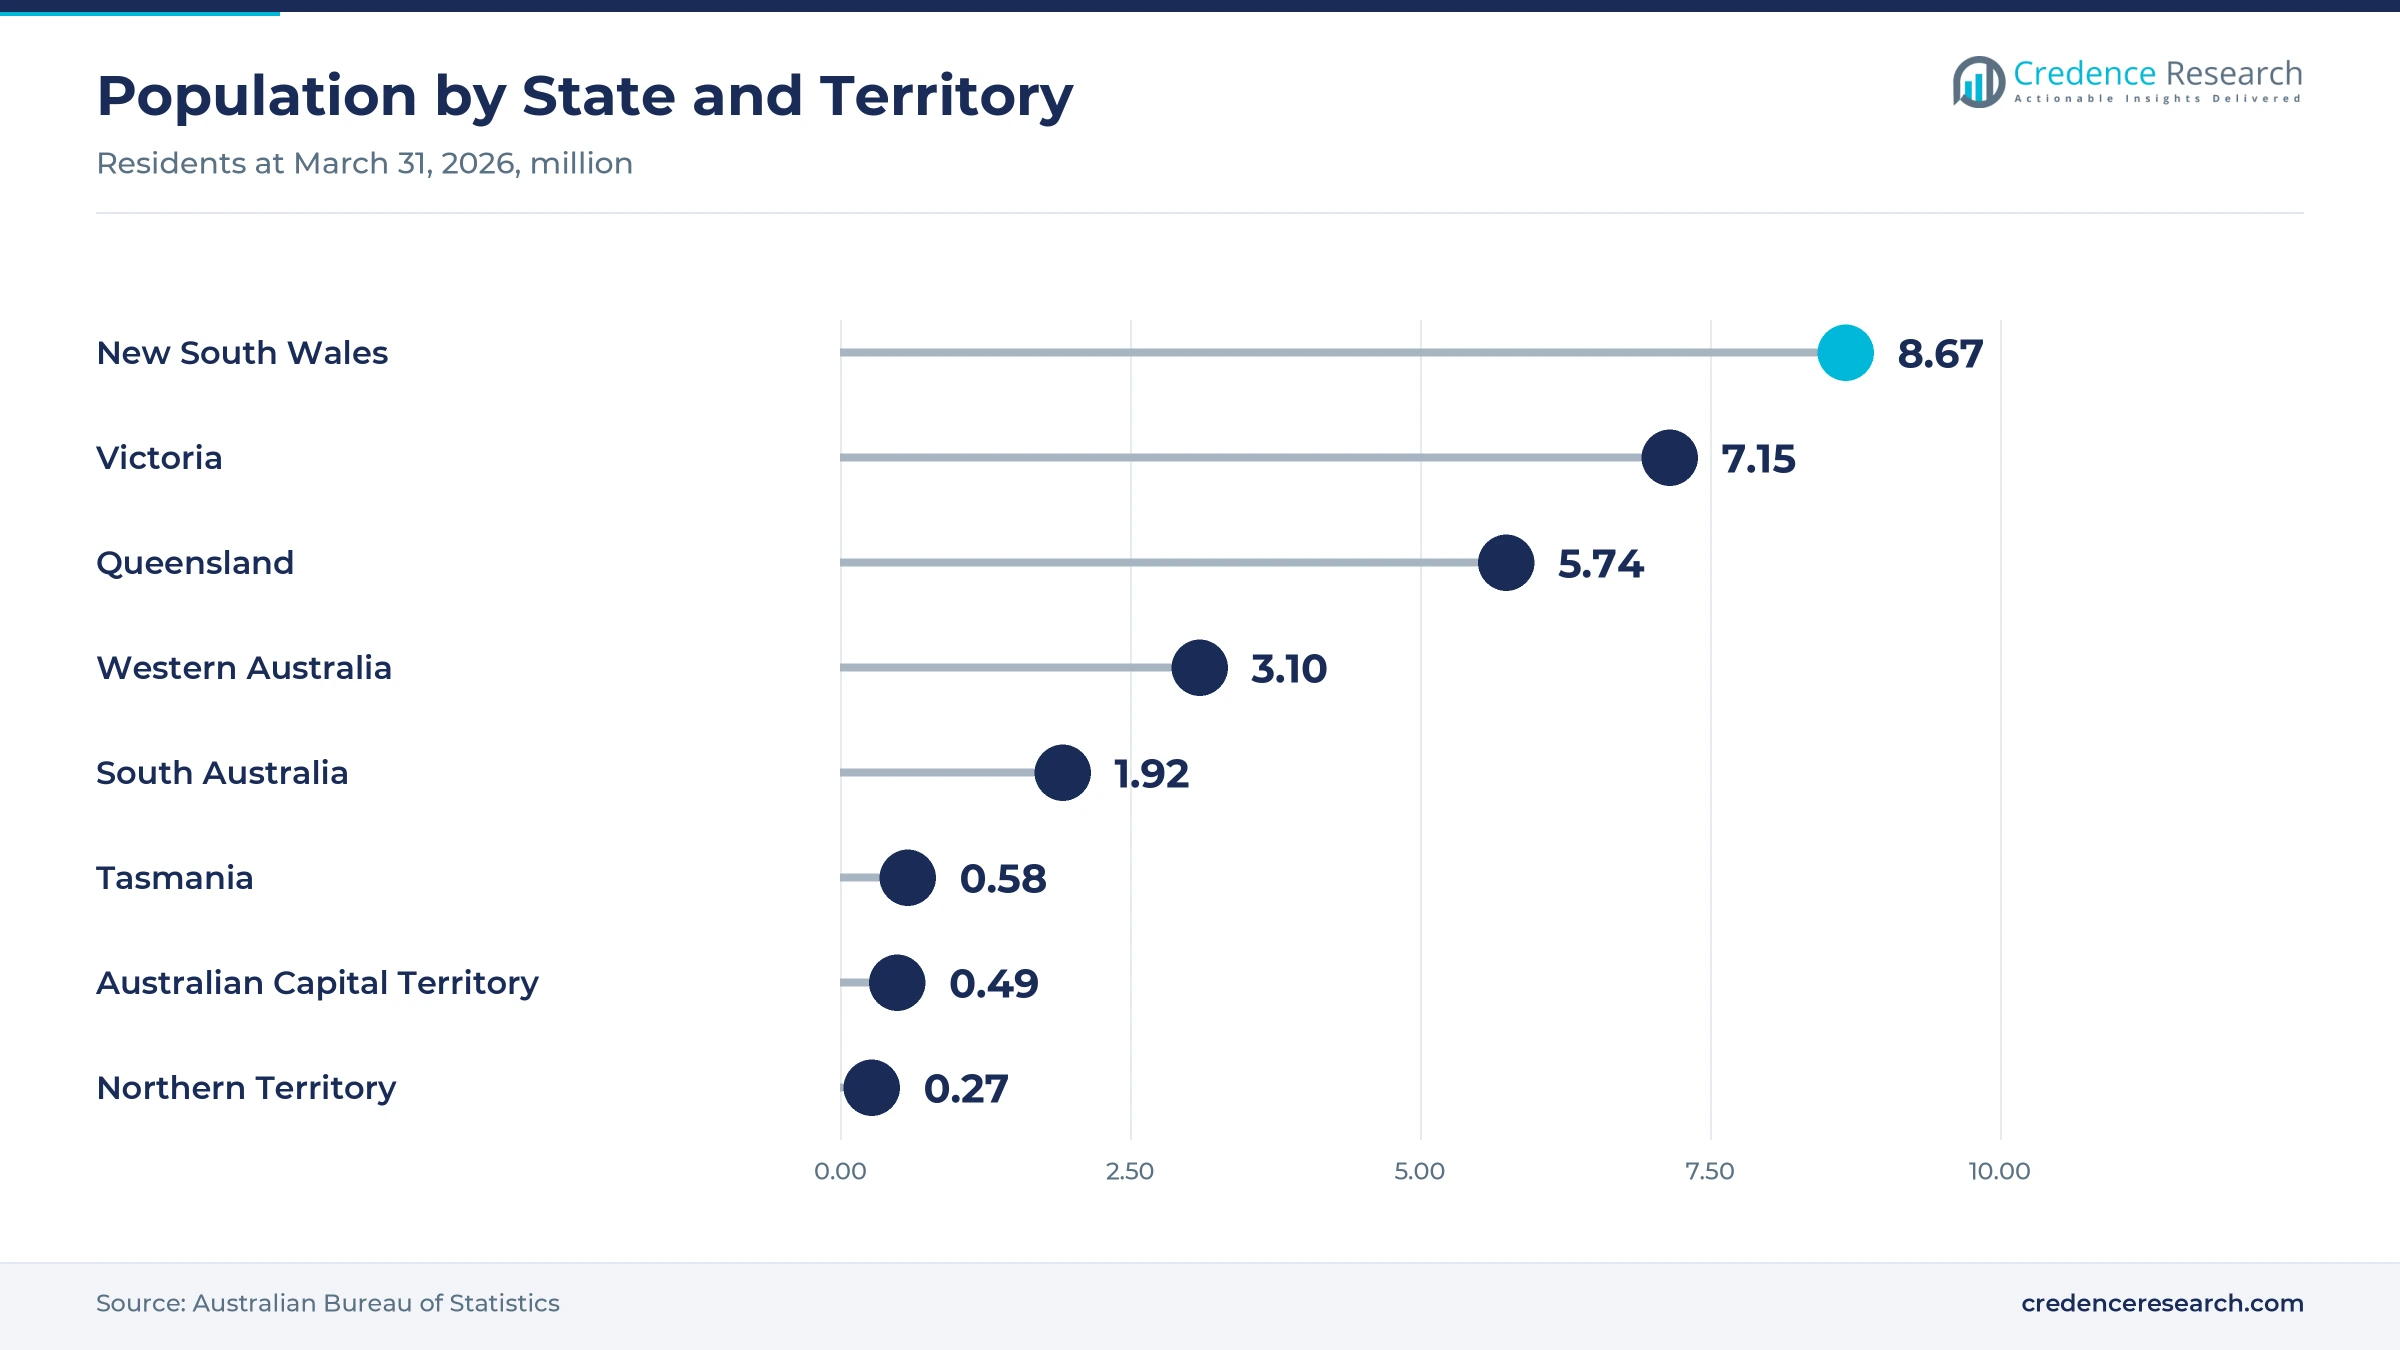
Population growth widens the consumer base for skin care, packaged food and medicines, which all use moisture-control ingredients. The national population reached 27.9 million at March 31, 2026, adding 392,700 people over the year, according to the Australian Bureau of Statistics. Western Australia grew fastest at 2.1%, while Tasmania grew slowest at 0.6% over the same period. Net overseas migration added 292,100 people, which also widens demand for diverse food and beauty products. Consequently, Queensland posts the fastest regional growth through 2035, while the western and southern zone grows at 5.34% a year as Perth adds residents and food plants.
Fermentation actives, lab support and small-lot buying rise
How is the rise of fermentation-derived actives changing supply?
The rise of fermentation-derived actives is changing supply, because brands want hydration ingredients with biotech and natural-origin stories that shoppers can verify on the label. On July 15, 2025, CSIRO announced Eclipse Ingredients, a start-up that uses yeast-based precision fermentation to make animal-free ingredients. The company named cosmetics as its first focus, with food and supplements as later openings. Eclipse is scaling up production with CSIRO, AgFunder and the Food and Beverage Accelerator, which builds local fermentation capability. Demand for hyaluronic acid serums also supports this shift in premium skin care. As a result, biofunctional humectants post the fastest product CAGR at 6.76% during 2026–2035 as start-ups and distributors widen local supply.
Why is the shift to application labs rising?
The shift to application labs is rising, because small and mid-sized brands need help to turn ingredients into stable products quickly. In October 2026, Brenntag extended its Givaudan Active Beauty partnership to Australia and New Zealand. Customers there now receive formulation support through Brenntag Innovation and Application Centers, which shortens development time. Brenntag also added Australia to its Oterra natural colors agreement on June 1, 2023, offering prototype development and customized formulations. In turn, distributors that bundle moisture-control grades with cosmetic actives and emulsifiers win more formulation work. As a result, technical distributors remain the main route to market for Australia humectants buyers that need lab support.
Can clean-label food reformulation open new demand?
Clean-label food reformulation opens new demand, because bakers and confectioners must keep products moist while removing artificial additives. Food exports made up 13.7% of merchandise exports in 2025, up from 12.1% in 2024, which raises the need for long shelf life on export products. Food and grocery exports also rose 5.2% in 2023-24, while imports fell 3.3% over the same period. Oterra linked its June 2023 Australian distribution move to growing demand for natural and clean-label ingredients. As a result, sorbitol and glycerol suppliers can win reformulation projects with lower-sugar and natural-label recipes for local supermarket and export buyers across the country.
Is there room to grow in small-lot online supply?
Small-lot online supply offers a clear opening, because independent brands and regional makers buy ingredients in kilograms rather than drums. Regional communities hold 36% of food and grocery manufacturing jobs, which spreads small producers far from city warehouses. AusLabs sells propylene glycol and vegetable glycerine online with free shipping across the country. ChemSupply Australia also runs Australian manufacturing and logistics sites in Port Adelaide alongside its online shop. Redox also reported more than 100 stock locations in fiscal 2025, which shortens delivery times for small orders. Consequently, digital small-lot sales grow fastest among channels at 6.66% a year, and suppliers that offer food-grade additive documents online gain repeat orders.
Import reliance, feedstock swings and compliance costs
How does import reliance raise supply risk?
Import reliance raises supply risk, because most glycerol, sorbitol and propylene glycol reach local formulators from overseas refiners. Shipping delays and currency swings can lift landed costs quickly for small brands. As a result, buyers without safety stock face production gaps or higher prices. Distributors reduce this risk by holding local inventory across several cities and by qualifying more than one supplier for each grade, which protects customers during long shipping disruptions.
Why do feedstock swings unsettle polyol prices?
Feedstock swings unsettle polyol prices, because glycerol supply depends on vegetable oil processing and biodiesel output overseas. Changes in fuel policy or crop harvests can move refined glycerol prices within a few months. Consequently, contract manufacturers on fixed-price supply agreements absorb margin pressure. Buyers manage this risk through shorter price reviews, blended sourcing and alternative polyols such as sorbitol where recipes and product claims allow the change.
How do compliance costs affect small importers?
Compliance costs affect small importers, because each ingredient needs food, cosmetic or medicine documentation before local use. Food additives must match permitted uses, while cosmetic and pharmaceutical grades need purity and safety records. In turn, small importers spend more time on paperwork for each new grade. Larger distributors spread these costs across many suppliers, which favors established technical distribution networks with in-house regulatory teams and document libraries.
Will natural-claim scrutiny slow new launches?
Natural-claim scrutiny can slow new launches, because regulators and shoppers question vague natural or clean-label wording on beauty and food packs. Brands must show the origin and processing route of each moisture-control ingredient. As a result, fermentation and plant-derived grades need clear supply chain records. Suppliers that provide origin certificates and test data help brands avoid relabeling costs, product recalls and launch delays in major retail chains.
Sydney formulators lead as Queensland adds demand fastest
| Region | Value, 2025 (USD million) | Share, 2025 | CAGR, 2026–2035 |
|---|---|---|---|
| New South Wales | 55.5 | 30.9% | 4.94% |
| Western, Southern and Other Territories | 48.6 | 27.1% | 5.34% |
| Victoria | 41.3 | 23.0% | 5.39% |
| Queensland | 34.1 | 19.0% | 5.49% |
Why does New South Wales lead ingredient demand?
New South Wales held a 30.9% share of 2025 value and grows at 4.94% a year. Sydney concentrates skin care brands, contract manufacturers and the head offices of several ingredient distributors. The state had 8.67 million residents at March 31, 2026, the largest population of any state, after growth of 1.1% over the year. As a result, New South Wales keeps the largest share of personal care and pharmaceutical demand through 2035.
How does Victoria support food and beauty formulators?
Victoria held a 23.0% share of 2025 value and grows at 5.39% a year, because Melbourne hosts large food, dairy and personal care plants. The state had 7.15 million residents at March 31, 2026, after growth of 1.6% over the year. Alchemy Agencies has distributed the BASF personal care portfolio from Melbourne since May 1, 2025. Consequently, Victoria keeps strong demand for polyols in both food and beauty uses.
Why is Queensland the fastest-growing zone?
Queensland held a 19.0% share of 2025 value and grows fastest at 5.49% a year, because Brisbane and coastal cities add residents and food plants quickly. The state had 5.74 million residents at March 31, 2026, up 1.6% over the year. Sun care and after-sun products also use moisture-control grades heavily in warm climates. In turn, Queensland adds the most new demand for skin care and packaged food ingredients.
How do the western and southern states add demand?
The western, southern and other territories held 27.1% of 2025 value and grow at 5.34% a year. Western Australia grew 2.1% to 3.10 million residents, faster than any other state, while South Australia reached 1.92 million. ChemSupply Australia runs manufacturing and logistics sites in Port Adelaide that serve food, pharmaceutical and laboratory buyers. Therefore, this zone keeps steady demand from food processors and smaller formulators.
Distributor deals and biotech start-ups from 2024 to 2026
| Development | Status and market relevance |
|---|---|
| In July 2024, Redox completed the acquisition of a specialty surfactants distributor in Australia. | Widens its personal care and cleaning ingredient range |
| In November 2024, Redox acquired a solvents and specialty solvent blends distributor in Australia. | Adds blending capacity for formulators |
| In April 2025, BASF appointed Alchemy Agencies as exclusive distributor of its personal care portfolio in Australia and New Zealand. | Agreement took effect on May 1, 2025 |
| In July 2025, CSIRO announced Eclipse Ingredients, a precision fermentation start-up focused first on cosmetics. | Builds local biotech ingredient capability |
| In October 2026, Brenntag extended its Givaudan Active Beauty partnership to Australia and New Zealand. | Adds formulation support through application centers |
Fermentation, refining and blending reshape supply
- Precision fermentation uses engineered yeast or bacteria to make hydration actives without animal or crop extraction, which supports consistent purity and natural-origin claims.
- Refined plant-based glycerol gives formulators high-purity grades with clear vegetable origin, which supports vegan and halal product claims in skin care and food.
- Ready-to-use hydration blends combine polyols, sugars and actives in one ingredient, which simplifies production for small brands and contract manufacturers.
- Digital ordering and document portals let buyers download safety data, certificates and specifications before ordering small lots online.
Need a Custom Version of This Report?
Tailor the scope, geography, or segments to your exact requirements.
- Custom geography or segment scope
- Direct access to our analyst team
Distributors compete on range, stock and lab support
Competition combines global chemical distributors, local technical distributors and online suppliers of small lots. Redox serves more than 8,000 active customers and added surfactants and solvents distributors in 2024. BASF moved its personal care portfolio to Alchemy Agencies from May 1, 2025, while Brenntag extended its Givaudan Active Beauty partnership to the country in October 2026. DKSH has held exclusive distribution of bitop hydration actives since June 2023, and IMCD runs formulation laboratories after its earlier acquisition of Capitol Ingredients in Sydney. ChemSupply Australia manufactures in Port Adelaide, and AusLabs sells glycerine and propylene glycol online. Companies compete on range, local stock, safety documents, laboratory support, price and delivery speed. Larger distributors also bundle moisture-control grades with emulsifiers, actives and preservatives, which helps them win whole formulation projects.
Companies profiled and their roles in this market
| Company | Type | Role in the market |
|---|---|---|
| Redox Limited | Technical distributor | More than 8,000 active customers; 2024 surfactant and solvent acquisitions |
| BASF Australia | Ingredient producer | Personal care portfolio distributed by Alchemy Agencies from May 2025 |
| Alchemy Agencies | Technical distributor | Exclusive BASF personal care distributor in Australia and New Zealand |
| Brenntag Australia | Technical distributor | Givaudan Active Beauty range with application center support from 2026 |
| DKSH Performance Materials | Technical distributor | Exclusive bitop Ectoin natural and Glycoin natural supply since 2023 |
| IMCD Australia | Technical distributor | Personal care laboratory in Sydney from the Capitol Ingredients business |
| ChemSupply Australia | Manufacturer and supplier | Australian manufacturing and logistics in Port Adelaide |
| AusLabs | Online small-lot supplier | Glycerine and propylene glycol sold online with national shipping |
Credence Research view on moisture-control ingredients
Credence Research's view is that Australian demand for moisture-control ingredients will grow steadily through 2035, as skin care brands, food makers and medicine producers keep water in their products. Polyols should keep the largest share, while biofunctional grades gain most from fermentation and premium hydration claims. Technical distributors will keep most sales because formulators value local stock and laboratory help. However, import reliance and feedstock swings will reward suppliers that hold inventory and qualify several sources for each grade.
How the moisture-control ingredient estimate was built
The report uses 2025 as the base year, with values in USD million at current prices. Market values come from the Credence Research model, which combines end-use output, ingredient loadings, import flows and price tiers. Regional shares follow the client zone split, and segment splits by product type, end-use industry and sales channel are Credence Research estimates. Sources used are official statistics, food standards, industry body releases, company statements and news reports, and no interviews or surveys were used.
Hydration actives and food reformulation shape 2035
The market is expected to reach USD 299.3 million by 2035, a 5.26% CAGR during 2026–2035, as hydration claims and food shelf-life needs keep demand rising. Growth should be strongest in biofunctional grades, digital small-lot sales and Queensland, while New South Wales keeps the largest share. Distributor portfolio moves and local fermentation capability will widen supply options after 2026. In contrast, sharp feedstock price swings or weak consumer spending could slow premium launches and push buyers toward lower-cost commodity grades.
Frequently Asked Questions
How big is the Australia humectants market?
Which region leads moisture-control ingredient demand?
Which region grows fastest?
Which product type holds the largest share?
How do food standards affect demand?
Which product type grows fastest?
Who are the leading companies in this market?
What are the main risks to growth?
Table of Content
Chapter 1 Market Segmentation
- 1.1 Segmentation Framework
- 1.1.1 Product and Service Classification
- 1.1.2 Application and End-Use Classification
- 1.1.3 Technology and Solution Classification
- 1.1.4 Customer and Distribution Channel Classification
- 1.1.5 Geographic Segmentation
- 1.1.6 Market Segment Definitions and Boundaries
- 1.2 By Product Type
- 1.2.1 Polyols
- 1.2.2 Glycol-Based Humectants
- 1.2.3 Specialty Hydration Ingredients
- 1.2.4 Biofunctional Humectants
- 1.3 By End-Use Industry
- 1.3.1 Personal Care & Cosmetics
- 1.3.2 Food & Beverage
- 1.3.3 Pharmaceuticals
- 1.3.4 Animal Nutrition
- 1.4 By Sales Channel
- 1.4.1 Technical Distributor Sales
- 1.4.2 Direct Manufacturer Procurement
- 1.4.3 Digital Small-Lot Sales
Chapter 2 Introduction
- 2.1 Report Objectives and Scope
- 2.2 Product Definition and Industry Terminology
- 2.3 Market Inclusions and Exclusions
- 2.4 Research Process
- 2.4.1 Primary Research and Expert Interviews
- 2.4.2 Secondary Research and Source Review
- 2.4.3 Top-Down and Bottom-Up Estimation
- 2.4.4 Data Triangulation and Verification
- 2.5 Market Size Measurement Basis
- 2.5.1 2025: USD 179.5 million → 2035: USD 299.3 million
- 2.6 Historical and Forecast Reference Periods
- 2.6.1 Historical Period: 2018-2025
- 2.6.2 Base Year: 2025
- 2.6.3 Forecast Period: 2025-2035
- 2.7 Research Assumptions and Limitations
Chapter 3 Executive Summary
- 3.1 Market Snapshot and Key Findings
- 3.2 Base-Year Market Size, 2025
- 3.3 Forecast Market Size, 2035
- 3.4 Revenue and Volume Growth Outlook
- 3.5 Key Demand and Supply Indicators
- 3.6 Leading Market Segments
- 3.7 Fastest-Growing Market Opportunities
- 3.8 Regional Performance Highlights
- 3.9 Technology and Industry Transformation
- 3.10 Competitive Landscape Summary
- 3.11 Analyst View and Strategic Implications
Chapter 4 Australia Humectants Market Trends and Developments
- 4.1 Historical Industry Development, 2018-2025
- 4.2 Recent Market Trends and Developments
- 4.3 Demand and Customer Behavior Trends
- 4.4 Technology and Product Innovation
- 4.5 Artificial Intelligence, Automation and Digitalization
- 4.6 Local Manufacturing and Supply Chain Realignment
- 4.7 Industry Partnerships, Mergers and Acquisitions
- 4.8 Sustainability and Circular Economy Developments
- 4.9 Government and Private Sector Investment Trends
- 4.10 Emerging Business Models and Commercialization
- 4.11 Industry Developments and Announcements
Chapter 5 Australia Humectants Market Production, Supply and Demand Analysis
- 5.1 Demand Trend and Consumption Analysis, 2018-2025
- 5.2 Demand Forecast, 2025-2035
- 5.3 Production and Output Trend, 2018-2025
- 5.4 Production and Output Forecast, 2025-2035
- 5.5 Installed Capacity and Capacity Utilization
- 5.6 Company-Wise Production Plants and Statistics
- 5.6.1 Installed Production Capacity
- 5.6.2 Actual Production
- 5.6.3 Planned Capacity and Expansion Targets
- 5.7 Supply Chain Structure and Procurement Trends
- 5.8 Supply-Demand Gap and Bottlenecks
- 5.9 Import Dependence and Sourcing Structure
- 5.10 Contract Manufacturing and Outsourcing
- 5.11 Regional Supply and Demand Concentration
Chapter 6 Australia Humectants Market Pricing Analysis
- 6.1 Pricing Structure and Measurement
- 6.2 Historical Pricing Trends, 2018-2025
- 6.3 Pricing Outlook, 2025-2035
- 6.4 Average Selling Price and Unit Economics
- 6.5 Pricing by Product and Market Segment
- 6.6 Geographic Pricing Differences
- 6.7 Key Input, Energy, Labor and Logistics Costs
- 6.8 Contract Pricing and Purchasing Models
- 6.9 Pricing Sensitivity and Competitive Positioning
- 6.10 Price, Margin and Profitability Implications
Chapter 7 Australia Humectants Market Dynamics
- 7.1 Market Growth Drivers
- 7.1.1 Demand-Side Drivers
- 7.1.2 Technology and Innovation Drivers
- 7.1.3 Infrastructure and Investment Drivers
- 7.1.4 Regulatory and Policy Drivers
- 7.2 Market Restraints
- 7.2.1 Cost and Affordability Constraints
- 7.2.2 Technology and Adoption Barriers
- 7.2.3 Supply Chain and Operational Constraints
- 7.3 Market Challenges
- 7.3.1 Competitive Pressure and Margin Erosion
- 7.3.2 Skills, Infrastructure and Implementation Gaps
- 7.4 Emerging Market Opportunities
- 7.5 Market Dynamics Impact and Time-Horizon Assessment
Chapter 8 Australia Humectants Value Chain Analysis
- 8.1 Industry Value Chain Overview
- 8.2 Upstream Suppliers and Critical Inputs
- 8.3 Technology and Component Providers
- 8.4 Manufacturing or Service Delivery
- 8.5 Distribution, Channel Partners and Integrators
- 8.6 Downstream Applications and End Users
- 8.7 Value Addition and Profit Pools
- 8.8 Vertical Integration and Outsourcing
- 8.9 Supplier Concentration and Risk
- 8.10 Supply Chain Localization and Resilience
Chapter 9 Australia Humectants Market Regulations and Policies
- 9.1 Relevant Laws, Standards and Compliance Frameworks
- 9.2 Product, Service, Safety and Quality Requirements
- 9.3 Government Policies, Incentives and Subsidies
- 9.4 Imports, Exports and Trade Barriers
- 9.5 Public Procurement and Local Content Requirements
- 9.6 Environmental and Sustainability Compliance
- 9.7 Upcoming Policy Changes and Market Implications
Chapter 10 Australia Humectants Market Hotspots and Opportunities
- 10.1 Market Opportunity Mapping and Growth Hotspots
- 10.2 High-Growth Applications and Customer Groups
- 10.3 Underserved Markets and White-Space Opportunities
- 10.4 Emerging Technology and Product Opportunities
- 10.5 New Capacity and Investment Hotspots
- 10.6 Market Entry and Expansion Opportunities
- 10.7 Distribution and Partnership Opportunities
- 10.8 Near-Term and Long-Term Commercial Potential
- 10.9 Opportunity Attractiveness and Execution Risks
Chapter 11 Australia Humectants Market Outlook, 2025-2035
- 11.1 Market Size and Analysis
- 11.1.1 Revenue (Market Measurement: 2025: USD 179.5 million → 2035: USD 299.3 million)
- 11.1.2 Market Volume and Quantity Sold
- 11.1.3 Historical Market Size, 2018-2025
- 11.1.4 Base-Year Market Size, 2025
- 11.2 Market Forecast, 2025-2035
- 11.2.1 Revenue Forecast to 2035
- 11.2.2 Volume Forecast to 2035
- 11.2.3 CAGR and Year-on-Year Growth
- 11.2.4 Incremental Revenue Opportunity
- 11.3 Forecast Assumptions and Scenario Analysis
- 11.3.1 Base-Case Forecast
- 11.3.2 Optimistic and Conservative Scenarios
- 11.3.3 Technology, Pricing and Policy Sensitivities
- 11.4 Market Attractiveness and Growth Outlook
Chapter 12 Australia Humectants Market Segmentation and Outlook
- 12.1 Segmentation Summary and Market Shares, 2025
- 12.2 Largest and Fastest-Growing Segments
- 12.3 By Product Type - Market Size and Forecast, 2025-2035
- 12.3.1 Segment Definition and Scope
- 12.3.2 Historical Market Size, 2018-2025
- 12.3.3 Revenue Forecast, 2025-2035
- 12.3.4 Volume Forecast, 2025-2035
- 12.3.5 Base-Year Market Share, 2025
- 12.3.6 Segment CAGR and Growth Drivers
- 12.3.7 Subsegment Market Size and Forecast
- 12.3.7.1 Polyols
- 12.3.7.2 Glycol-Based Humectants
- 12.3.7.3 Specialty Hydration Ingredients
- 12.3.7.4 Biofunctional Humectants
- 12.3.8 Subsegment Pricing and Adoption Trends
- 12.3.9 Leading Suppliers and Competition
- 12.3.10 Regional Demand and Opportunities
- 12.4 By End-Use Industry - Market Size and Forecast, 2025-2035
- 12.4.1 Segment Definition and Scope
- 12.4.2 Historical Market Size, 2018-2025
- 12.4.3 Revenue Forecast, 2025-2035
- 12.4.4 Volume Forecast, 2025-2035
- 12.4.5 Base-Year Market Share, 2025
- 12.4.6 Segment CAGR and Growth Drivers
- 12.4.7 Subsegment Market Size and Forecast
- 12.4.7.1 Personal Care & Cosmetics
- 12.4.7.2 Food & Beverage
- 12.4.7.3 Pharmaceuticals
- 12.4.7.4 Animal Nutrition
- 12.4.8 Subsegment Pricing and Adoption Trends
- 12.4.9 Leading Suppliers and Competition
- 12.4.10 Regional Demand and Opportunities
- 12.5 By Sales Channel - Market Size and Forecast, 2025-2035
- 12.5.1 Segment Definition and Scope
- 12.5.2 Historical Market Size, 2018-2025
- 12.5.3 Revenue Forecast, 2025-2035
- 12.5.4 Volume Forecast, 2025-2035
- 12.5.5 Base-Year Market Share, 2025
- 12.5.6 Segment CAGR and Growth Drivers
- 12.5.7 Subsegment Market Size and Forecast
- 12.5.7.1 Technical Distributor Sales
- 12.5.7.2 Direct Manufacturer Procurement
- 12.5.7.3 Digital Small-Lot Sales
- 12.5.8 Subsegment Pricing and Adoption Trends
- 12.5.9 Leading Suppliers and Competition
- 12.5.10 Regional Demand and Opportunities
- 12.6 Segment Growth Comparison
- 12.7 Segment Attractiveness and Priority Matrix
Chapter 13 Australia Humectants End-Use and Application Market Outlook
- 13.1 End-Use Industry and Customer Demand Structure
- 13.2 Leading Applications and Customer Groups
- 13.3 End-Use Market Size, Share and Forecast
- 13.4 Major End-Use Industry Deep Dives
- 13.4.1 Customer Requirements and Use Cases
- 13.4.2 Demand and Replacement Cycles
- 13.4.3 Technical and Regulatory Considerations
- 13.4.4 Purchasing and Procurement Models
- 13.4.5 Leading Vendors and Distribution Channels
- 13.4.6 Forecast and Commercial Opportunities
- 13.5 Emerging Applications and Cross-Segment Demand
- 13.6 End-Use Industry Investment Priorities
Chapter 14 Australia Humectants Geographic Market Outlook, 2025-2035
- 14.1 Domestic Market Distribution and Demand Clusters
- 14.2 State- or Province-Wise Market Size and Forecast, 2025-2035
- 14.3 City and Metropolitan Market Outlook
- 14.4 Industrial, Manufacturing and Commercial Clusters
- 14.5 Geographic Concentration of Key End Users
- 14.6 Local Pricing and Purchasing Differences
- 14.7 Domestic Production Facilities and Capacity Map
- 14.8 Local Infrastructure and Project Pipeline
- 14.9 State-Level Policy and Incentive Differences
- 14.10 Subnational Investment Hotspots and Opportunities
- 14.11 Distribution and Logistics Networks
- 14.12 Domestic Competitive Footprint
Chapter 15 Australia Humectants Technology, Innovation and Sustainability Outlook
- 15.1 Technology Landscape and Maturity
- 15.2 Product, Process and Service Innovation
- 15.3 AI, Automation and Digital Tools in the Industry
- 15.4 Technology Adoption and Performance Benchmarking
- 15.5 Innovation Pipeline and R&D Investment
- 15.6 Patent and Intellectual Property Trends
- 15.7 Energy Efficiency and Resource Management
- 15.8 Sustainability, Recycling and Circularity
- 15.9 Technology Roadmap, 2025-2035
- 15.10 Risks of Obsolescence and Technology Substitution
Chapter 16 Australia Humectants Market Key Strategic Imperatives
- 16.1 Growth and Market Entry Priorities
- 16.2 High-Return Products and Segments
- 16.3 Pricing, Profitability and Cost Optimization
- 16.4 Technology Investment and Product Differentiation
- 16.5 Supply Chain Localization and Resilience
- 16.6 Distribution and Customer Acquisition
- 16.7 Partnership, Acquisition and Capacity Strategy
- 16.8 Regional Expansion Priorities
- 16.9 Short-, Medium- and Long-Term Actions
Chapter 17 Competition Outlook
- 17.1 Industry Competition Characteristics
- 17.2 Market Structure and Concentration
- 17.3 Market Share and Competitive Positioning, 2025
- 17.4 Company-Wise Revenue and Product Benchmarking
- 17.5 Production and Service Capacity Benchmarking
- 17.6 Technology, Pricing and Differentiation
- 17.7 Regional Footprint and Distribution Strength
- 17.8 Mergers, Acquisitions and Strategic Alliances
- 17.9 New Entrants and Competitive Threats
- 17.10 Porter's Five Forces and Industry Attractiveness
- 17.11 Competitive Outlook, 2025-2035
Chapter 18 Company Profiles
- 18.1 Company Coverage and Selection Criteria
- 18.2 Redox Limited
- 18.2.1 Business Description
- 18.2.2 Company Ownership and Geographic Presence
- 18.2.3 Product and Service Portfolio
- 18.2.4 Manufacturing and Operating Footprint
- 18.2.5 Production Capacity and Expansion Plans
- 18.2.6 Financial Performance and Investment
- 18.2.7 Market Share and Competitive Position
- 18.2.8 Technology and Innovation Capabilities
- 18.2.9 Strategic Alliances or Partnerships
- 18.2.10 Recent Developments
- 18.2.11 Growth Strategy and Outlook
- 18.3 DKSH Performance Materials
- 18.4 IMCD Australia
- 18.5 BASF Australia
- 18.6 Brenntag Australia
- 18.7 ChemSupply Australia
- 18.8 New Directions Australia
- 18.9 Able Westchem
- 18.10 AusLabs
- 18.11 Alchemy Agencies
- 18.12 Other Relevant Market Participants
Note: Every listed company is profiled on the structure shown under the first company. The company list is preliminary and may change based on research findings, market developments, data availability and client requirements.
Chapter 19 Disclaimer
- 19.1 Research and Forecast Disclaimer
- 19.2 Data Source and Estimation Limitations
Note: The depth of individual sections depends on data availability for this market. Volume, capacity, trade and other unit-based metrics are included where applicable.

