
Catheter care and ageing patients anchor coating demand
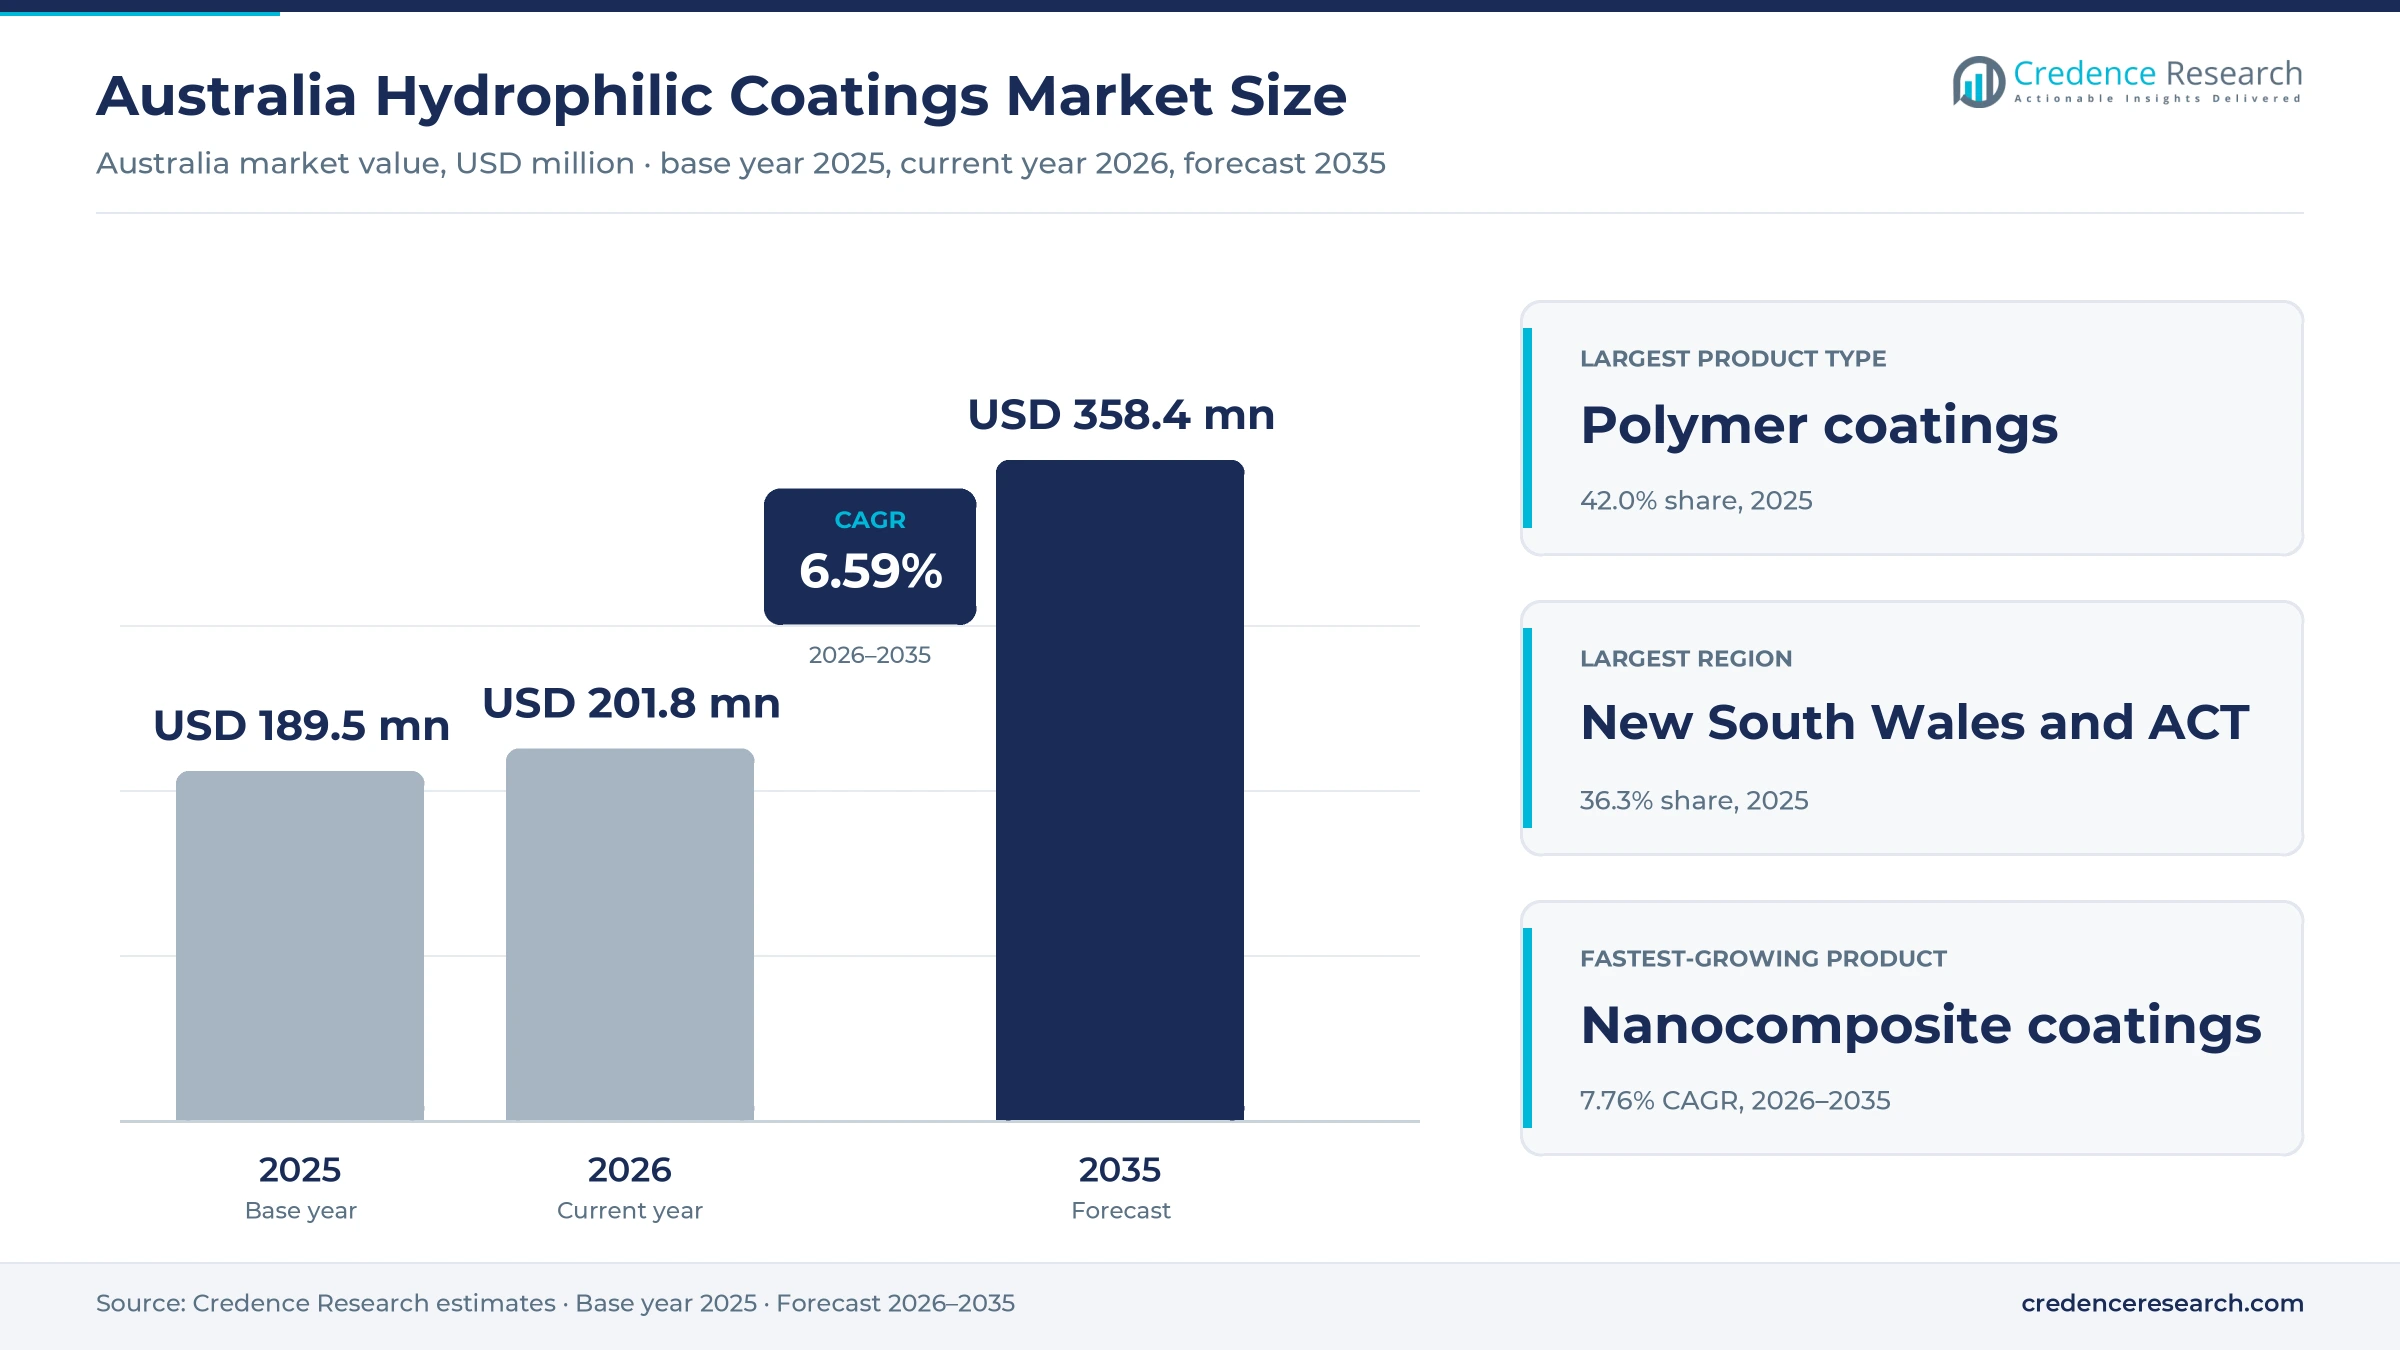
The Australia hydrophilic coatings market was valued at USD 189.5 million in 2025 and is projected to increase from USD 201.8 million in 2026 to USD 358.4 million by 2035, registering a CAGR of 6.59% during 2026–2035. Demand comes from medical device makers and importers that need slippery, wettable surfaces on urinary catheters, guidewires and vascular devices, with smaller use in anti-fog optics, industrial equipment and transport parts. New South Wales and ACT held the largest regional share, 36.3% in 2025, because the region has the largest population and the densest network of hospitals and device distributors. Queensland is the fastest-growing region at 6.88% a year, as population growth lifts device use in hospitals and community care. Most coated devices are imported and supplied through local subsidiaries of global device makers. The Therapeutic Goods Administration began applying unique device identification rules to some medical devices from July 1, 2026.
Which lubricious and wettable surfaces does the estimate cover?
The estimate measures the value of hydrogel, sol-gel, hydrophilic polymer and nanocomposite coatings applied to devices and parts sold or used in Australia. It covers medical devices, optics and specialty materials, industrial and construction equipment and transport equipment. Values include coating materials, coating services and the coating share of imported coated devices.
The estimate excludes the value of the underlying device, plain lubricants applied by the user, and hydrophobic or anti-corrosion paints. The value chain runs from coating chemistry suppliers and contract coating applicators through device manufacturers, local subsidiaries and distributors to hospitals, community care providers, industrial users and the patients who use catheters at home.
Australia Hydrophilic Coatings Market Insights
- The Australia hydrophilic coatings market was valued at USD 189.5 million in 2025 and is projected to reach USD 358.4 million by 2035, registering a CAGR of 6.59% during 2026–2035.
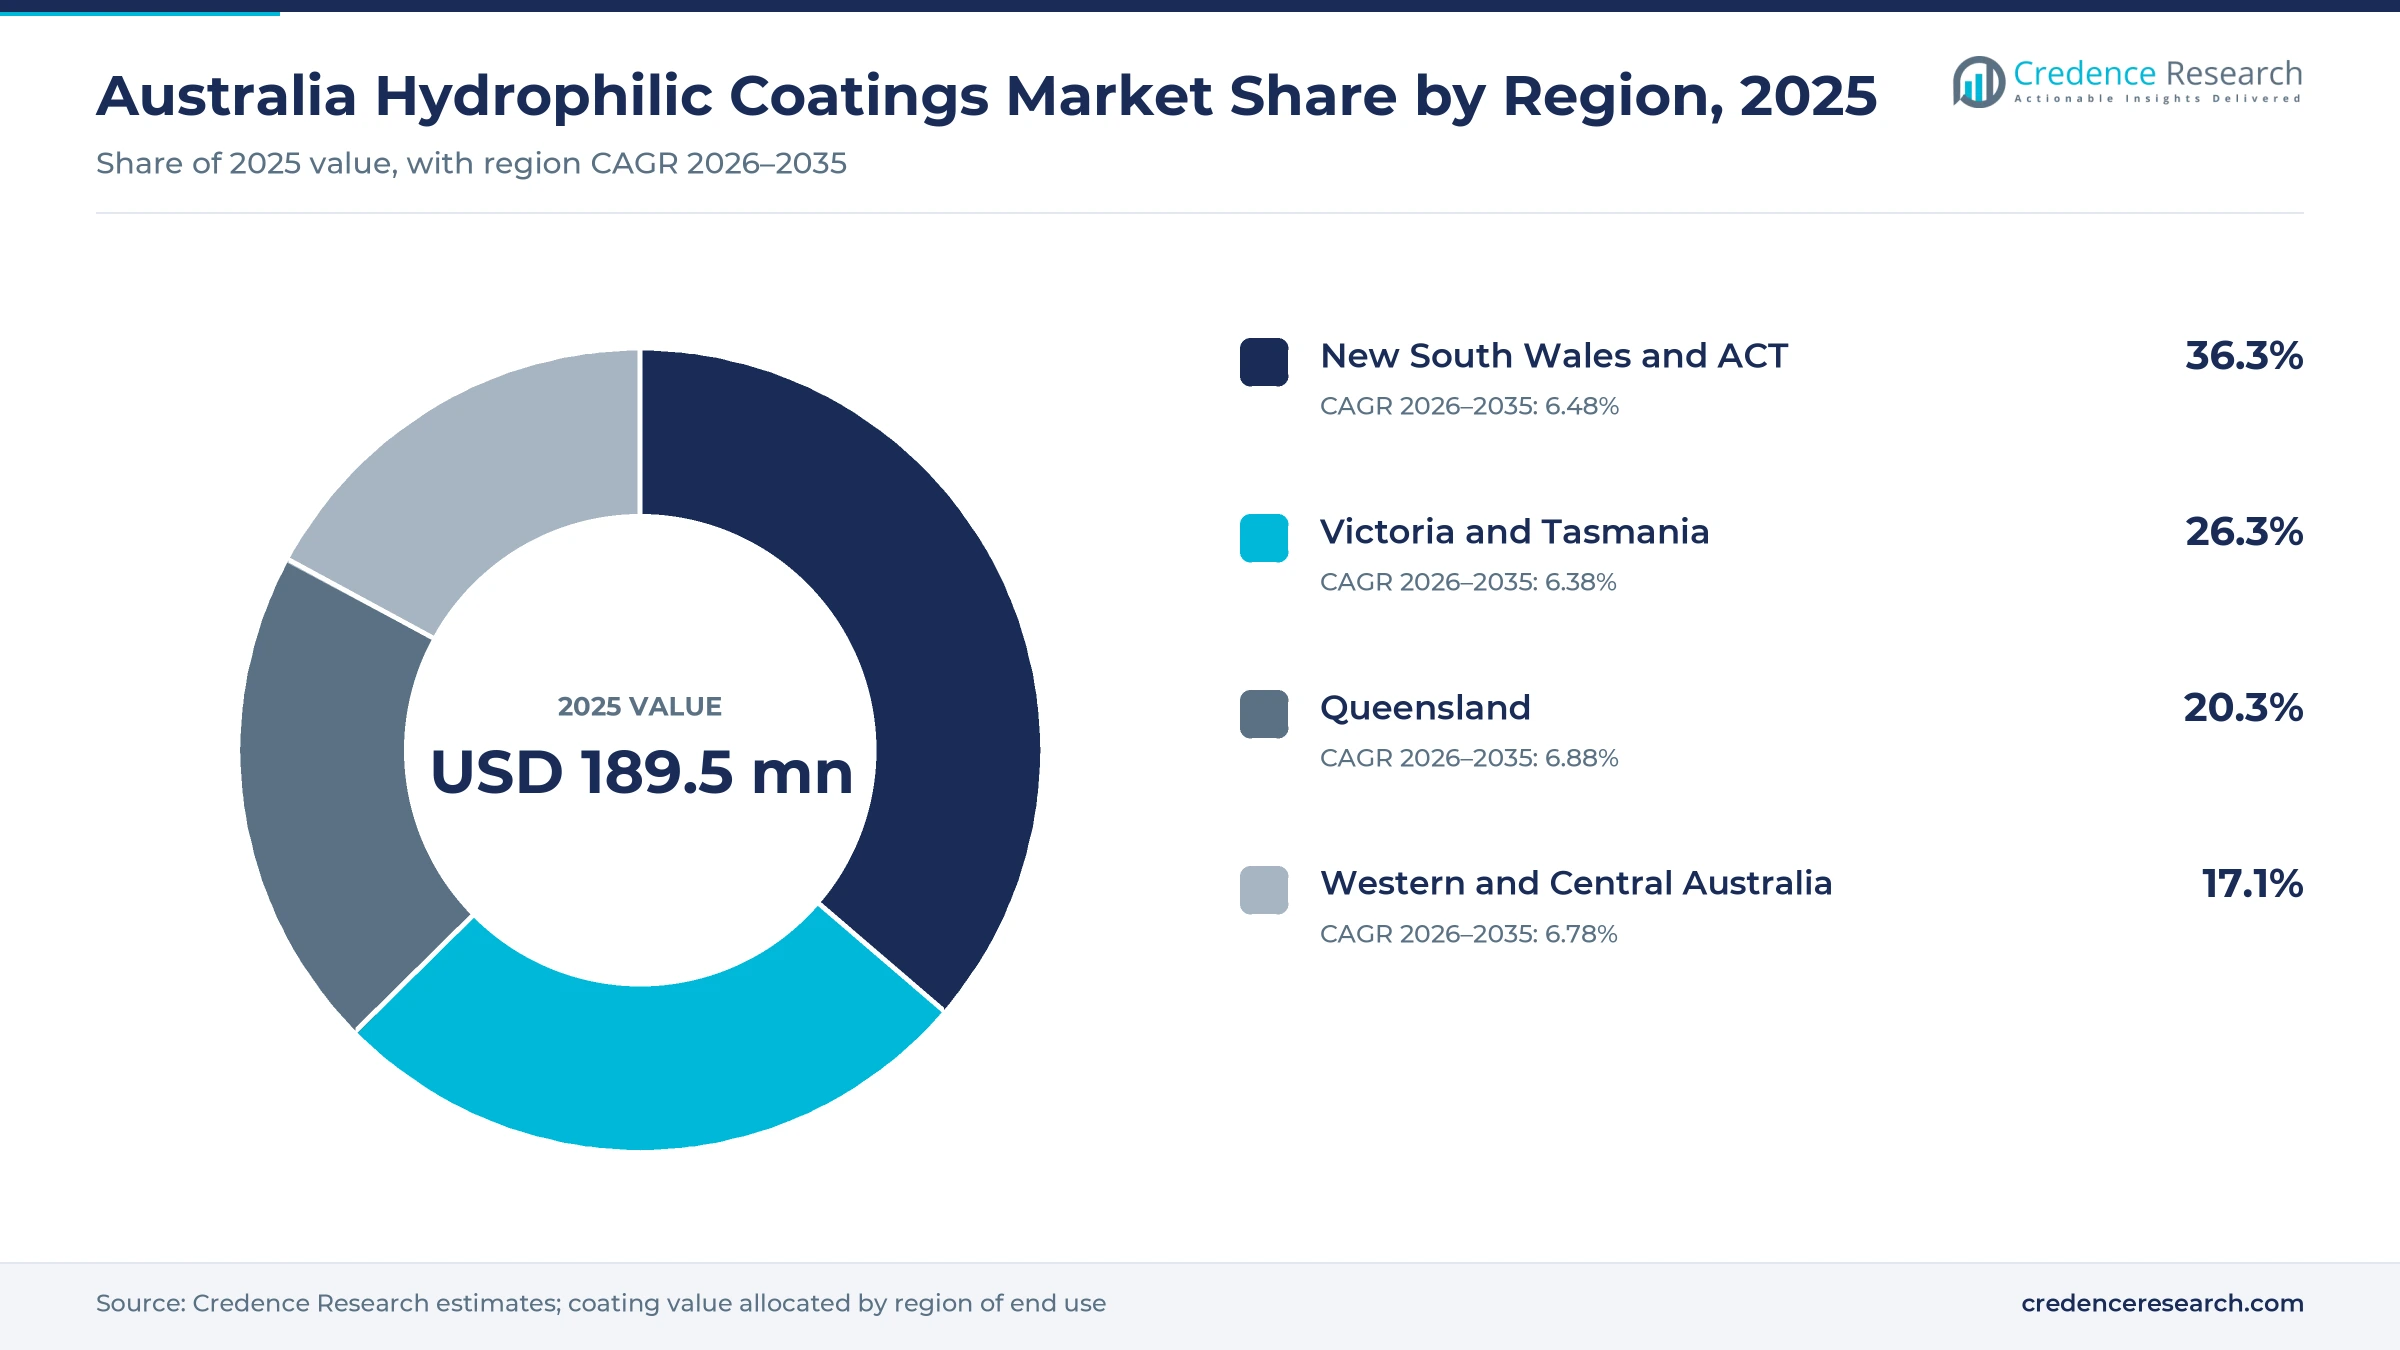
- New South Wales and ACT held a 36.3% share of 2025 value, because the region has the largest population and hospital network.
- Medical devices led end use with a 58.0% share of 2025 value, because catheters and guidewires need low-friction surfaces.
- People aged 65 and over made up 18.09% of the Australian population in 2025, which keeps demand for catheters and vascular devices rising.
- A U.S. court denied a request to block the sale of a leading coating supplier on Nov. 10, 2025, which reshaped global coating supply.
Polymer coatings lead while nanocomposites grow fastest
Why do hydrophilic polymer coatings lead the product mix?
Based on product type, the market is categorized into hydrogel coatings, sol-gel coatings, hydrophilic polymer coatings and hydrophilic nanocomposite coatings. Hydrophilic Polymer Coatings led with a 42.0% share of 2025 value, because they are the standard surface on intermittent catheters and guidewires. Hydrophilic Nanocomposite Coatings grow fastest at 7.76% a year, as makers seek tougher layers that resist wear and particle shedding.
How do medical devices shape coating demand?
Based on end-use industry, the market is categorized into medical devices, industrial and construction equipment, transport equipment and optics and specialty materials. Medical Devices led with a 58.0% share of 2025 value, because intermittent catheters and vascular devices need low-friction surfaces. Medical Devices also grow fastest at 6.83% a year, as device use rises with ageing.
Why does lubricity enhancement dominate applications?
Based on application, the market is categorized into lubricity enhancement, anti-fog performance, wettability control and fouling and cleaning control. Lubricity Enhancement led with a 52.0% share of 2025 value, because catheter and guidewire insertion depends on low friction. Lubricity Enhancement also grows fastest at 6.75% a year, while anti-fog demand follows safety eyewear, visors and antifog additives used in films.
How do UV-cured systems gain share?
Based on technology, the market is categorized into UV-cured systems, thermally cured systems and ambient-cured systems. UV-Cured Systems led with a 46.0% share of 2025 value, because ultraviolet curing is fast and suits high-volume catheter lines. UV-Cured Systems also grow fastest at 7.06% a year, as device makers favor short cure times and lower energy use.
| Segment Group | Leading Sub-segment | Share, 2025 | Fastest-growing Sub-segment | CAGR, 2026–2035 |
|---|---|---|---|---|
| By Product Type | Hydrophilic Polymer Coatings | 42.0% | Hydrophilic Nanocomposite Coatings | 7.76% |
| By End-Use Industry | Medical Devices | 58.0% | Medical Devices | 6.83% |
| By Application | Lubricity Enhancement | 52.0% | Lubricity Enhancement | 6.75% |
| By Technology | UV-Cured Systems | 46.0% | UV-Cured Systems | 7.06% |
Request a Free Sample
Fill in your details and we'll send you a free sample report.
- Sample data tables & charts
- Research methodology
Ageing, proven platforms and clinical evidence lift use
How does ageing-linked device demand lift coating use?
Ageing-linked device demand lifts coating use, because older people use more urinary catheters, vascular devices and continence products. People aged 65 and over made up 18.09% of the Australian population in 2025, up from 17.73% in 2024, according to World Bank data. Almost five in 10 residents of residential aged care live with incontinence, according to the Continence Foundation of Australia. The Australian Bureau of Statistics also reported a population of 27,921,150 at March 31, 2026, which widens the base of device users. As a result, medical devices hold a 58.0% share of 2025 value and grow at 6.83% a year.
Why do established catheter platforms sustain coating demand?
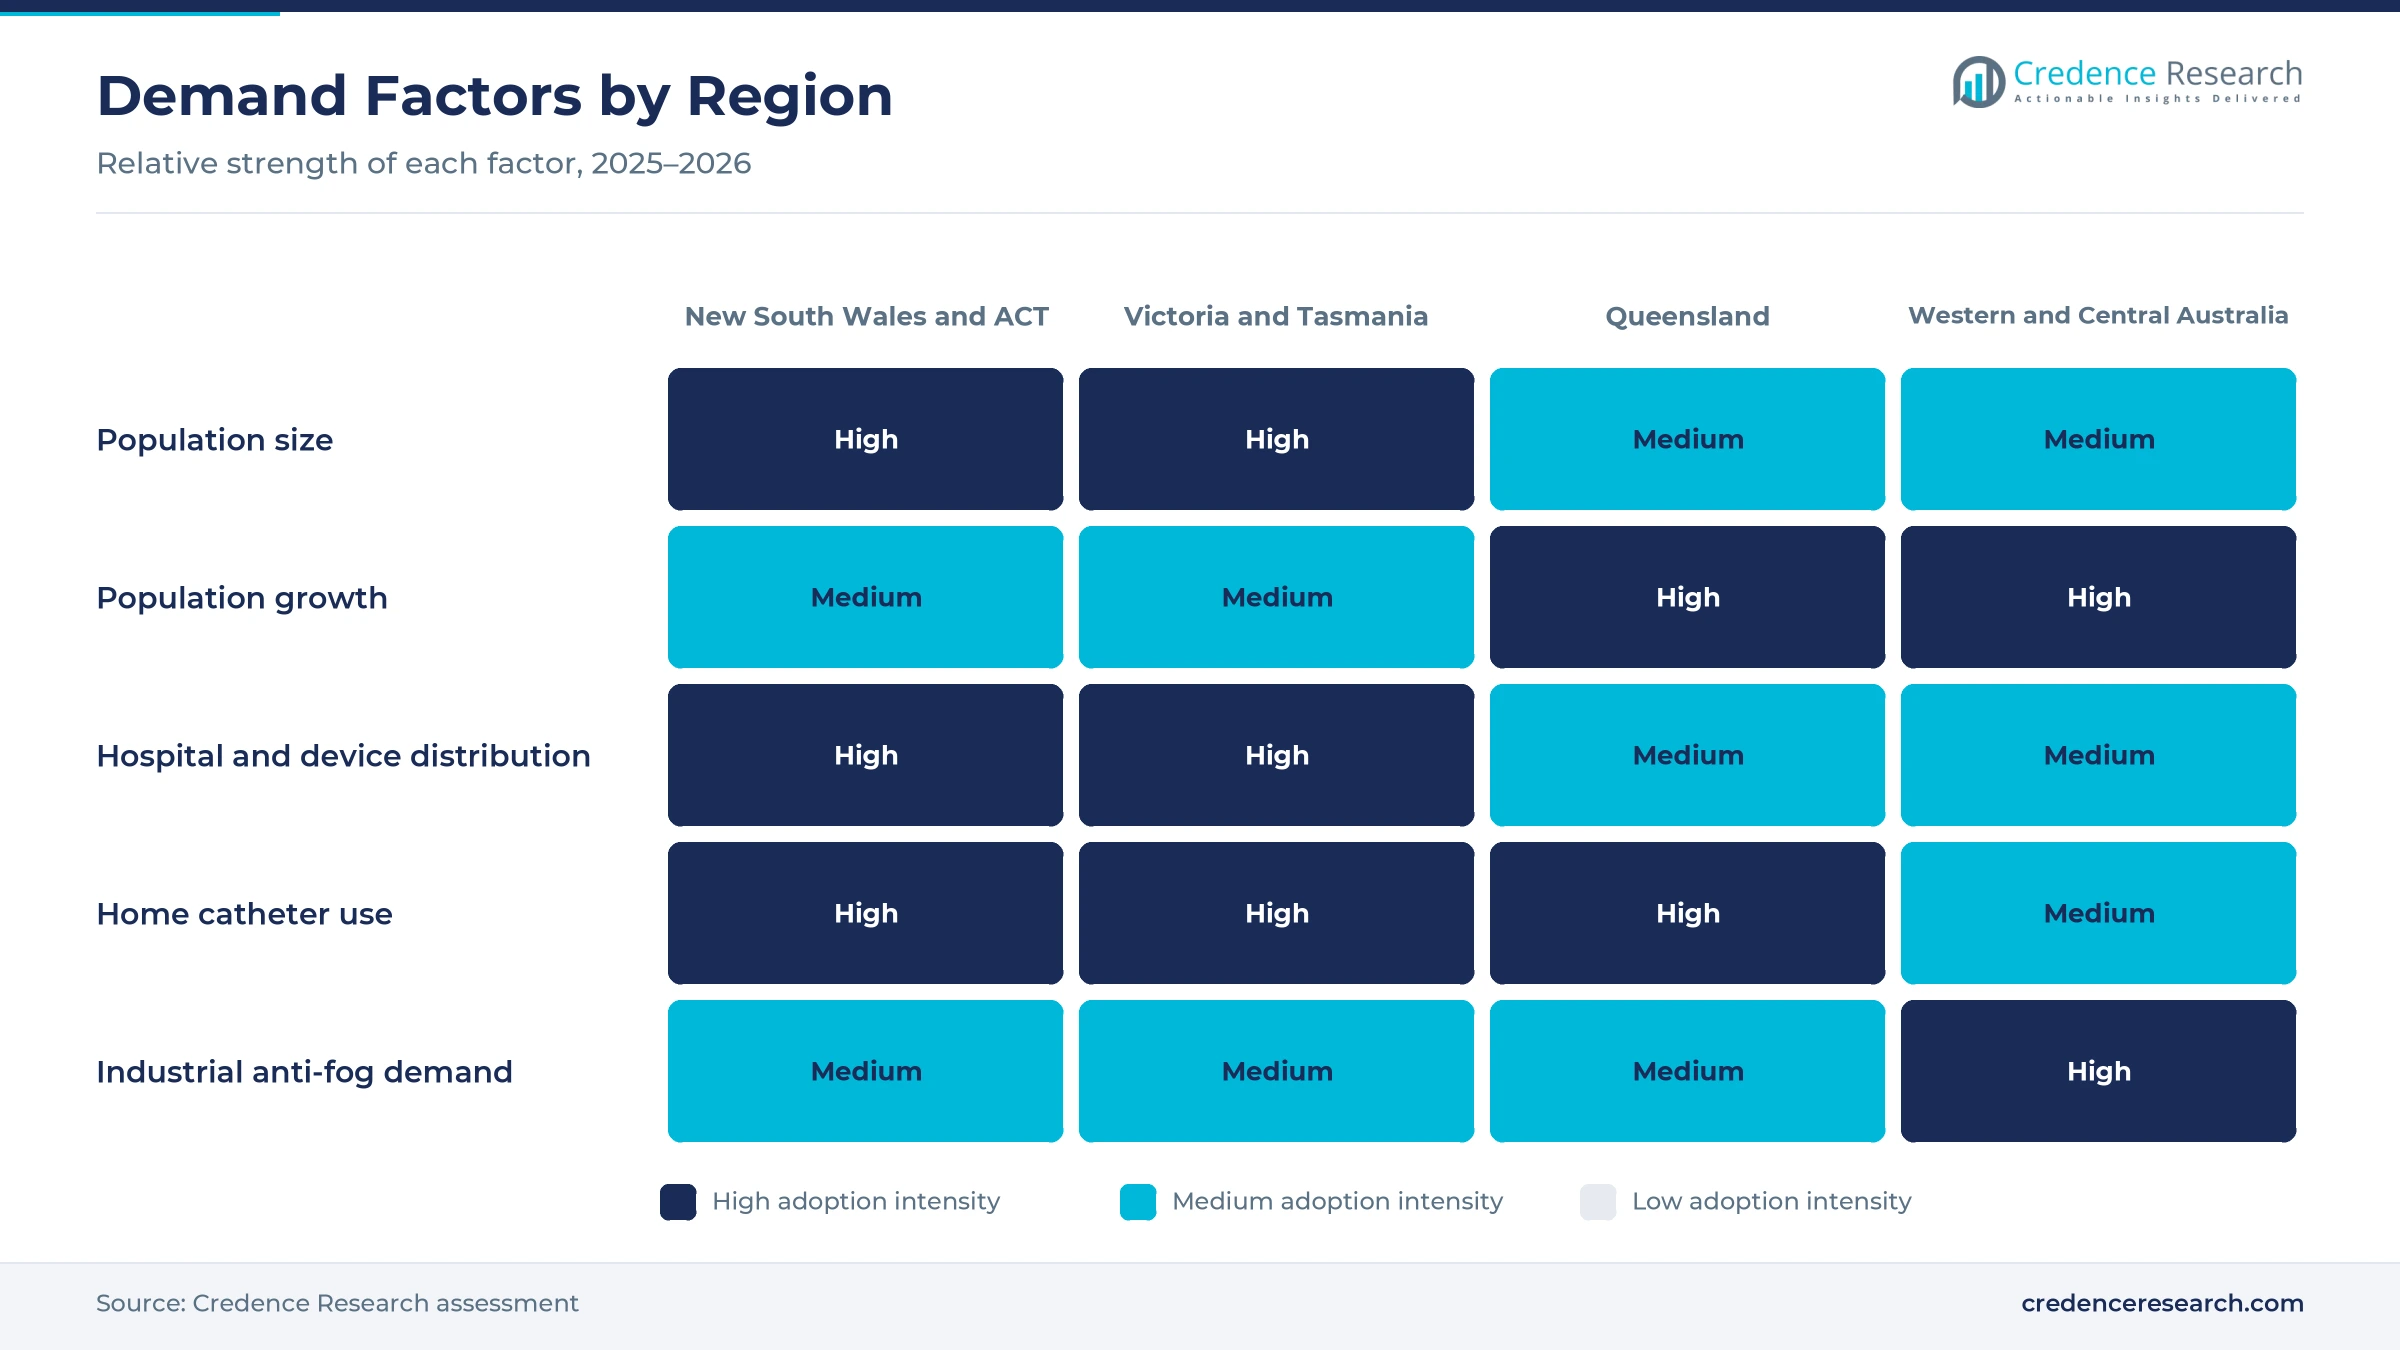
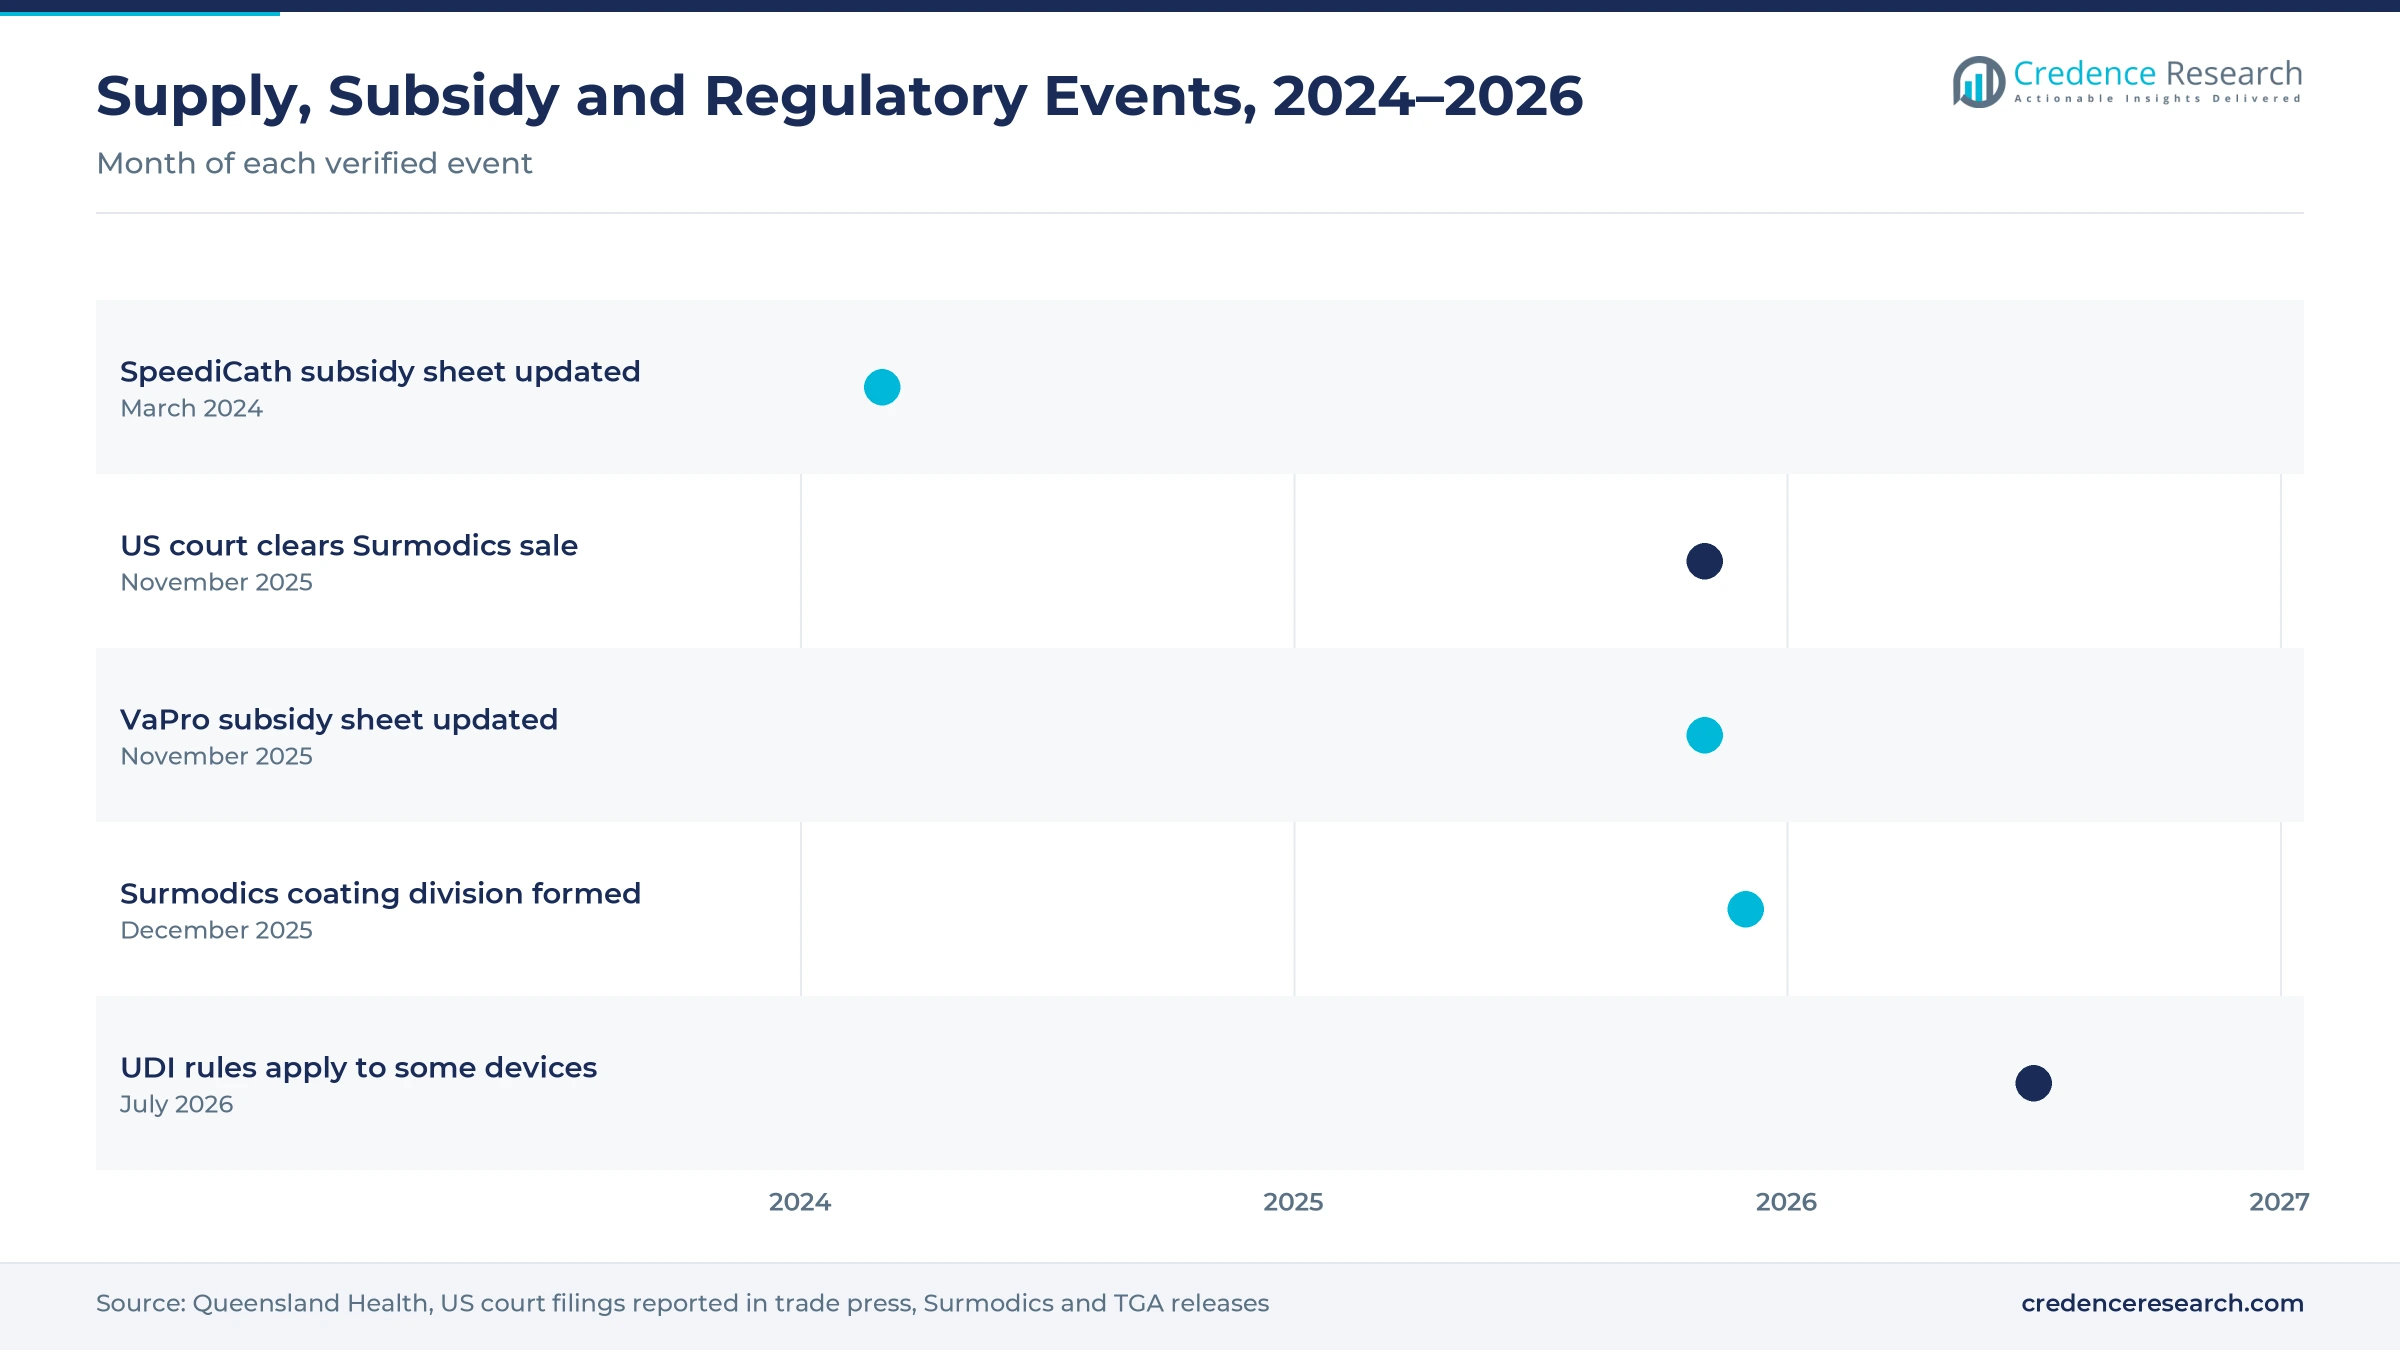
Established hydrophilic device platforms sustain demand, because hospitals and home users stay with catheter brands they already trust and know how to use. The Queensland Medical Aids Subsidy Scheme lists the Hollister VaPro Touch Free pre-lubricated catheter, according to a Queensland Health product sheet updated on Nov. 25, 2025. The same scheme lists Coloplast SpeediCath pre-lubricated catheters in five sizes on a sheet updated on March 14, 2024. Coloplast Australia also sells intermittent catheters, indwelling catheters and urisheaths through its local product range. In turn, lubricity enhancement holds a 52.0% share of 2025 value, because these platforms depend on low-friction surfaces.
How does clinical evidence support premium coated catheters?
Evidence-led premium positioning supports coated catheters, because clinicians and funders want proof of fewer infections before paying more for each device. A meta-analysis of seven randomized trials, published on Jan. 10, 2017, found a risk ratio of 0.84 for urinary tract infections with hydrophilic catheters, according to the U.S. National Library of Medicine. The same review found no significant difference in hematuria between coated and standard catheters. Coloplast also promotes Luja with a lower urinary tract infection risk based on its own risk factor model. As a result, hydrophilic polymer coatings keep a 42.0% share of 2025 value, as buyers favor coatings with published outcome data.
Why does steady health spending support device procurement?
Steady health spending supports device procurement, because hospitals and community programs fund the catheters and vascular devices that carry these surfaces. Australia spent 10.4% of its gross domestic product on health in 2023, up from 9.89% in 2022, according to World Bank data. Recurrent spending on public hospitals reached $103.1 billion in 2023-24, according to the Productivity Commission. Queensland also announced an $18.53 billion Hospital Rescue Plan on June 24, 2025, covering three new and 10 expanded hospitals. In turn, UV-cured systems hold a 46.0% share of 2025 value, because high-volume catheter and guidewire lines supply these growing hospital device orders.
Ready-to-use catheters and traceability reshape supply
How is the shift to ready-to-use catheters changing demand?
The shift to ready-to-use catheters is changing demand, because users want catheters that are wet and slippery straight from the pack. Coloplast Luja catheters, sold through Independence Australia, carry a triple-action coating and more than 80 micro-holes for continuous drainage. Coloplast defines complete emptying with Luja as less than 10 mL of urine left in the bladder. Hollister Australia markets VaPro and Infyna Chic intermittent catheters, and VaPro is sold pre-lubricated for immediate use. As a result, hydrophilic nanocomposite coatings grow at 7.76% a year, the fastest product rate, as makers pair tougher coated catheters with dry sleeves and no-touch tips for home users.
Why is the rise of device traceability gaining weight?
The rise of device traceability is gaining weight, because regulators want every coated device tracked from factory to patient. The Therapeutic Goods Administration introduced unique device identification requirements for some medical devices from July 1, 2026, according to the regulator. Sponsors such as Becton Dickinson and Medtronic Australasia appear in many device records published by the regulator. These sponsors must label and record each covered device under the new rules, which adds work for every coated product line. In turn, UV-cured systems grow at 7.06% a year, the fastest technology rate, as makers favor repeatable, fast and well-documented coating lines.
Can supplier consolidation open room for contract coating?
Supplier consolidation opens room for contract coating, because device makers want a second source after global suppliers merged. GTCR, which already owned a majority stake in Biocoat, agreed to acquire Surmodics in May 2024. Surmodics announced on Nov. 10, 2025 that a U.S. court had denied a request to block the deal, after regulators argued that one owner would control more than half of U.S. hydrophilic coating supply. The judge accepted a partial sale of Biocoat assets to Integer, and the remaining Biocoat business merged into Surmodics in December 2025. As a result, local contract device manufacturing firms can add coating services.
Is there room for community continence care growth?
Community continence care creates room for growth, because most people with bladder problems live at home rather than in hospital or aged care. More than 7.2 million Australians aged over 15 live with incontinence, and nine in 10 of them live in the community. Seven in 10 people with incontinence are under 65, which means many users need discreet devices for work and travel. Almost four in 10 women and two in 10 men are affected. In turn, demand for coated catheters and other continence care products grows through pharmacies, subsidy schemes and home delivery services, which favors compact and ready-to-use designs.
Benefit cuts, supplier concentration and compliance weigh
How do device benefit cuts pressure premium pricing?
Device benefit cuts pressure premium pricing, because private insurers now pay less for many listed devices. The final step of the Prescribed List reforms cut Part A benefits on July 1, 2024, and the program ended on June 30, 2025. In turn, device makers face tighter margins on coated products used in private hospitals. Sellers respond with clinical evidence, bundled supply contracts and lower-cost coating processes that protect margins without cutting quality or patient comfort.
Why does supplier concentration raise supply risk?
Supplier concentration raises supply risk, because a small number of global companies license most medical coating chemistries. U.S. regulators argued in 2025 that one owner would control more than half of U.S. hydrophilic coating supply after a merger. As a result, Australian importers depend on overseas coating decisions they cannot control. A plant outage or licensing change abroad can delay local product launches for months. Device makers respond with dual sourcing, in-house coating lines and long-term supply agreements with coating licensors.
How do compliance rules increase costs for sponsors?
Compliance rules increase costs for sponsors, because coated devices need testing for friction, durability, particles and biocompatibility before supply. New identification and labeling rules also require changes to packaging, software and records. In turn, smaller importers face higher costs per product than large device makers with global regulatory teams. Sponsors respond by sharing test data across markets, using accredited test labs and simplifying their product ranges where sales are low.
Why do durability and particle concerns slow adoption?
Durability and particle concerns slow adoption in some uses, because coatings can wear or shed fragments during long procedures. Clinicians therefore check coating performance closely on guidewires and vascular catheters before switching brands. As a result, makers must prove that coatings stay bonded through repeated insertion and long dwell times. Suppliers respond with tougher crosslinked layers, nanocomposite formulas and better quality checks on coating thickness and adhesion.
New South Wales and ACT lead while Queensland grows fastest
| Region | Value, 2025 (USD million) | Share, 2025 | CAGR, 2026–2035 |
|---|---|---|---|
| New South Wales and ACT | 68.8 | 36.3% | 6.48% |
| Victoria and Tasmania | 49.8 | 26.3% | 6.38% |
| Queensland | 38.5 | 20.3% | 6.88% |
| Western and Central Australia | 32.4 | 17.1% | 6.78% |
Why do new South Wales and ACT hold the largest share?
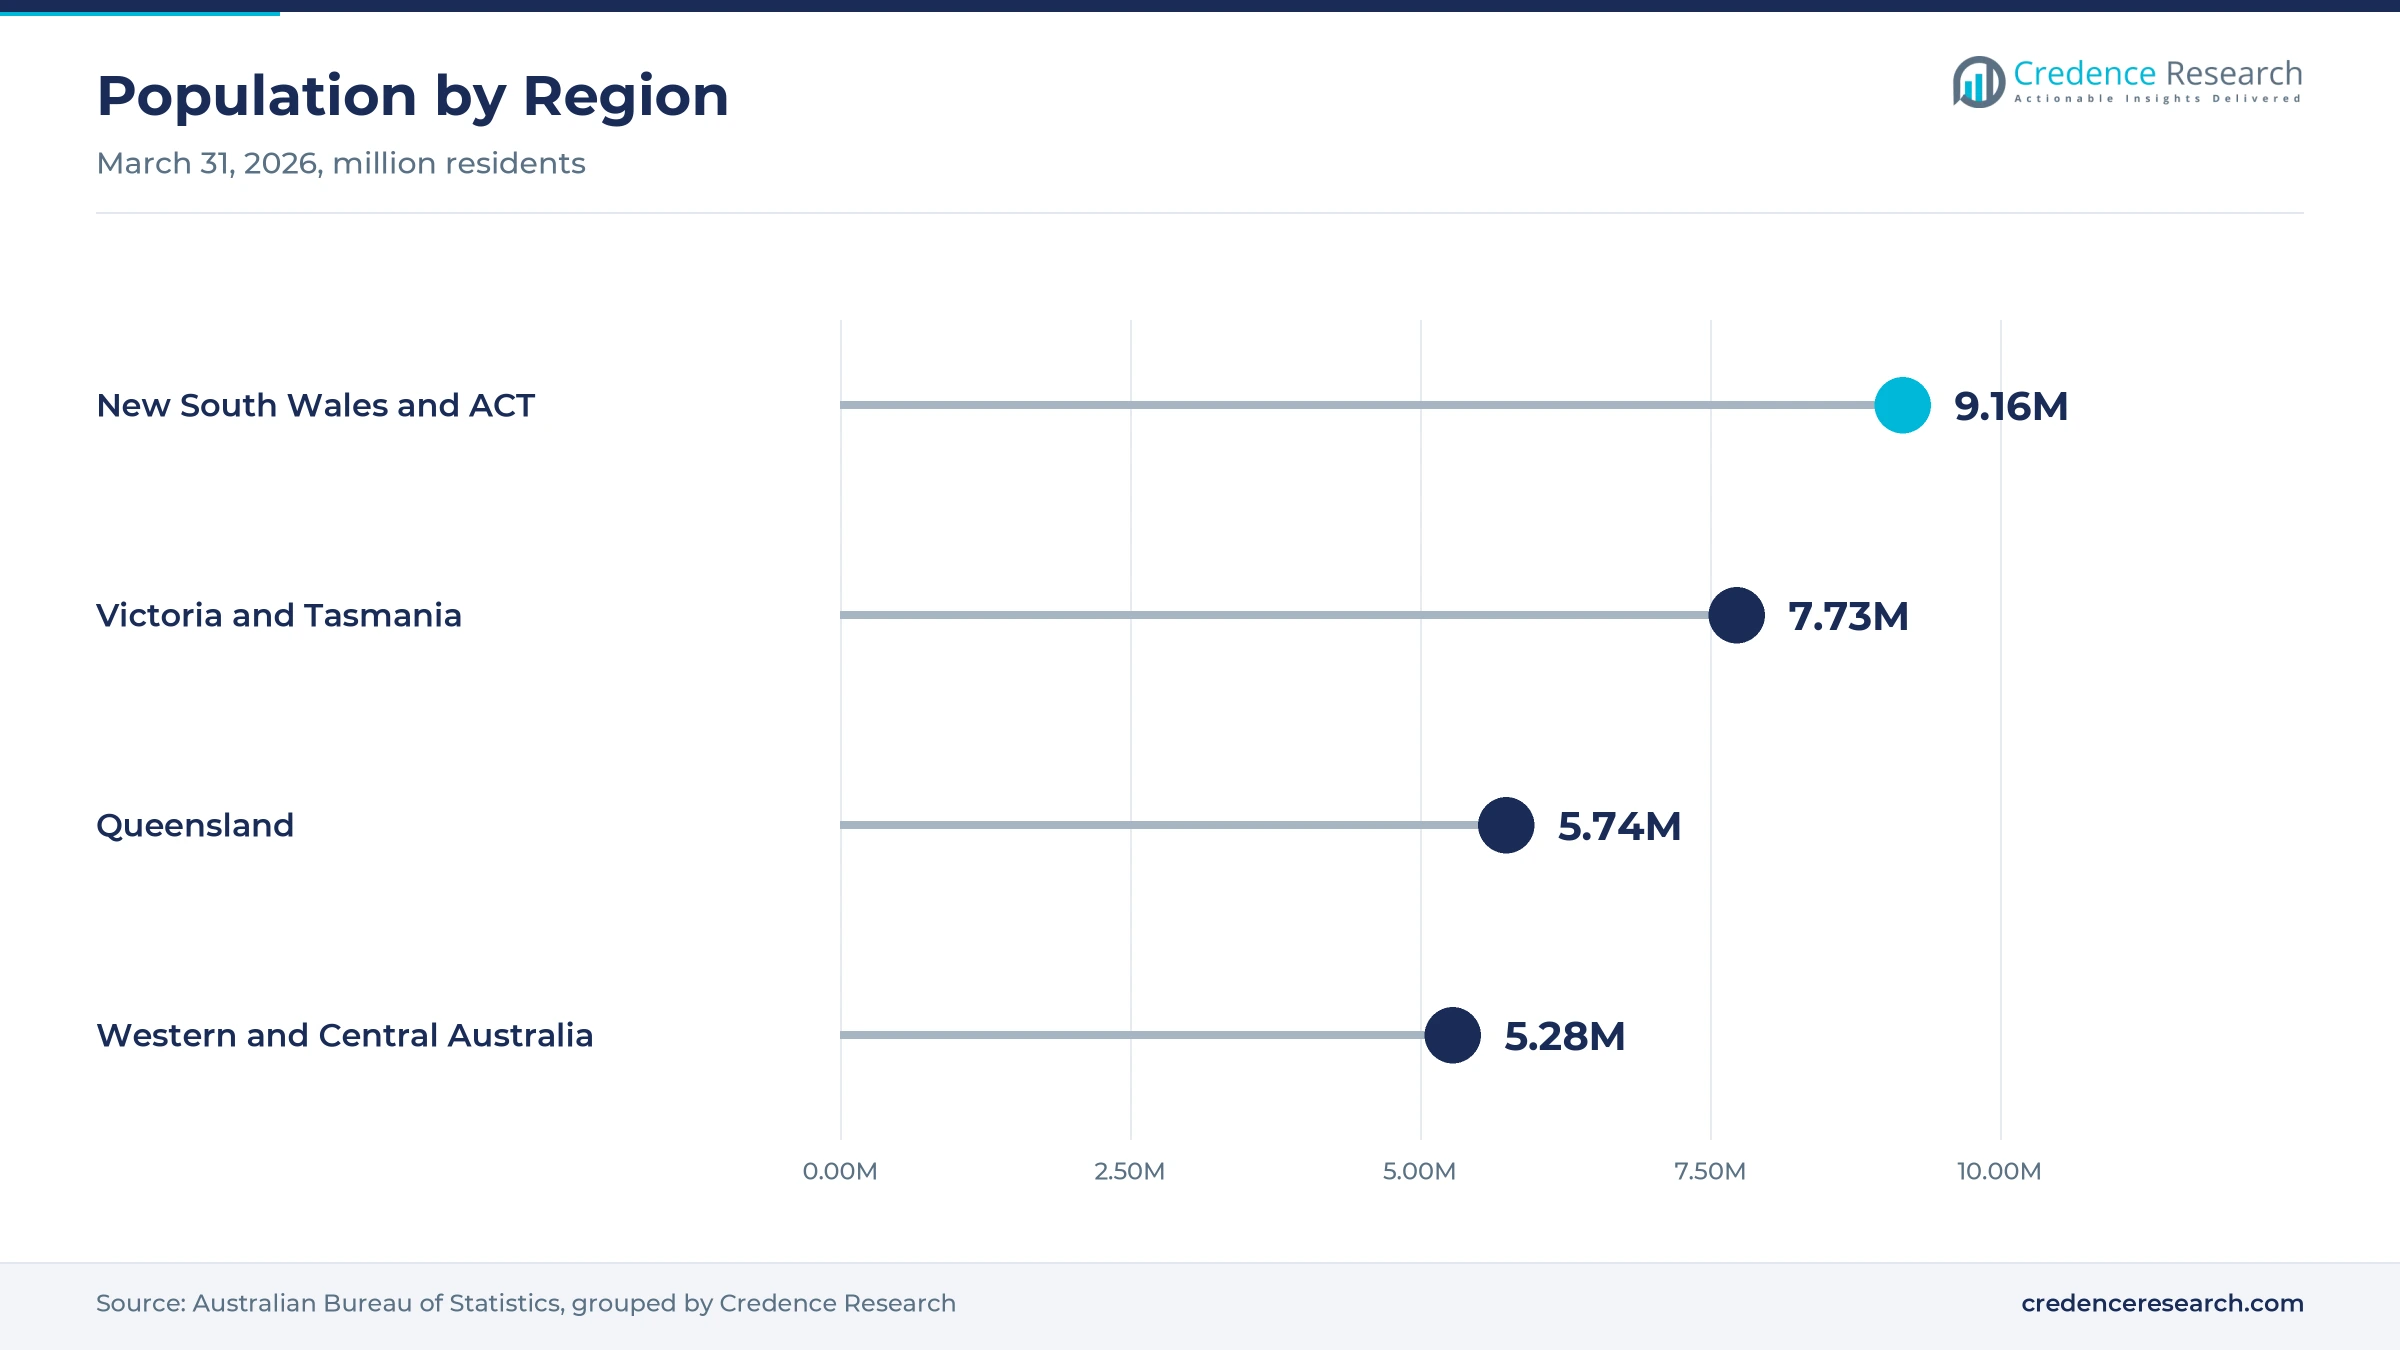
New South Wales and ACT held a 36.3% share of 2025 value and grow at 6.48% a year, because the region had about 9.16 million residents in March 2026. New South Wales added about 97,000 residents in the year to March 2026, a growth rate of 1.1%. However, growth is slower than in Queensland, where the population grew 1.6% over the same year.
How do Victoria and Tasmania support coating demand?
Victoria and Tasmania held a 26.3% share of 2025 value and grow at 6.38% a year, because the region had about 7.73 million residents in March 2026. Victoria added about 109,500 residents in the year to March 2026, the largest increase of any state. Tasmania, however, recorded the slowest population growth of any state, which limits growth in the south of this region.
Why is Queensland the fastest-growing region?
Queensland held a 20.3% share of 2025 value and grows fastest at 6.88% a year, because its population reached about 5.74 million in March 2026. The state Hospital Rescue Plan also funds three new and 10 expanded hospitals, while the Medical Aids Subsidy Scheme supplies pre-lubricated catheters to eligible residents through contracted distributors. As a result, home catheter use adds to hospital demand across the state.
What shapes demand in Western and Central Australia?
Western and Central Australia held a 17.1% share of 2025 value and grows at 6.78% a year, because Western Australia had the fastest population growth of any state. The region had about 5.28 million residents in March 2026 across Western Australia, South Australia and the Northern Territory. Mining and transport users also buy anti-fog and easy-clean surfaces for equipment.
UDI rules and a U.S. court ruling marked 2025 to 2026
| Development | Status and market relevance |
|---|---|
| In March 2024, Queensland Health updated its subsidy sheet for Coloplast SpeediCath pre-lubricated catheters. | Lists five sizes for eligible residents |
| In November 2025, a U.S. court denied a request to block the sale of Surmodics. | Cleared a deal that reshaped global coating supply |
| In November 2025, Queensland Health updated its subsidy sheet for Hollister VaPro Touch Free catheters. | Keeps coated catheters available to home users |
| In December 2025, Biocoat became Surmodics Services & Technologies. | Supplies hydrophilic coatings to device makers worldwide |
| In July 2026, unique device identification rules began to apply to some medical devices in Australia. | Adds labeling and record duties for coated device sponsors |
UV curing, hydrogels and nanocomposite layers spread
- UV-cured hydrophilic layers harden in seconds under ultraviolet light, which suits high-volume catheter and guidewire lines.
- Hydrogel coatings absorb water to form a slippery film, which lets catheters slide easily without added lubricant.
- Nanocomposite coatings add tiny particles to the polymer layer, which improves wear resistance and reduces particle shedding.
- Inline friction and thickness testing checks every batch before release, which gives sponsors records for regulators and hospital buyers.
Need a Custom Version of This Report?
Tailor the scope, geography, or segments to your exact requirements.
- Custom geography or segment scope
- Direct access to our analyst team
Device makers compete on comfort and infection outcomes
Competition is led by global device makers that sell coated catheters, guidewires and vascular devices through Australian subsidiaries. Coloplast Australia and Hollister Australia compete in intermittent catheters with SpeediCath, Luja, VaPro and Infyna Chic, which reach users through hospitals, subsidy schemes and home delivery distributors. Becton Dickinson Australia, Medtronic Australasia and Teleflex Australia supply catheters and vascular devices to hospitals and appear as sponsors in regulator records. Companies compete on comfort, infection outcomes, ease of use and clinical evidence rather than on price alone. Coating chemistry is often licensed from global specialists, so supply agreements and second sources matter. Local contract coating applicators remain small, which leaves room for growth if device makers add domestic finishing lines.
Companies profiled and their roles in this market
| Company | Type | Role in the market |
|---|---|---|
| Coloplast Australia | Device maker | Sells SpeediCath and Luja intermittent catheters |
| Hollister Australia | Device maker | Sells VaPro and Infyna Chic intermittent catheters |
| Becton Dickinson Australia | Device sponsor | Listed by the regulator as a sponsor of catheter products |
| Medtronic Australasia | Device sponsor | Appears in many device records published by the regulator |
| Teleflex Australia | Device maker | Runs a regional office serving Australia and New Zealand |
Credence Research view on Australian lubricious surfaces
Credence Research's view is that Australian demand for lubricious and wettable surfaces will grow steadily because an ageing population uses more catheters and vascular devices. Hydrophilic polymer coatings remain the base of the market, while nanocomposite coatings grow fastest. Clinical evidence of fewer urinary tract infections supports premium coated catheters. However, benefit cuts, supplier concentration and new labeling rules will keep pressure on sellers. Companies that combine proven coatings, clinical data and reliable supply should gain share fastest.
How the Australian surface coating estimate was built
The report uses 2025 as the base year on a calendar basis, and market values come from the Credence Research model. That model combines population and ageing statistics, health spending data, subsidy scheme listings, regulator rules, published clinical research and company information on coated products. Segment splits and regional growth rates are Credence Research estimates, while regional shares follow the client-defined split. Sources used are public reports, official statistics, regulator and government websites, scientific journals and company websites, and no interviews or surveys were used.
Ageing and device use carry lubricious surfaces to 2035
Coating value is expected to reach USD 358.4 million by 2035, a 6.59% CAGR during 2026–2035, as ageing and device use keep demand rising. Growth should stay steady through 2028 while sponsors adapt to identification rules and new supply arrangements. After that, nanocomposite and UV-cured coatings will carry more growth as makers seek tougher, faster surfaces. Further benefit cuts would lower this outlook, while wider subsidy coverage for coated catheters would raise it. Companies with proven clinical data and secure coating supply are expected to gain the most.
Frequently Asked Questions
How big is the Australia hydrophilic coatings market?
Which product type leads coating demand in Australia?
Which region leads the Australia hydrophilic coatings market?
Why do medical devices dominate coating demand?
Do coated catheters reduce urinary tract infections?
How do new identification rules affect coated devices?
Who are the leading companies in Australian coated devices?
What are the main challenges for coating suppliers?
Table of Content
Chapter 1 Market Segmentation
- 1.1 Segmentation Framework
- 1.1.1 Product and Service Classification
- 1.1.2 Application and End-Use Classification
- 1.1.3 Technology and Solution Classification
- 1.1.4 Customer and Distribution Channel Classification
- 1.1.5 Geographic Segmentation
- 1.1.6 Market Segment Definitions and Boundaries
- 1.2 By Product Type
- 1.2.1 Hydrophilic Polymer Coatings
- 1.2.2 Hydrogel Coatings
- 1.2.3 Sol-Gel Coatings
- 1.2.4 Hydrophilic Nanocomposite Coatings
- 1.3 By End-Use Industry
- 1.3.1 Medical Devices
- 1.3.2 Optics and Specialty Materials
- 1.3.3 Industrial and Construction Equipment
- 1.3.4 Transport Equipment
- 1.4 By Application
- 1.4.1 Lubricity Enhancement
- 1.4.2 Anti-Fog Performance
- 1.4.3 Wettability Control
- 1.4.4 Fouling and Cleaning Control
- 1.5 By Technology
- 1.5.1 UV-Cured Systems
- 1.5.2 Thermally Cured Systems
- 1.5.3 Ambient-Cured Systems
Chapter 2 Introduction
- 2.1 Report Objectives and Scope
- 2.2 Product Definition and Industry Terminology
- 2.3 Market Inclusions and Exclusions
- 2.4 Research Process
- 2.4.1 Primary Research and Expert Interviews
- 2.4.2 Secondary Research and Source Review
- 2.4.3 Top-Down and Bottom-Up Estimation
- 2.4.4 Data Triangulation and Verification
- 2.5 Market Size Measurement Basis
- 2.5.1 2025: USD 189.5 million → 2035: USD 358.4 million
- 2.6 Historical and Forecast Reference Periods
- 2.6.1 Historical Period: 2018-2025
- 2.6.2 Base Year: 2025
- 2.6.3 Forecast Period: 2025-2035
- 2.7 Research Assumptions and Limitations
Chapter 3 Executive Summary
- 3.1 Market Snapshot and Key Findings
- 3.2 Base-Year Market Size, 2025
- 3.3 Forecast Market Size, 2035
- 3.4 Revenue and Volume Growth Outlook
- 3.5 Key Demand and Supply Indicators
- 3.6 Leading Market Segments
- 3.7 Fastest-Growing Market Opportunities
- 3.8 Regional Performance Highlights
- 3.9 Technology and Industry Transformation
- 3.10 Competitive Landscape Summary
- 3.11 Analyst View and Strategic Implications
Chapter 4 Australia Hydrophilic Coatings Market Trends and Developments
- 4.1 Historical Industry Development, 2018-2025
- 4.2 Recent Market Trends and Developments
- 4.3 Demand and Customer Behavior Trends
- 4.4 Technology and Product Innovation
- 4.5 Artificial Intelligence, Automation and Digitalization
- 4.6 Local Manufacturing and Supply Chain Realignment
- 4.7 Industry Partnerships, Mergers and Acquisitions
- 4.8 Sustainability and Circular Economy Developments
- 4.9 Government and Private Sector Investment Trends
- 4.10 Emerging Business Models and Commercialization
- 4.11 Industry Developments and Announcements
Chapter 5 Australia Hydrophilic Coatings Market Production, Supply and Demand Analysis
- 5.1 Demand Trend and Consumption Analysis, 2018-2025
- 5.2 Demand Forecast, 2025-2035
- 5.3 Production and Output Trend, 2018-2025
- 5.4 Production and Output Forecast, 2025-2035
- 5.5 Installed Capacity and Capacity Utilization
- 5.6 Company-Wise Production Plants and Statistics
- 5.6.1 Installed Production Capacity
- 5.6.2 Actual Production
- 5.6.3 Planned Capacity and Expansion Targets
- 5.7 Supply Chain Structure and Procurement Trends
- 5.8 Supply-Demand Gap and Bottlenecks
- 5.9 Import Dependence and Sourcing Structure
- 5.10 Contract Manufacturing and Outsourcing
- 5.11 Regional Supply and Demand Concentration
Chapter 6 Australia Hydrophilic Coatings Market Pricing Analysis
- 6.1 Pricing Structure and Measurement
- 6.2 Historical Pricing Trends, 2018-2025
- 6.3 Pricing Outlook, 2025-2035
- 6.4 Average Selling Price and Unit Economics
- 6.5 Pricing by Product and Market Segment
- 6.6 Geographic Pricing Differences
- 6.7 Key Input, Energy, Labor and Logistics Costs
- 6.8 Contract Pricing and Purchasing Models
- 6.9 Pricing Sensitivity and Competitive Positioning
- 6.10 Price, Margin and Profitability Implications
Chapter 7 Australia Hydrophilic Coatings Market Dynamics
- 7.1 Market Growth Drivers
- 7.1.1 Demand-Side Drivers
- 7.1.2 Technology and Innovation Drivers
- 7.1.3 Infrastructure and Investment Drivers
- 7.1.4 Regulatory and Policy Drivers
- 7.2 Market Restraints
- 7.2.1 Cost and Affordability Constraints
- 7.2.2 Technology and Adoption Barriers
- 7.2.3 Supply Chain and Operational Constraints
- 7.3 Market Challenges
- 7.3.1 Competitive Pressure and Margin Erosion
- 7.3.2 Skills, Infrastructure and Implementation Gaps
- 7.4 Emerging Market Opportunities
- 7.5 Market Dynamics Impact and Time-Horizon Assessment
Chapter 8 Australia Hydrophilic Coatings Value Chain Analysis
- 8.1 Industry Value Chain Overview
- 8.2 Upstream Suppliers and Critical Inputs
- 8.3 Technology and Component Providers
- 8.4 Manufacturing or Service Delivery
- 8.5 Distribution, Channel Partners and Integrators
- 8.6 Downstream Applications and End Users
- 8.7 Value Addition and Profit Pools
- 8.8 Vertical Integration and Outsourcing
- 8.9 Supplier Concentration and Risk
- 8.10 Supply Chain Localization and Resilience
Chapter 9 Australia Hydrophilic Coatings Market Regulations and Policies
- 9.1 Relevant Laws, Standards and Compliance Frameworks
- 9.2 Product, Service, Safety and Quality Requirements
- 9.3 Government Policies, Incentives and Subsidies
- 9.4 Imports, Exports and Trade Barriers
- 9.5 Public Procurement and Local Content Requirements
- 9.6 Environmental and Sustainability Compliance
- 9.7 Upcoming Policy Changes and Market Implications
Chapter 10 Australia Hydrophilic Coatings Market Hotspots and Opportunities
- 10.1 Market Opportunity Mapping and Growth Hotspots
- 10.2 High-Growth Applications and Customer Groups
- 10.3 Underserved Markets and White-Space Opportunities
- 10.4 Emerging Technology and Product Opportunities
- 10.5 New Capacity and Investment Hotspots
- 10.6 Market Entry and Expansion Opportunities
- 10.7 Distribution and Partnership Opportunities
- 10.8 Near-Term and Long-Term Commercial Potential
- 10.9 Opportunity Attractiveness and Execution Risks
Chapter 11 Australia Hydrophilic Coatings Market Outlook, 2025-2035
- 11.1 Market Size and Analysis
- 11.1.1 Revenue (Market Measurement: 2025: USD 189.5 million → 2035: USD 358.4 million)
- 11.1.2 Market Volume and Quantity Sold
- 11.1.3 Historical Market Size, 2018-2025
- 11.1.4 Base-Year Market Size, 2025
- 11.2 Market Forecast, 2025-2035
- 11.2.1 Revenue Forecast to 2035
- 11.2.2 Volume Forecast to 2035
- 11.2.3 CAGR and Year-on-Year Growth
- 11.2.4 Incremental Revenue Opportunity
- 11.3 Forecast Assumptions and Scenario Analysis
- 11.3.1 Base-Case Forecast
- 11.3.2 Optimistic and Conservative Scenarios
- 11.3.3 Technology, Pricing and Policy Sensitivities
- 11.4 Market Attractiveness and Growth Outlook
Chapter 12 Australia Hydrophilic Coatings Market Segmentation and Outlook
- 12.1 Segmentation Summary and Market Shares, 2025
- 12.2 Largest and Fastest-Growing Segments
- 12.3 By Product Type - Market Size and Forecast, 2025-2035
- 12.3.1 Segment Definition and Scope
- 12.3.2 Historical Market Size, 2018-2025
- 12.3.3 Revenue Forecast, 2025-2035
- 12.3.4 Volume Forecast, 2025-2035
- 12.3.5 Base-Year Market Share, 2025
- 12.3.6 Segment CAGR and Growth Drivers
- 12.3.7 Subsegment Market Size and Forecast
- 12.3.7.1 Hydrophilic Polymer Coatings
- 12.3.7.2 Hydrogel Coatings
- 12.3.7.3 Sol-Gel Coatings
- 12.3.7.4 Hydrophilic Nanocomposite Coatings
- 12.3.8 Subsegment Pricing and Adoption Trends
- 12.3.9 Leading Suppliers and Competition
- 12.3.10 Regional Demand and Opportunities
- 12.4 By End-Use Industry - Market Size and Forecast, 2025-2035
- 12.4.1 Segment Definition and Scope
- 12.4.2 Historical Market Size, 2018-2025
- 12.4.3 Revenue Forecast, 2025-2035
- 12.4.4 Volume Forecast, 2025-2035
- 12.4.5 Base-Year Market Share, 2025
- 12.4.6 Segment CAGR and Growth Drivers
- 12.4.7 Subsegment Market Size and Forecast
- 12.4.7.1 Medical Devices
- 12.4.7.2 Optics and Specialty Materials
- 12.4.7.3 Industrial and Construction Equipment
- 12.4.7.4 Transport Equipment
- 12.4.8 Subsegment Pricing and Adoption Trends
- 12.4.9 Leading Suppliers and Competition
- 12.4.10 Regional Demand and Opportunities
- 12.5 By Application - Market Size and Forecast, 2025-2035
- 12.5.1 Segment Definition and Scope
- 12.5.2 Historical Market Size, 2018-2025
- 12.5.3 Revenue Forecast, 2025-2035
- 12.5.4 Volume Forecast, 2025-2035
- 12.5.5 Base-Year Market Share, 2025
- 12.5.6 Segment CAGR and Growth Drivers
- 12.5.7 Subsegment Market Size and Forecast
- 12.5.7.1 Lubricity Enhancement
- 12.5.7.2 Anti-Fog Performance
- 12.5.7.3 Wettability Control
- 12.5.7.4 Fouling and Cleaning Control
- 12.5.8 Subsegment Pricing and Adoption Trends
- 12.5.9 Leading Suppliers and Competition
- 12.5.10 Regional Demand and Opportunities
- 12.6 By Technology - Market Size and Forecast, 2025-2035
- 12.6.1 Segment Definition and Scope
- 12.6.2 Historical Market Size, 2018-2025
- 12.6.3 Revenue Forecast, 2025-2035
- 12.6.4 Volume Forecast, 2025-2035
- 12.6.5 Base-Year Market Share, 2025
- 12.6.6 Segment CAGR and Growth Drivers
- 12.6.7 Subsegment Market Size and Forecast
- 12.6.7.1 UV-Cured Systems
- 12.6.7.2 Thermally Cured Systems
- 12.6.7.3 Ambient-Cured Systems
- 12.6.8 Subsegment Pricing and Adoption Trends
- 12.6.9 Leading Suppliers and Competition
- 12.6.10 Regional Demand and Opportunities
- 12.7 Segment Growth Comparison
- 12.8 Segment Attractiveness and Priority Matrix
Chapter 13 Australia Hydrophilic Coatings End-Use and Application Market Outlook
- 13.1 End-Use Industry and Customer Demand Structure
- 13.2 Leading Applications and Customer Groups
- 13.3 End-Use Market Size, Share and Forecast
- 13.4 Major End-Use Industry Deep Dives
- 13.4.1 Customer Requirements and Use Cases
- 13.4.2 Demand and Replacement Cycles
- 13.4.3 Technical and Regulatory Considerations
- 13.4.4 Purchasing and Procurement Models
- 13.4.5 Leading Vendors and Distribution Channels
- 13.4.6 Forecast and Commercial Opportunities
- 13.5 Emerging Applications and Cross-Segment Demand
- 13.6 End-Use Industry Investment Priorities
Chapter 14 Australia Hydrophilic Coatings Geographic Market Outlook, 2025-2035
- 14.1 Domestic Market Distribution and Demand Clusters
- 14.2 State- or Province-Wise Market Size and Forecast, 2025-2035
- 14.3 City and Metropolitan Market Outlook
- 14.4 Industrial, Manufacturing and Commercial Clusters
- 14.5 Geographic Concentration of Key End Users
- 14.6 Local Pricing and Purchasing Differences
- 14.7 Domestic Production Facilities and Capacity Map
- 14.8 Local Infrastructure and Project Pipeline
- 14.9 State-Level Policy and Incentive Differences
- 14.10 Subnational Investment Hotspots and Opportunities
- 14.11 Distribution and Logistics Networks
- 14.12 Domestic Competitive Footprint
Chapter 15 Australia Hydrophilic Coatings Technology, Innovation and Sustainability Outlook
- 15.1 Technology Landscape and Maturity
- 15.2 Product, Process and Service Innovation
- 15.3 AI, Automation and Digital Tools in the Industry
- 15.4 Technology Adoption and Performance Benchmarking
- 15.5 Innovation Pipeline and R&D Investment
- 15.6 Patent and Intellectual Property Trends
- 15.7 Energy Efficiency and Resource Management
- 15.8 Sustainability, Recycling and Circularity
- 15.9 Technology Roadmap, 2025-2035
- 15.10 Risks of Obsolescence and Technology Substitution
Chapter 16 Australia Hydrophilic Coatings Market Key Strategic Imperatives
- 16.1 Growth and Market Entry Priorities
- 16.2 High-Return Products and Segments
- 16.3 Pricing, Profitability and Cost Optimization
- 16.4 Technology Investment and Product Differentiation
- 16.5 Supply Chain Localization and Resilience
- 16.6 Distribution and Customer Acquisition
- 16.7 Partnership, Acquisition and Capacity Strategy
- 16.8 Regional Expansion Priorities
- 16.9 Short-, Medium- and Long-Term Actions
Chapter 17 Competition Outlook
- 17.1 Industry Competition Characteristics
- 17.2 Market Structure and Concentration
- 17.3 Market Share and Competitive Positioning, 2025
- 17.4 Company-Wise Revenue and Product Benchmarking
- 17.5 Production and Service Capacity Benchmarking
- 17.6 Technology, Pricing and Differentiation
- 17.7 Regional Footprint and Distribution Strength
- 17.8 Mergers, Acquisitions and Strategic Alliances
- 17.9 New Entrants and Competitive Threats
- 17.10 Porter's Five Forces and Industry Attractiveness
- 17.11 Competitive Outlook, 2025-2035
Chapter 18 Company Profiles
- 18.1 Company Coverage and Selection Criteria
- 18.2 Becton Dickinson Australia
- 18.2.1 Business Description
- 18.2.2 Company Ownership and Geographic Presence
- 18.2.3 Product and Service Portfolio
- 18.2.4 Manufacturing and Operating Footprint
- 18.2.5 Production Capacity and Expansion Plans
- 18.2.6 Financial Performance and Investment
- 18.2.7 Market Share and Competitive Position
- 18.2.8 Technology and Innovation Capabilities
- 18.2.9 Strategic Alliances or Partnerships
- 18.2.10 Recent Developments
- 18.2.11 Growth Strategy and Outlook
- 18.3 Coloplast Australia
- 18.4 Hollister Australia
- 18.5 Medtronic Australasia
- 18.6 Teleflex Australia
- 18.7 Other Relevant Market Participants
Note: Every listed company is profiled on the structure shown under the first company. The company list is preliminary and may change based on research findings, market developments, data availability and client requirements.
Chapter 19 Disclaimer
- 19.1 Research and Forecast Disclaimer
- 19.2 Data Source and Estimation Limitations
Note: The depth of individual sections depends on data availability for this market. Volume, capacity, trade and other unit-based metrics are included where applicable.

