
Faster broadband turns streaming into a mainstream habit
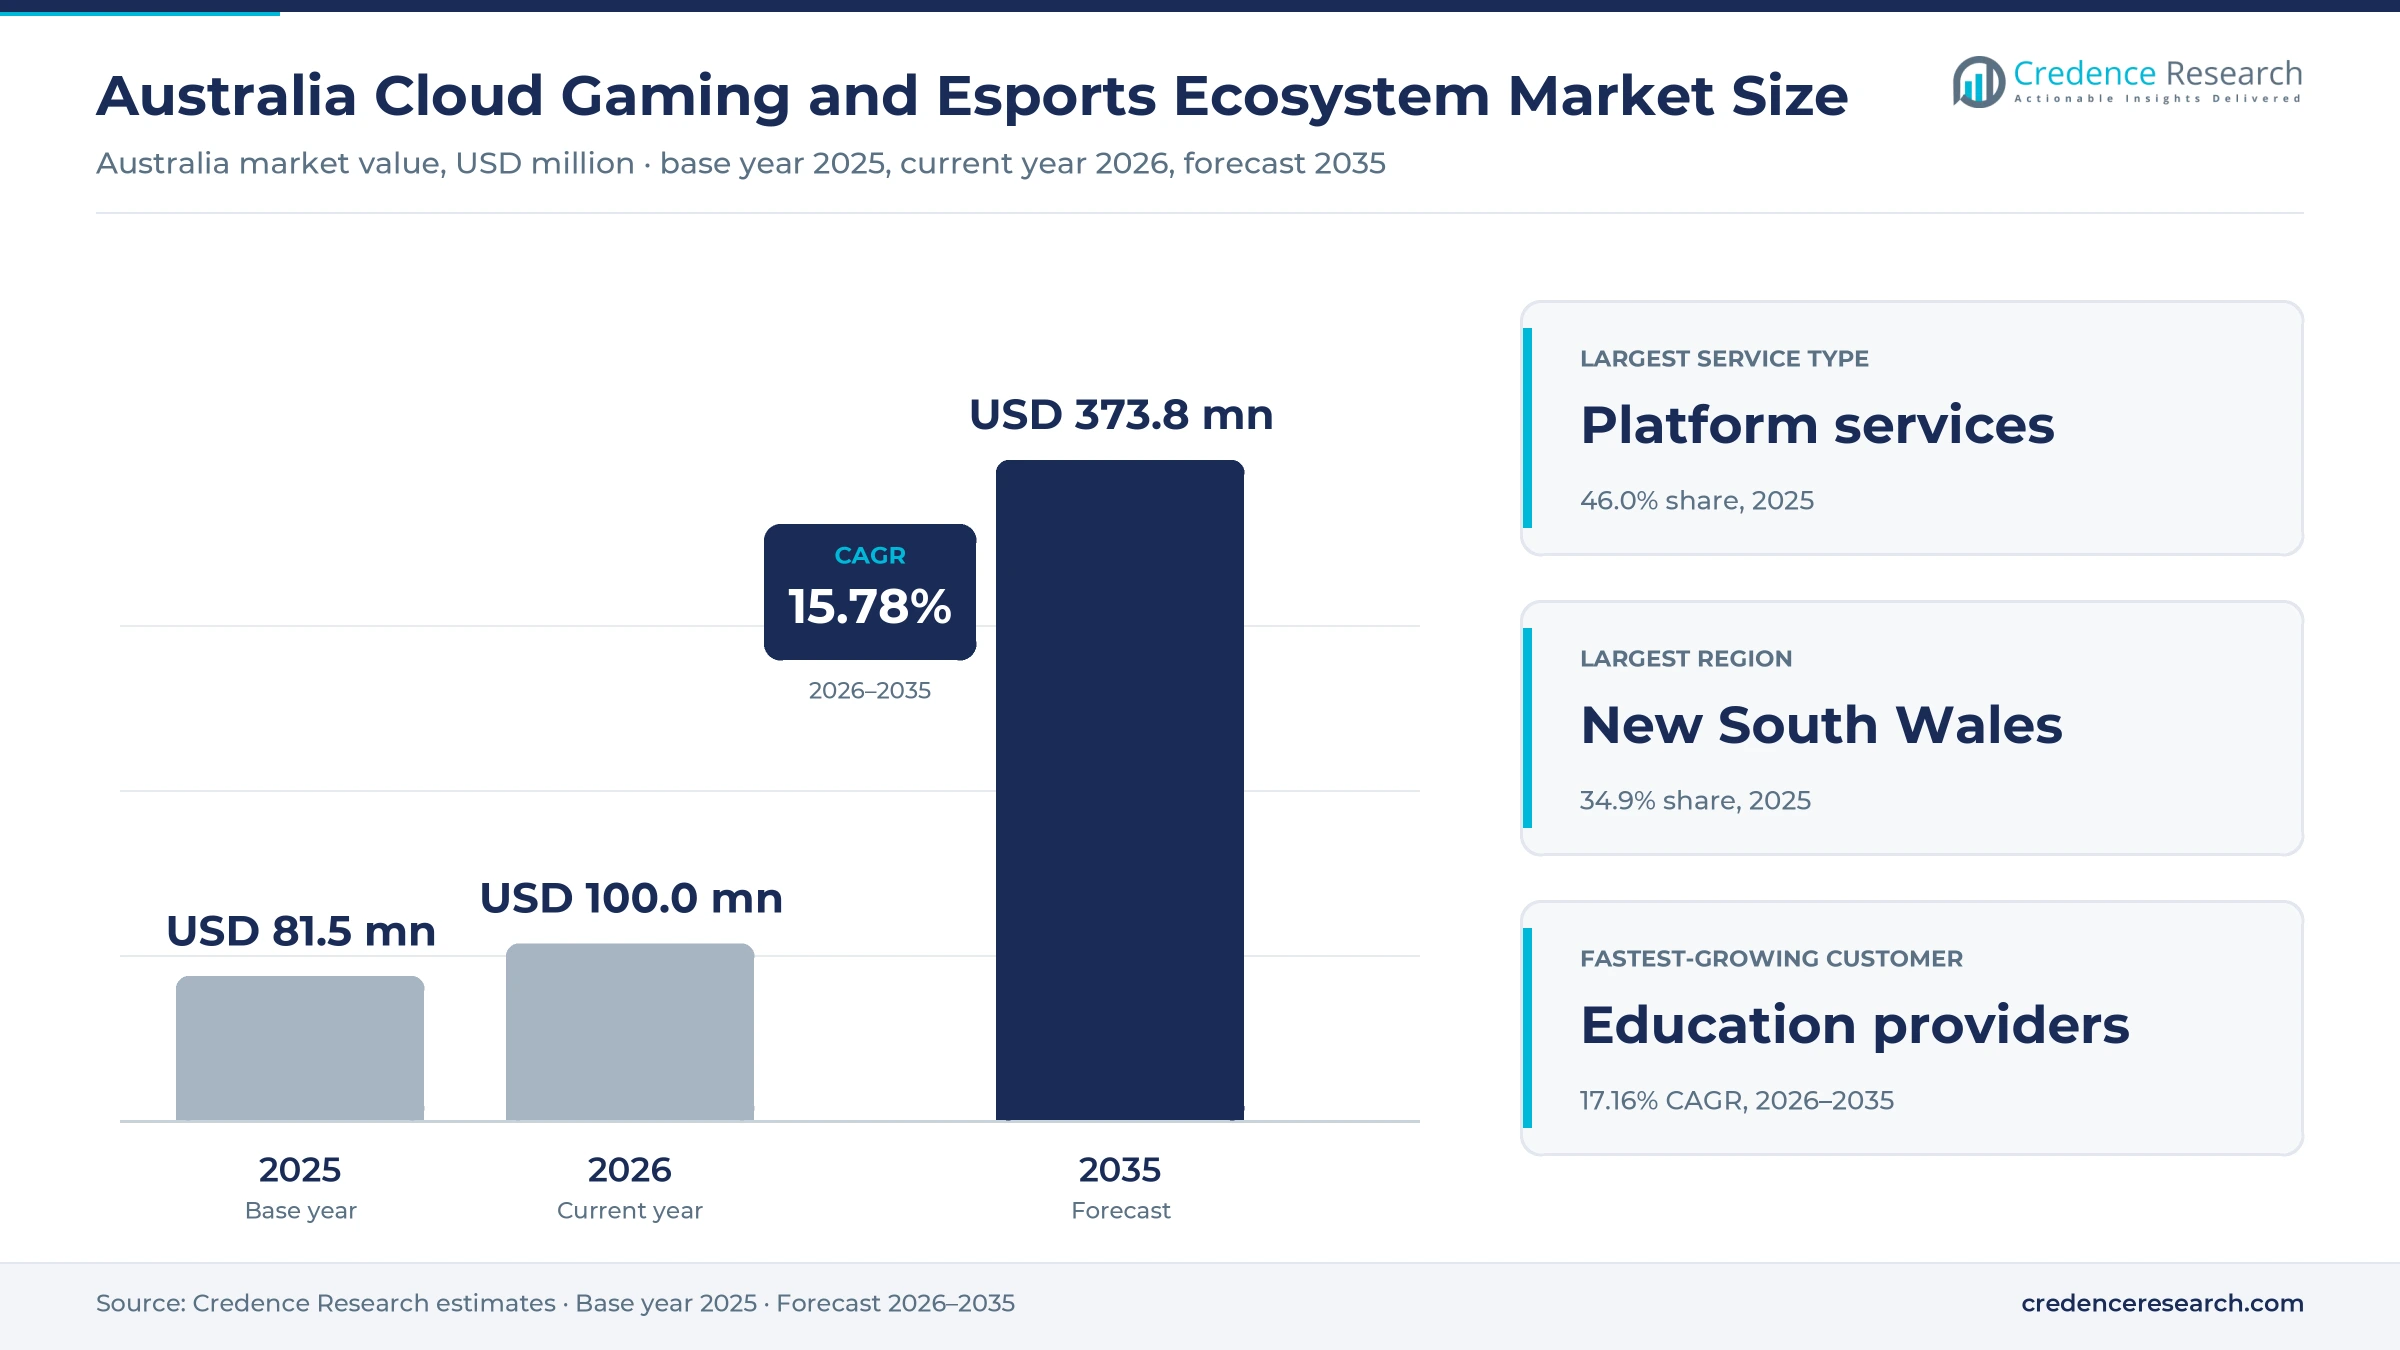
The Australia cloud gaming and esports ecosystem market was valued at USD 81.5 million in 2025 and is projected to increase from USD 100.0 million in 2026 to USD 373.8 million by 2035, registering a CAGR of 15.78% during 2026–2035. Demand comes from players who stream console and PC titles to phones, laptops and TVs, and from fans, brands and publishers that pay for tournaments, venues and broadcasts. New South Wales held the largest regional share, 34.9% in 2025, because Sydney hosts the biggest player base and the largest dedicated competition venue in the country. Queensland is the fastest-growing region at 16.26% a year, as the state gains residents from interstate and university leagues expand in Brisbane. However, the biggest change came from the national broadband network, which raised standard home speed tiers in September 2025 at no extra cost on eligible plans, which makes streamed play smoother for millions of households.
Which streaming and competition services does the estimate cover?
The estimate measures the value of cloud gaming platform services, dedicated streaming infrastructure, competition services such as leagues and tournaments, and ancillary services such as venue play, coaching and broadcast production sold in Australia. It counts spending by individual players and fans, publishers and platform operators, brands and media buyers, and schools and universities.
The estimate excludes game software sold for download, consoles, gaming PCs and peripherals, as well as betting on match results. The value chain runs from graphics server capacity and fiber access through platform operators, tournament organizers and teams to venues, broadcasters, sponsors and the players and fans in each state.
Australia Cloud Gaming and Esports Ecosystem Market Insights
- The Australia cloud gaming and esports ecosystem market was valued at USD 81.5 million in 2025 and is projected to reach USD 373.8 million by 2035, registering a CAGR of 15.78% during 2026–2035.
- New South Wales held a 34.9% share of 2025 value, because Sydney hosts the largest player base and the 2,000 square meter Fortress venue.
- Cloud gaming platform services led with a 46.0% share of 2025 value, because streaming subscriptions reach players on phones, laptops and smart TVs.
- The Australian GeForce NOW service passed 800,000 registered members and one billion minutes played in August 2026, five years after its commercial launch.
- Education providers grow fastest at 17.16% a year during 2026–2035, as school and university leagues add weekly competition and live finals.
Platform services lead while education buyers grow fastest
Why do platform services hold the largest value?
Based on service type, the market is categorized into cloud gaming platform services, dedicated cloud gaming infrastructure, esports competition services and esports ancillary services. Cloud Gaming Platform Services led with a 46.0% share of 2025 value, because monthly streaming plans reach players who do not own a console or high-end PC. Cloud Gaming Platform Services also grow fastest at 16.37% a year, as faster home broadband and new device apps widen the base of streaming players.
How do players, publishers and brands split spending?
Based on customer type, the market is categorized into individual players and fans, publishers and platform operators, brands and media buyers, and education providers. Individual Players and Fans led with a 52.0% share of 2025 value, because subscriptions, tickets and venue sessions are paid by consumers. Education Providers grow fastest at 17.16% a year, as schools and universities run weekly competitions and pay for platforms, coaching and event access.
Which revenue models bring in the most money?
Based on revenue model, the market is categorized into recurring subscriptions, usage-based fees, commercial contracts and transactional purchases. Recurring Subscriptions led with a 44.0% share of 2025 value, because streaming access is mostly sold as monthly memberships. Usage-Based Fees grow fastest at 18.06% a year, as platforms add paid playtime and pay-as-you-go access for occasional players.
| Segment Group | Leading Sub-segment | Share, 2025 | Fastest-growing Sub-segment | CAGR, 2026–2035 |
|---|---|---|---|---|
| By Service Type | Cloud Gaming Platform Services | 46.0% | Cloud Gaming Platform Services | 16.37% |
| By Customer Type | Individual Players and Fans | 52.0% | Education Providers | 17.16% |
| By Revenue Model | Recurring Subscriptions | 44.0% | Usage-Based Fees | 18.06% |
Request a Free Sample
Fill in your details and we'll send you a free sample report.
- Sample data tables & charts
- Research methodology
NBN upgrades, cheaper device access and major events
How does broadband capacity expansion lift streaming demand?
Broadband capacity expansion lifts streaming demand, because cloud play needs steady bandwidth and low latency in every room of the house. Faster home speed tiers became available to retailers from Sept. 14, 2025, when Home Fast plans moved from 100 to 500 Mbps downloads, according to a September 2025 consumer guide. The network operator also expected 90% of homes and businesses to have fiber-to-the-premises access by the end of 2025. Individuals using the internet reached 96.1% of the population in 2024, according to the World Bank. As a result, cloud gaming platform services hold 46.0% of 2025 value, because faster lines turn occasional streaming into a regular habit.
Why do cross-device access economics widen the player base?
Cross-device access economics widen the player base, because streaming lets households play new titles without buying a console or a high-end PC. Xbox Cloud Gaming reached general availability in Australia on Oct. 1, 2021, for phones, tablets, PCs and browsers over 4G, 5G or broadband. The service left beta in October 2025 and became available on all subscription tiers, according to a September 2026 report. Australian players spent $1.52 billion on mobile games in 2024, the largest platform, according to the industry association IGEA. In turn, individual players and fans hold 52.0% of 2025 value, because phones and smart TVs already sit in most homes.
How does international event commercialization add revenue?
International event commercialization adds revenue, because global tournaments bring ticket sales, sponsorship and broadcast deals to Australian cities. ESL FACEIT Group announced on Jan. 20, 2025, that its Counter-Strike tournament would hold live playoffs at Melbourne's Rod Laver Arena from April 25 to 27, 2025, according to the organizer's release. The earlier Sydney edition in 2023 drew 20,000 fans over three days, and three-day passes ranged from A$189 to A$1,999. Ubisoft also scheduled the Rainbow Six Asia-Pacific League Finals at Fortress Sydney for Dec. 11 to 14, 2025. As a result, competition services keep a steady share, because each event draws paying fans and sponsors.
Why do venue networks and school leagues grow participation?
Venue networks and school leagues grow participation, because they give new players a place to compete and a structured path into tournaments. Fortress opened a 2,000 square meter Sydney venue in April 2023 with room for more than 1,000 people, after its Melbourne venue opened in March 2020. The Acer Predator League Academy runs weekly interschool competition for Years 7 to 12 and added VALORANT for 2025. The Australian Esports League also hosted a university showcase in Brisbane on Sept. 13, 2025, within a cup of more than 20 universities. In turn, education providers grow at 17.16% a year, the fastest customer group during 2026–2035.
Usage caps and venue tournaments reshape how players pay
How is the shift to usage caps changing how players pay?
The shift to usage caps is changing how players pay, because platforms now price streaming time separately from the game library. Microsoft plans monthly cloud limits of five, 10 and 15 hours for its Essential, Premium and Ultimate tiers from November 2026, with extra hours sold through its store. The company also plans pay-as-you-go cloud play without a subscription, and it expects the caps to affect about 4% of members. Earlier, Australian prices for the top tier rose from A$18.95 to A$22.95 a month in July 2024 for new subscribers. As a result, usage-based fees grow at 18.06% a year, the fastest revenue model during 2026–2035.
Why is the rise of premium graphics tiers notable?
The rise of premium graphics tiers is notable, because players now pay more for higher resolution, frame rates and newer graphics cards in the cloud. Pentanet introduced Australia's first 4K cloud option with RTX 3080-class hardware in September 2023, and RTX 4080-class rigs followed in May 2024. Registered members grew from 180,000 in June 2022 to 580,000 in July 2024, according to an October 2026 review. Minutes played rose from 100 million to 550 million over the same period, and Pentanet extended its alliance agreement to New Zealand in March 2024. In turn, dedicated infrastructure gains value, because operators buy graphics processors for each premium tier.
Can school and university leagues open new contracts?
School and university leagues can open new contracts, because educators want supervised competition that links games with digital careers and student wellbeing. The Acer Predator League Academy is open to all secondary schools in Australia and New Zealand, with teams of four students playing weekly fixtures across Years 7 to 12. Fortnite was played in 2024, with a live champion crowned at SXSW Sydney, before VALORANT was added for 2025. Southern Cross University also competes weekly online against more than 20 Australian universities in the Australian Esports League cup. As a result, education providers form the fastest-growing customer group, which gives platform and league operators a growing base of institutional buyers that sign term-long contracts.
Is there room to grow in regional tournament hosting?
Regional tournament hosting offers room to grow, because Australian venues can stage Asia-Pacific finals that draw teams and fans from across the region. The Chiefs Esports Club joined the new League of Legends Championship Pacific as a guest team for the 2025 season, according to Riot Games. Fortress Sydney hosted the Rainbow Six Asia-Pacific League Finals in December 2025, and Melbourne staged a 16-team Counter-Strike event in April 2025. Sydney venues already serve the largest player base in the country, which supports bids for more Asia-Pacific finals and qualifiers each year. In turn, organizers can link live finals with competitive video game tournaments across Asia.
Latency, distance and thin sponsorship pools limit scale
How do latency and distance limit streamed play?
Latency and distance limit streamed play, because players far from Sydney and Perth server sites notice delay in fast action titles. As a result, rural and remote households often prefer local hardware, which slows streaming adoption outside the main cities. Operators respond with more server locations, better routing and wired connection advice, which helps reduce delay for competitive players. This limit eases as fiber reaches more premises, but it will not disappear for remote towns.
Why do usage caps risk losing heavy users?
Usage caps risk losing heavy users, because players who stream for many hours each month may face extra charges for the same habit. In turn, some heavy users may switch to local consoles or other services, which reduces subscription renewals for capped platforms. Platforms respond with tiered hours, top-up packs and clear usage meters, which help players manage spending without leaving. This risk therefore pushes operators to price extra hours with care.
How does a thin sponsorship pool limit teams?
A thin sponsorship pool limits teams, because Australia has fewer large brand budgets than bigger gaming markets in Asia and North America. As a result, clubs and leagues depend on a small group of telecom, hardware and beverage sponsors, which makes revenue uneven from year to year. Teams respond with content channels, merchandise and education partnerships, which spread income across more buyers. This pressure favors clubs with strong fan communities and diverse partners.
Why do event costs and travel distance raise risk?
Event costs and travel distance raise risk, because flying international teams and staff to Australia costs more than hosting in Europe or Asia. In turn, organizers need ticket sales, sponsors and government event support to cover arena hire and production costs. Organizers respond with multi-day formats, premium ticket tiers and partnerships with venues, which spread fixed costs across more revenue. This risk means only well-funded organizers stage tier-one events in the country.
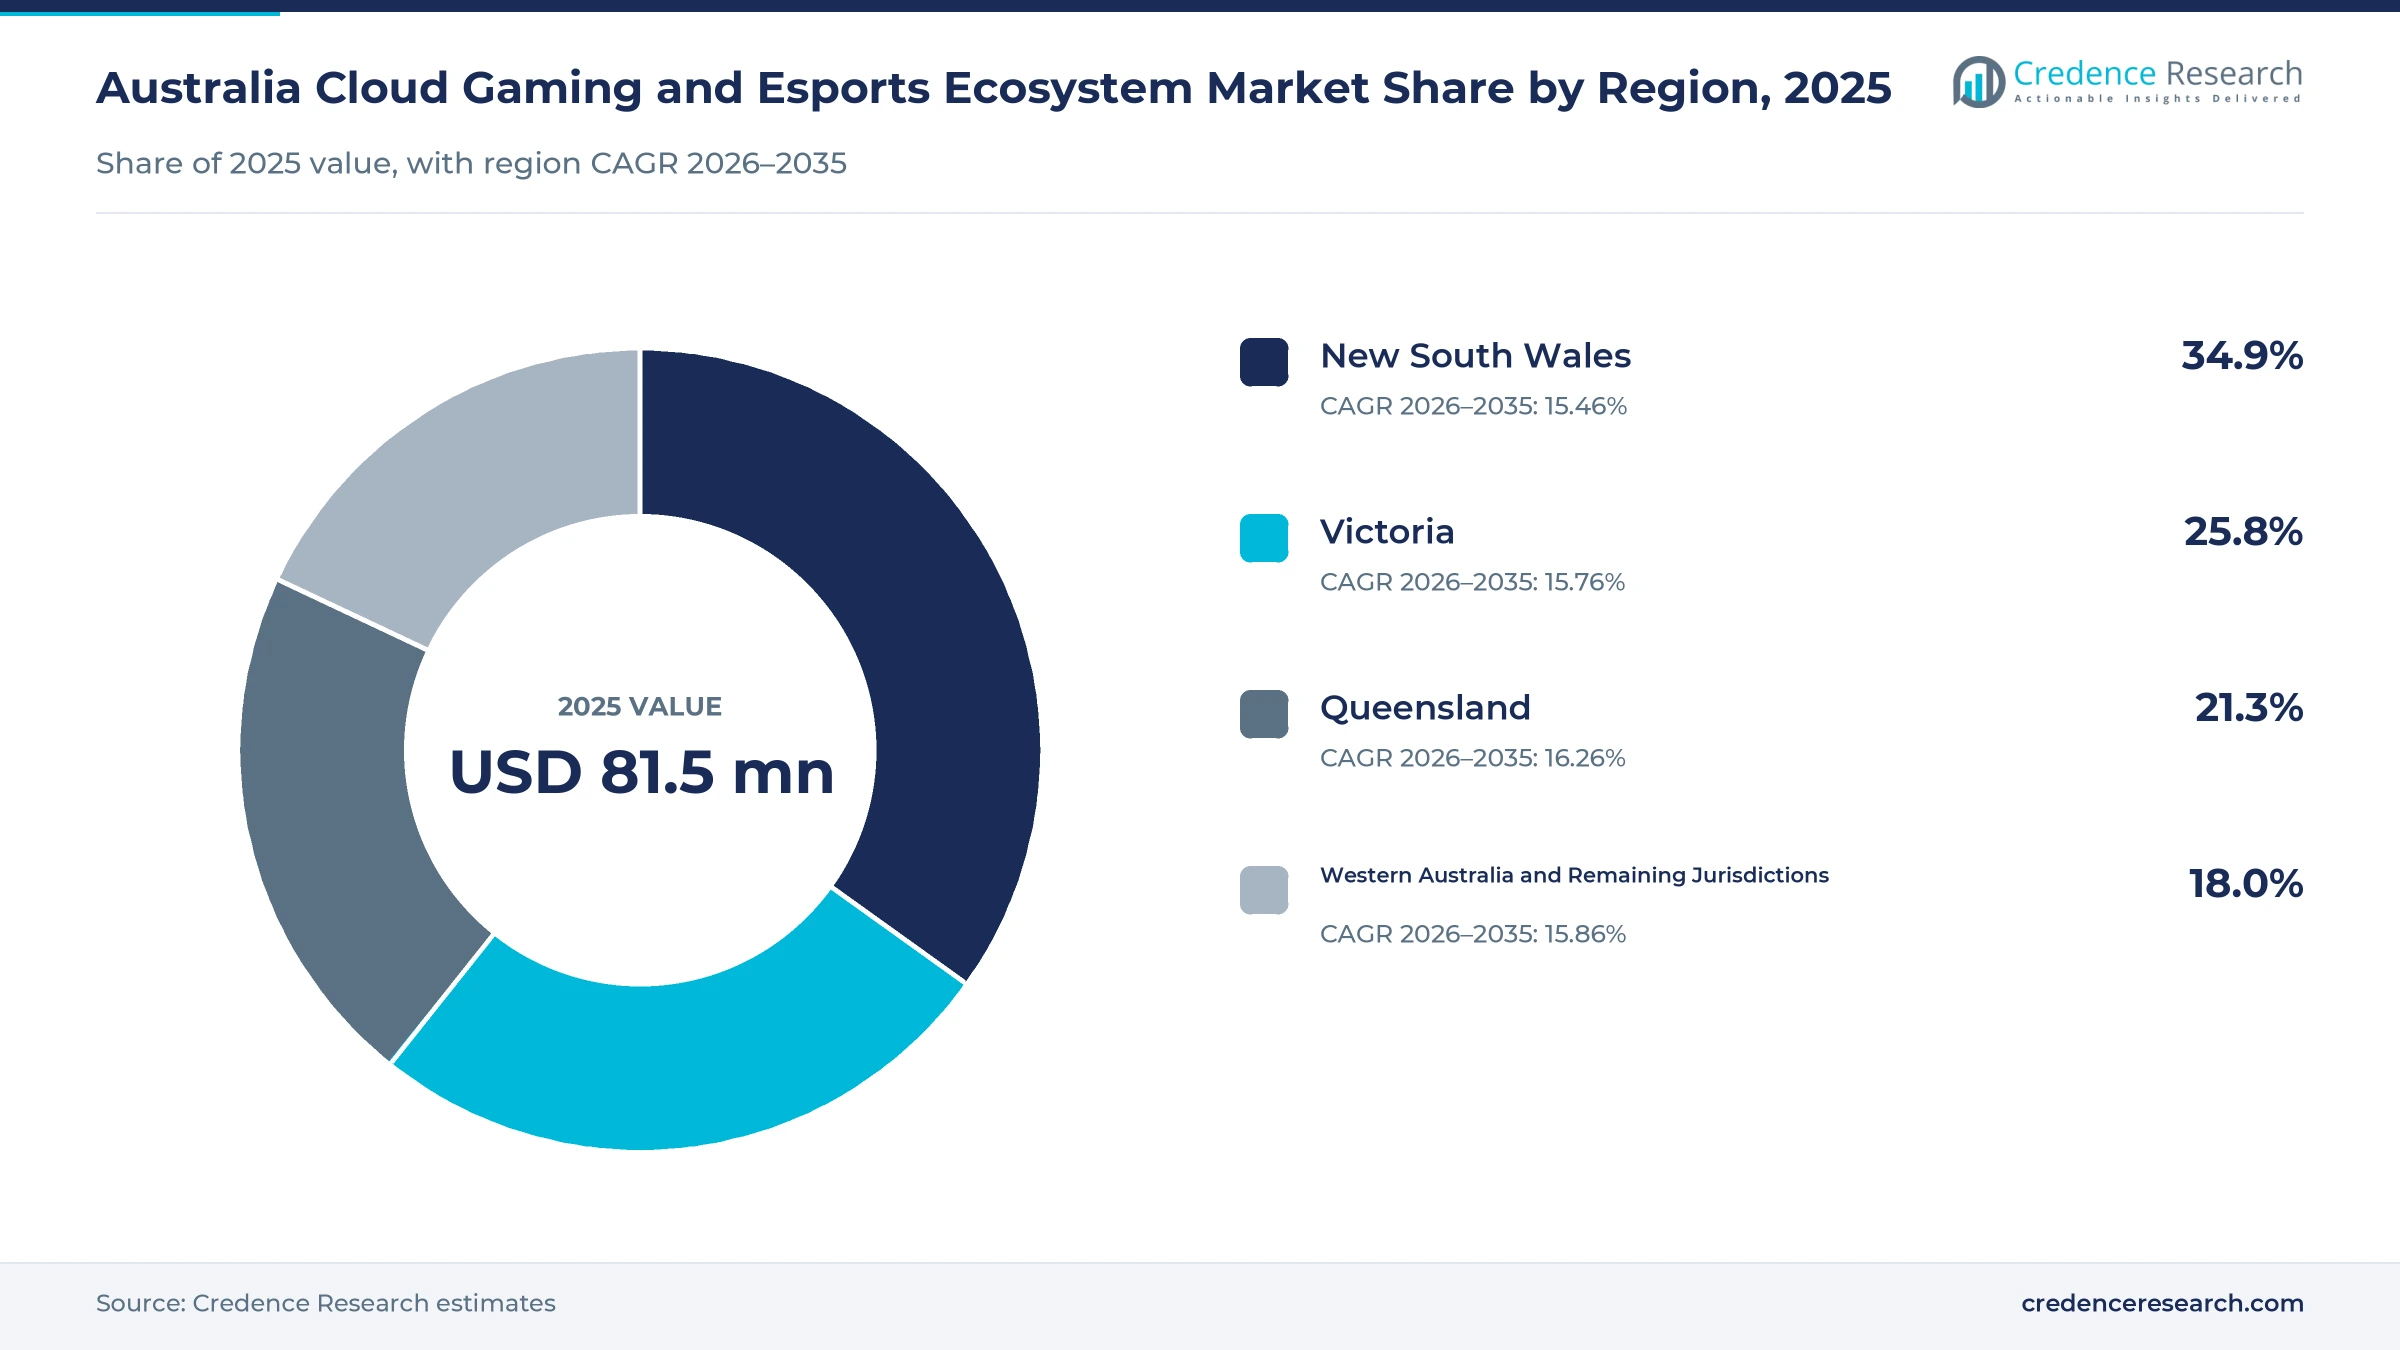
Sydney venues and audiences keep New South Wales ahead
| Region | Value, 2025 (USD million) | Share, 2025 | CAGR, 2026–2035 |
|---|---|---|---|
| New South Wales | 28.4 | 34.9% | 15.46% |
| Victoria | 21.0 | 25.8% | 15.76% |
| Queensland | 17.4 | 21.3% | 16.26% |
| Western Australia and Remaining Jurisdictions | 14.7 | 18.0% | 15.86% |
Why does New South Wales hold the top share?
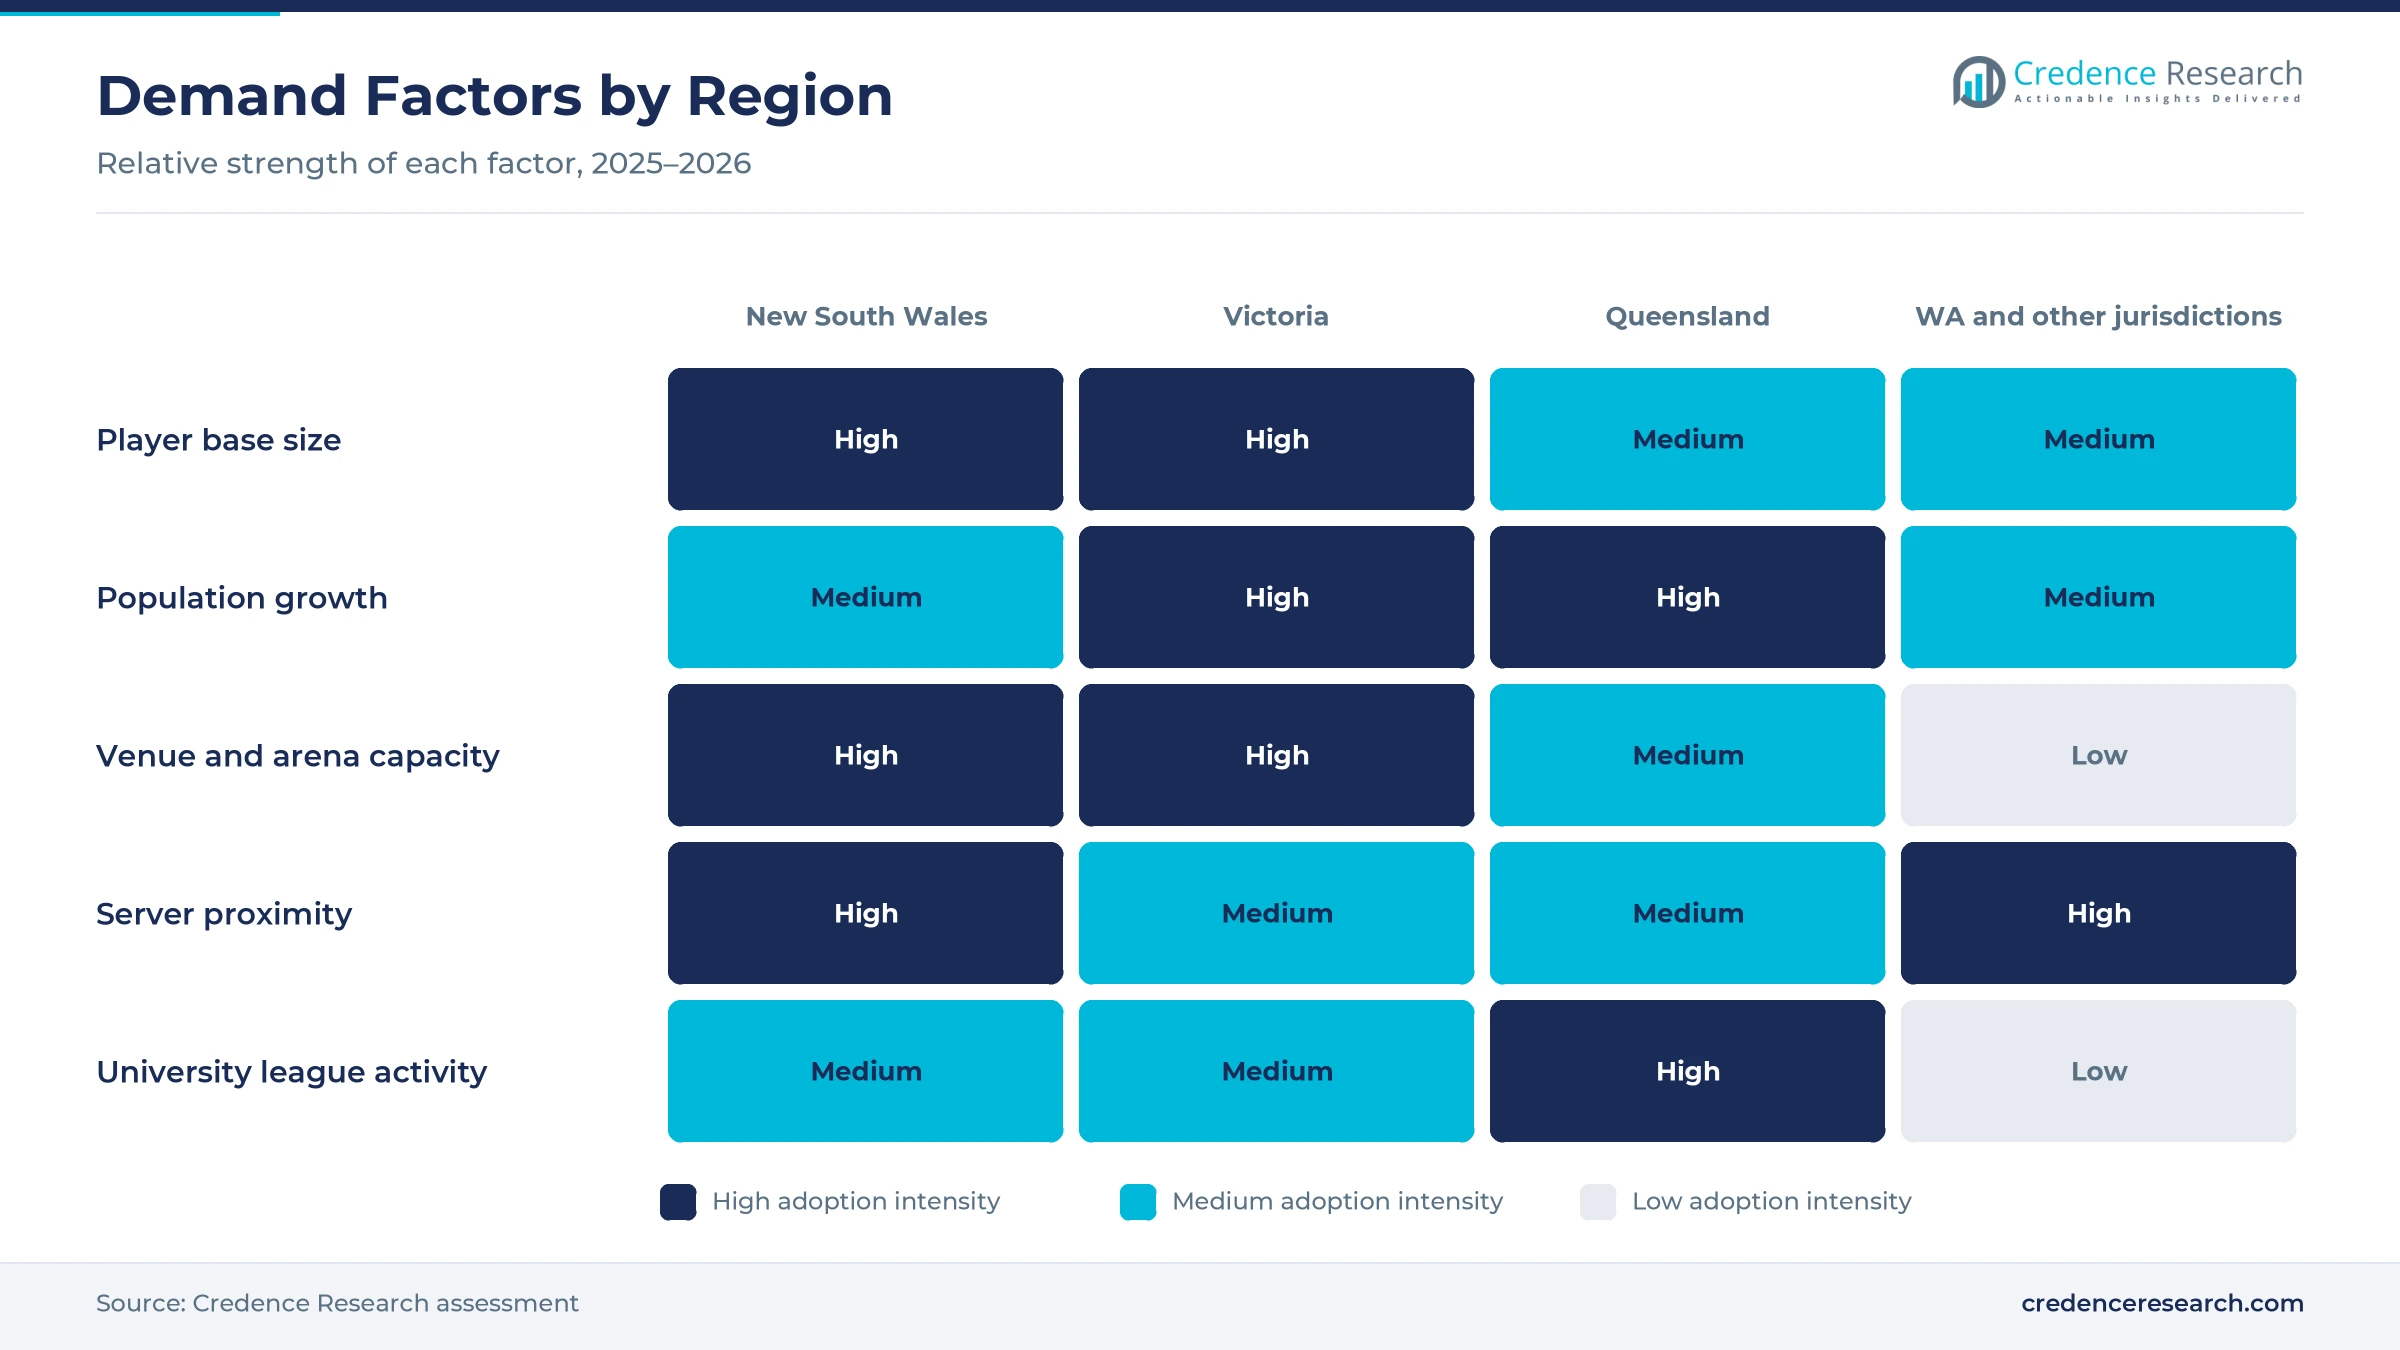
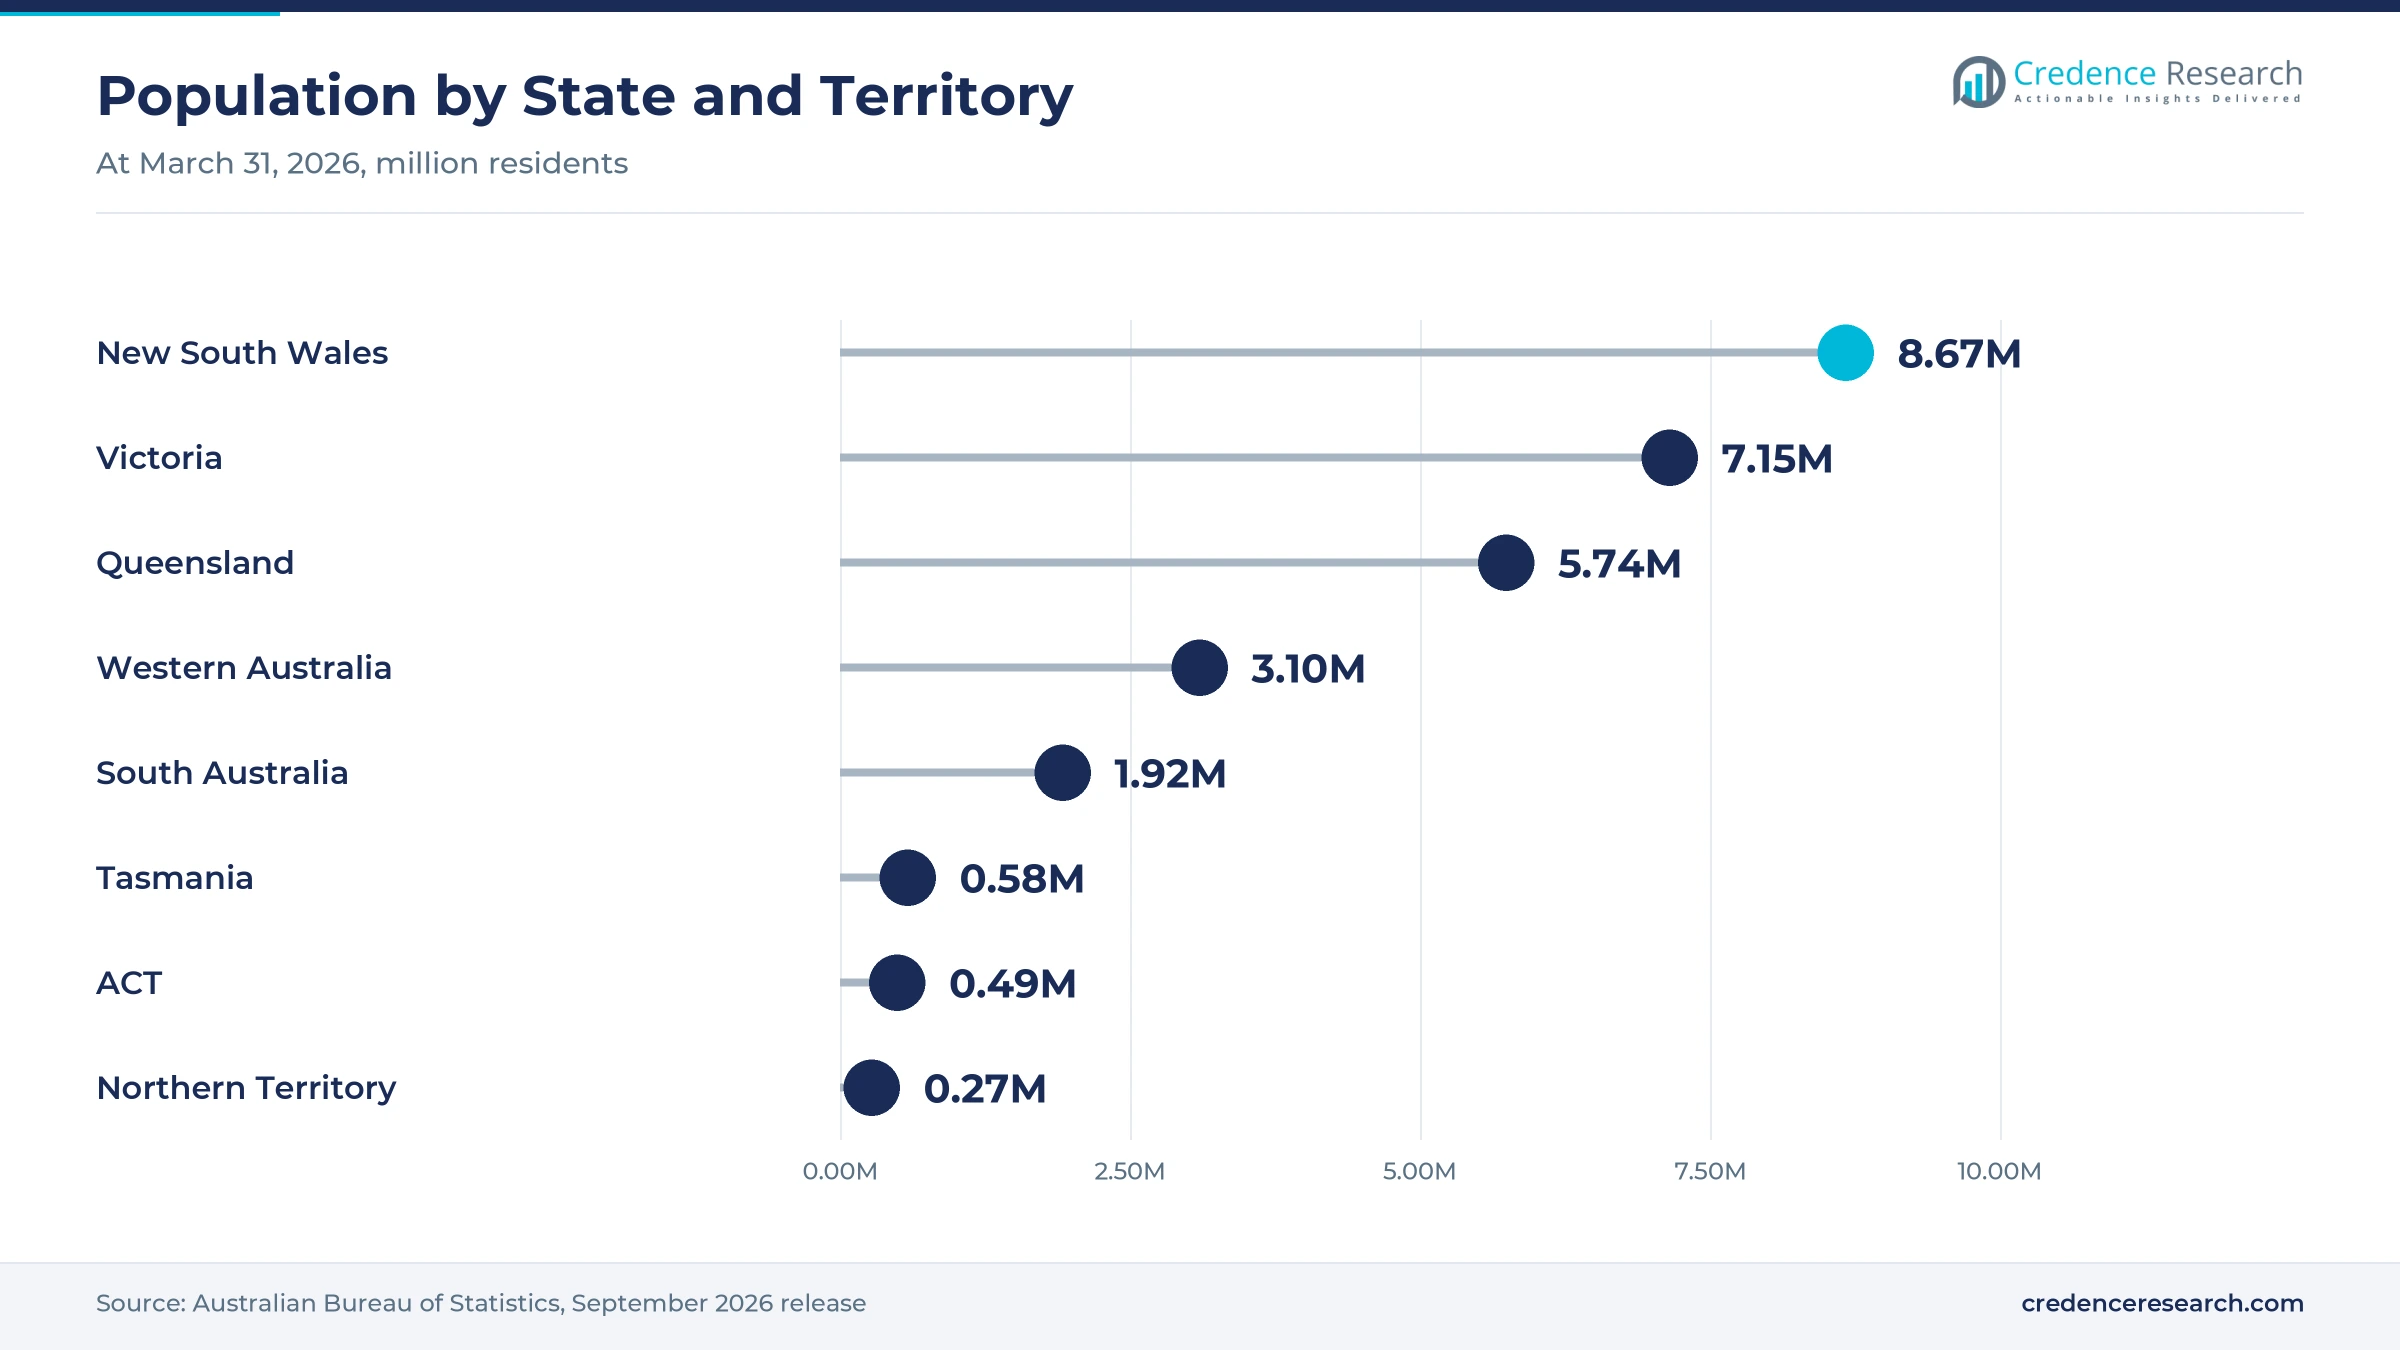
New South Wales held a 34.9% share of 2025 value and grows at 15.46% a year, because the state had 8.67 million residents at March 31, 2026, the largest of any state. Sydney hosts the Fortress venue, which hosted the Rainbow Six Asia-Pacific League Finals in December 2025. Streaming servers for the Australian GeForce NOW service also run from Sydney and Perth. As a result, New South Wales leads in both streaming subscriptions and live competition spending.
How does Victoria anchor major live events?
Victoria held a 25.8% share of 2025 value and grows at 15.76% a year, because Melbourne hosts arena events and the first Fortress venue, which opened in March 2020. The state had 7.15 million residents at March 31, 2026, after growing 1.6% in a year. Melbourne staged live Counter-Strike playoffs at Rod Laver Arena in April 2025. In turn, Victoria earns a large share of ticket, sponsorship and broadcast spending.
What makes Queensland the fastest-growing region?
Queensland held a 21.3% share of 2025 value and grows fastest at 16.26% a year, because the state added 90,100 residents in the year to March 2026, with strong interstate arrivals. Brisbane hosted a university showcase on Sept. 13, 2025, with teams from QUT, UQ, Griffith and Southern Cross. Young households in south-east Queensland also adopt streaming on phones and smart TVs. As a result, Queensland adds new players and education buyers faster than other regions.
How do Western Australia and other jurisdictions contribute?
Western Australia and remaining jurisdictions accounted for 18.0% of 2025 value and grow at 15.86% a year, because Perth hosts streaming servers and the state grew 2.1% in the year to March 2026. South Australia, Tasmania and the two territories add smaller but loyal audiences. Perth-based Pentanet operates the national GeForce NOW service on local streaming backend systems. In turn, Western Australia gives players in the west lower latency than eastern servers.
Platform milestones and tournaments from 2024 to 2026
| Development | Status and market relevance |
|---|---|
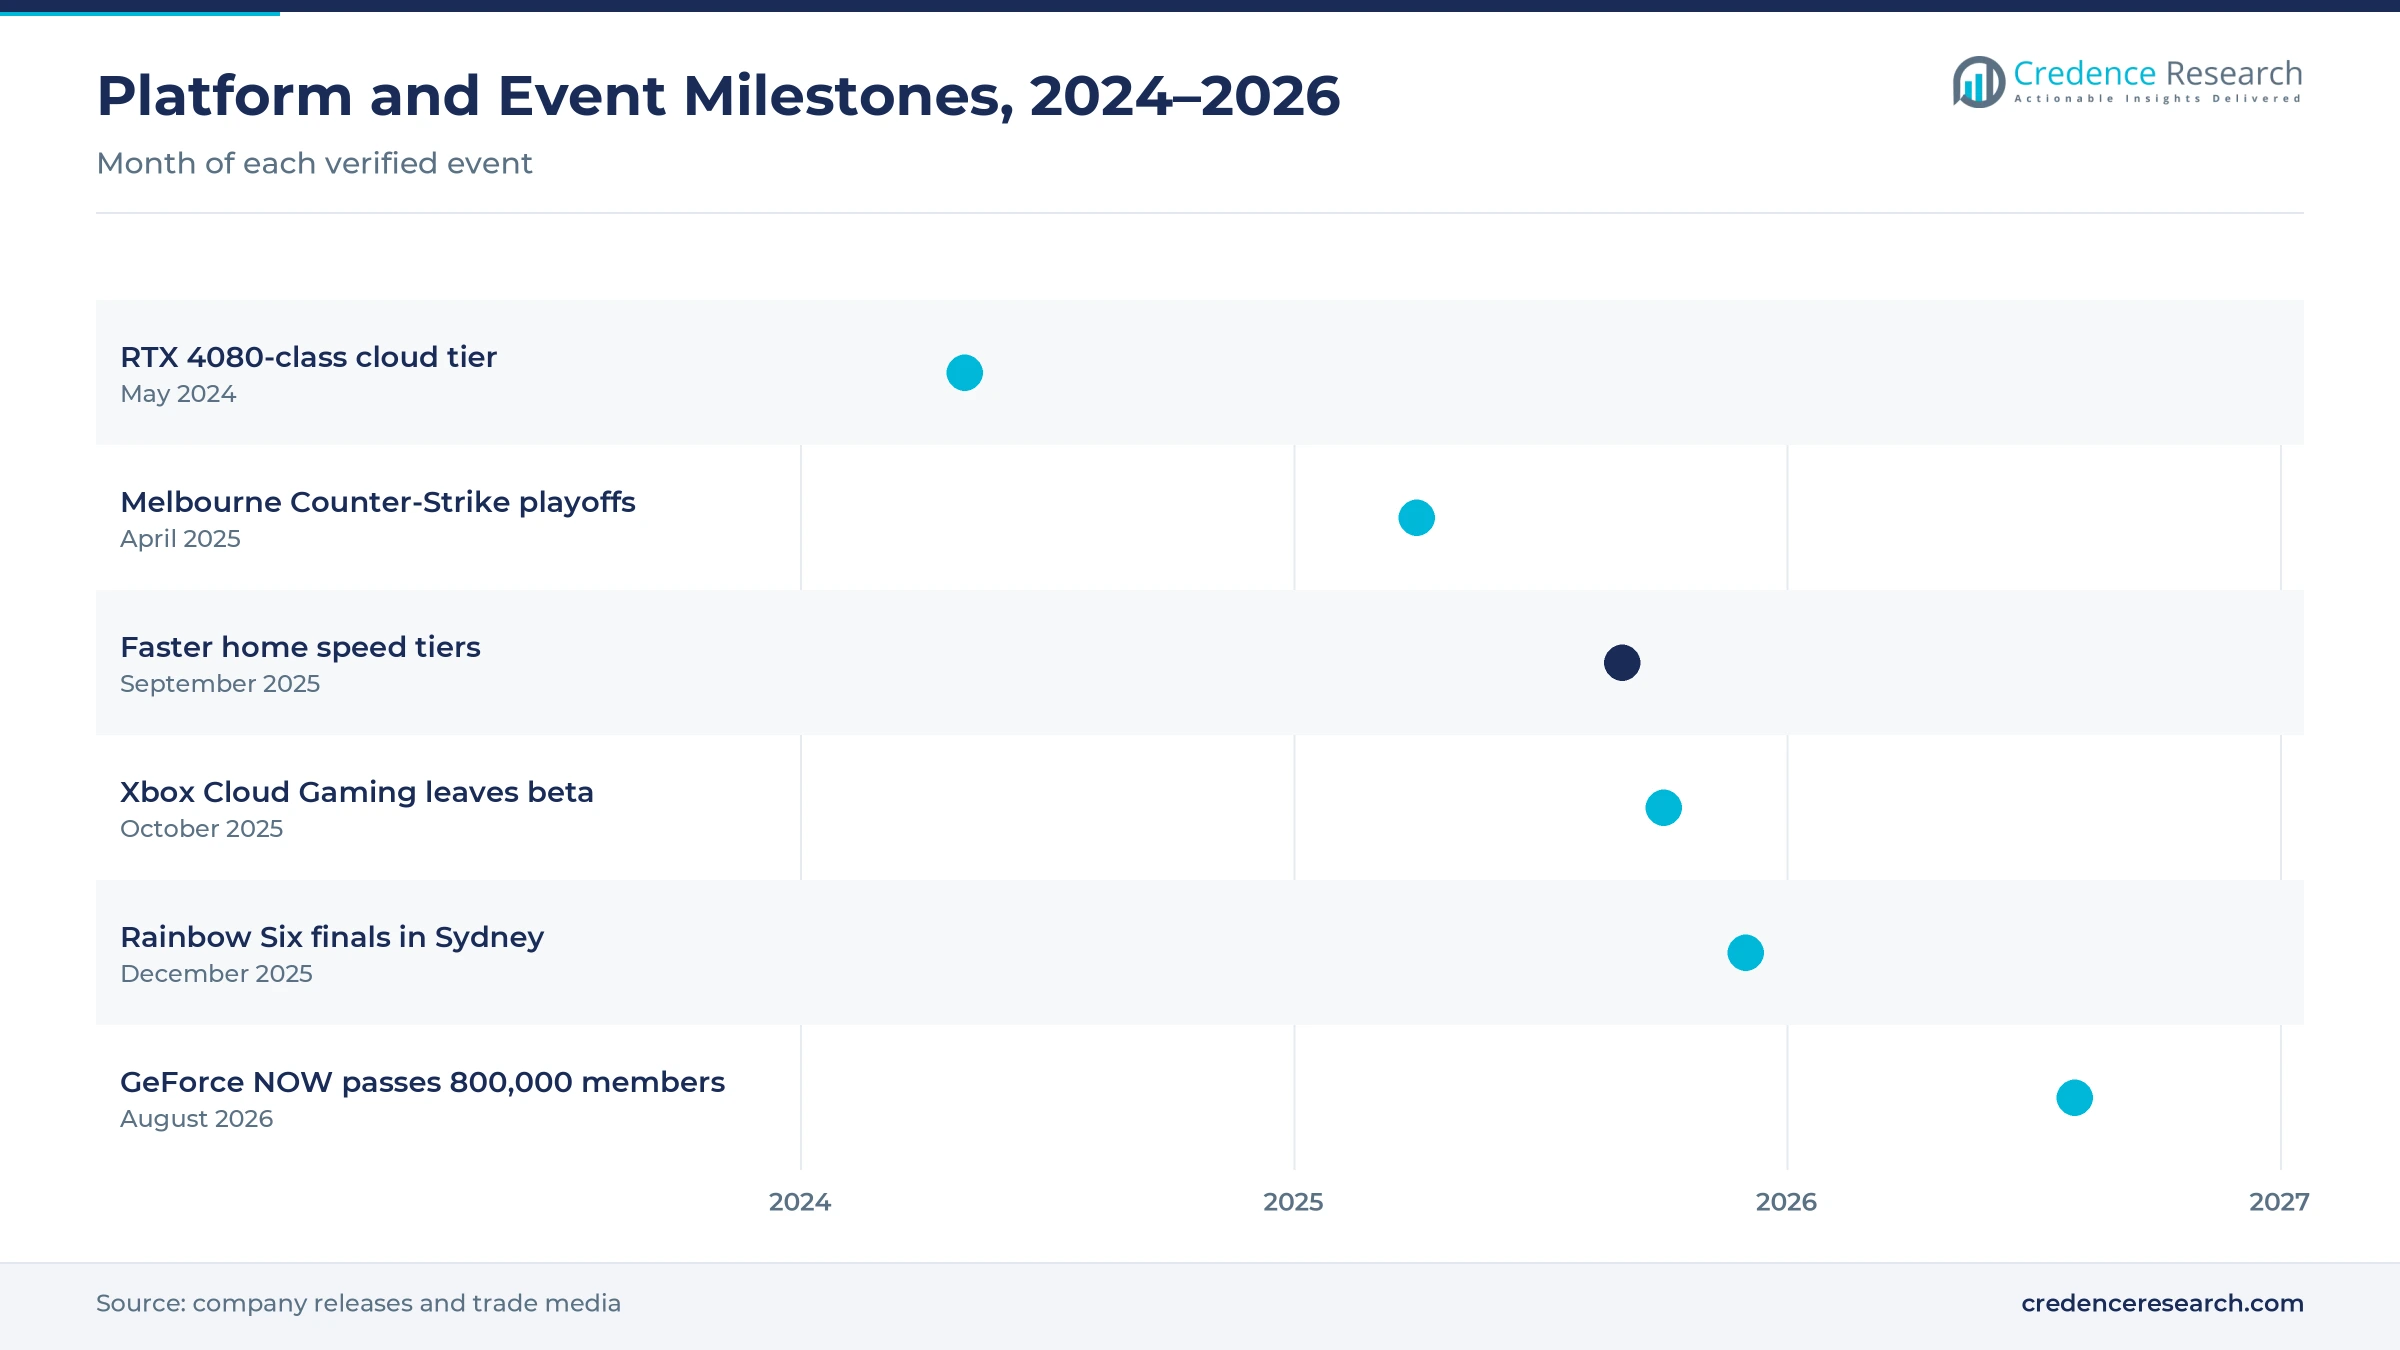
| In January 2025, ESL FACEIT Group announced live Counter-Strike playoffs at Rod Laver Arena in Melbourne for April 2025. | Brings tier-one competition back to Australia |
| In September 2025, faster home broadband speed tiers became available to retailers on eligible fiber and cable lines. | Improves streamed play for millions of households |
| In October 2025, Xbox Cloud Gaming left beta and became available on all Game Pass tiers. | Widens cloud access for Australian subscribers |
| In December 2025, Fortress Sydney hosted the Rainbow Six Asia-Pacific League Finals from Dec. 11 to 14. | Shows local venues can stage regional finals |
| In August 2026, the Australian GeForce NOW service passed 800,000 registered members and one billion minutes played. | Confirms steady growth in local cloud play |
Graphics servers, fiber access and venue networks matter
- Graphics server clusters run games in data centers and stream video to each player, while newer RTX 4080-class rigs support higher resolution and frame rates for premium members.
- Fiber and cable access upgrades raise home download speeds to 500 Mbps and above, which cuts buffering and gives streamed play more headroom in busy households.
- Low-latency routing and edge sites place servers in Sydney and Perth, which keeps round-trip delay low for players on the east and west coasts.
- Venue networks and broadcast production connect PC arenas, cameras and stream feeds, which lets Fortress and arena operators stage tournaments for live and online audiences.
Need a Custom Version of This Report?
Tailor the scope, geography, or segments to your exact requirements.
- Custom geography or segment scope
- Direct access to our analyst team
Global platforms and local operators split the value chain
Competition combines global platform owners that run streaming services with local operators, tournament organizers and venues that serve Australian players and fans. Microsoft competes with Xbox Cloud Gaming across all Game Pass tiers and plans pay-as-you-go access. NVIDIA supplies the GeForce NOW platform, which Pentanet operates in Australia and New Zealand from Perth and Sydney servers. ESL FACEIT Group competes in tier-one Counter-Strike events, while Ubisoft and BLAST stage Rainbow Six regional finals. Riot Games runs the League of Legends Championship Pacific, where the Chiefs Esports Club played as a guest team in 2025. Fortress competes in venue play in Melbourne and Sydney, and the Australian Esports League runs university competition. Rivals compete on latency, game library, ticket pricing, broadcast reach and sponsor value, which keeps local partnerships important for every operator.
Which platforms, organizers and venues serve Australian players?
| Company | Type | Role in the market |
|---|---|---|
| Microsoft | Platform owner | Runs Xbox Cloud Gaming across all Game Pass tiers |
| NVIDIA | Platform and hardware supplier | Supplies the GeForce NOW platform and graphics servers |
| Pentanet | Local platform operator | Operates GeForce NOW in Australia and New Zealand |
| ESL FACEIT Group | Tournament organizer | Staged Counter-Strike playoffs in Melbourne in 2025 |
| Ubisoft | Publisher | Scheduled Rainbow Six regional finals at Fortress Sydney |
| Riot Games | Publisher and league owner | Runs the League of Legends Championship Pacific |
| The Chiefs Esports Club | Team | Played as a guest team in the 2025 Pacific league |
| Fortress | Venue operator | Runs competition venues in Melbourne and Sydney |
| Australian Esports League | League operator | Runs a university cup with more than 20 universities |
Credence Research view on streaming and live events
Credence Research's view is that the Australian ecosystem will grow quickly because faster broadband removes the main barrier to streamed play while live events give fans new reasons to spend. Platform services remain the largest value pool, while usage-based fees and education buyers add the fastest growth. Usage caps may slow some heavy users, yet they also open paid access for occasional players. Operators that pair low latency with strong local events and school programs should gain the most.
How the national services estimate was built
The report uses 2025 as the base year on a calendar basis, and market values come from the Credence Research model. That model combines official population and internet use statistics, broadband speed tier information, platform membership milestones and event releases. Segment splits and zone growth rates are Credence Research estimates, while zone shares follow the client-provided split. Sources used are official statistics, international agency data, trade media and company releases, and no interviews or surveys were used.
Pay-as-you-go access and schools carry growth to 2035
The Australia cloud gaming and esports ecosystem market is expected to reach USD 373.8 million by 2035, a 15.78% CAGR during 2026–2035, as streaming becomes a normal way to play and more international events come to Australian cities. Growth should be strongest in usage-based fees, education providers and Queensland, because these areas gain most from new players and structured competition. Latency outside the main cities, usage caps and thin sponsorship pools could slow some segments, while fiber upgrades should support value.
Frequently Asked Questions
How big is the Australia cloud gaming and esports ecosystem market?
Which service type leads the market?
Which region leads the Australian market?
How did broadband upgrades change streamed play?
How many Australians use GeForce NOW?
Which revenue model grows fastest?
Who are the leading companies in this market?
What are the main challenges for operators?
Table of Content
Chapter 1 Market Segmentation
- 1.1 Segmentation Framework
- 1.1.1 Product and Service Classification
- 1.1.2 Application and End-Use Classification
- 1.1.3 Technology and Solution Classification
- 1.1.4 Customer and Distribution Channel Classification
- 1.1.5 Geographic Segmentation
- 1.1.6 Market Segment Definitions and Boundaries
- 1.2 By Service Type
- 1.2.1 Cloud Gaming Platform Services
- 1.2.2 Dedicated Cloud Gaming Infrastructure
- 1.2.3 Esports Competition Services
- 1.2.4 Esports Ancillary Services
- 1.3 By Customer Type
- 1.3.1 Individual Players and Fans
- 1.3.2 Publishers and Platform Operators
- 1.3.3 Brands and Media Buyers
- 1.3.4 Education Providers
- 1.4 By Revenue Model
- 1.4.1 Recurring Subscriptions
- 1.4.2 Usage-Based Fees
- 1.4.3 Commercial Contracts
- 1.4.4 Transactional Purchases
Chapter 2 Introduction
- 2.1 Report Objectives and Scope
- 2.2 Product Definition and Industry Terminology
- 2.3 Market Inclusions and Exclusions
- 2.4 Research Process
- 2.4.1 Primary Research and Expert Interviews
- 2.4.2 Secondary Research and Source Review
- 2.4.3 Top-Down and Bottom-Up Estimation
- 2.4.4 Data Triangulation and Verification
- 2.5 Market Size Measurement Basis
- 2.5.1 2025: USD 81.5 million → 2035: USD 373.8 million
- 2.6 Historical and Forecast Reference Periods
- 2.6.1 Historical Period: 2018-2025
- 2.6.2 Base Year: 2025
- 2.6.3 Forecast Period: 2025-2035
- 2.7 Research Assumptions and Limitations
Chapter 3 Executive Summary
- 3.1 Market Snapshot and Key Findings
- 3.2 Base-Year Market Size, 2025
- 3.3 Forecast Market Size, 2035
- 3.4 Revenue and Volume Growth Outlook
- 3.5 Key Demand and Supply Indicators
- 3.6 Leading Market Segments
- 3.7 Fastest-Growing Market Opportunities
- 3.8 Regional Performance Highlights
- 3.9 Technology and Industry Transformation
- 3.10 Competitive Landscape Summary
- 3.11 Analyst View and Strategic Implications
Chapter 4 Australia Cloud Gaming and Esports Ecosystem Market Trends and Developments
- 4.1 Historical Industry Development, 2018-2025
- 4.2 Recent Market Trends and Developments
- 4.3 Demand and Customer Behavior Trends
- 4.4 Technology and Product Innovation
- 4.5 Artificial Intelligence, Automation and Digitalization
- 4.6 Local Manufacturing and Supply Chain Realignment
- 4.7 Industry Partnerships, Mergers and Acquisitions
- 4.8 Sustainability and Circular Economy Developments
- 4.9 Government and Private Sector Investment Trends
- 4.10 Emerging Business Models and Commercialization
- 4.11 Industry Developments and Announcements
Chapter 5 Australia Cloud Gaming and Esports Ecosystem Market Production, Supply and Demand Analysis
- 5.1 Demand Trend and Consumption Analysis, 2018-2025
- 5.2 Demand Forecast, 2025-2035
- 5.3 Production and Output Trend, 2018-2025
- 5.4 Production and Output Forecast, 2025-2035
- 5.5 Installed Capacity and Capacity Utilization
- 5.6 Company-Wise Production Plants and Statistics
- 5.6.1 Installed Production Capacity
- 5.6.2 Actual Production
- 5.6.3 Planned Capacity and Expansion Targets
- 5.7 Supply Chain Structure and Procurement Trends
- 5.8 Supply-Demand Gap and Bottlenecks
- 5.9 Import Dependence and Sourcing Structure
- 5.10 Contract Manufacturing and Outsourcing
- 5.11 Regional Supply and Demand Concentration
Chapter 6 Australia Cloud Gaming and Esports Ecosystem Market Pricing Analysis
- 6.1 Pricing Structure and Measurement
- 6.2 Historical Pricing Trends, 2018-2025
- 6.3 Pricing Outlook, 2025-2035
- 6.4 Average Selling Price and Unit Economics
- 6.5 Pricing by Product and Market Segment
- 6.6 Geographic Pricing Differences
- 6.7 Key Input, Energy, Labor and Logistics Costs
- 6.8 Contract Pricing and Purchasing Models
- 6.9 Pricing Sensitivity and Competitive Positioning
- 6.10 Price, Margin and Profitability Implications
Chapter 7 Australia Cloud Gaming and Esports Ecosystem Market Dynamics
- 7.1 Market Growth Drivers
- 7.1.1 Demand-Side Drivers
- 7.1.2 Technology and Innovation Drivers
- 7.1.3 Infrastructure and Investment Drivers
- 7.1.4 Regulatory and Policy Drivers
- 7.2 Market Restraints
- 7.2.1 Cost and Affordability Constraints
- 7.2.2 Technology and Adoption Barriers
- 7.2.3 Supply Chain and Operational Constraints
- 7.3 Market Challenges
- 7.3.1 Competitive Pressure and Margin Erosion
- 7.3.2 Skills, Infrastructure and Implementation Gaps
- 7.4 Emerging Market Opportunities
- 7.5 Market Dynamics Impact and Time-Horizon Assessment
Chapter 8 Australia Cloud Gaming and Esports Ecosystem Value Chain Analysis
- 8.1 Industry Value Chain Overview
- 8.2 Upstream Suppliers and Critical Inputs
- 8.3 Technology and Component Providers
- 8.4 Manufacturing or Service Delivery
- 8.5 Distribution, Channel Partners and Integrators
- 8.6 Downstream Applications and End Users
- 8.7 Value Addition and Profit Pools
- 8.8 Vertical Integration and Outsourcing
- 8.9 Supplier Concentration and Risk
- 8.10 Supply Chain Localization and Resilience
Chapter 9 Australia Cloud Gaming and Esports Ecosystem Market Regulations and Policies
- 9.1 Relevant Laws, Standards and Compliance Frameworks
- 9.2 Product, Service, Safety and Quality Requirements
- 9.3 Government Policies, Incentives and Subsidies
- 9.4 Imports, Exports and Trade Barriers
- 9.5 Public Procurement and Local Content Requirements
- 9.6 Environmental and Sustainability Compliance
- 9.7 Data Protection, AI and Cybersecurity Compliance
- 9.8 Upcoming Policy Changes and Market Implications
Chapter 10 Australia Cloud Gaming and Esports Ecosystem Market Hotspots and Opportunities
- 10.1 Market Opportunity Mapping and Growth Hotspots
- 10.2 High-Growth Applications and Customer Groups
- 10.3 Underserved Markets and White-Space Opportunities
- 10.4 Emerging Technology and Product Opportunities
- 10.5 New Capacity and Investment Hotspots
- 10.6 Market Entry and Expansion Opportunities
- 10.7 Distribution and Partnership Opportunities
- 10.8 Near-Term and Long-Term Commercial Potential
- 10.9 Opportunity Attractiveness and Execution Risks
Chapter 11 Australia Cloud Gaming and Esports Ecosystem Market Outlook, 2025-2035
- 11.1 Market Size and Analysis
- 11.1.1 Revenue (Market Measurement: 2025: USD 81.5 million → 2035: USD 373.8 million)
- 11.1.2 Market Volume and Quantity Sold
- 11.1.3 Historical Market Size, 2018-2025
- 11.1.4 Base-Year Market Size, 2025
- 11.2 Market Forecast, 2025-2035
- 11.2.1 Revenue Forecast to 2035
- 11.2.2 Volume Forecast to 2035
- 11.2.3 CAGR and Year-on-Year Growth
- 11.2.4 Incremental Revenue Opportunity
- 11.3 Forecast Assumptions and Scenario Analysis
- 11.3.1 Base-Case Forecast
- 11.3.2 Optimistic and Conservative Scenarios
- 11.3.3 Technology, Pricing and Policy Sensitivities
- 11.4 Market Attractiveness and Growth Outlook
Chapter 12 Australia Cloud Gaming and Esports Ecosystem Market Segmentation and Outlook
- 12.1 Segmentation Summary and Market Shares, 2025
- 12.2 Largest and Fastest-Growing Segments
- 12.3 By Service Type - Market Size and Forecast, 2025-2035
- 12.3.1 Segment Definition and Scope
- 12.3.2 Historical Market Size, 2018-2025
- 12.3.3 Revenue Forecast, 2025-2035
- 12.3.4 Volume Forecast, 2025-2035
- 12.3.5 Base-Year Market Share, 2025
- 12.3.6 Segment CAGR and Growth Drivers
- 12.3.7 Subsegment Market Size and Forecast
- 12.3.7.1 Cloud Gaming Platform Services
- 12.3.7.2 Dedicated Cloud Gaming Infrastructure
- 12.3.7.3 Esports Competition Services
- 12.3.7.4 Esports Ancillary Services
- 12.3.8 Subsegment Pricing and Adoption Trends
- 12.3.9 Leading Suppliers and Competition
- 12.3.10 Regional Demand and Opportunities
- 12.4 By Customer Type - Market Size and Forecast, 2025-2035
- 12.4.1 Segment Definition and Scope
- 12.4.2 Historical Market Size, 2018-2025
- 12.4.3 Revenue Forecast, 2025-2035
- 12.4.4 Volume Forecast, 2025-2035
- 12.4.5 Base-Year Market Share, 2025
- 12.4.6 Segment CAGR and Growth Drivers
- 12.4.7 Subsegment Market Size and Forecast
- 12.4.7.1 Individual Players and Fans
- 12.4.7.2 Publishers and Platform Operators
- 12.4.7.3 Brands and Media Buyers
- 12.4.7.4 Education Providers
- 12.4.8 Subsegment Pricing and Adoption Trends
- 12.4.9 Leading Suppliers and Competition
- 12.4.10 Regional Demand and Opportunities
- 12.5 By Revenue Model - Market Size and Forecast, 2025-2035
- 12.5.1 Segment Definition and Scope
- 12.5.2 Historical Market Size, 2018-2025
- 12.5.3 Revenue Forecast, 2025-2035
- 12.5.4 Volume Forecast, 2025-2035
- 12.5.5 Base-Year Market Share, 2025
- 12.5.6 Segment CAGR and Growth Drivers
- 12.5.7 Subsegment Market Size and Forecast
- 12.5.7.1 Recurring Subscriptions
- 12.5.7.2 Usage-Based Fees
- 12.5.7.3 Commercial Contracts
- 12.5.7.4 Transactional Purchases
- 12.5.8 Subsegment Pricing and Adoption Trends
- 12.5.9 Leading Suppliers and Competition
- 12.5.10 Regional Demand and Opportunities
- 12.6 Segment Growth Comparison
- 12.7 Segment Attractiveness and Priority Matrix
Chapter 13 Australia Cloud Gaming and Esports Ecosystem End-Use and Application Market Outlook
- 13.1 End-Use Industry and Customer Demand Structure
- 13.2 Leading Applications and Customer Groups
- 13.3 End-Use Market Size, Share and Forecast
- 13.4 Major End-Use Industry Deep Dives
- 13.4.1 Customer Requirements and Use Cases
- 13.4.2 Demand and Replacement Cycles
- 13.4.3 Technical and Regulatory Considerations
- 13.4.4 Purchasing and Procurement Models
- 13.4.5 Leading Vendors and Distribution Channels
- 13.4.6 Forecast and Commercial Opportunities
- 13.5 Emerging Applications and Cross-Segment Demand
- 13.6 End-Use Industry Investment Priorities
Chapter 14 Australia Cloud Gaming and Esports Ecosystem Geographic Market Outlook, 2025-2035
- 14.1 Domestic Market Distribution and Demand Clusters
- 14.2 State- or Province-Wise Market Size and Forecast, 2025-2035
- 14.3 City and Metropolitan Market Outlook
- 14.4 Industrial, Manufacturing and Commercial Clusters
- 14.5 Geographic Concentration of Key End Users
- 14.6 Local Pricing and Purchasing Differences
- 14.7 Domestic Production Facilities and Capacity Map
- 14.8 Local Infrastructure and Project Pipeline
- 14.9 State-Level Policy and Incentive Differences
- 14.10 Subnational Investment Hotspots and Opportunities
- 14.11 Distribution and Logistics Networks
- 14.12 Domestic Competitive Footprint
Chapter 15 Australia Cloud Gaming and Esports Ecosystem Technology, Innovation and Sustainability Outlook
- 15.1 Technology Landscape and Maturity
- 15.2 Product, Process and Service Innovation
- 15.3 AI, Automation and Digital Tools in the Industry
- 15.4 Technology Adoption and Performance Benchmarking
- 15.5 Innovation Pipeline and R&D Investment
- 15.6 Patent and Intellectual Property Trends
- 15.7 Energy Efficiency and Resource Management
- 15.8 Sustainability, Recycling and Circularity
- 15.9 Technology Roadmap, 2025-2035
- 15.10 Risks of Obsolescence and Technology Substitution
Chapter 16 Australia Cloud Gaming and Esports Ecosystem Market Key Strategic Imperatives
- 16.1 Growth and Market Entry Priorities
- 16.2 High-Return Products and Segments
- 16.3 Pricing, Profitability and Cost Optimization
- 16.4 Technology Investment and Product Differentiation
- 16.5 Supply Chain Localization and Resilience
- 16.6 Distribution and Customer Acquisition
- 16.7 Partnership, Acquisition and Capacity Strategy
- 16.8 Regional Expansion Priorities
- 16.9 Short-, Medium- and Long-Term Actions
Chapter 17 Competition Outlook
- 17.1 Industry Competition Characteristics
- 17.2 Market Structure and Concentration
- 17.3 Market Share and Competitive Positioning, 2025
- 17.4 Company-Wise Revenue and Product Benchmarking
- 17.5 Production and Service Capacity Benchmarking
- 17.6 Technology, Pricing and Differentiation
- 17.7 Regional Footprint and Distribution Strength
- 17.8 Mergers, Acquisitions and Strategic Alliances
- 17.9 New Entrants and Competitive Threats
- 17.10 Porter's Five Forces and Industry Attractiveness
- 17.11 Competitive Outlook, 2025-2035
Chapter 18 Company Profiles
- 18.1 Company Coverage and Selection Criteria
- 18.2 Microsoft
- 18.2.1 Business Description
- 18.2.2 Company Ownership and Geographic Presence
- 18.2.3 Product and Service Portfolio
- 18.2.4 Manufacturing and Operating Footprint
- 18.2.5 Production Capacity and Expansion Plans
- 18.2.6 Financial Performance and Investment
- 18.2.7 Market Share and Competitive Position
- 18.2.8 Technology and Innovation Capabilities
- 18.2.9 Strategic Alliances or Partnerships
- 18.2.10 Recent Developments
- 18.2.11 Growth Strategy and Outlook
- 18.3 NVIDIA
- 18.4 Pentanet
- 18.5 ESL FACEIT Group
- 18.6 Riot Games
- 18.7 The Chiefs Esports Club
- 18.8 Ubisoft
- 18.9 BLAST
- 18.10 Fortress
- 18.11 Australian Esports League
- 18.12 Other Relevant Market Participants
Note: Every listed company is profiled on the structure shown under the first company. The company list is preliminary and may change based on research findings, market developments, data availability and client requirements.
Chapter 19 Disclaimer
- 19.1 Research and Forecast Disclaimer
- 19.2 Data Source and Estimation Limitations
Note: The depth of individual sections depends on data availability for this market. Volume, capacity, trade and other unit-based metrics are included where applicable.

