
Market Overview:
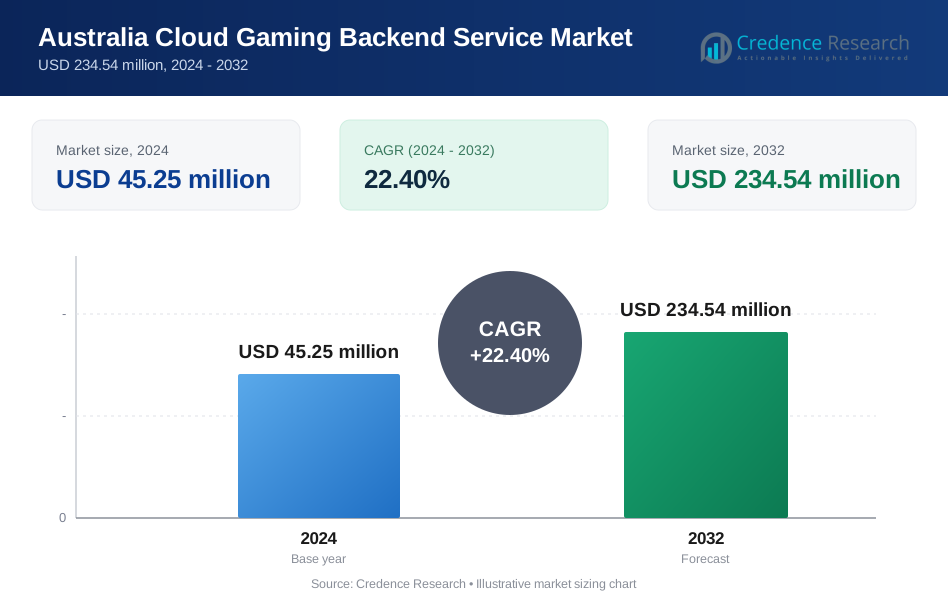
The Australia Cloud Gaming Backend Service Market size was valued at USD 8.30 million in 2018 to USD 45.25 million in 2024 and is anticipated to reach USD 234.54 million by 2032, at a CAGR of 22.40% during the forecast period.
| REPORT ATTRIBUTE | DETAILS |
|---|---|
| Historical Period | 2020-2023 |
| Base Year | 2024 |
| Forecast Period | 2025-2032 |
| Australia Cloud Gaming Backend Service Market Size 2024 | USD 45.25 Million |
| Australia Cloud Gaming Backend Service Market, CAGR | 22.40% |
| Australia Cloud Gaming Backend Service Market Size 2032 | USD 234.54 Million |
The market is gaining momentum due to the increasing demand for seamless gaming experiences across devices. Strong internet penetration and the rollout of 5G networks are enabling faster connectivity, reducing latency, and enhancing overall gameplay. Rising consumer preference for subscription-based cloud gaming services and the adoption of advanced backend solutions to handle growing user bases are driving growth. Companies are investing in scalable infrastructure to support the rising need for high-quality graphics, real-time analytics, and efficient resource management.
Geographically, developed regions like North America and Europe continue to lead due to their mature gaming ecosystems and advanced infrastructure. Australia is emerging as a promising market, supported by government initiatives in digital transformation and expanding broadband coverage. Rapid growth is also evident in Asia-Pacific, where large gaming populations and rising investments in cloud infrastructure create new opportunities. Countries such as China, India, and South Korea are strengthening their positions, making the region a significant contributor to global expansion.
Market Insights
- The Australia Cloud Gaming Backend Service Market was valued at USD 8.30 million in 2018, reached USD 45.25 million in 2024, and is projected to hit USD 234.54 million by 2032, growing at a CAGR of 22.40%.
- The Global Cloud Gaming Backend Service Market size was valued at USD 93.44 million in 2018 to USD 525.00 million in 2024 and is anticipated to reach USD 3,129.24 million by 2032, at a CAGR of 25.00% during the forecast period.
- Eastern Australia held the largest regional share at 52% in 2024, driven by advanced infrastructure and strong broadband penetration.
- Western Australia accounted for 28% share, supported by digital transformation in Perth and rising entertainment demand.
- Northern and Southern Australia collectively captured 20%, with steady growth fueled by expanding urban connectivity and esports adoption.
- Professional Services contributed the highest segment share at 34% in 2024, followed by Usage Analytics at 27%, reflecting demand for scalability and real-time data insights.
Market Drivers
Rising Demand for High-Performance Gaming Experiences Across Multiple Platforms
The Australia Cloud Gaming Backend Service Market is expanding with growing user expectations for immersive and smooth gameplay. Gamers now prefer consistent performance across consoles, PCs, and mobile devices. Companies focus on backend scalability to manage peak traffic and heavy workloads. The adoption of 5G technology improves latency and boosts user satisfaction. Cloud-based backend systems enhance real-time processing for graphics and streaming. Subscription models further drive consumer adoption, creating predictable revenue streams for service providers. Developers are integrating advanced APIs to optimize cloud-based rendering. These factors are positioning the market for sustainable growth.
- For example, at GDC 2025, Microsoft introduced its Xbox Cloud Gaming latency lab and tools like Direct Capture, which cuts input delay by 16–72 ms, alongside WebRTC for improved packet-loss resilience and lower latency—enhancements that optimize the platform’s responsiveness across diverse devices and network environments.
Increasing Adoption of Subscription-Based Gaming and On-Demand Content Models
Subscription-driven models dominate the industry by offering affordable access to premium titles. The Australia Cloud Gaming Backend Service Market benefits from this transition as users prioritize flexibility. Backend providers ensure uninterrupted content delivery to meet growing subscriber bases. Automated resource allocation enhances system efficiency and cost optimization. Scalability of backend platforms allows companies to launch global game libraries seamlessly. Cross-platform availability ensures user retention and engagement. The trend aligns with rising digital spending among younger demographics. The adoption of these services reinforces backend demand in competitive markets.
Integration of Artificial Intelligence and Automation in Backend Services
Artificial intelligence optimizes server management, resource allocation, and traffic monitoring. The Australia Cloud Gaming Backend Service Market leverages AI to predict demand and avoid outages. Automation reduces downtime and enhances operational reliability. AI-driven analytics improve personalization, recommending games based on user behavior. Predictive models minimize disruptions and enable smooth service delivery. Automated scaling ensures resources meet fluctuating player activity. The deployment of AI creates cost savings and higher customer satisfaction. These innovations accelerate backend service adoption across enterprises and gaming studios.
- For example, at the Data + AI Summit 2025, Netflix’s Games Data team showcased their scalable game analytics platform, built to support over 100 mobile and cloud games across TV, mobile, and web. They described architecture decisions, data strategy, and telemetry challenges in a session titled "Lessons Learned: Building a Scalable Game Analytics Platform at Netflix".
Expansion of 5G Networks and Strengthened Internet Penetration
Faster and more reliable connections enable low-latency streaming experiences. The Australia Cloud Gaming Backend Service Market grows stronger with 5G adoption across urban centers. Telecom providers are investing heavily to extend coverage and improve speed. Backend solutions capitalize on this infrastructure to deliver near-console quality gaming. Faster upload and download speeds support real-time multiplayer gaming. Service providers reduce bottlenecks by using edge computing with 5G integration. Broadband upgrades further support suburban and rural penetration. The expansion of high-speed networks ensures robust market growth potential.

Market Trends
Growing Investment in Cloud Infrastructure and Regional Data Center Expansion
The Australia Cloud Gaming Backend Service Market is influenced by rising investments in local cloud infrastructure. Enterprises and service providers build data centers to meet regional demand. Low latency is achieved by placing servers closer to end users. Global players collaborate with regional telecom firms to expand networks. Expansion efforts reduce dependency on international routing and ensure faster services. Sustainability is addressed through eco-friendly data center designs. These strategies enhance service delivery quality and expand customer trust. Data localization trends further support market penetration in Australia.
- For example, in October 2023, Microsoft announced an AU$5 billion investment to expand its Australian data center footprint from 20 to 29 sites, boosting national computing capacity by 250% over two years. As part of the initiative, Microsoft deepened its partnership with Telstra to support AI infrastructure, leveraging upgrades in Telstra’s intercity fiber network.
Increasing Focus on Cross-Platform Gaming and Unified Ecosystem Creation
Cross-platform play is gaining prominence among Australian gamers. The Australia Cloud Gaming Backend Service Market supports unified ecosystems where players interact seamlessly. Backend systems manage user authentication across devices with enhanced security. Cross-platform capability enhances user loyalty by removing device restrictions. Game publishers benefit from broader player bases and community-driven engagement. Developers prioritize backend flexibility to support diverse platforms and device types. Seamless integration ensures consistent experiences across consoles, PCs, and mobiles. These trends reflect consumer demand for unified gaming services.
Adoption of Blockchain for Secure Transactions and Digital Asset Ownership
Blockchain technology is reshaping digital asset management in gaming ecosystems. The Australia Cloud Gaming Backend Service Market embraces blockchain to secure in-game transactions. Smart contracts allow transparent and reliable purchases of skins or virtual items. Backend systems integrate blockchain to prevent fraud and hacking. Token-based ownership enhances gamer confidence in digital assets. Cross-border transactions become faster and more cost-efficient with blockchain integration. Developers explore NFT-backed digital collectibles for immersive experiences. Blockchain adoption fosters trust and innovation in backend operations.
- For example, Immutable, an Australia-based Web3 gaming leader, achieved over 4 million sign-ups for its Immutable Passport within its first year in 2024. This explosive growth establishes Immutable as the fastest-growing Web3 gaming ecosystem, driven by seamless blockchain-backed authentication and digital asset management.
Shift Toward Cloud-Native Development and Continuous Delivery Models
Game developers adopt cloud-native architecture for scalable game deployment. The Australia Cloud Gaming Backend Service Market leverages continuous integration and delivery pipelines. Backend systems support rapid updates without disrupting gameplay. Containerized services ensure efficiency in resource utilization. Developers embrace microservices for flexible and modular backend design. Faster updates improve game quality and player satisfaction. Agile practices enhance adaptability to changing gamer preferences. These advancements reinforce long-term backend service innovation.
Market Challenges Analysis
High Infrastructure Costs and Limited Accessibility in Remote Areas
The Australia Cloud Gaming Backend Service Market faces challenges due to expensive infrastructure development. Establishing high-capacity servers and ensuring low latency requires significant investment. Remote areas continue to struggle with stable connectivity despite national broadband initiatives. Limited accessibility hinders user adoption outside major cities. Service providers face difficulties in expanding cost-effectively across rural regions. High maintenance costs for data centers add financial strain. Energy consumption from servers also raises sustainability concerns. These factors restrict large-scale adoption despite demand potential.
Data Security Concerns and Competitive Market Pressure
Concerns around data privacy and cybersecurity pose risks for service providers. The Australia Cloud Gaming Backend Service Market handles sensitive user data requiring strict safeguards. Hacking attempts and system breaches undermine consumer trust. Strict compliance with regulations increases operational challenges. Competition from established global players intensifies price pressure for local firms. Smaller companies face barriers to scaling due to technological limitations. Balancing innovation and compliance adds complexity for backend providers. This dynamic creates a highly competitive but risk-prone environment.

Market Opportunities
Emergence of E-sports and Growth in Competitive Online Gaming Ecosystems
The Australia Cloud Gaming Backend Service Market gains opportunities from the expansion of e-sports. Professional tournaments require reliable backend infrastructure for global streaming. Increasing youth participation accelerates demand for high-performance platforms. Cloud-based backend services support real-time analytics and spectator engagement tools. Service providers enhance player matchmaking with AI-based algorithms. Sponsorship and advertising revenue streams further fuel backend investments. Growing esports popularity positions Australia as a hub for competitive gaming. The opportunity strengthens backend service scalability in the region.
Expansion of Edge Computing and Regional Partnerships with Telecom Providers
Edge computing reduces latency by processing data closer to the user. The Australia Cloud Gaming Backend Service Market capitalizes on telecom partnerships to expand infrastructure. Service providers deploy edge nodes for faster responsiveness. Collaboration ensures seamless integration of 5G and cloud services. Local partnerships also enable cost-efficient growth strategies. Edge-driven backend solutions unlock new user experiences in immersive gameplay. Stronger collaboration fosters innovation and strengthens market positioning. This approach creates future-ready opportunities for backend service adoption.
Market Segmentation Analysis
The Australia Cloud Gaming Backend Service Market is segmented
By type into professional services, support and maintenance, access and identity management, usage analytics, and others. Professional services hold the largest share due to their role in enabling scalable deployment and seamless integration. Support and maintenance contribute significantly by ensuring uninterrupted operations and system reliability. Access and identity management are growing steadily as security concerns and user authentication gain importance. Usage analytics is expanding quickly, driven by the need to monitor player behavior and optimize engagement. Other services provide specialized solutions that complement broader backend functions.
- For example, Microsoft’s PlayFab Multiplayer Services are used globally, including in Australia, to support backend scalability for live games. The platform enables studios to manage multiplayer sessions, monitor player interactions, and scale analytics dynamically to handle peak live events involving thousands of players.
By end-user, the Australia Cloud Gaming Backend Service Market caters to small and medium enterprises (SMEs) and large enterprises. SMEs are adopting backend services rapidly to access cost-effective and scalable infrastructure. Their focus lies on flexible solutions that allow them to compete with larger rivals in the gaming ecosystem. Large enterprises dominate the segment with strong investments in advanced platforms, robust cloud infrastructure, and wider subscriber bases. It is benefiting from the dual presence of agile SMEs and established enterprises, creating balanced growth across the market landscape.
- For example, Riot Games partners with AWS to power the backend infrastructure of its large-scale titles, ensuring scalable, low-latency gameplay experiences worldwide. AWS supports Riot’s global player base, delivering resilient, always-on services for popular games like League of Legends and VALORANT.

Segmentation
By Type
- Professional Services
- Support and Maintenance
- Access and Identity Management
- Usage Analytics
- Others
By End-User
- Small and Medium Enterprises
- Large Enterprises
Regional Analysis
Eastern Australia
Eastern Australia dominates the Australia Cloud Gaming Backend Service Market with a 52% share. The region benefits from advanced digital infrastructure, strong broadband coverage, and widespread 5G adoption. Major cities such as Sydney, Brisbane, and Melbourne serve as hubs for cloud service deployment and gaming demand. High consumer spending on entertainment and growing esports activity fuel backend service requirements. Service providers establish data centers in this subregion to ensure low latency and premium user experiences. The concentration of technology companies also reinforces ecosystem maturity and competitive strength.
Western Australia
Western Australia holds a 28% market share, supported by rising digital transformation initiatives. Mining and resource-based industries in Perth are adopting cloud solutions, indirectly boosting infrastructure capacity for gaming services. Urban populations demand advanced digital entertainment options, strengthening backend service uptake. Internet connectivity improvements across coastal areas enhance adoption rates. Companies are targeting the subregion to diversify their presence beyond the east coast. The market continues to expand with investments in broadband upgrades and cloud partnerships.
Northern and Southern Australia
Northern and Southern Australia collectively account for a 20% market share. Adoption remains moderate due to sparse population density and limited infrastructure compared to eastern hubs. However, demand is growing in urban areas such as Adelaide and Darwin, where government initiatives are supporting digital adoption. Service providers are gradually expanding coverage to improve accessibility in remote regions. Rising youth gaming activity and the spread of esports culture increase backend demand. The Australia Cloud Gaming Backend Service Market in these subregions reflects steady growth opportunities as digital connectivity improves.
Key Player Analysis
- Tencent
- Naver
- NetEase
- Sony Interactive Entertainment
- Alibaba Cloud
- Blacknut
- Microsoft Azure
- NVIDIA GeForce Now
- Ubitus
- Garena
Competitive Analysis
The Australia Cloud Gaming Backend Service Market is highly competitive, with global and regional players striving for dominance. Companies such as Tencent, Microsoft Azure, NVIDIA GeForce Now, and Sony Interactive Entertainment lead with strong infrastructure, global brand presence, and extensive game portfolios. It is driven by strategic alliances with telecom providers, cloud data expansion, and investment in low-latency platforms. Regional players like Blacknut and Ubitus position themselves through niche offerings and partnerships with local service providers. Competition is marked by aggressive pricing strategies, mergers, and investments in AI-enabled backend solutions. Market leaders differentiate by ensuring seamless cross-platform integration and scalable infrastructure to manage rising demand. Localized services gain momentum as companies adapt to regulatory guidelines and user preferences. The Australia Cloud Gaming Backend Service Market is set to see intensified rivalry as more firms enter to leverage expanding demand, creating an ecosystem that blends international expertise with regional opportunities.
Recent Developments
- In August 2025, Tencent Cloud announced a strategic partnership with WeTest and Voodoo during gamescom 2025, aiming to accelerate hyper-casual game development and monetization via AI-driven testing tools, with an emphasis on rapid iteration and global scalability for gaming infrastructure providers targeting markets like Australia.
- In September 2025, NVIDIA launched the Blackwell RTX upgrade for GeForce NOW, bringing RTX 5080-class power streaming to the cloud. This update enables higher gaming resolutions and frame rates, new competitive high-performance modes, and access to over 2,200 titles, further solidifying NVIDIA's presence in the North American cloud gaming backend service market.
- In June 2025, NVIDIA entered additional publisher partnerships that added over 25 new titles to GeForce NOW in North America, reflecting the company's continued collaboration-oriented growth in the backend gaming service space.
- In March 2025, Xsolla and AWS entered into a key partnership designed to empower game developers with the latest advancements in cloud gaming and LiveOps solutions. The collaboration leverages AWS’s cloud infrastructure and Xsolla’s developer platform to create scalable, flexible backend solutions, further strengthening their positions in the expanding global cloud gaming backend service sector.
- In July 2024, Xsolla announced the acquisition of LF.Group to enhance gaming connectivity and commerce, empower creators, and improve user engagement across multiple platforms. This strategic move aims to give Xsolla a stronger foothold in the global cloud gaming backend service market by integrating LF.Group's technology stack and community features into its existing offerings, driving forward innovation in backend solutions for cloud gaming environments.
Report Coverage
The research report offers an in-depth analysis based on type and end-user. It details leading market players, providing an overview of their business, product offerings, investments, revenue streams, and key applications. Additionally, the report includes insights into the competitive environment, SWOT analysis, current market trends, as well as the primary drivers and constraints. Furthermore, it discusses various factors that have driven market expansion in recent years. The report also explores market dynamics, regulatory scenarios, and technological advancements that are shaping the industry. It assesses the impact of external factors and global economic changes on market growth. Lastly, it provides strategic recommendations for new entrants and established companies to navigate the complexities of the market.
Future Outlook
- The Australia Cloud Gaming Backend Service Market will witness stronger adoption as digital infrastructure matures.
- Expansion of 5G coverage will enable smoother cloud-based gaming experiences across urban and semi-urban regions.
- Esports growth will boost backend service demand for real-time streaming and competitive gameplay.
- Cross-platform integration will remain a priority to enhance gamer accessibility and engagement across devices.
- AI-driven backend solutions will streamline resource allocation and ensure reliable performance at scale.
- Blockchain adoption will strengthen transaction security and digital asset ownership in the market.
- Regional data center expansion will improve latency and support localized gaming experiences.
- Partnerships between telecom providers and gaming platforms will accelerate service rollout.
- Small and medium enterprises will increasingly invest in backend services for cost-efficient scalability.
- The market will evolve into a more competitive space with global and regional players innovating aggressively.
Request a Free Sample
Fill in your details and we'll send you a free sample report.
- Sample data tables & charts
- Research methodology
Need a Custom Version of This Report?
Tailor the scope, geography, or segments to your exact requirements.
- Custom geography or segment scope
- Direct access to our analyst team
Frequently Asked Questions
What is the current market size for Australia Cloud Gaming Backend Service Market, and what is its projected size in 2032?
At what Compound Annual Growth Rate is the Australia Cloud Gaming Backend Service Market projected to grow between 2024 and 2032?
Which Australia Cloud Gaming Backend Service Market segment held the largest share in 2024?
What are the primary factors fueling the growth of the Australia Cloud Gaming Backend Service Market?
Who are the leading companies in the Australia Cloud Gaming Backend Service Market?
Which region commanded the largest share of the Australia Cloud Gaming Backend Service Market in 2024?
Table of Content
Chapter 1. Report Introduction
- 1.1 Report Description & Purpose
- 1.1.1 Report Title & Market Definition
- 1.1.2 Unique Selling Propositions (USP) & Key Differentiators
- 1.1.3 Value Proposition for Stakeholders
- 1.2 Research Objectives
- 1.2.1 Market Sizing Objectives (Volume & Revenue)
- 1.2.2 Segmentation Objectives
- 1.2.3 Competitive Intelligence Objectives
- 1.2.4 Forecast & Scenario Objectives
- 1.3 Report Scope
- 1.3.1 Australia Cloud Gaming Backend Service Scope – Types & Subtypes Covered
- 1.3.2 Geographic Scope – Regions & Countries Covered
- 1.3.3 Historical Period, Base Year & Forecast Period (2024; forecast to 2032)
- 1.3.4 Inclusions & Exclusions
- 1.4 HS Code & Classification Framework
- 1.5 Currency, Units & Pricing Basis
- 1.6 Target Stakeholders
- 1.7 Limitations & Assumptions
Chapter 2. Executive Summary
- 2.1 Global Australia Cloud Gaming Backend Service Market Snapshot
- 2.1.1 Market Size – Historical (2024) & Forecast (2024-2032) (2024: USD 45.25 million → 2032: USD 234.54 million)
- 2.1.2 Volume & Revenue – Global Totals
- 2.1.3 Key Market Highlights – Top Five Facts
- 2.2 Australia Cloud Gaming Backend Service Market Segmentation Snapshot
- 2.2.1 Market Split by Region – 2024 vs. 2032
- 2.3 Competitive Snapshot
- 2.3.1 Top 10 Players by Revenue Share – 2024
- 2.3.2 Top 10 Players by Volume Share – 2024
- 2.3.3 Recent Strategic Developments (18-Month Summary)
- 2.4 Key Investment Highlights & Strategic Conclusions
Chapter 3. Australia Cloud Gaming Backend Service Market Dynamics & Industry Analysis
- 3.1 Market Overview & Context
- 3.1.1 Australia Cloud Gaming Backend Service Market Position in the Broader Automotive Value Chain
- 3.1.2 OEM vs. Replacement Market Dynamics
- 3.1.3 Market Maturity & Development Stage by Region
- 3.2 Australia Cloud Gaming Backend Service Market Drivers
- 3.3 Australia Cloud Gaming Backend Service Market Restraints & Challenges
- 3.4 Australia Cloud Gaming Backend Service Market Opportunities
- 3.5 Porter's Five Forces Analysis
- 3.5.1 Threat of New Entrants
- 3.5.2 Bargaining Power of Suppliers
- 3.5.3 Bargaining Power of Buyers
- 3.5.4 Threat of Substitutes
- 3.5.5 Competitive Rivalry – Intensity Assessment
- 3.6 Australia Cloud Gaming Backend Service Value Chain Analysis
- 3.6.1 Upstream – Raw Material/Input Suppliers
- 3.6.1.1 Raw Material/Input 1
- 3.6.1.2 Raw Material/Input 2
- 3.6.1.3 Raw Material/Input 3
- 3.6.2 Midstream – Production/Manufacturing/Service Delivery
- 3.6.2.1 Production/Process Overview
- 3.6.2.2 Key Facility Locations & Capacity by Manufacturer
- 3.6.3 Downstream – Distribution & End Consumer
- 3.6.3.1 Primary Channel – B2B/OEM
- 3.6.3.2 Secondary Channels – Dealer, Retail, Online, Direct
- 3.6.4 Value Chain Profitability Analysis
- 3.6.1 Upstream – Raw Material/Input Suppliers
- 3.7 PESTEL Analysis
- 3.7.1 Political Factors
- 3.7.2 Economic Factors
- 3.7.3 Social Factors
- 3.7.4 Technological Factors
- 3.7.5 Environmental Factors
- 3.7.6 Legal Factors
- 3.8 Australia Cloud Gaming Backend Service Supply Chain Analysis
- 3.8.1 Raw Material/Input Supply Risk Assessment
- 3.8.2 Manufacturing Concentration Risk (Geographic Exposure)
- 3.8.3 Trade Disruption Impact Analysis
- 3.9 Regulatory & Policy Landscape
Note: The regulatory and policy landscape section covers regulations based on their applicability to the market, Australia Cloud Gaming Backend Service category, geography, and scope of the study. Only regulatory frameworks with a material impact on operations, compliance, trade, sustainability, or market access are analyzed in detail.
Chapter 4. Key Investment Pockets & Opportunity Analysis
- 4.1 Australia Cloud Gaming Backend Service Market Attractiveness Analysis
- 4.1.1 By Region – Investment Attractiveness Matrix (Volume × CAGR)
- 4.2 Absolute Revenue Growth Opportunity
- 4.2.1 By Region – Absolute USD Growth Through 2032
- 4.3 Incremental Volume Opportunity
- 4.3.1 By Region – Incremental Volume Through 2032
- 4.3.2 Segment – Incremental Volume
- 4.4 Emerging Submarket Opportunity Deep Dive (Subject to Applicability)
- 4.5 Emerging Market Opportunity Scorecards
- 4.5.1 United States
- 4.5.2 Europe
- 4.5.3 Asia
- 4.5.4 Middle East & Africa
Note: Emerging Market Opportunity Scorecards will be included based on relevance and strategic importance. Regions listed are indicative and may vary depending on data availability and market dynamics.
Chapter 5. Australia Cloud Gaming Backend Service Import-Export Analysis & Trade Flows
- 5.1 Global Trade Overview
- 5.1.1 Global Export Value by Country (2024)
- 5.1.2 Global Export Volume by Country (2024)
- 5.1.3 Global Import Value by Country (2024)
- 5.1.4 Global Import Volume by Country (2024)
- 5.1.5 Net Trade Balance by Country (2024)
- 5.2 Export Analysis – Segment
- 5.2.1 Type 1 (HS Code)
- 5.2.2 Type 2 (HS Code)
- 5.2.3 Type 3 (HS Code)
- 5.2.4 Type 4 (HS Code)
- 5.2.5 Type 5 (HS Code)
- 5.3 Import Analysis – Segment
- 5.3.1 Type 1 (HS Code)
- 5.3.2 Type 2 (HS Code)
- 5.3.3 Type 3 (HS Code)
- 5.3.4 Type 4 (HS Code)
- 5.3.5 Type 5 (HS Code)
- 5.4 Average Unit Trade Prices
- 5.4.1 Average Export Price – Segment & Country
- 5.4.2 Average Import Price – Segment & Source Country
- 5.4.3 Price Trends (2024)
- 5.5 Key Trade Route Analysis
- 5.5.1 Trade Route 1
- 5.5.2 Trade Route 2
- 5.5.3 Trade Route 3
- 5.5.4 Trade Route 4
- 5.5.5 Trade Route 5
- 5.6 Trade Policy Impact Assessment
- 5.6.1 US Anti-Dumping & Section 301 Tariffs
- 5.6.2 EU Customs Union Impact
- 5.6.3 Major Free Trade Agreements
- 5.6.4 USMCA Rules of Origin
Note: Trade policy analysis will be included only where relevant to the Australia Cloud Gaming Backend Service market.
Chapter 6. Competitive Landscape & Company Benchmarking
- 6.1 Australia Cloud Gaming Backend Service Market Concentration & Structure
- 6.1.1 Herfindahl-Hirschman Index (HHI) – vs. 2024
- 6.1.2 Tier 1, Tier 2 & Tier 3 Market Structure
- 6.1.3 Global, Regional & Local Player Dynamics
- 6.2 Australia Cloud Gaming Backend Service Market Share Analysis – 2024
- 6.2.1 Global Revenue Share by Company
- 6.2.2 Global Volume Share by Company
- 6.2.3 Regional Revenue Share
- 6.2.4 Market Share Evolution ( vs. 2024)
- 6.2.5 OEM Segment Share by Company
- 6.2.6 Replacement Segment Share by Company
- 6.3 Production/Delivery Capacity & Facility Analysis
- 6.3.1 Global Installed Capacity
- 6.3.2 Capacity Utilization Rates
- 6.3.3 Production/Output Volume
- 6.3.4 Facility Locations & Capacity Map
- 6.3.5 Planned Capacity Additions
- 6.4 Australia Cloud Gaming Backend Service Competitive Benchmarking Matrix
- 6.4.1 Revenue, Volume, CAGR & Profitability Comparison
- 6.4.2 Channel Revenue Mix
- 6.4.3 Geographic Revenue Exposure
- 6.4.4 R&D Intensity
- 6.4.5 Sustainability Maturity
- 6.5 Strategic Developments in Australia Cloud Gaming Backend Service (Last 24 Months)
- 6.5.1 Mergers, Acquisitions & Divestments
- 6.5.2 New Australia Cloud Gaming Backend Service Launches
- 6.5.3 Facility Expansions
- 6.5.4 Strategic Alliances, Joint Ventures & Partnerships
- 6.5.5 Distribution Expansion & Market Entry
- 6.5.6 Sustainability & ESG Initiatives
- 6.6 Competitive Strategy Mapping
- 6.6.1 Leader, Challenger, Follower & Niche Classification
- 6.6.2 Pricing Strategy Comparison
- 6.6.3 Channel Strategy Matrix
Note: Strategic developments are included based on their materiality and the availability of reliable information.
Chapter 7. Global Australia Cloud Gaming Backend Service Market – By Distribution Channel
- 7.1 Segment Overview
- 7.1.1 Volume & Revenue Split by Channel (2024 & 2032)
- 7.1.2 Channel Mix Evolution (2024-2032)
Chapter 8. Regional Market Analysis – Global Overview
- 8.1 Global Regional Overview
- 8.1.1 Regional Volume Share
- 8.1.2 Regional Revenue Share
- 8.1.3 Regional Volume by Region
- 8.1.4 Regional Revenue by Region
- 8.1.5 Regional Forecast Through 2032
- 8.2 Cross-Regional Segment Analysis
- 8.2.1 By Distribution Channel
- 8.2.2 By Brand/Price Tier
Chapter 9. North America Australia Cloud Gaming Backend Service Market
- 9.1 United States
- 9.2 Canada
- 9.3 Mexico
Chapter 10. Europe Australia Cloud Gaming Backend Service Market
- 10.1 Germany
- 10.2 France
- 10.3 Italy
- 10.4 United Kingdom
- 10.5 Spain
- 10.6 Poland
- 10.7 Russia
- 10.8 Netherlands
- 10.9 Belgium
- 10.10 Sweden
- 10.11 Denmark
- 10.12 Norway
- 10.13 Rest of Europe
Chapter 11. Asia Pacific Australia Cloud Gaming Backend Service Market
- 11.1 China
- 11.2 India
- 11.3 Japan
- 11.4 South Korea
- 11.5 Thailand
- 11.6 Indonesia
- 11.7 Vietnam
- 11.8 Malaysia
- 11.9 Australia
- 11.10 Rest of Asia Pacific
Chapter 12. Latin America Australia Cloud Gaming Backend Service Market
- 12.1 Brazil
- 12.2 Argentina
- 12.3 Colombia
- 12.4 Chile
- 12.5 Rest of Latin America
Chapter 13. Middle East Australia Cloud Gaming Backend Service Market
- 13.1 Saudi Arabia
- 13.2 United Arab Emirates
- 13.3 Turkey
- 13.4 Israel
- 13.5 Iran
- 13.6 Rest of the Middle East
Chapter 14. Africa Australia Cloud Gaming Backend Service Market
- 14.1 South Africa
- 14.2 Egypt
- 14.3 Nigeria
- 14.4 Morocco
- 14.5 Rest of Africa
Chapter 15. Australia Cloud Gaming Backend Service Company Profiles
- 15.1 [Company 01]
- 15.1.1 Company Overview
- 15.1.2 Key Management Personnel
- 15.1.3 Products & Services Portfolio
- 15.1.4 Financial Performance
- 15.1.5 Key Market Focus & Geographic Presence
- 15.1.6 Recent Developments & Strategic Initiatives
Note: The company profile list is preliminary and may change based on research findings, market developments, data availability, and client requirements.
Chapter 16. Appendices
- Appendix A – List of Abbreviations & Acronyms
- Appendix B – Industry Classification Code Reference – Full Series
- Appendix C – Production & Capacity Data Tables
- Appendix D – End-Use & Demand Base Tables
- Appendix E – Consumption & Replacement Rate Assumptions
- Appendix F – ASP Reference Tables
- Appendix G – Manufacturing & Facility Database
- Appendix H – Import-Export Data Tables
- Appendix I – Regulatory Summary Tables
- Appendix J – Primary Research Participant List (Anonymized)
- Appendix K – Primary Research Questionnaire Framework
- Appendix L – Data Sources & Bibliography
- Appendix M – Market Size Divergence & Source Comparison
Chapter 17. Research Methodology
- 17.1 Research Framework & Philosophy
- 17.2 Secondary Research – Sources, Hierarchy & Data Extraction
- 17.3 Data Modeling – Bottom-Up & Top-Down Market Sizing
- 17.4 Primary Research – Stakeholder Framework, LOI & Sample Sizes
- 17.5 Forecast Methodology – Regression, Scenario & Sensitivity Analysis
- 17.6 Quality Control – Four-Layer Validation Framework
- 17.7 Limitations & Standard Assumptions
- 17.8 Disclaimer
