
Mobile-first audiences pull Filipino brand budgets online
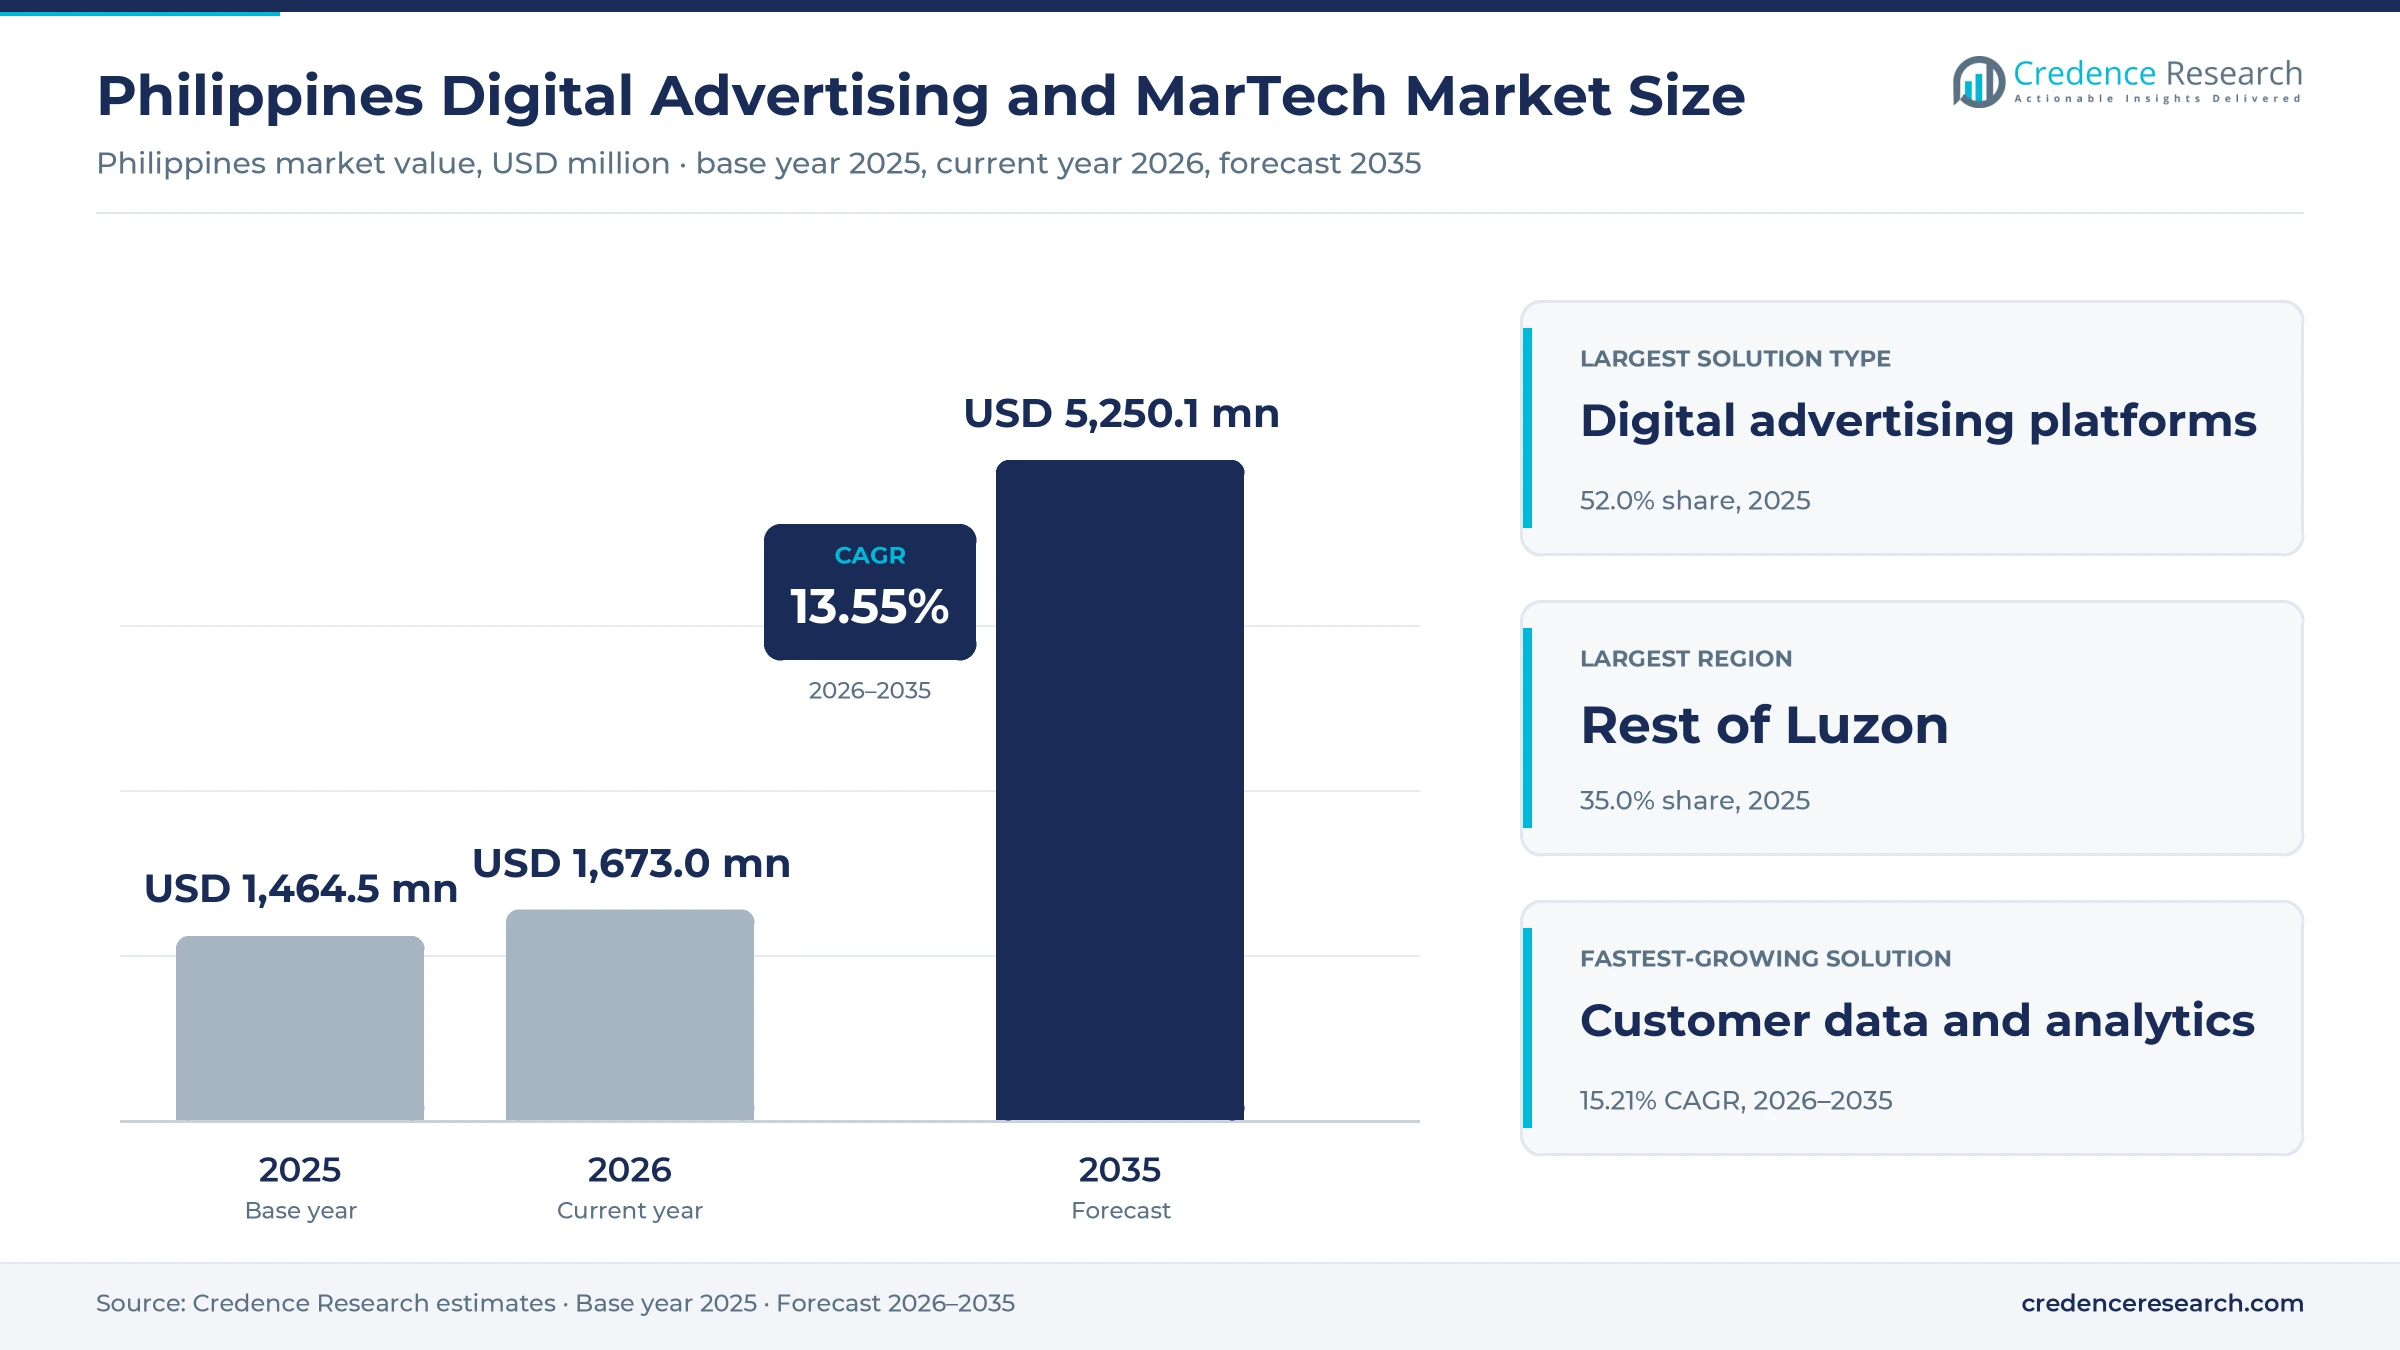
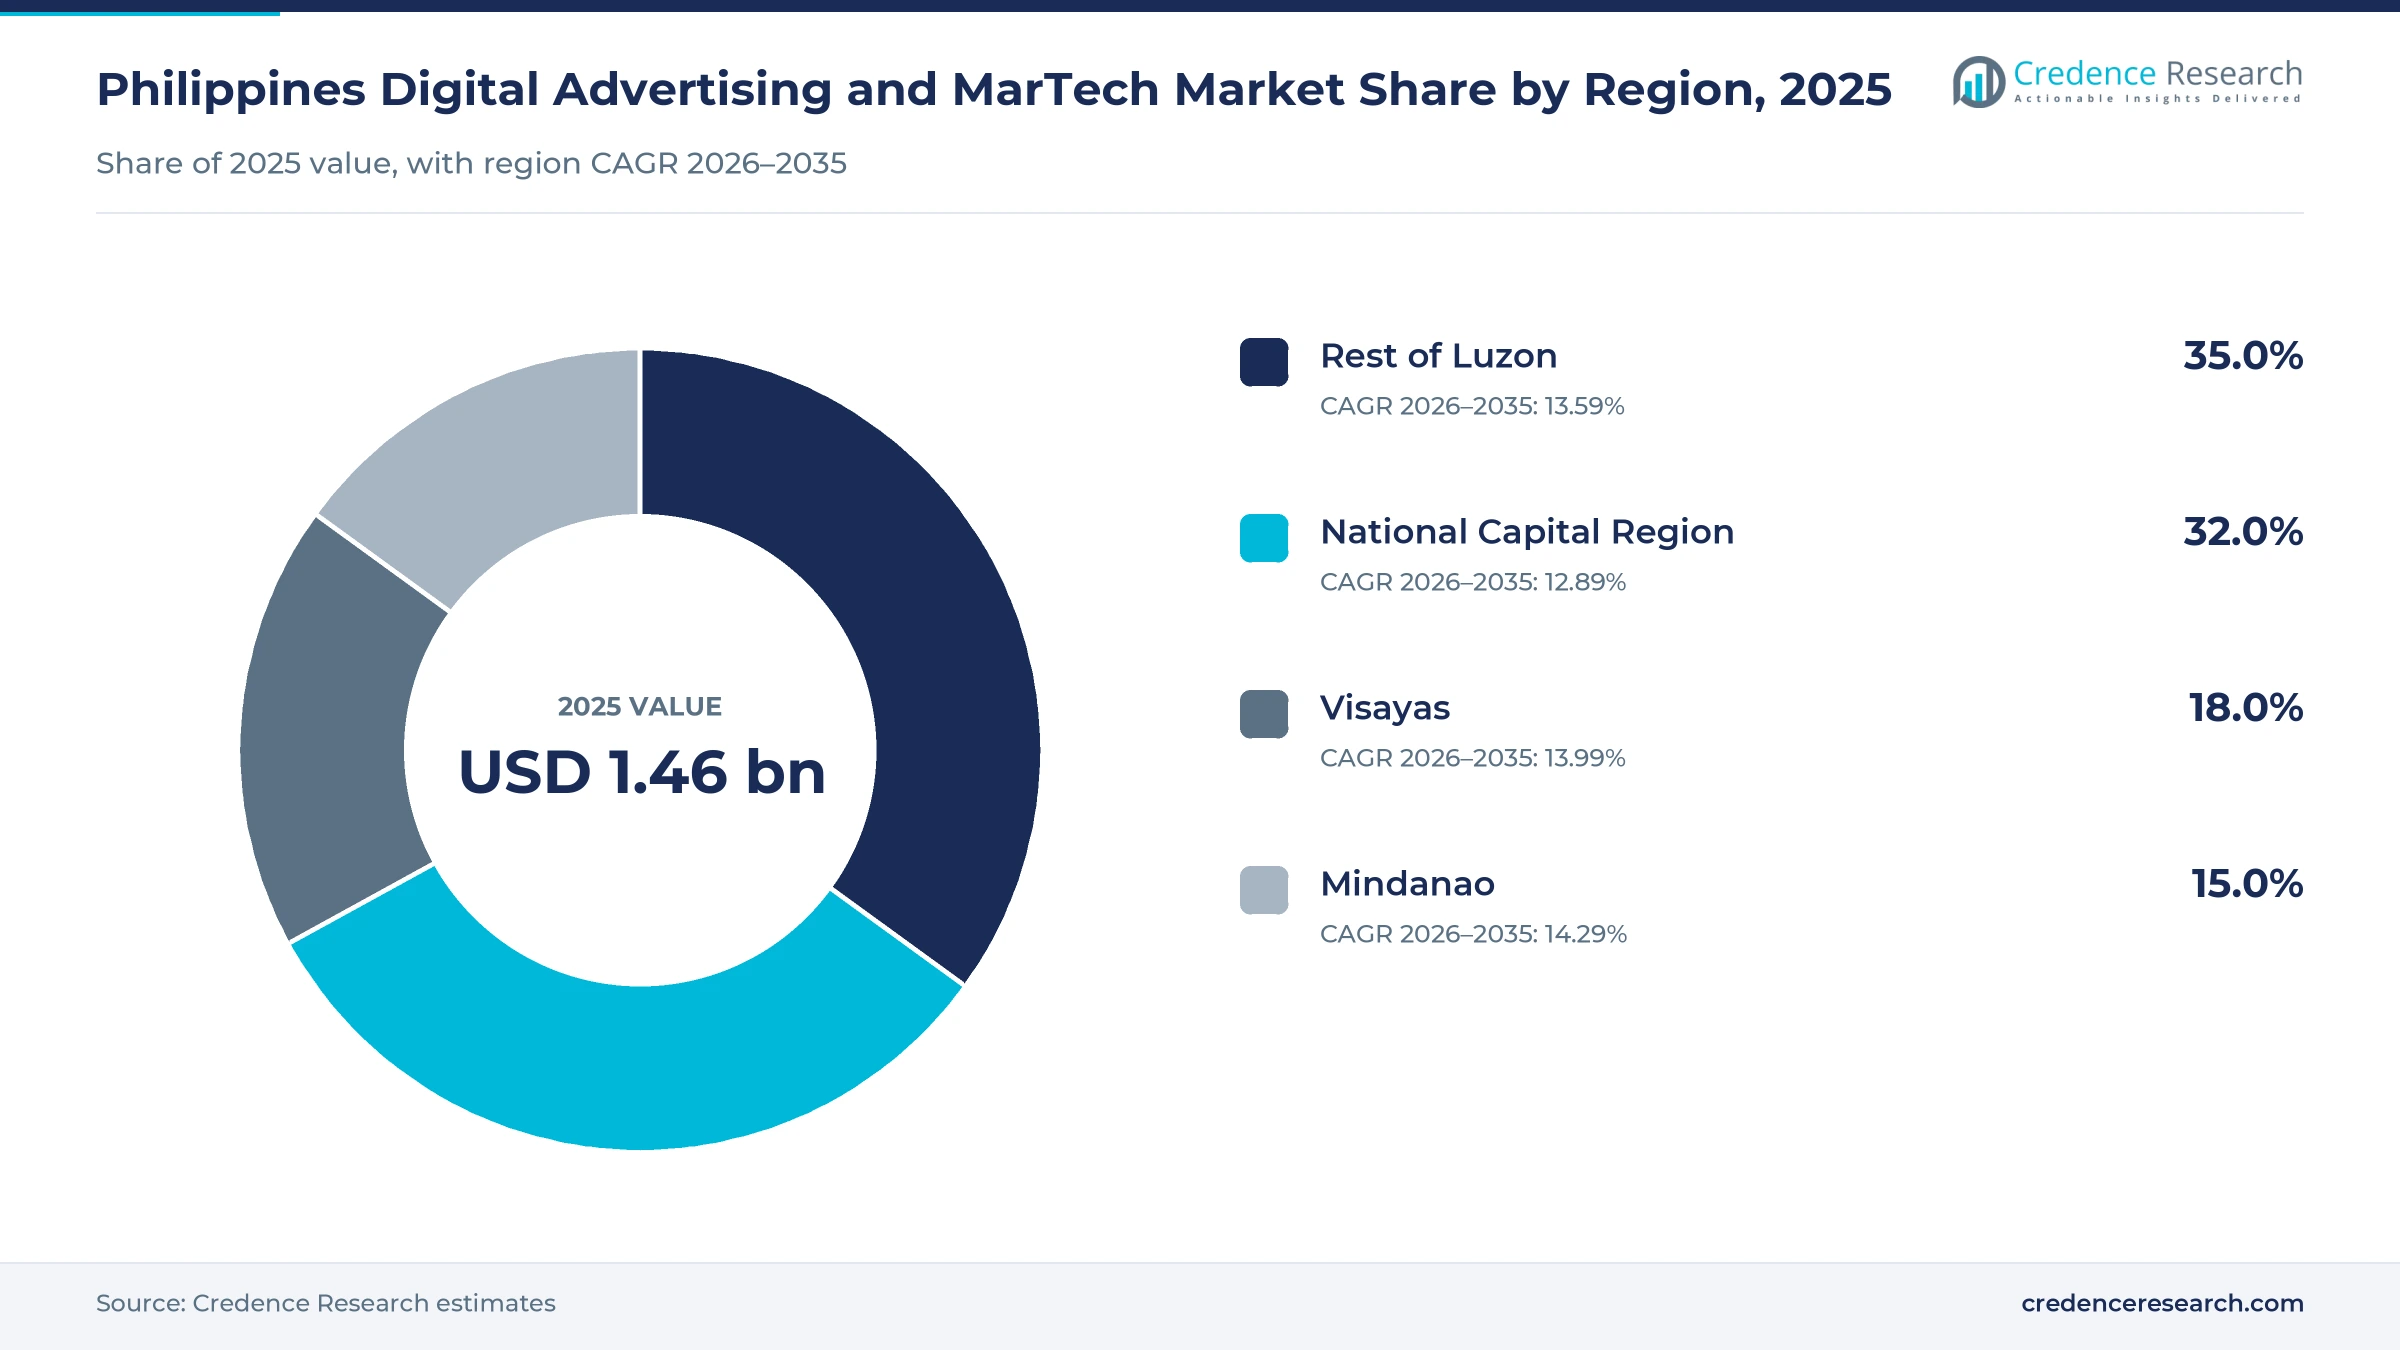
The Philippines digital advertising and Martech market was valued at USD 1.46 billion in 2025 and is projected to increase from USD 1.67 billion in 2026 to USD 5.25 billion by 2035, registering a CAGR of 13.55% during 2026–2035. Demand comes from retailers, banks, e-wallets, telecom operators and consumer brands that move budgets from television and print to social feeds, search, online video, creator content and marketing software. Rest of Luzon held the largest regional share, 35.0% in 2025, because Calabarzon and Central Luzon add dense suburban audiences and large retail networks to the national total. Mindanao is the fastest-growing region at 14.29% a year, as mobile internet use and online payments spread across southern cities. In turn, the Philippines began applying 12% value-added tax to foreign digital services, including online media and advertising, under a law signed in October 2024.
Which paid media and marketing software does the estimate cover?
The estimate measures spending by advertisers in the Philippines on digital advertising platforms, agency and managed services, marketing automation software and customer data and analytics tools. It covers campaigns and subscriptions bought by small firms, mid-market companies, large enterprises and public-sector bodies across customer acquisition, engagement, loyalty and measurement work.
The estimate excludes television, radio, print and outdoor media, unpaid organic posts and general enterprise software that is not used for marketing. The value chain runs from advertisers and agencies through ad platforms, software vendors, publishers and creators to the Filipino audiences who view and act on each campaign.
Philippines Digital Advertising and Martech Market Insights
- The Philippines digital advertising and Martech market was valued at USD 1.46 billion in 2025 and is projected to reach USD 5.25 billion by 2035, registering a CAGR of 13.55% during 2026–2035.
- Rest of Luzon held a 35.0% share of 2025 value, because Calabarzon and Central Luzon add large suburban audiences and retail networks.
- Digital advertising platforms led with a 52.0% share of 2025 value, because social, search and video apps reach most connected Filipino adults.
- The Philippines had 98.0 million internet users at the end of 2025, equal to 83.8% of the population, according to figures published in November 2025.
- Customer data and analytics tools grow fastest at 15.21% a year during 2026–2035, as brands build first-party records for targeting and measurement.
Ad platforms lead while customer data tools grow fastest
Why do ad platforms take the largest share of budgets?
Based on solution type, the market is categorized into digital advertising platforms, agency and managed services, marketing automation and customer data and analytics. Digital Advertising Platforms led with a 52.0% share of 2025 value, because social, search and video apps carry most paid media. Customer Data and Analytics grows fastest at 15.21% a year, as brands unify customer records for targeting.
Which industries spend the most on online campaigns?
Based on end-use industry, the market is categorized into retail and e-commerce, financial services, telecommunications and media, and consumer services. Retail and E-Commerce led with a 34.0% share of 2025 value, because sellers run constant promotions on marketplaces and social apps. Financial Services grow fastest at 14.45% a year, as banks and e-wallets compete for users.
How do large and small firms split marketing budgets?
Based on enterprise size, the market is categorized into micro and small businesses, mid-market enterprises, large enterprises and public-sector institutions. Large Enterprises led with a 40.0% share of 2025 value, because national brands buy integrated media and software contracts. Micro and Small Businesses grow fastest at 14.25% a year, as self-service ad tools lower entry costs.
Which marketing tasks attract the most spending?
Based on application, the market is categorized into customer acquisition, customer engagement, retention and loyalty, and measurement and optimization. Customer Acquisition led with a 46.0% share of 2025 value, because most budgets still pay for reach, clicks and new buyers. Measurement and Optimization grows fastest at 14.56% a year, as advertisers demand proof of return on every campaign.
| Segment Group | Leading Sub-segment | Share, 2025 | Fastest-growing Sub-segment | CAGR, 2026–2035 |
|---|---|---|---|---|
| By Solution Type | Digital Advertising Platforms | 52.0% | Customer Data and Analytics | 15.21% |
| By End-Use Industry | Retail and E-Commerce | 34.0% | Financial Services | 14.45% |
| By Enterprise Size | Large Enterprises | 40.0% | Micro and Small Businesses | 14.25% |
| By Application | Customer Acquisition | 46.0% | Measurement and Optimization | 14.56% |
Request a Free Sample
Fill in your details and we'll send you a free sample report.
- Sample data tables & charts
- Research methodology
Social reach, online payments and AI tools lift spending
How does a mass mobile and social audience expand spending?
A mass mobile and social audience lifts spending, because brands can reach most Filipino adults through feeds, short video and search on their phones. The Philippines had 98.0 million internet users at the end of 2025, or 83.8% of the population, according to DataReportal. The same source counts 95.8 million social media user identities and 137 million cellular connections, equal to 117% of the population. TikTok ad reach stood at 64.0 million adults, while YouTube ad reach covered 59.6 million people in late 2025. As a result, digital advertising platforms hold 52.0% of 2025 value, because advertisers follow audiences into the apps where they spend most time.
Why does commerce and payment digitization widen the advertiser base?
Commerce and payment digitization widens the advertiser base, because sellers that take orders and payments online can track each peso spent on campaigns. Digital payments made up 57.4% of retail payment volume in 2024, up from 52.8% in 2023, according to central bank data. By value, digital payments reached 59.0% of retail payments in 2024, which shows that larger purchases are also moving online. The Internet Transactions Act, signed on Dec. 5, 2023, created an Electronic Commerce Bureau under the trade department to protect online buyers and merchants. In turn, financial services grow at 14.45% a year, as banks promote e-wallet transfers to new users.
How do cloud, AI and automation tools raise software demand?
Cloud, AI and automation adoption raises spending on marketing software, because brands want to personalize messages at scale without adding large teams. Salesforce said on Nov. 18, 2025, that it is opening a Manila office and will train 12,000 Filipino workers in AI and CRM skills over five years, according to Salesforce. The company also made Agentforce for Service available in Tagalog and named Ayala Land, Bank of the Philippine Islands, Meralco and PLDT among local customers. Google launched AI shopping and creator partnership tools for Philippine businesses on July 8, 2026. As a result, customer data and analytics grows fastest at 15.21% a year, supported by customer data platforms that unify first-party records.
Why does a larger digital economy deepen marketing budgets?
Growth of the wider digital economy deepens marketing budgets, because more firms and workers now earn income through online services that need promotion. The digital economy reached PHP 2.25 trillion in 2024, up 7.6%, and equaled 8.5% of gross domestic product, according to statistics reported by the Department of Economy, Planning and Development. Digital economy employment rose to 11.30 million workers in 2024, or 23.1% of national employment, from 10.78 million in 2023. E-commerce contributed 13.5% of digital economy output in the same year, which gives online sellers a larger role in ad budgets. In turn, micro and small businesses grow at 14.25% a year, as self-service ad tools lower entry costs.
Shoppable video, agency tech and tax rules reshape buying
How is the rise of shoppable video changing campaigns?
The rise of shoppable video is changing campaigns, because brands now pay for sales generated inside live streams and creator clips, not only for views. TikTok Shop said sales for local sellers rose by more than 200% in 2025, according to the TikTok newsroom. More than 25,000 Filipino entrepreneurs joined its capacity-building programs in 2025, while its local products campaign drew over 12 million live session views. Google added Creator Partnerships Boost in July 2026, which lets brands run creator videos on YouTube as paid ads. As a result, retail and e-commerce advertisers shift more budget toward influencer marketing that is tied to measurable sales.
Why is the shift to agency-owned ad tech significant?
The shift to agency-owned ad tech is significant, because agencies now combine creative work, media buying and data tools under one roof. AdSpark, part of Brave Connective Holdings under Globe, named Manny Fernando chief executive from Sept. 1, 2025, bringing more than 30 years of telecom and marketing experience. The agency has acquired DeepSea to strengthen programmatic advertising and Secret Menu to expand creative production. WPP has also merged Mindshare, Wavemaker and EssenceMediacom under the WPP Media brand, which simplifies how clients buy media. In turn, agency and managed services move toward programmatic media buying and data-led retainers, while large enterprises keep 40.0% of 2025 value.
Why does the move to local tax billing matter for buyers?
The move to local tax billing matters for buyers, because foreign platforms that sell ads in the Philippines now charge value-added tax on their services. Republic Act 12023 was signed on Oct. 2, 2024, and lists online media and advertising among the digital services subject to 12% tax. The government expects the law to raise about PHP 105 billion over five years, with 5% of the revenue going to the local creative industry. That creative share can fund local studios, film talent and content producers who work on brand campaigns. As a result, advertisers rework budgets and contracts, while measurement and optimization grows at 14.56% a year.
Can wider connectivity outside Metro Manila open new audiences?
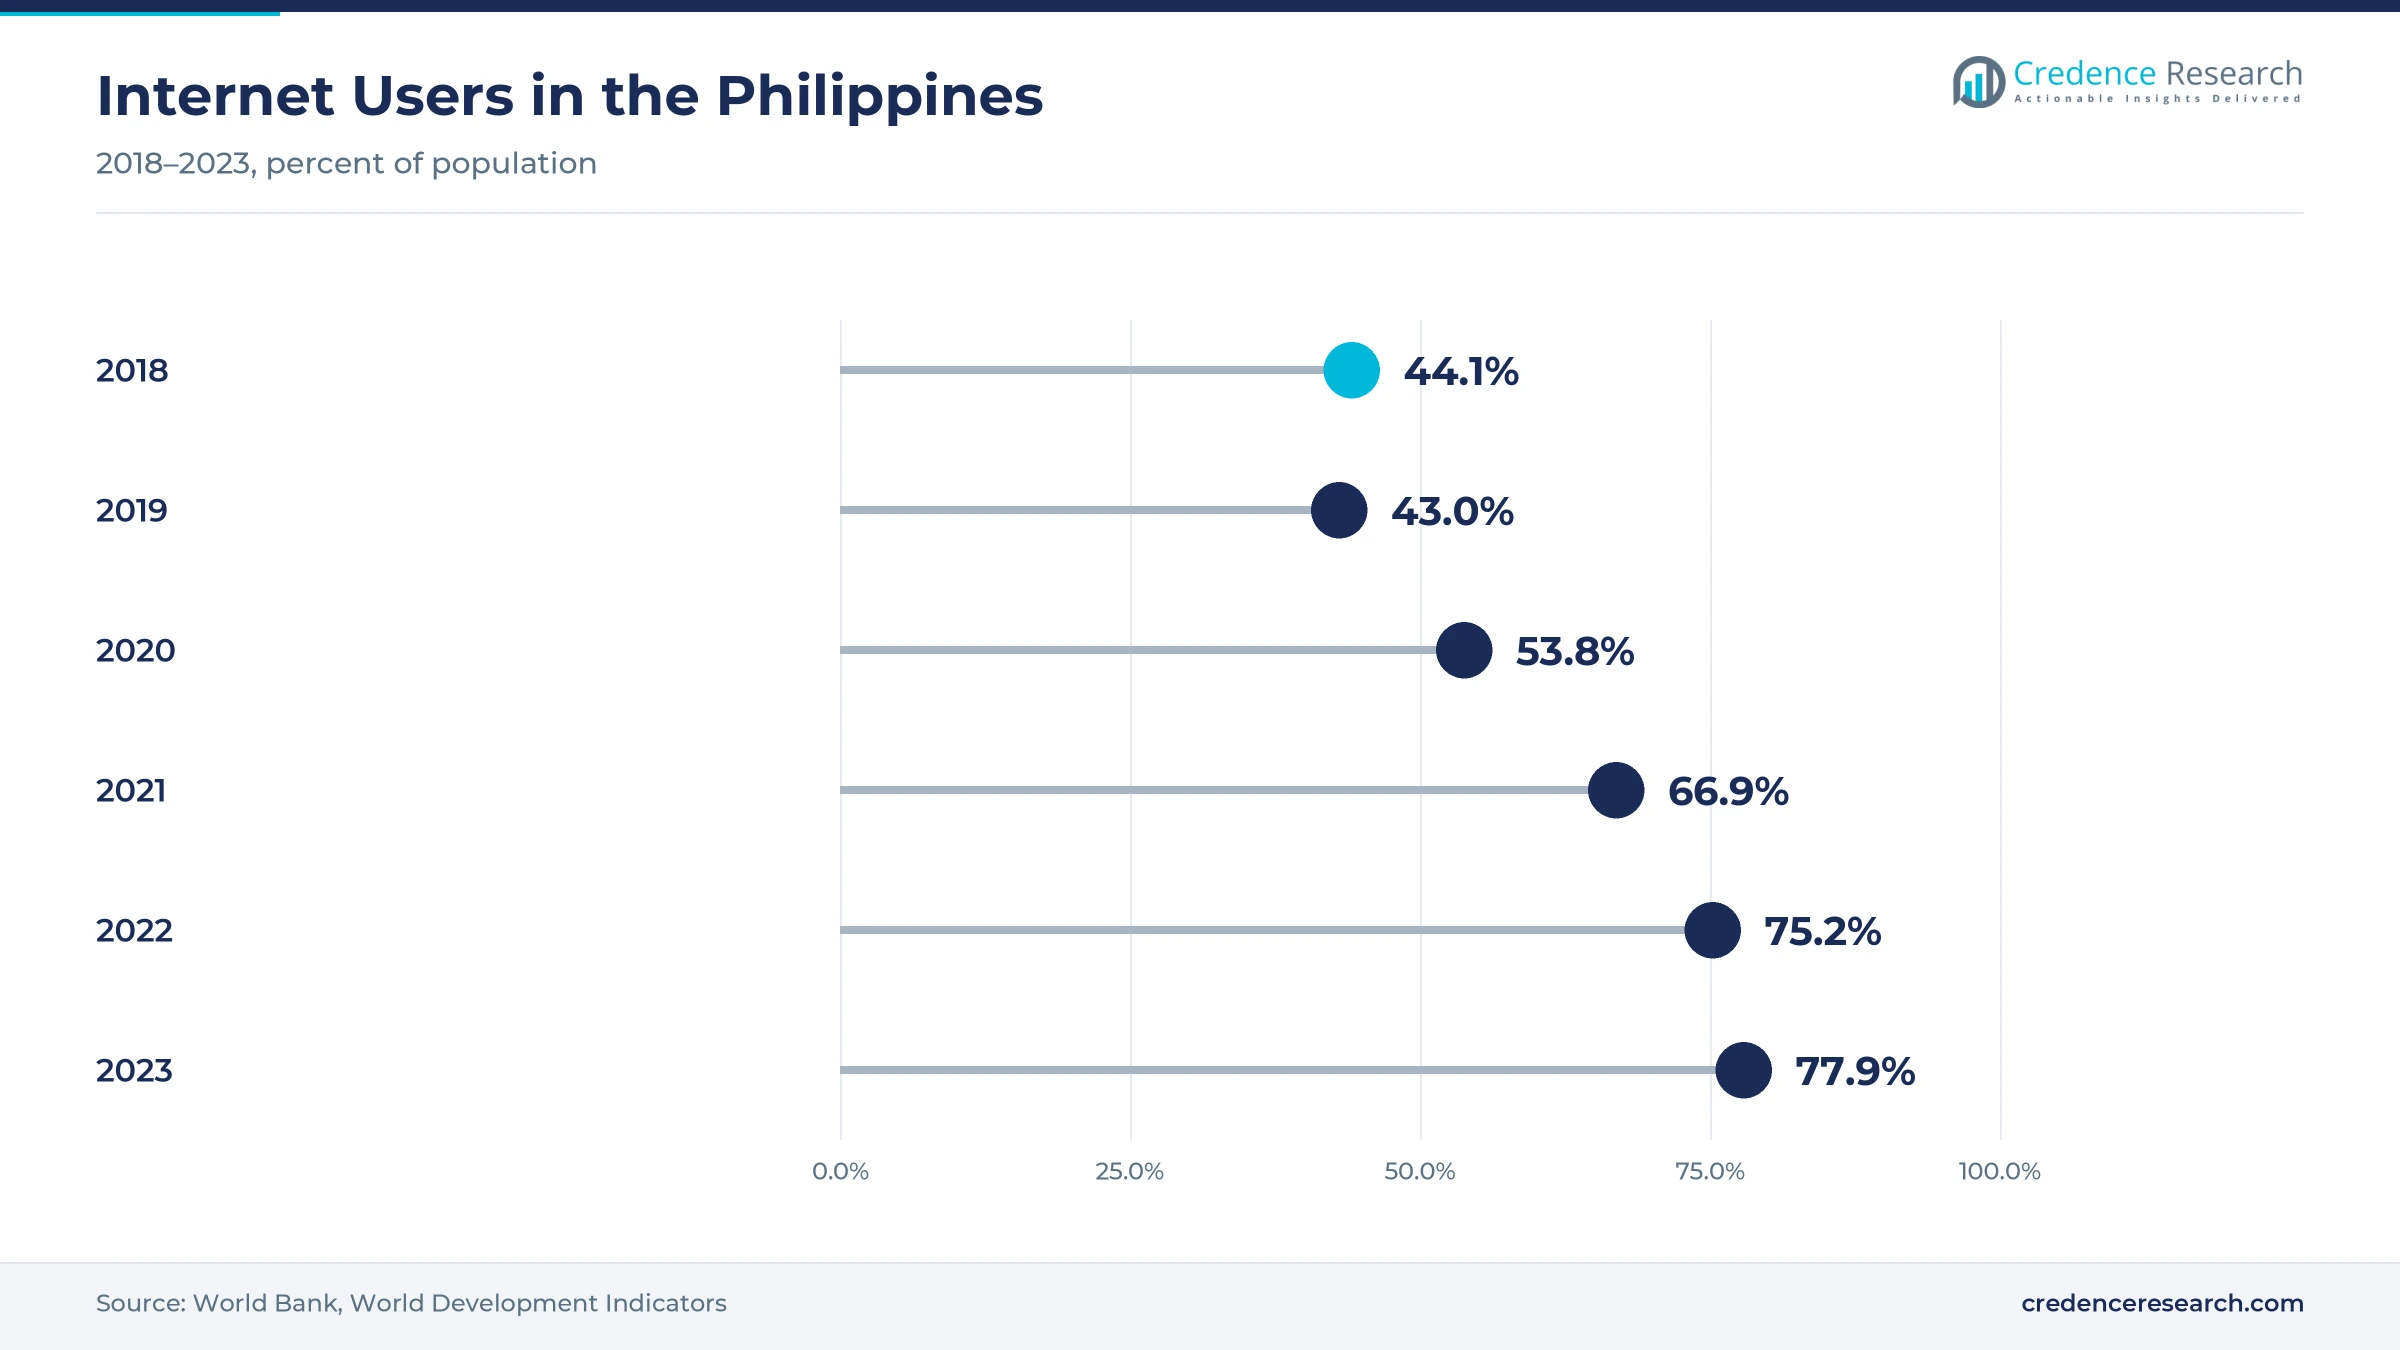
Wider connectivity outside Metro Manila can open new audiences, because faster networks let southern and rural users stream video and shop online. Individuals using the internet rose from 44.1% of the population in 2018 to 77.9% in 2023, according to the World Bank. The Konektadong Pinoy Act lapsed into law on Aug. 24, 2025, removing the congressional franchise requirement for new data transmission providers. Median mobile download speed reached 59.64 Mbps at the end of 2025, which supports longer video formats. In turn, national brands extend campaigns beyond Luzon, which lifts growth in Mindanao and the Visayas over the forecast period.
Fraud, privacy duties and skills gaps pressure advertisers
How do ad fraud and measurement gaps weaken confidence?
Ad fraud and measurement gaps weaken confidence, because many campaigns rely on platform-reported numbers that brands cannot check independently. As a result, fake followers, bot traffic and inflated views make media prices hard to judge. Advertisers respond with verification tools, tracked links, promo codes and sales-based fees. In turn, vendors that offer clear attribution and audited reporting win larger budgets from cautious marketers.
Why do privacy and consent duties raise compliance costs?
Privacy and consent duties raise compliance costs, because brands must show that customers agreed to the use of their personal data for marketing. In turn, small firms that collect contact lists through chat apps and forms face legal and reputational risk. Advertisers respond with consent records, data minimization and stronger vendor contracts. As a result, customer data tools with built-in consent features gain ground among larger brands.
How do skills gaps slow software adoption?
Skills gaps slow software adoption, because many companies buy marketing tools but lack staff who can set up automation, data models and testing. As a result, licenses go unused and campaign results disappoint buyers. Vendors respond with local training, Tagalog interfaces and managed-service packages. In turn, agencies that combine software setup with ongoing campaign management keep clients longer and expand contracts over time.
Why do rising media costs squeeze small advertisers?
Rising media costs squeeze small advertisers, because auction prices climb when more brands compete for the same mobile audiences. In turn, the new tax on foreign digital services can raise the final price of ads bought from offshore platforms. Small sellers respond with creator deals, marketplace ads and shorter campaigns that deliver quick sales. As a result, platforms that offer low entry budgets keep small advertisers active.
Luzon outside Metro Manila leads, Mindanao grows fastest
| Region | Value, 2025 (USD billion) | Share, 2025 | CAGR, 2026–2035 |
|---|---|---|---|
| Rest of Luzon | 0.51 | 35.0% | 13.59% |
| National Capital Region | 0.47 | 32.0% | 12.89% |
| Visayas | 0.26 | 18.0% | 13.99% |
| Mindanao | 0.22 | 15.0% | 14.29% |
Why does Rest of Luzon hold the top share?
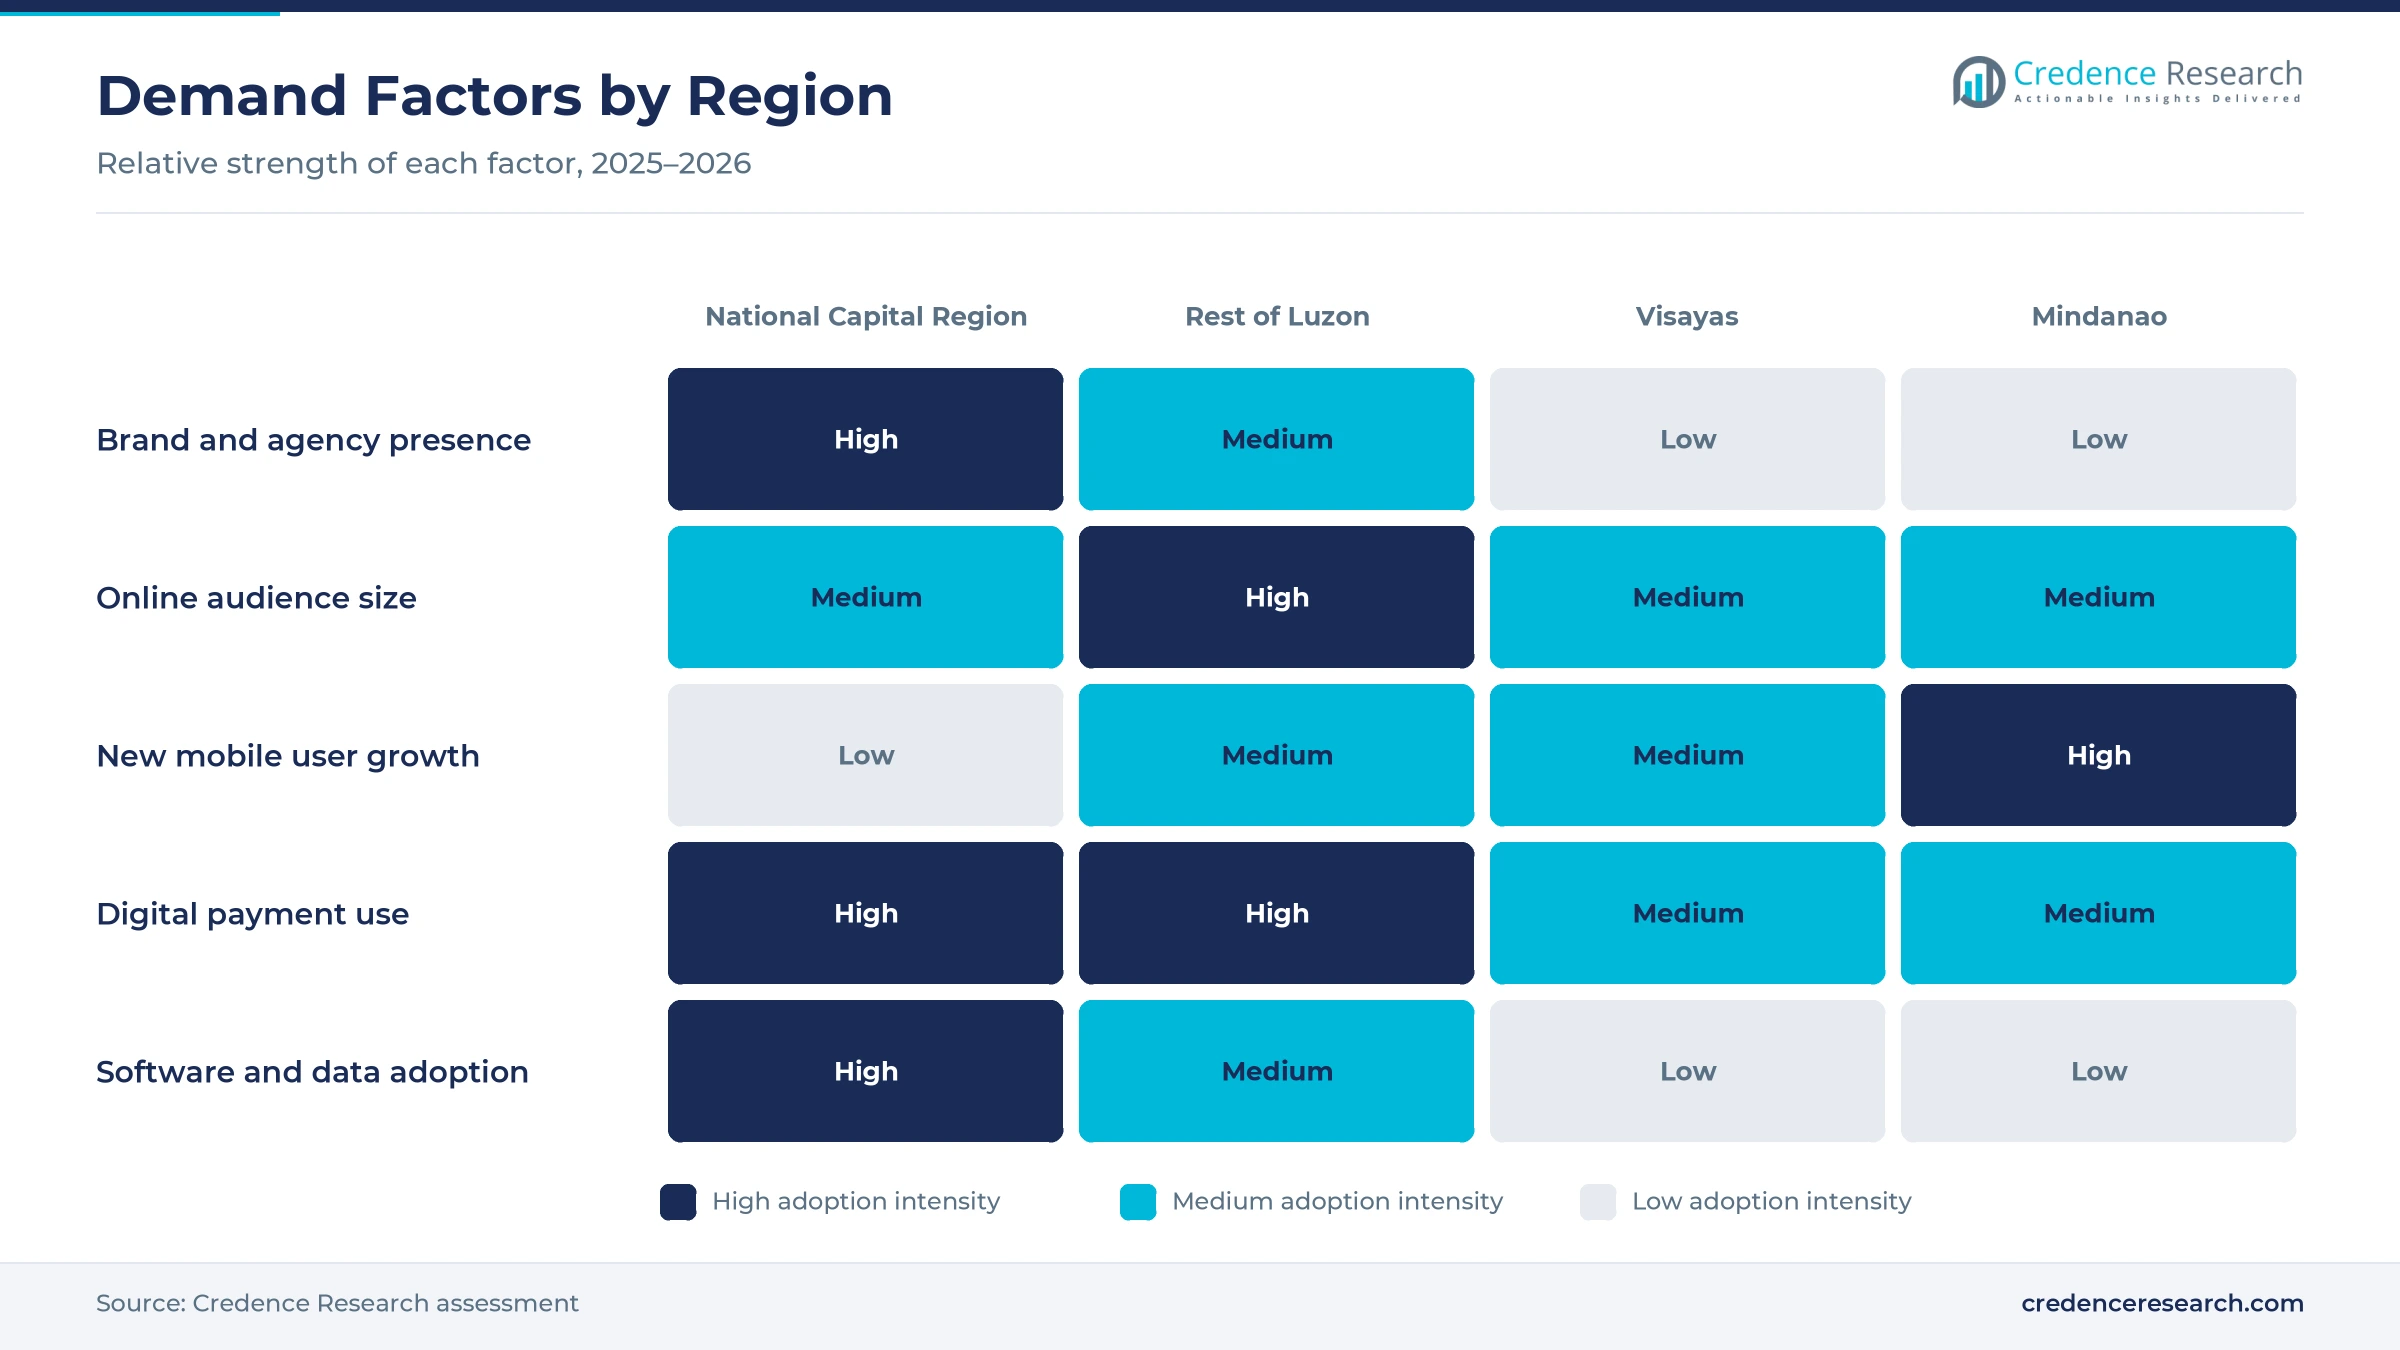
Rest of Luzon held a 35.0% share of 2025 value and grows at 13.59% a year, because Calabarzon and Central Luzon combine large suburban populations with factories, malls and logistics hubs. Calabarzon produced 14.7% of national output in 2024 and Central Luzon 11.1%, according to official regional accounts. Retailers, banks and telecom operators target these commuter belts with mobile and video campaigns. As a result, the zone carries a large share of national campaign spending.
How does the national capital region anchor agency spending?
The National Capital Region held a 32.0% share of 2025 value and grows at 12.89% a year, because most brand headquarters, agencies and platform offices sit in Metro Manila. The capital region produced 31.2% of national output in 2024, the highest of any region. Salesforce chose Ayala Triangle Gardens in Makati for its new office in 2025. In turn, the region remains the hub for planning, buying and software contracts.
How is the Visayas adding online audiences?
The Visayas held 18.0% of 2025 value and grows at 13.99% a year, because Cebu, Iloilo and Bacolod add growing urban audiences and service jobs. Cebu produced 2.7% of national output in 2024, while Eastern Samar and Bohol posted growth of 10.2% and 8.82%. Tourism, retail and property brands run seasonal campaigns aimed at visitors and local shoppers. As a result, regional advertisers increase spending from a smaller base.
How fast is Mindanao growing?
Mindanao held a 15.0% share of 2025 value and grows fastest at 14.29% a year, because mobile internet use and digital payments are spreading quickly in southern cities. Davao City produced 2.6% of national output in 2024, while Dinagat Islands and Iligan City grew 9.56% and 8.76%. Banks, e-wallets and retailers target new mobile users with low-cost social campaigns. In turn, the region adds share during the forecast period.
Platform tools, agency moves and policy milestones
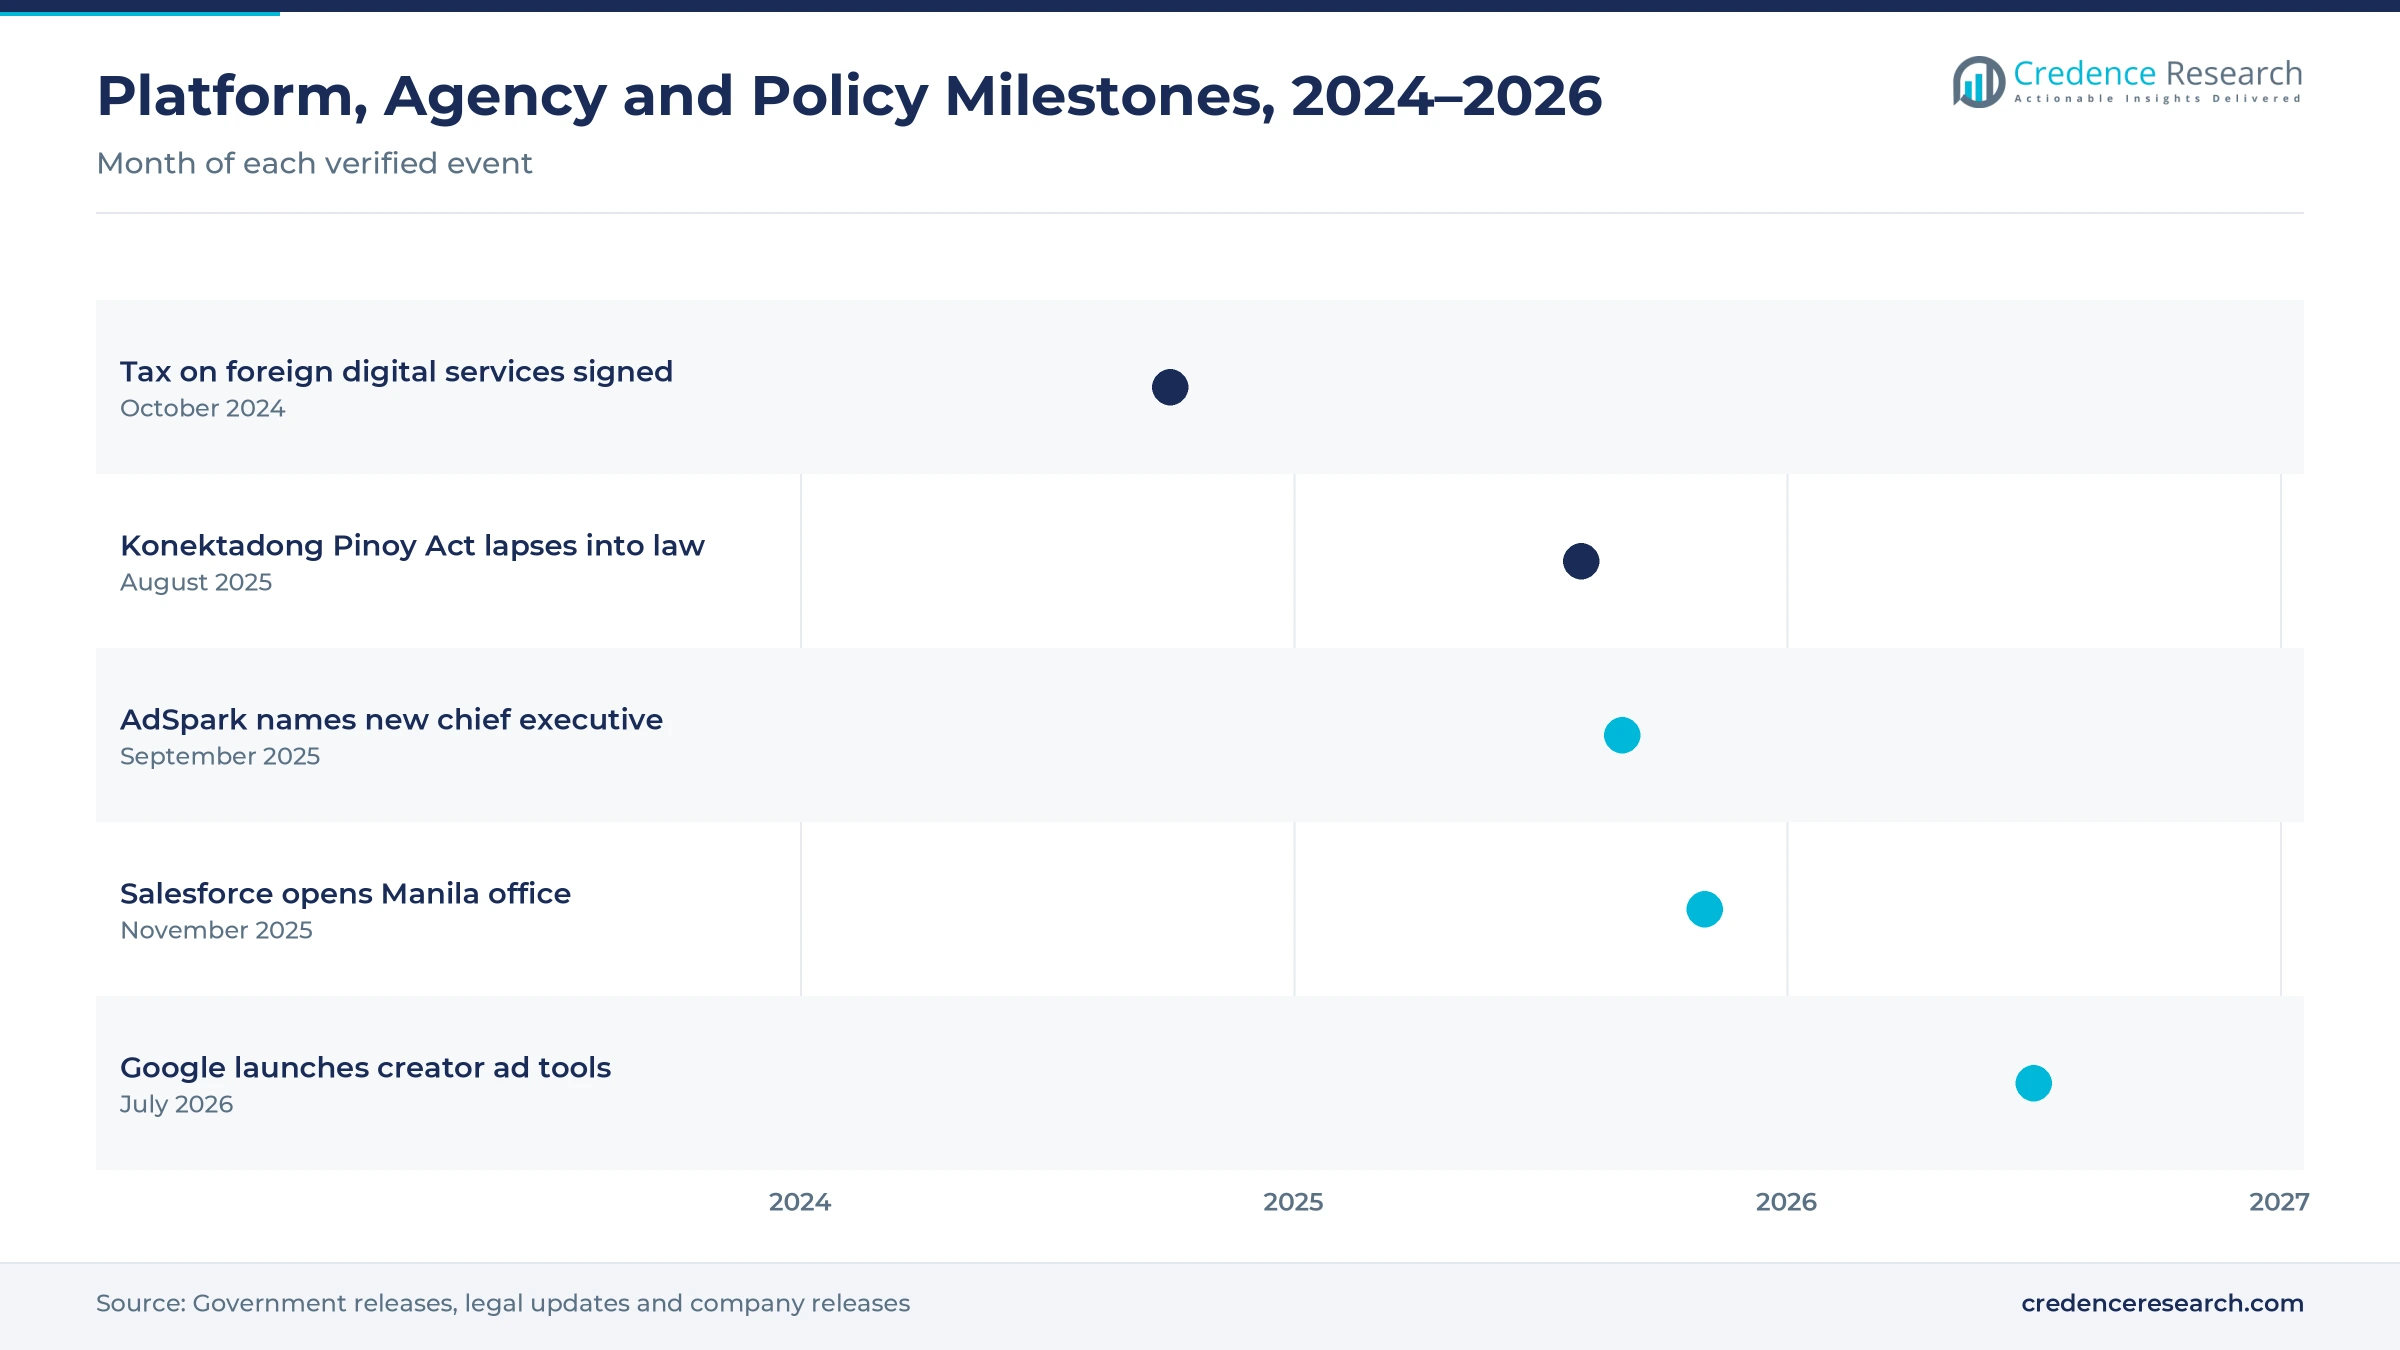
| Development | Status and market relevance |
|---|---|
| In October 2024, the President signed Republic Act 12023, which applies 12% value-added tax to foreign digital services, including online media and advertising. | Changes billing for offshore ad platforms |
| In August 2025, the Konektadong Pinoy Act lapsed into law, removing the franchise requirement for new data transmission providers. | Widens network access outside Metro Manila |
| In September 2025, AdSpark named Manny Fernando chief executive, after adding DeepSea for programmatic work and Secret Menu for creative production. | Strengthens a telecom-backed agency |
| In November 2025, Salesforce announced a Manila office and a pledge to train 12,000 Filipino workers in AI and CRM skills over five years. | Expands local marketing software support |
| In July 2026, Google launched AI shopping and creator partnership tools for Philippine businesses at Google Marketing Live Southeast Asia. | Links YouTube ads to marketplace checkout |
Programmatic, CRM and creator tools shape campaigns
- Programmatic platforms buy display and video impressions automatically across many publishers, which lets brands target Filipino audiences by interest, device and location at lower cost.
- CRM and automation suites send personalized messages across email, chat and apps, which helps banks, telecom operators and retailers keep customers active between purchases.
- Creator partnership tools help brands find creators, review audience data and run creator videos as paid ads, which links short video content to marketplace checkout pages.
- Customer data platforms combine purchase, app and loyalty records in one profile, which supports consent tracking, audience building and more accurate campaign measurement.
Need a Custom Version of This Report?
Tailor the scope, geography, or segments to your exact requirements.
- Custom geography or segment scope
- Direct access to our analyst team
Platforms, local agencies and software vendors compete
Competition is led by global platforms with local teams, telecom-backed agencies, international agency networks and marketing software vendors. Google competes through Search and YouTube, and named Prep Palacios as country manager in September 2025 to lead its AI and video commerce push. Meta reaches 95.8 million Facebook users, while TikTok combines short video ads with TikTok Shop selling programs. AdSpark competes as a local agency with programmatic and creative units under Globe. Salesforce competes in CRM and automation with a new Manila office. Rivals compete on audience reach, data tools, creator networks, local service and pricing. Because brands now judge campaigns by sales and retention, vendors that link media buying to customer data usually win larger contracts.
Which platforms and agencies lead local campaigns?
| Company | Type | Role in the market |
|---|---|---|
| Google Philippines | Search and video platform | Launched AI shopping and creator ad tools for local businesses in July 2026 |
| Meta Platforms Philippines | Social media platform | Facebook ad reach of 95.8 million users in late 2025 |
| TikTok Philippines | Short video and commerce platform | Runs TikTok Shop seller programs that reached more than 25,000 entrepreneurs in 2025 |
| AdSpark | Telecom-backed agency | Part of Brave Connective Holdings under Globe, with programmatic and creative units |
| Salesforce | CRM and marketing software | Opened a Manila office in 2025 and serves Ayala Land, BPI, Meralco and PLDT |
Credence Research view on Filipino marketing spend
Credence Research's view is that Filipino marketing spending online will keep growing quickly because brands follow a young, mobile audience into social feeds, short video and marketplaces. Digital advertising platforms remain the largest value pool, while customer data tools, financial services campaigns and small business buyers add the fastest growth. New tax and connectivity rules will reshape billing and widen reach beyond Metro Manila. Vendors that combine media buying, creator management and first-party data should gain the most, while fraud and skills gaps keep pressure on budgets.
How the national media and software estimate was built
The report uses 2025 as the base year on a calendar basis, and market values come from the Credence Research model. That model combines internet and mobile statistics, platform audience estimates, payment data, national accounts and company releases. Regional shares follow the client sheet, while regional growth rates, segment splits and growth rates are Credence Research estimates. Sources used are official statistics, government releases, legal and tax updates and company releases, and no interviews or surveys were used.
Commerce media and AI tools carry growth to 2035
The Philippines digital advertising and Martech market is expected to reach USD 5.25 billion by 2035, a 13.55% CAGR during 2026–2035, as brands shift more budget to social video, commerce media and marketing software. Growth should be strongest in customer data and analytics, financial services, small businesses and Mindanao, because these areas gain most from new mobile users and online payments. Tax and connectivity changes will reshape buying, while fraud, privacy duties and skills gaps could slow some campaigns.
Frequently Asked Questions
How big is the Philippines digital advertising and Martech market?
Which solution type leads Filipino marketing spending?
Which region leads the Philippine market?
How many people in the Philippines use the internet?
How does the tax on digital services affect advertisers?
Which enterprise size is growing fastest?
Who are the leading companies in the Philippine market?
What are the main challenges for advertisers in the Philippines?
Table of Content
Chapter 1 Market Segmentation
- 1.1 Segmentation Framework
- 1.1.1 Product and Service Classification
- 1.1.2 Application and End-Use Classification
- 1.1.3 Technology and Solution Classification
- 1.1.4 Customer and Distribution Channel Classification
- 1.1.5 Geographic Segmentation
- 1.1.6 Market Segment Definitions and Boundaries
- 1.2 By Solution Type
- 1.2.1 Digital Advertising Platforms
- 1.2.2 Agency and Managed Services
- 1.2.3 Marketing Automation
- 1.2.4 Customer Data and Analytics
- 1.3 By End-Use Industry
- 1.3.1 Retail and E-Commerce
- 1.3.2 Financial Services
- 1.3.3 Telecommunications and Media
- 1.3.4 Consumer Services
- 1.4 By Enterprise Size
- 1.4.1 Micro and Small Businesses
- 1.4.2 Mid-Market Enterprises
- 1.4.3 Large Enterprises
- 1.4.4 Public-Sector Institutions
- 1.5 By Application
- 1.5.1 Customer Acquisition
- 1.5.2 Customer Engagement
- 1.5.3 Retention and Loyalty
- 1.5.4 Measurement and Optimization
Chapter 2 Introduction
- 2.1 Report Objectives and Scope
- 2.2 Product Definition and Industry Terminology
- 2.3 Market Inclusions and Exclusions
- 2.4 Research Process
- 2.4.1 Primary Research and Expert Interviews
- 2.4.2 Secondary Research and Source Review
- 2.4.3 Top-Down and Bottom-Up Estimation
- 2.4.4 Data Triangulation and Verification
- 2.5 Market Size Measurement Basis
- 2.5.1 2025: USD 1.46 billion → 2035: USD 5.25 billion
- 2.6 Historical and Forecast Reference Periods
- 2.6.1 Historical Period: 2018-2025
- 2.6.2 Base Year: 2025
- 2.6.3 Forecast Period: 2025-2035
- 2.7 Research Assumptions and Limitations
Chapter 3 Executive Summary
- 3.1 Market Snapshot and Key Findings
- 3.2 Base-Year Market Size, 2025
- 3.3 Forecast Market Size, 2035
- 3.4 Revenue and Volume Growth Outlook
- 3.5 Key Demand and Supply Indicators
- 3.6 Leading Market Segments
- 3.7 Fastest-Growing Market Opportunities
- 3.8 Regional Performance Highlights
- 3.9 Technology and Industry Transformation
- 3.10 Competitive Landscape Summary
- 3.11 Analyst View and Strategic Implications
Chapter 4 Philippines Digital Advertising and Martech Market Trends and Developments
- 4.1 Historical Industry Development, 2018-2025
- 4.2 Recent Market Trends and Developments
- 4.3 Demand and Customer Behavior Trends
- 4.4 Technology and Product Innovation
- 4.5 Artificial Intelligence, Automation and Digitalization
- 4.6 Local Manufacturing and Supply Chain Realignment
- 4.7 Industry Partnerships, Mergers and Acquisitions
- 4.8 Sustainability and Circular Economy Developments
- 4.9 Government and Private Sector Investment Trends
- 4.10 Emerging Business Models and Commercialization
- 4.11 Industry Developments and Announcements
Chapter 5 Philippines Digital Advertising and Martech Market Production, Supply and Demand Analysis
- 5.1 Demand Trend and Consumption Analysis, 2018-2025
- 5.2 Demand Forecast, 2025-2035
- 5.3 Production and Output Trend, 2018-2025
- 5.4 Production and Output Forecast, 2025-2035
- 5.5 Installed Capacity and Capacity Utilization
- 5.6 Company-Wise Production Plants and Statistics
- 5.6.1 Installed Production Capacity
- 5.6.2 Actual Production
- 5.6.3 Planned Capacity and Expansion Targets
- 5.7 Supply Chain Structure and Procurement Trends
- 5.8 Supply-Demand Gap and Bottlenecks
- 5.9 Import Dependence and Sourcing Structure
- 5.10 Contract Manufacturing and Outsourcing
- 5.11 Regional Supply and Demand Concentration
Chapter 6 Philippines Digital Advertising and Martech Market Pricing Analysis
- 6.1 Pricing Structure and Measurement
- 6.2 Historical Pricing Trends, 2018-2025
- 6.3 Pricing Outlook, 2025-2035
- 6.4 Average Selling Price and Unit Economics
- 6.5 Pricing by Product and Market Segment
- 6.6 Geographic Pricing Differences
- 6.7 Key Input, Energy, Labor and Logistics Costs
- 6.8 Contract Pricing and Purchasing Models
- 6.9 Pricing Sensitivity and Competitive Positioning
- 6.10 Price, Margin and Profitability Implications
Chapter 7 Philippines Digital Advertising and Martech Market Dynamics
- 7.1 Market Growth Drivers
- 7.1.1 Demand-Side Drivers
- 7.1.2 Technology and Innovation Drivers
- 7.1.3 Infrastructure and Investment Drivers
- 7.1.4 Regulatory and Policy Drivers
- 7.2 Market Restraints
- 7.2.1 Cost and Affordability Constraints
- 7.2.2 Technology and Adoption Barriers
- 7.2.3 Supply Chain and Operational Constraints
- 7.3 Market Challenges
- 7.3.1 Competitive Pressure and Margin Erosion
- 7.3.2 Skills, Infrastructure and Implementation Gaps
- 7.4 Emerging Market Opportunities
- 7.5 Market Dynamics Impact and Time-Horizon Assessment
Chapter 8 Philippines Digital Advertising and Martech Value Chain Analysis
- 8.1 Industry Value Chain Overview
- 8.2 Upstream Suppliers and Critical Inputs
- 8.3 Technology and Component Providers
- 8.4 Manufacturing or Service Delivery
- 8.5 Distribution, Channel Partners and Integrators
- 8.6 Downstream Applications and End Users
- 8.7 Value Addition and Profit Pools
- 8.8 Vertical Integration and Outsourcing
- 8.9 Supplier Concentration and Risk
- 8.10 Supply Chain Localization and Resilience
Chapter 9 Philippines Digital Advertising and Martech Market Regulations and Policies
- 9.1 Relevant Laws, Standards and Compliance Frameworks
- 9.2 Product, Service, Safety and Quality Requirements
- 9.3 Government Policies, Incentives and Subsidies
- 9.4 Imports, Exports and Trade Barriers
- 9.5 Public Procurement and Local Content Requirements
- 9.6 Environmental and Sustainability Compliance
- 9.7 Data Protection, AI and Cybersecurity Compliance
- 9.8 Upcoming Policy Changes and Market Implications
Chapter 10 Philippines Digital Advertising and Martech Market Hotspots and Opportunities
- 10.1 Market Opportunity Mapping and Growth Hotspots
- 10.2 High-Growth Applications and Customer Groups
- 10.3 Underserved Markets and White-Space Opportunities
- 10.4 Emerging Technology and Product Opportunities
- 10.5 New Capacity and Investment Hotspots
- 10.6 Market Entry and Expansion Opportunities
- 10.7 Distribution and Partnership Opportunities
- 10.8 Near-Term and Long-Term Commercial Potential
- 10.9 Opportunity Attractiveness and Execution Risks
Chapter 11 Philippines Digital Advertising and Martech Market Outlook, 2025-2035
- 11.1 Market Size and Analysis
- 11.1.1 Revenue (Market Measurement: 2025: USD 1.46 billion → 2035: USD 5.25 billion)
- 11.1.2 Market Volume and Quantity Sold
- 11.1.3 Historical Market Size, 2018-2025
- 11.1.4 Base-Year Market Size, 2025
- 11.2 Market Forecast, 2025-2035
- 11.2.1 Revenue Forecast to 2035
- 11.2.2 Volume Forecast to 2035
- 11.2.3 CAGR and Year-on-Year Growth
- 11.2.4 Incremental Revenue Opportunity
- 11.3 Forecast Assumptions and Scenario Analysis
- 11.3.1 Base-Case Forecast
- 11.3.2 Optimistic and Conservative Scenarios
- 11.3.3 Technology, Pricing and Policy Sensitivities
- 11.4 Market Attractiveness and Growth Outlook
Chapter 12 Philippines Digital Advertising and Martech Market Segmentation and Outlook
- 12.1 Segmentation Summary and Market Shares, 2025
- 12.2 Largest and Fastest-Growing Segments
- 12.3 By Solution Type - Market Size and Forecast, 2025-2035
- 12.3.1 Segment Definition and Scope
- 12.3.2 Historical Market Size, 2018-2025
- 12.3.3 Revenue Forecast, 2025-2035
- 12.3.4 Volume Forecast, 2025-2035
- 12.3.5 Base-Year Market Share, 2025
- 12.3.6 Segment CAGR and Growth Drivers
- 12.3.7 Subsegment Market Size and Forecast
- 12.3.7.1 Digital Advertising Platforms
- 12.3.7.2 Agency and Managed Services
- 12.3.7.3 Marketing Automation
- 12.3.7.4 Customer Data and Analytics
- 12.3.8 Subsegment Pricing and Adoption Trends
- 12.3.9 Leading Suppliers and Competition
- 12.3.10 Regional Demand and Opportunities
- 12.4 By End-Use Industry - Market Size and Forecast, 2025-2035
- 12.4.1 Segment Definition and Scope
- 12.4.2 Historical Market Size, 2018-2025
- 12.4.3 Revenue Forecast, 2025-2035
- 12.4.4 Volume Forecast, 2025-2035
- 12.4.5 Base-Year Market Share, 2025
- 12.4.6 Segment CAGR and Growth Drivers
- 12.4.7 Subsegment Market Size and Forecast
- 12.4.7.1 Retail and E-Commerce
- 12.4.7.2 Financial Services
- 12.4.7.3 Telecommunications and Media
- 12.4.7.4 Consumer Services
- 12.4.8 Subsegment Pricing and Adoption Trends
- 12.4.9 Leading Suppliers and Competition
- 12.4.10 Regional Demand and Opportunities
- 12.5 By Enterprise Size - Market Size and Forecast, 2025-2035
- 12.5.1 Segment Definition and Scope
- 12.5.2 Historical Market Size, 2018-2025
- 12.5.3 Revenue Forecast, 2025-2035
- 12.5.4 Volume Forecast, 2025-2035
- 12.5.5 Base-Year Market Share, 2025
- 12.5.6 Segment CAGR and Growth Drivers
- 12.5.7 Subsegment Market Size and Forecast
- 12.5.7.1 Micro and Small Businesses
- 12.5.7.2 Mid-Market Enterprises
- 12.5.7.3 Large Enterprises
- 12.5.7.4 Public-Sector Institutions
- 12.5.8 Subsegment Pricing and Adoption Trends
- 12.5.9 Leading Suppliers and Competition
- 12.5.10 Regional Demand and Opportunities
- 12.6 By Application - Market Size and Forecast, 2025-2035
- 12.6.1 Segment Definition and Scope
- 12.6.2 Historical Market Size, 2018-2025
- 12.6.3 Revenue Forecast, 2025-2035
- 12.6.4 Volume Forecast, 2025-2035
- 12.6.5 Base-Year Market Share, 2025
- 12.6.6 Segment CAGR and Growth Drivers
- 12.6.7 Subsegment Market Size and Forecast
- 12.6.7.1 Customer Acquisition
- 12.6.7.2 Customer Engagement
- 12.6.7.3 Retention and Loyalty
- 12.6.7.4 Measurement and Optimization
- 12.6.8 Subsegment Pricing and Adoption Trends
- 12.6.9 Leading Suppliers and Competition
- 12.6.10 Regional Demand and Opportunities
- 12.7 Segment Growth Comparison
- 12.8 Segment Attractiveness and Priority Matrix
Chapter 13 Philippines Digital Advertising and Martech End-Use and Application Market Outlook
- 13.1 End-Use Industry and Customer Demand Structure
- 13.2 Leading Applications and Customer Groups
- 13.3 End-Use Market Size, Share and Forecast
- 13.4 Major End-Use Industry Deep Dives
- 13.4.1 Customer Requirements and Use Cases
- 13.4.2 Demand and Replacement Cycles
- 13.4.3 Technical and Regulatory Considerations
- 13.4.4 Purchasing and Procurement Models
- 13.4.5 Leading Vendors and Distribution Channels
- 13.4.6 Forecast and Commercial Opportunities
- 13.5 Emerging Applications and Cross-Segment Demand
- 13.6 End-Use Industry Investment Priorities
Chapter 14 Philippines Digital Advertising and Martech Geographic Market Outlook, 2025-2035
- 14.1 Domestic Market Distribution and Demand Clusters
- 14.2 State- or Province-Wise Market Size and Forecast, 2025-2035
- 14.3 City and Metropolitan Market Outlook
- 14.4 Industrial, Manufacturing and Commercial Clusters
- 14.5 Geographic Concentration of Key End Users
- 14.6 Local Pricing and Purchasing Differences
- 14.7 Domestic Production Facilities and Capacity Map
- 14.8 Local Infrastructure and Project Pipeline
- 14.9 State-Level Policy and Incentive Differences
- 14.10 Subnational Investment Hotspots and Opportunities
- 14.11 Distribution and Logistics Networks
- 14.12 Domestic Competitive Footprint
Chapter 15 Philippines Digital Advertising and Martech Technology, Innovation and Sustainability Outlook
- 15.1 Technology Landscape and Maturity
- 15.2 Product, Process and Service Innovation
- 15.3 AI, Automation and Digital Tools in the Industry
- 15.4 Technology Adoption and Performance Benchmarking
- 15.5 Innovation Pipeline and R&D Investment
- 15.6 Patent and Intellectual Property Trends
- 15.7 Energy Efficiency and Resource Management
- 15.8 Sustainability, Recycling and Circularity
- 15.9 Technology Roadmap, 2025-2035
- 15.10 Risks of Obsolescence and Technology Substitution
Chapter 16 Philippines Digital Advertising and Martech Market Key Strategic Imperatives
- 16.1 Growth and Market Entry Priorities
- 16.2 High-Return Products and Segments
- 16.3 Pricing, Profitability and Cost Optimization
- 16.4 Technology Investment and Product Differentiation
- 16.5 Supply Chain Localization and Resilience
- 16.6 Distribution and Customer Acquisition
- 16.7 Partnership, Acquisition and Capacity Strategy
- 16.8 Regional Expansion Priorities
- 16.9 Short-, Medium- and Long-Term Actions
Chapter 17 Competition Outlook
- 17.1 Industry Competition Characteristics
- 17.2 Market Structure and Concentration
- 17.3 Market Share and Competitive Positioning, 2025
- 17.4 Company-Wise Revenue and Product Benchmarking
- 17.5 Production and Service Capacity Benchmarking
- 17.6 Technology, Pricing and Differentiation
- 17.7 Regional Footprint and Distribution Strength
- 17.8 Mergers, Acquisitions and Strategic Alliances
- 17.9 New Entrants and Competitive Threats
- 17.10 Porter's Five Forces and Industry Attractiveness
- 17.11 Competitive Outlook, 2025-2035
Chapter 18 Company Profiles
- 18.1 Company Coverage and Selection Criteria
- 18.2 Google Philippines
- 18.2.1 Business Description
- 18.2.2 Company Ownership and Geographic Presence
- 18.2.3 Product and Service Portfolio
- 18.2.4 Manufacturing and Operating Footprint
- 18.2.5 Production Capacity and Expansion Plans
- 18.2.6 Financial Performance and Investment
- 18.2.7 Market Share and Competitive Position
- 18.2.8 Technology and Innovation Capabilities
- 18.2.9 Strategic Alliances or Partnerships
- 18.2.10 Recent Developments
- 18.2.11 Growth Strategy and Outlook
- 18.3 Meta Platforms Philippines
- 18.4 TikTok Philippines
- 18.5 AdSpark
- 18.6 Dentsu Philippines
- 18.7 WPP Media Philippines
- 18.8 Publicis Groupe Philippines
- 18.9 Omnicom Media Group Philippines
- 18.10 Adobe
- 18.11 Salesforce
- 18.12 Other Relevant Market Participants
Note: Every listed company is profiled on the structure shown under the first company. The company list is preliminary and may change based on research findings, market developments, data availability and client requirements.
Chapter 19 Disclaimer
- 19.1 Research and Forecast Disclaimer
- 19.2 Data Source and Estimation Limitations
Note: The depth of individual sections depends on data availability for this market. Volume, capacity, trade and other unit-based metrics are included where applicable.

