
Security rules and cloud growth reshape data exchange
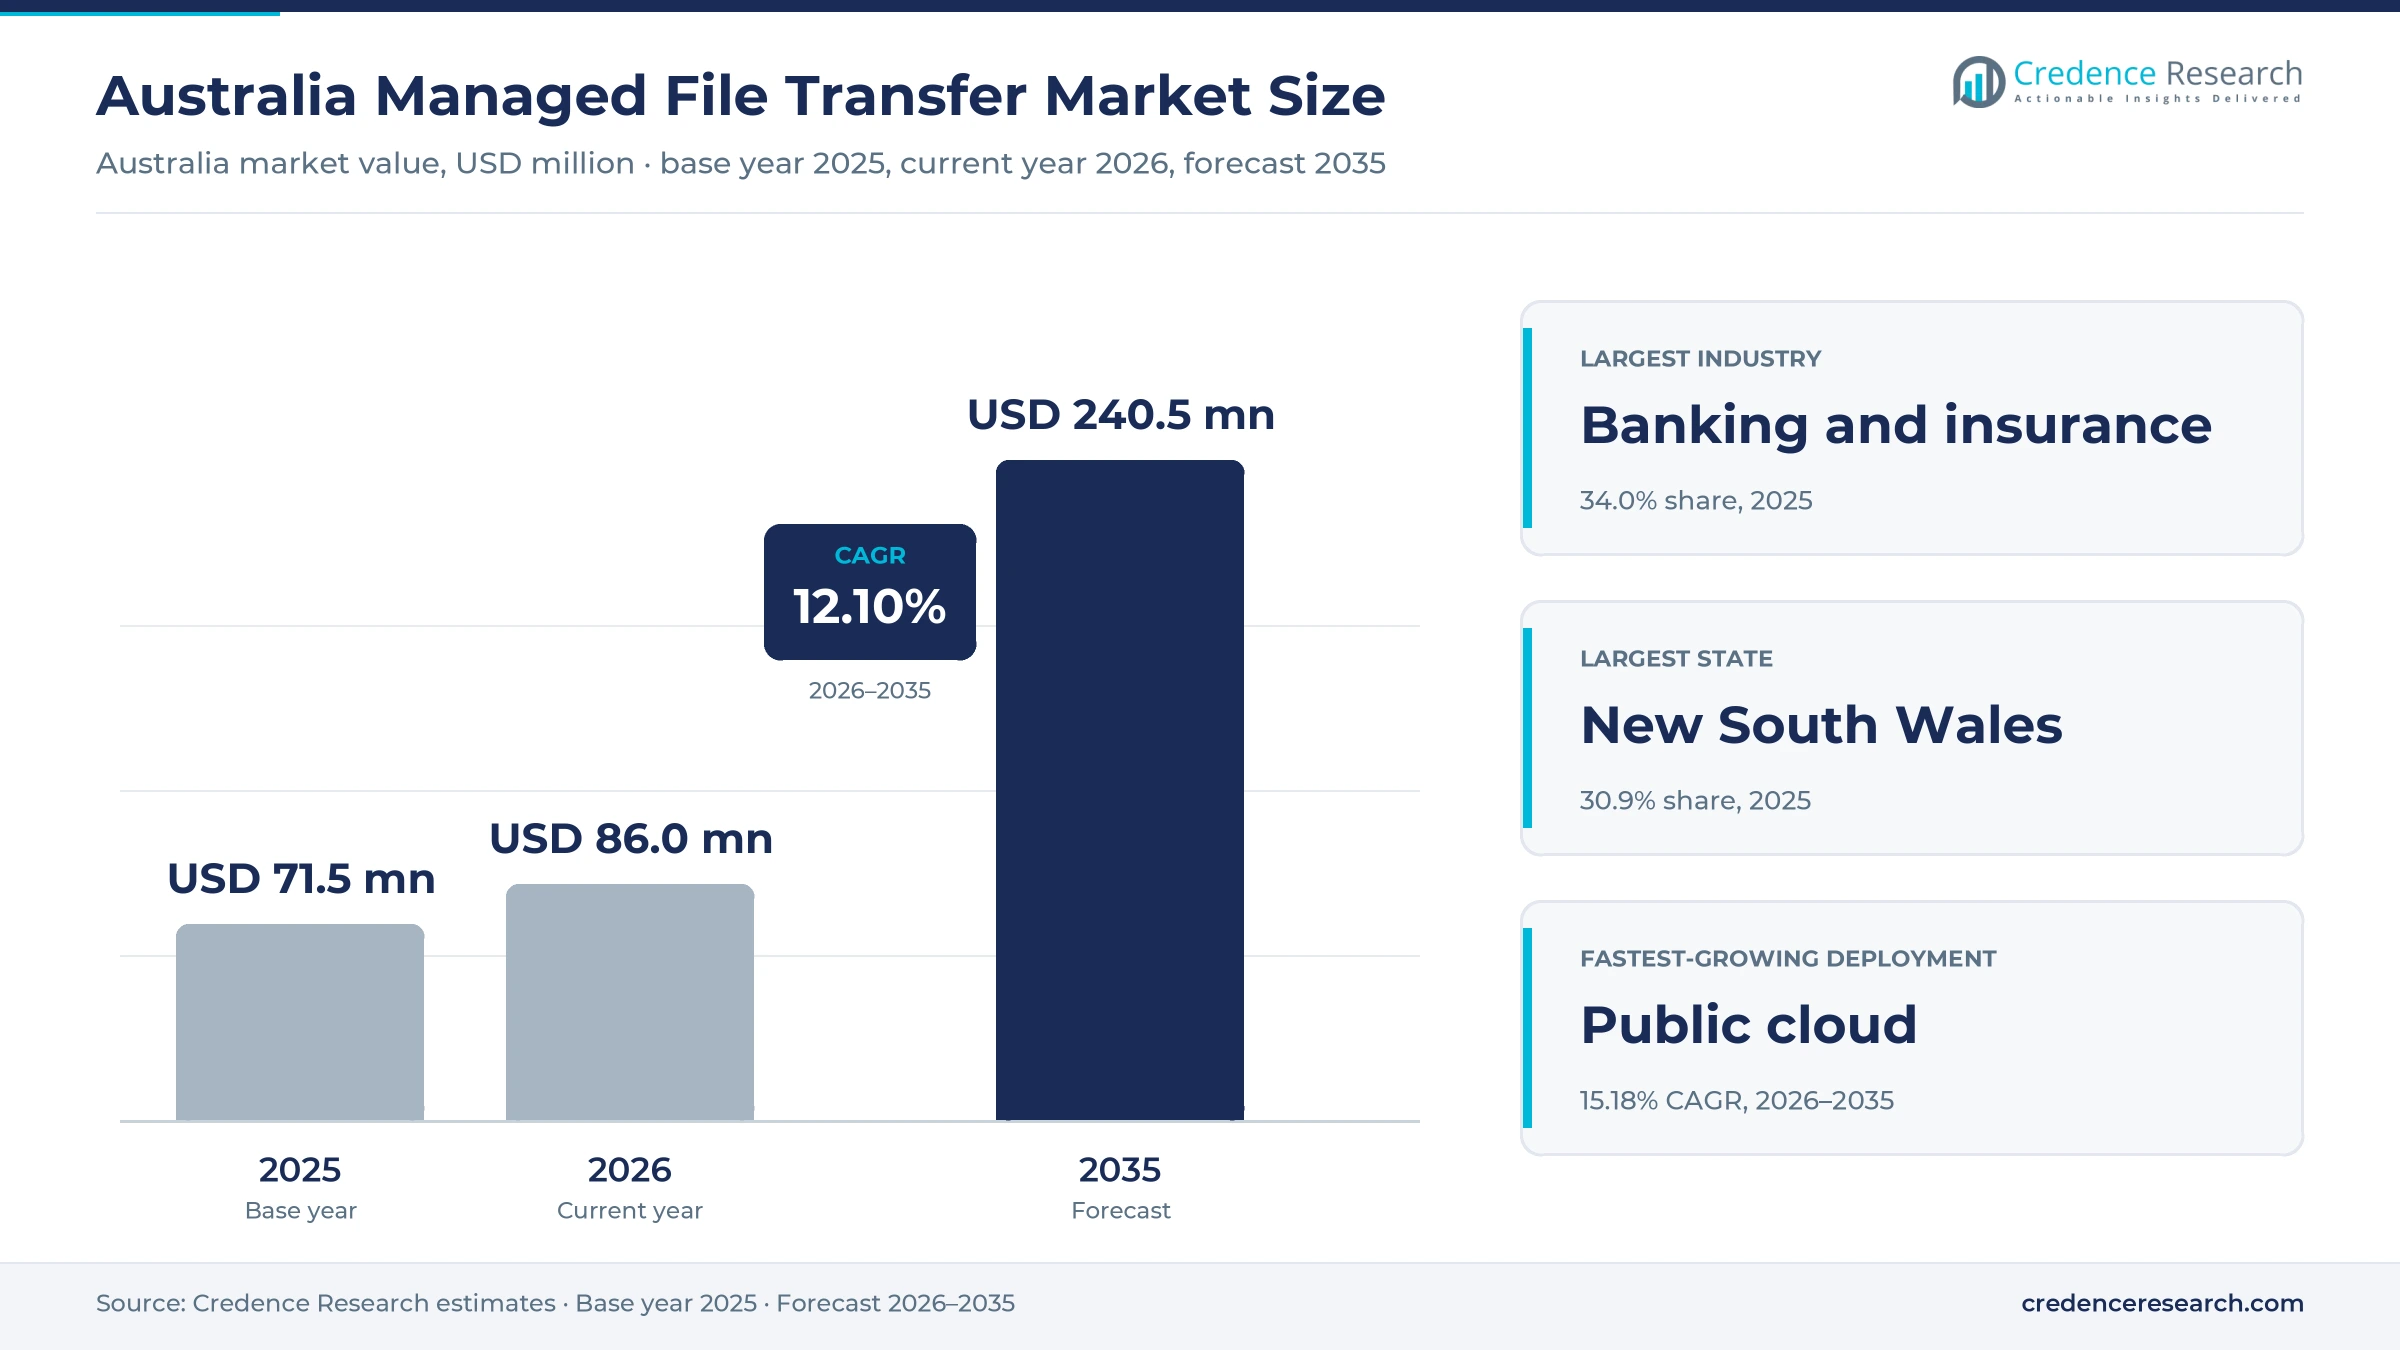
The Australia managed file transfer market was valued at USD 71.5 million in 2025 and is projected to increase from USD 86.0 million in 2026 to USD 240.5 million by 2035, registering a CAGR of 12.10% during 2026–2035. Demand comes from banks, insurers, superannuation funds, government agencies and hospitals that must move payment files, claims, records and reports between systems and partners with full audit trails. New South Wales held the largest state share, 30.9% in 2025, because Sydney concentrates bank head offices, insurers and cloud data centers. Victoria is the fastest-growing state at 12.49% a year, as Melbourne adds cloud capacity and financial services operations. In turn, APRA's operational risk standard took effect on July 1, 2025, which pushes regulated entities to replace scripts and email attachments with governed transfer platforms.
Which secure transfer tools does the estimate cover?
The estimate measures the value of software licences, subscriptions and services that organizations in Australia buy to move files securely between systems, partners and staff. It covers server and gateway software, cloud-hosted transfer services, professional services for design and migration and managed services in which a provider runs the platform. Values include perpetual licences with maintenance, recurring subscriptions, usage-based fees and project fees.
The estimate excludes consumer file sharing apps, general cloud storage, email security gateways and the network hardware that carries the traffic. The value chain runs from software vendors through cloud providers, systems integrators and managed service providers to banks, insurers, government agencies, hospitals, manufacturers and retailers that exchange files every day.
Australia Managed File Transfer Market Insights
- The Australia managed file transfer market was valued at USD 71.5 million in 2025 and is projected to reach USD 240.5 million by 2035, registering a CAGR of 12.10% during 2026–2035.
- New South Wales held a 30.9% share of 2025 value, because Sydney concentrates bank head offices, insurers and the largest cloud data center cluster.
- Banking, insurance and superannuation led with a 34.0% share of 2025 value, because regulated entities exchange payment, claims and member files daily.
- APRA released its operational risk standard on July 17, 2023, and the standard took effect on July 1, 2025, for banks, insurers and superannuation trustees.
- Amazon said in June 2025 that it would invest AU$20 billion from 2025 to 2029 to expand data center infrastructure in Sydney and Melbourne.
Software leads while managed services rise fastest
Why does software hold most secure transfer value?
Based on solution type, the market is categorized into MFT software, professional MFT services and managed MFT services. MFT Software led with a 55.0% share of 2025 value, because large banks, insurers and agencies run their own transfer servers under long licence contracts. Managed MFT Services grow fastest at 14.55% a year, as smaller teams hand daily operation and patching to specialist providers.
Why do financial institutions lead secure transfer demand?
Based on end-use industry, the market is categorized into banking, insurance and superannuation, government and public sector, healthcare and life sciences, manufacturing, telecommunications and commerce and media and specialist services. Banking, Insurance and Superannuation led with a 34.0% share of 2025 value, because regulated entities exchange payment, claims and member files every day. Healthcare and Life Sciences grow fastest at 13.45% a year, as hospitals tighten control of patient records.
Why does on-premises deployment still lead?
Based on deployment model, the market is categorized into on-premises, public cloud and private and hybrid cloud. On-Premises led with a 45.0% share of 2025 value, because banks and agencies still run transfer servers inside their own data centers. Public Cloud grows fastest at 15.18% a year, as vendors host services in Australian cloud regions that meet local data rules.
Which file exchange uses create the most value?
Based on application, the market is categorized into internal application file exchange, external trading-partner file exchange and employee-initiated secure file exchange. External Trading-Partner File Exchange led with a 42.0% share of 2025 value, because banks, insurers and retailers exchange files with many outside partners. Employee-Initiated Secure File Exchange grows fastest at 13.63% a year, as organizations replace email attachments with governed portals.
| Segment Group | Leading Sub-segment | Share, 2025 | Fastest-growing Sub-segment | CAGR, 2026–2035 |
|---|---|---|---|---|
| By Solution Type | MFT Software | 55.0% | Managed MFT Services | 14.55% |
| By End-Use Industry | Banking, Insurance and Superannuation | 34.0% | Healthcare and Life Sciences | 13.45% |
| By Deployment Model | On-Premises | 45.0% | Public Cloud | 15.18% |
| By Application | External Trading-Partner File Exchange | 42.0% | Employee-Initiated Secure File Exchange | 13.63% |
Request a Free Sample
Fill in your details and we'll send you a free sample report.
- Sample data tables & charts
- Research methodology
Financial rules, cloud build-out and resilience lift demand
How does financial-sector security governance lift demand?
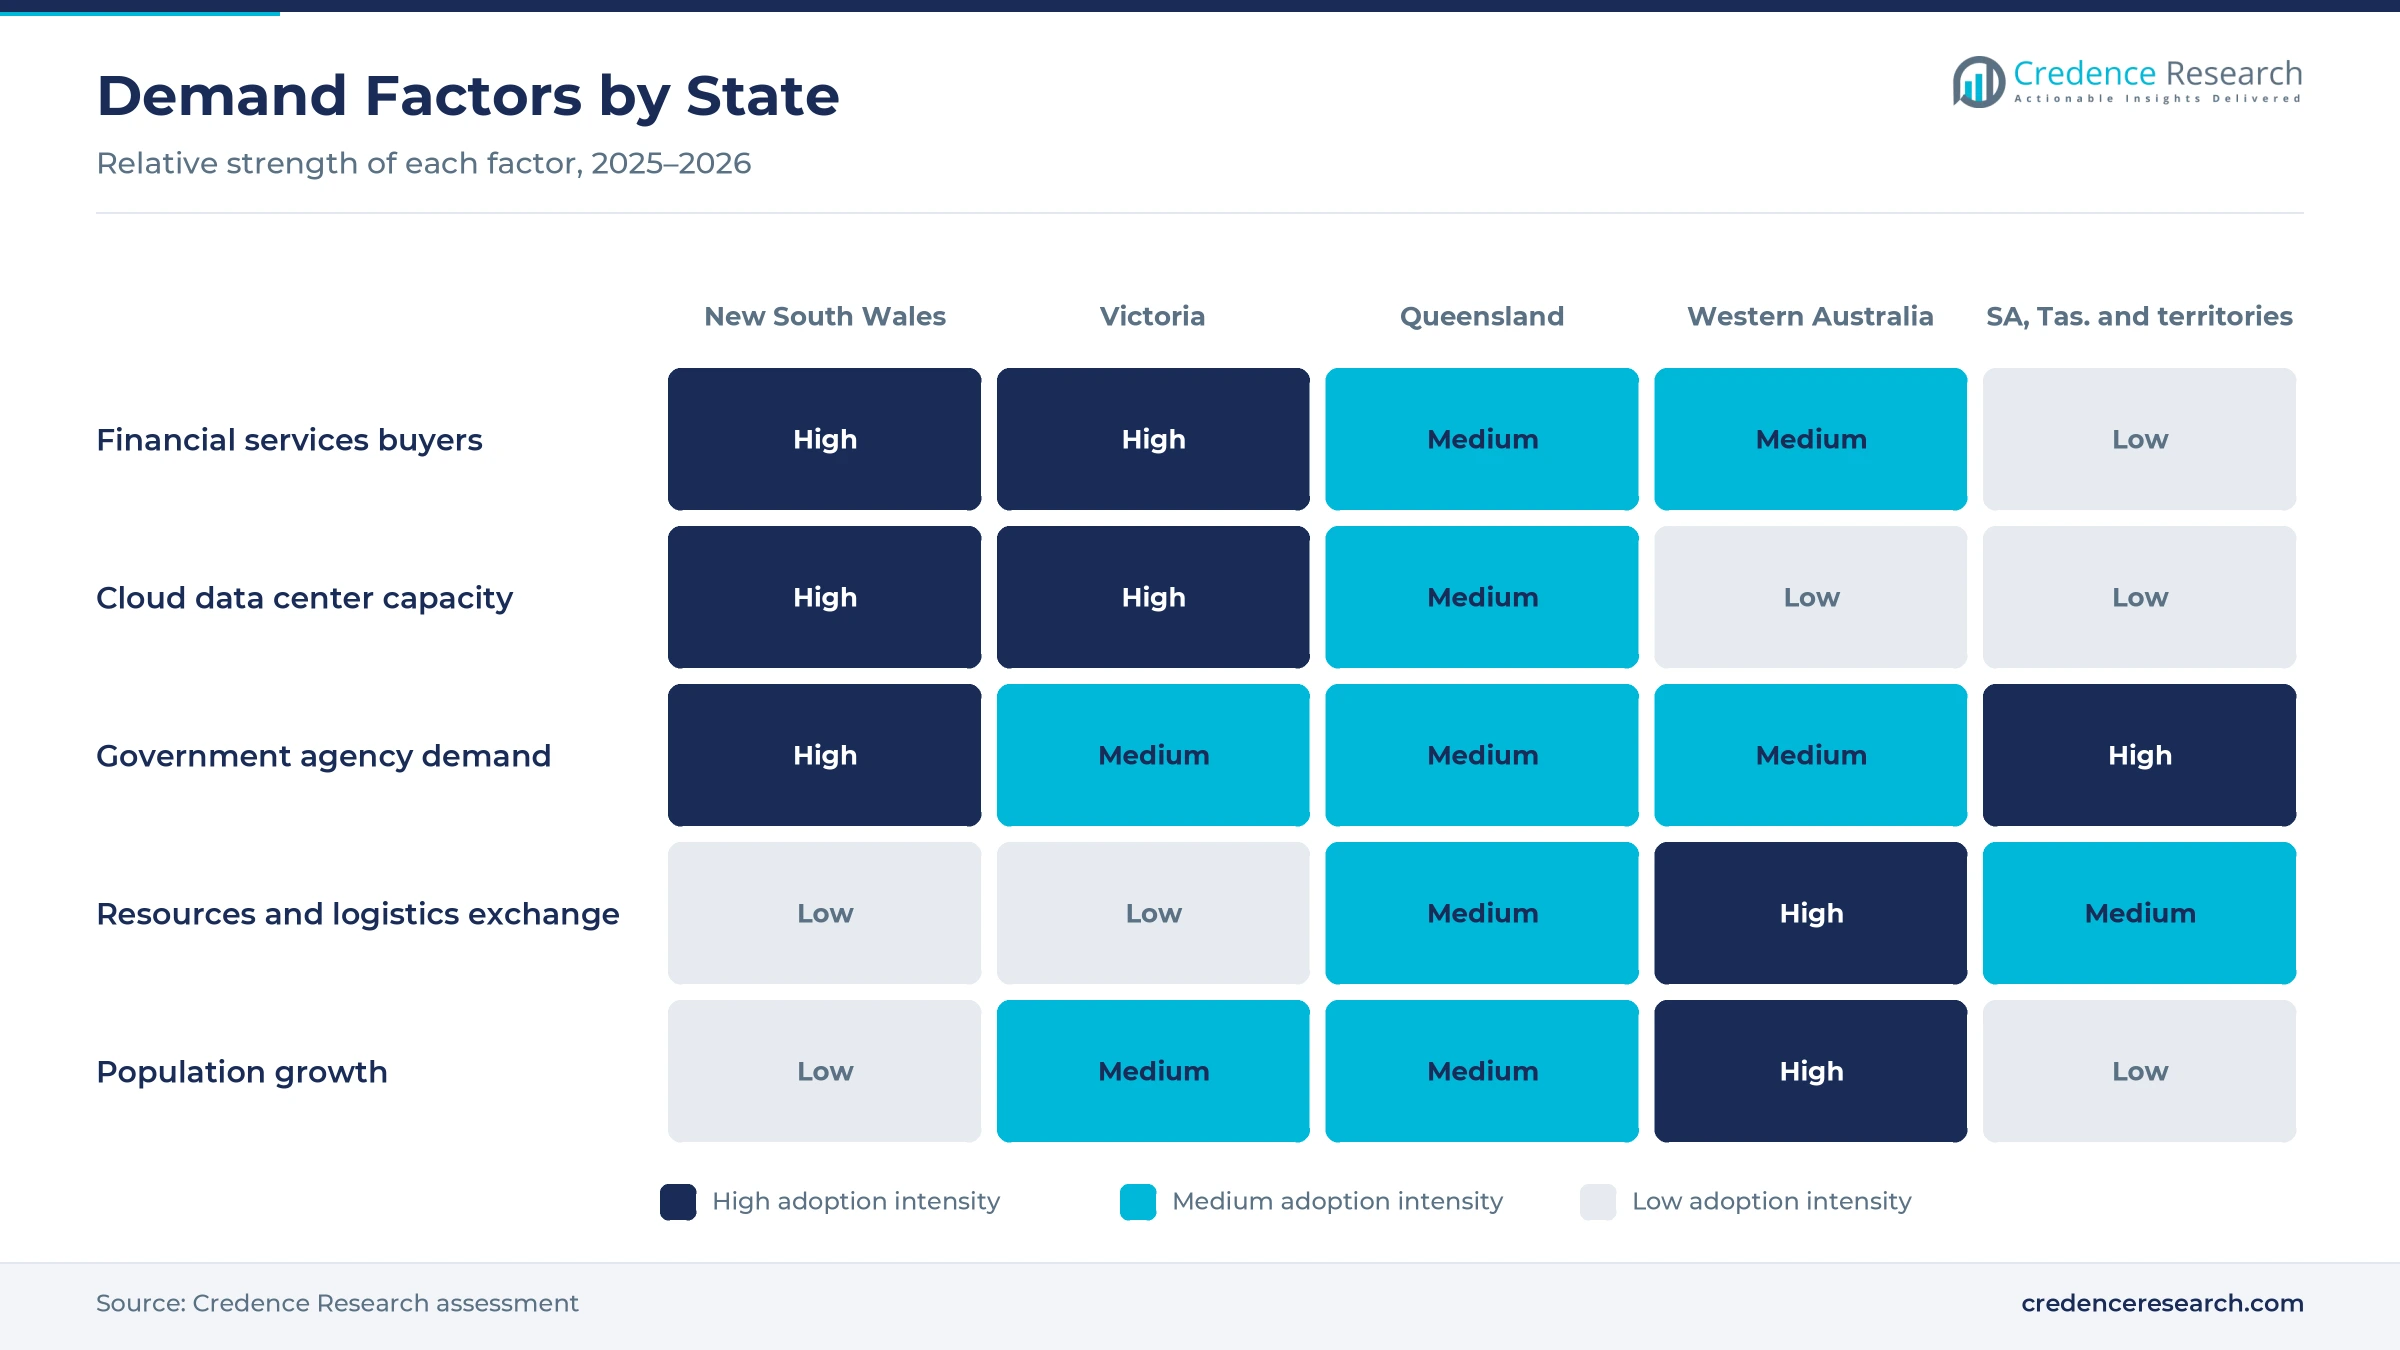
Financial-sector security governance lifts demand, because regulated entities must prove that every critical file transfer is controlled, logged and recoverable. APRA released its operational risk standard on July 17, 2023, and it took effect on July 1, 2025, with new rules on material service providers and business continuity. Finance also reported 157 data breach notifications in 2025, which keeps boards focused on how payment and member files move. As a result, banking, insurance and superannuation hold a 34.0% share of 2025 value, the largest industry share. In turn, entities replace scripts and shared folders with platforms that give auditors a single record of each transfer.
Why does cloud infrastructure expansion widen adoption?
Cloud infrastructure expansion widens adoption, because local cloud regions let organizations move transfer platforms off their own servers without sending data offshore. Amazon said on June 14, 2025, that it would invest AU$20 billion from 2025 to 2029 in data center infrastructure, mainly in Sydney and Melbourne. Australia also had about 44,299 secure internet servers per 1 million people in 2024, according to World Bank data, which shows a dense base of encrypted services. Progress launched MOVEit Cloud on Microsoft Azure in Australia in July 2021. As a result, public cloud deployment grows at 15.18% a year, the fastest deployment rate.
How do operational resilience requirements speed upgrades?
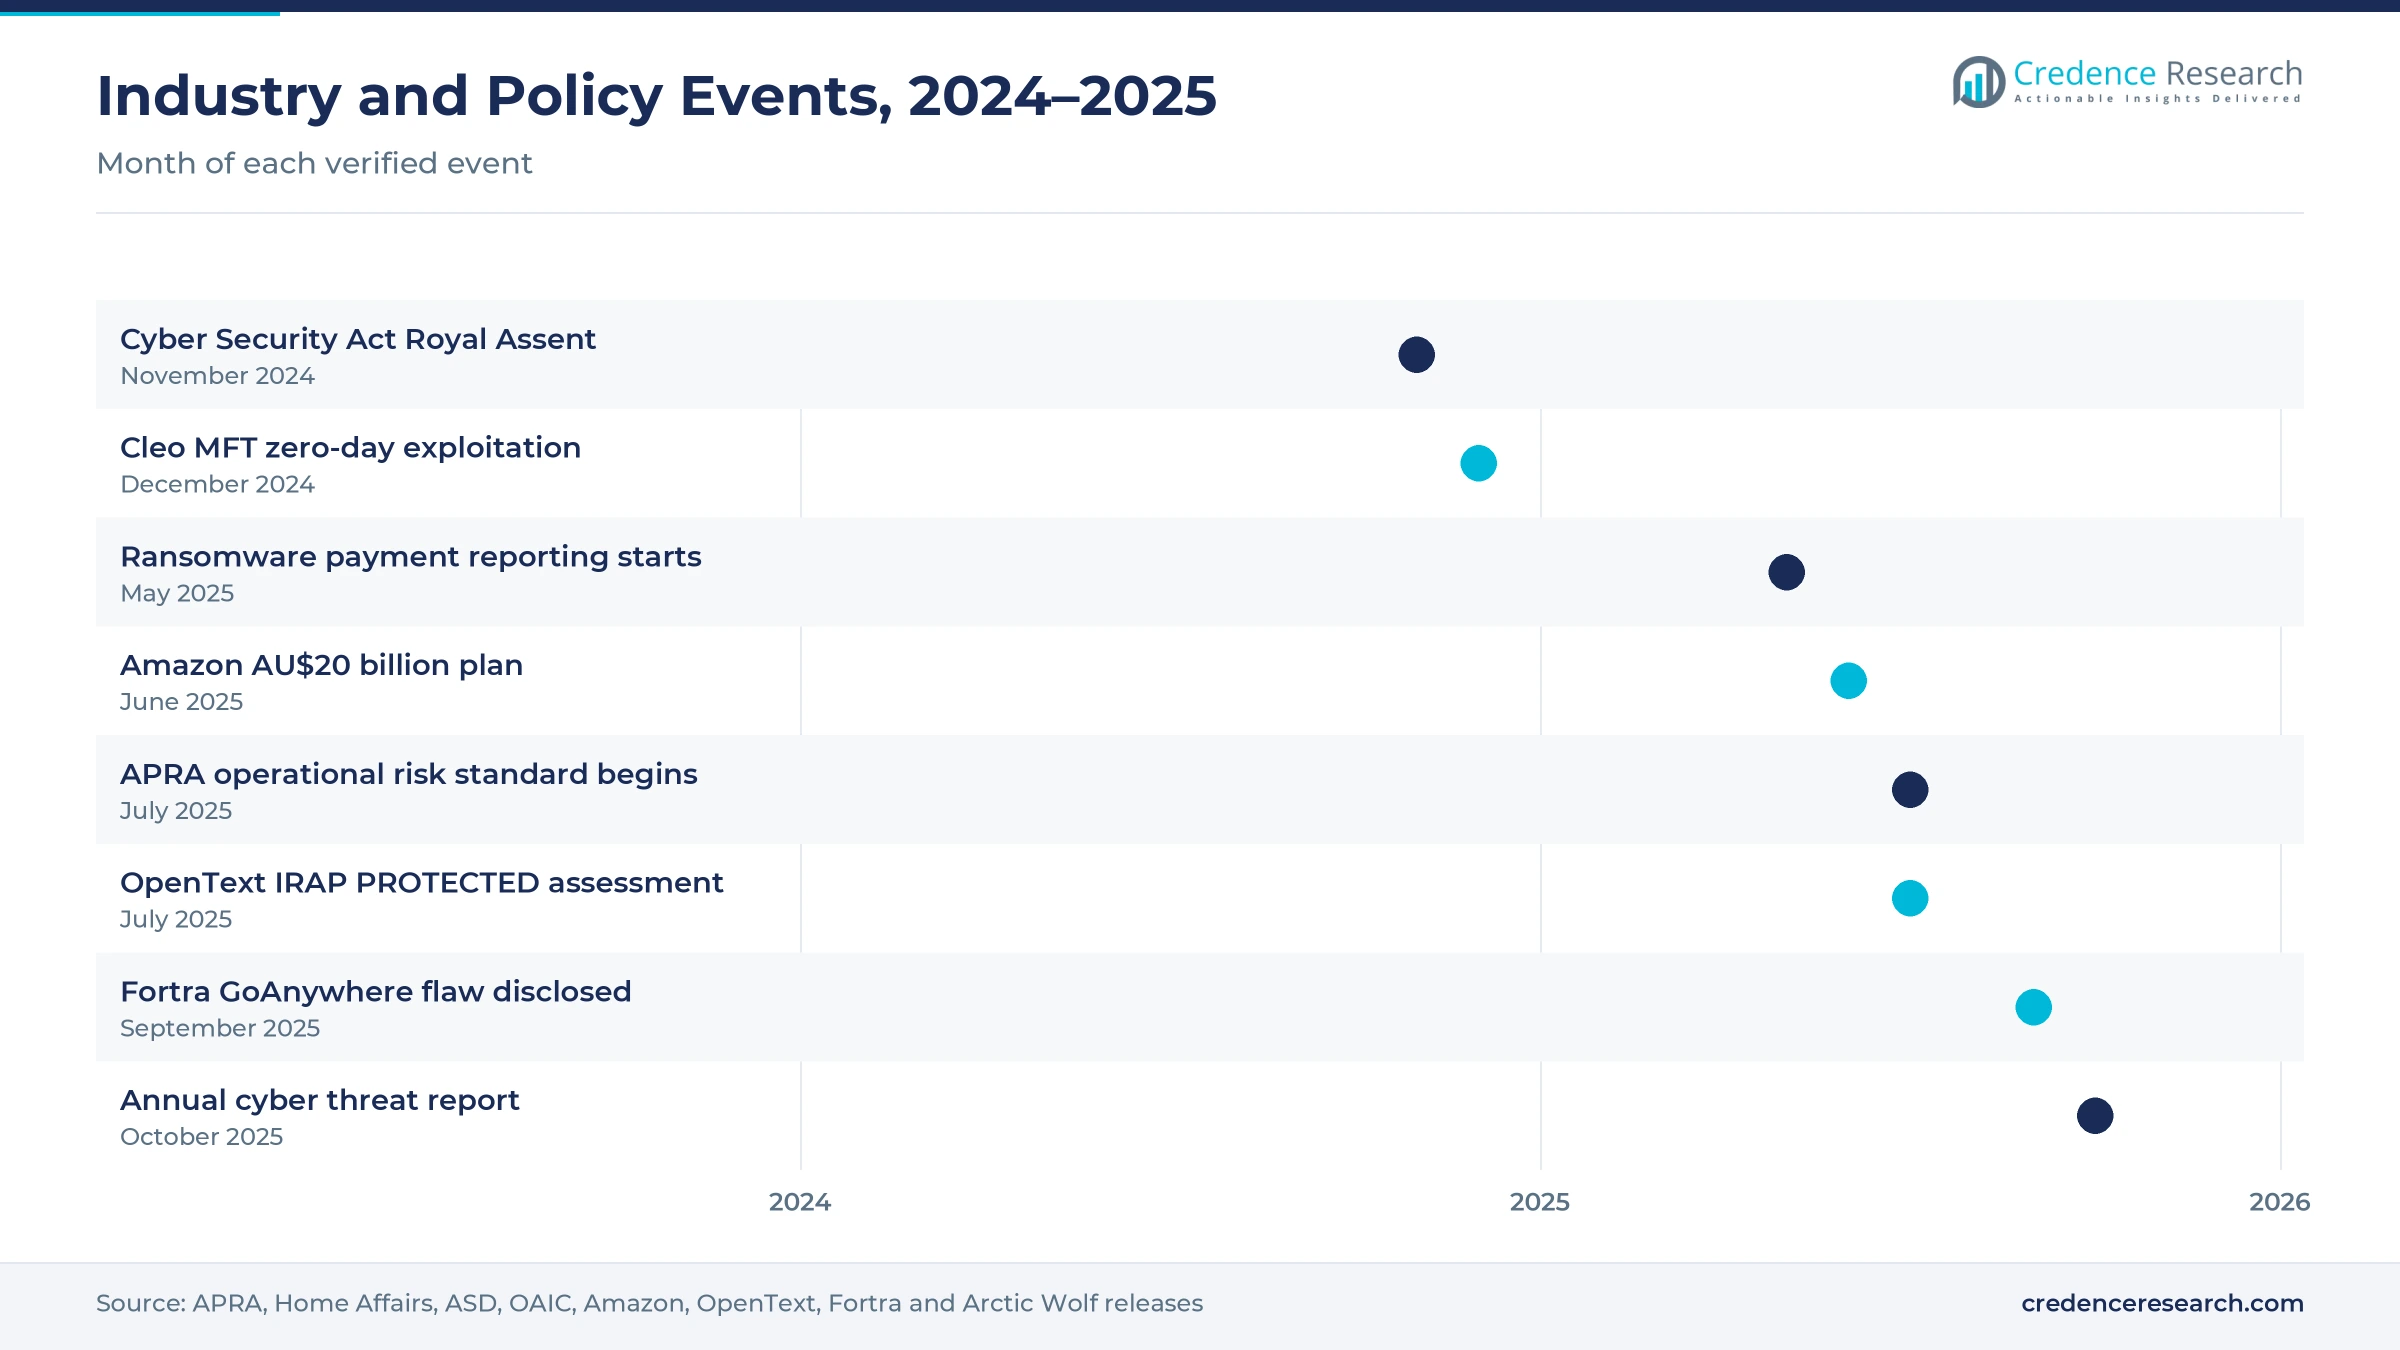
Operational resilience requirements speed upgrades, because organizations must show they can keep critical data flows running during an attack or outage. The Cyber Security Act 2024 received Royal Assent on Nov. 29, 2024, and its ransomware payment reporting rules started on May 30, 2025. The Australian Signals Directorate also responded to more than 1,200 cyber security incidents in 2024-25, an 11% increase on the year before. In turn, managed MFT services grow at 14.55% a year, the fastest solution rate, as smaller teams hand patching, monitoring and recovery testing to specialist providers. Buyers also ask vendors for tested failover between data centers.
Why do rising breach volumes push secure exchange?
Rising breach volumes push secure exchange, because many breaches begin with exposed files, stolen credentials or unpatched transfer servers. The privacy regulator received 1,205 data breach notifications in 2025, an all-time high, and 716 of them came from malicious or criminal activity. Health service providers reported 225 notifications, the most of any sector at 19% of the total. A federal government release also said cybercrime reports topped 84,700 in 2024-25, about one every six minutes. As a result, healthcare and life sciences grow at 13.45% a year, the fastest industry rate, as hospitals and laboratories move patient records through governed channels.
Cloud hosting, patch pressure and public sector needs
How is the shift to cloud-hosted transfer services changing buying?
The shift to cloud-hosted transfer services is changing buying, because organizations prefer subscriptions that include patching and monitoring. Progress runs MOVEit Cloud on Microsoft Azure in Australia, and Amazon plans AU$20 billion of local data center spending through 2029. OpenText also completed an IRAP assessment at the PROTECTED level for two cloud solutions in July 2025, which shows vendors investing in local security credentials. Australia reached 96.1% internet use in 2024, so partners and staff expect browser-based exchange. As a result, transfer platforms increasingly sit beside integration platform as a service tools in cloud architecture plans.
Why is the rise of vulnerability-driven replacement notable?
The rise of vulnerability-driven replacement is notable, because attacks on transfer servers can expose data from many organizations at once. Attackers began exploiting a zero-day flaw in Cleo MFT products on Dec. 7, 2024, and deployed a Java backdoor built to reach stored files. Fortra then disclosed a flaw in GoAnywhere MFT in September 2025 with a maximum severity score of 10.0, and it told customers to update to version 7.8.4. In turn, buyers shorten patch cycles, review internet-facing admin consoles and add data loss prevention controls. Some organizations also move to managed services so that providers handle urgent fixes.
Can sovereign public sector hosting open new demand?
Sovereign public sector hosting offers a growth path, because agencies must move citizen data between departments and contractors under strict security rules. OpenText completed an IRAP assessment at the PROTECTED level in July 2025 for its content management and data discovery solutions. IBM expanded its whole-of-government agreement with the NSW Government in March 2021, giving nine departments access to hybrid cloud and security services for a state of more than 8 million people. As a result, government buyers favor vendors that combine transfer software with cloud professional services and local support teams. Agencies also prefer services hosted onshore, which keeps citizen data under Australian law.
Is there room to grow in healthcare and life sciences exchange?
Healthcare and life sciences offer room to grow, because hospitals, laboratories and insurers exchange large volumes of patient records and results. Health service providers reported 225 data breach notifications in 2025, and the sector accounted for 19% of all notifications. The Australian Signals Directorate also said the average self-reported cost of cybercrime for a small business rose 14% to $56,600 in 2024-25. As a result, clinics and pathology groups that once used email now look for governed portals with audit trails. In turn, employee-initiated secure file exchange grows at 13.63% a year, the fastest application rate.
Legacy estates, skills gaps and attack risk slow change
Why do legacy transfer estates slow modernization?
Legacy transfer estates slow modernization, because many banks and agencies run hundreds of scheduled jobs built over many years. Each job links to partner systems, scripts and file formats that must be tested before any change. As a result, migration projects take longer and cost more than buyers expect. Vendors respond with automated job discovery, migration tools and parallel running periods that reduce the risk of failed transfers.
How do skills gaps limit secure operation?
Skills gaps limit secure operation, because transfer platforms need staff who understand encryption, certificates, networks and partner onboarding. Smaller organizations often lack these skills in house and rely on one or two administrators. In turn, patches and certificate renewals can fall behind when those staff leave. Providers respond with managed services, training programs and dashboards that flag expiring certificates, failed jobs and unusual transfer activity.
Why does attack risk on transfer servers worry buyers?
Attack risk on transfer servers worries buyers, because a single flaw can expose files from many partners at once. Recent attacks on transfer products have pushed boards to question internet-facing servers. However, rapid patching can disrupt partner connections when updates are not tested first. Vendors respond with faster security advisories, hardened default settings, tested patch bundles and cloud services that apply fixes centrally for every customer.
How do price pressure and tool overlap slow spending?
Price pressure and tool overlap slow spending, because cloud storage and collaboration suites now include basic file sharing at no extra cost. Some buyers question why they should pay for a separate transfer platform. As a result, vendors must prove value through audit, automation and partner management features. Vendors respond with usage-based pricing, bundled integration features and compliance reporting that general tools cannot match.
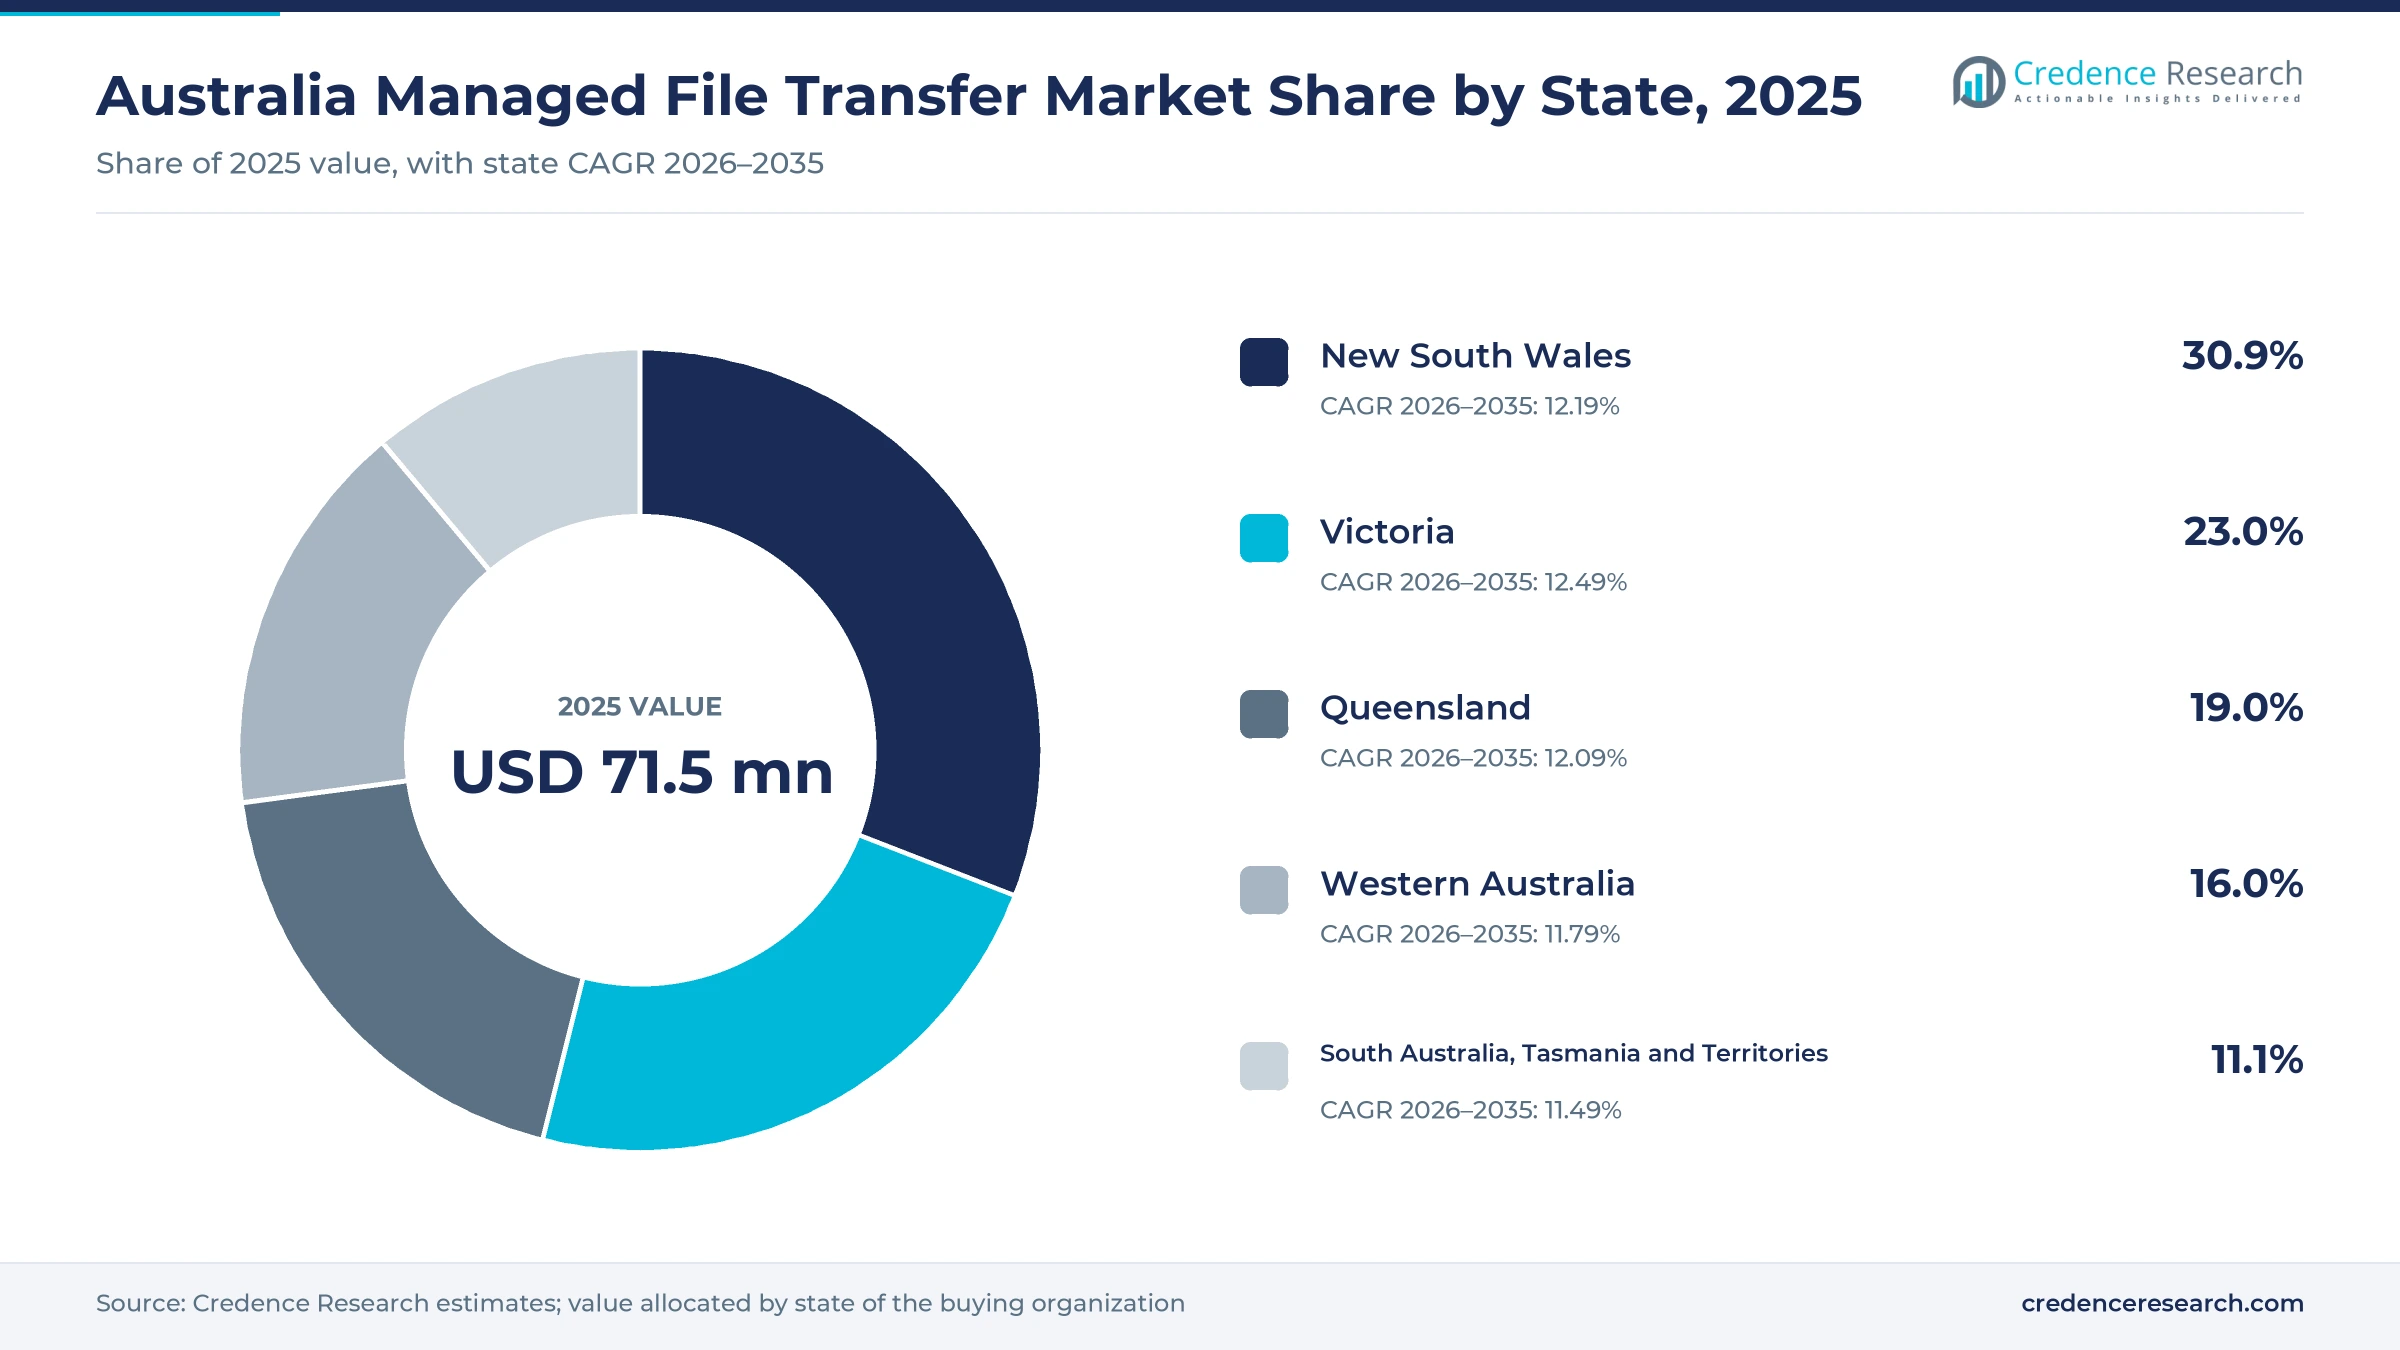
New South Wales leads while Victoria grows fastest
| State | Value, 2025 (USD million) | Share, 2025 | CAGR, 2026–2035 |
|---|---|---|---|
| New South Wales | 22.1 | 30.9% | 12.19% |
| Victoria | 16.4 | 23.0% | 12.49% |
| Queensland | 13.6 | 19.0% | 12.09% |
| Western Australia | 11.4 | 16.0% | 11.79% |
| South Australia, Tasmania and Territories | 7.9 | 11.1% | 11.49% |
Why does new South Wales hold the largest share?
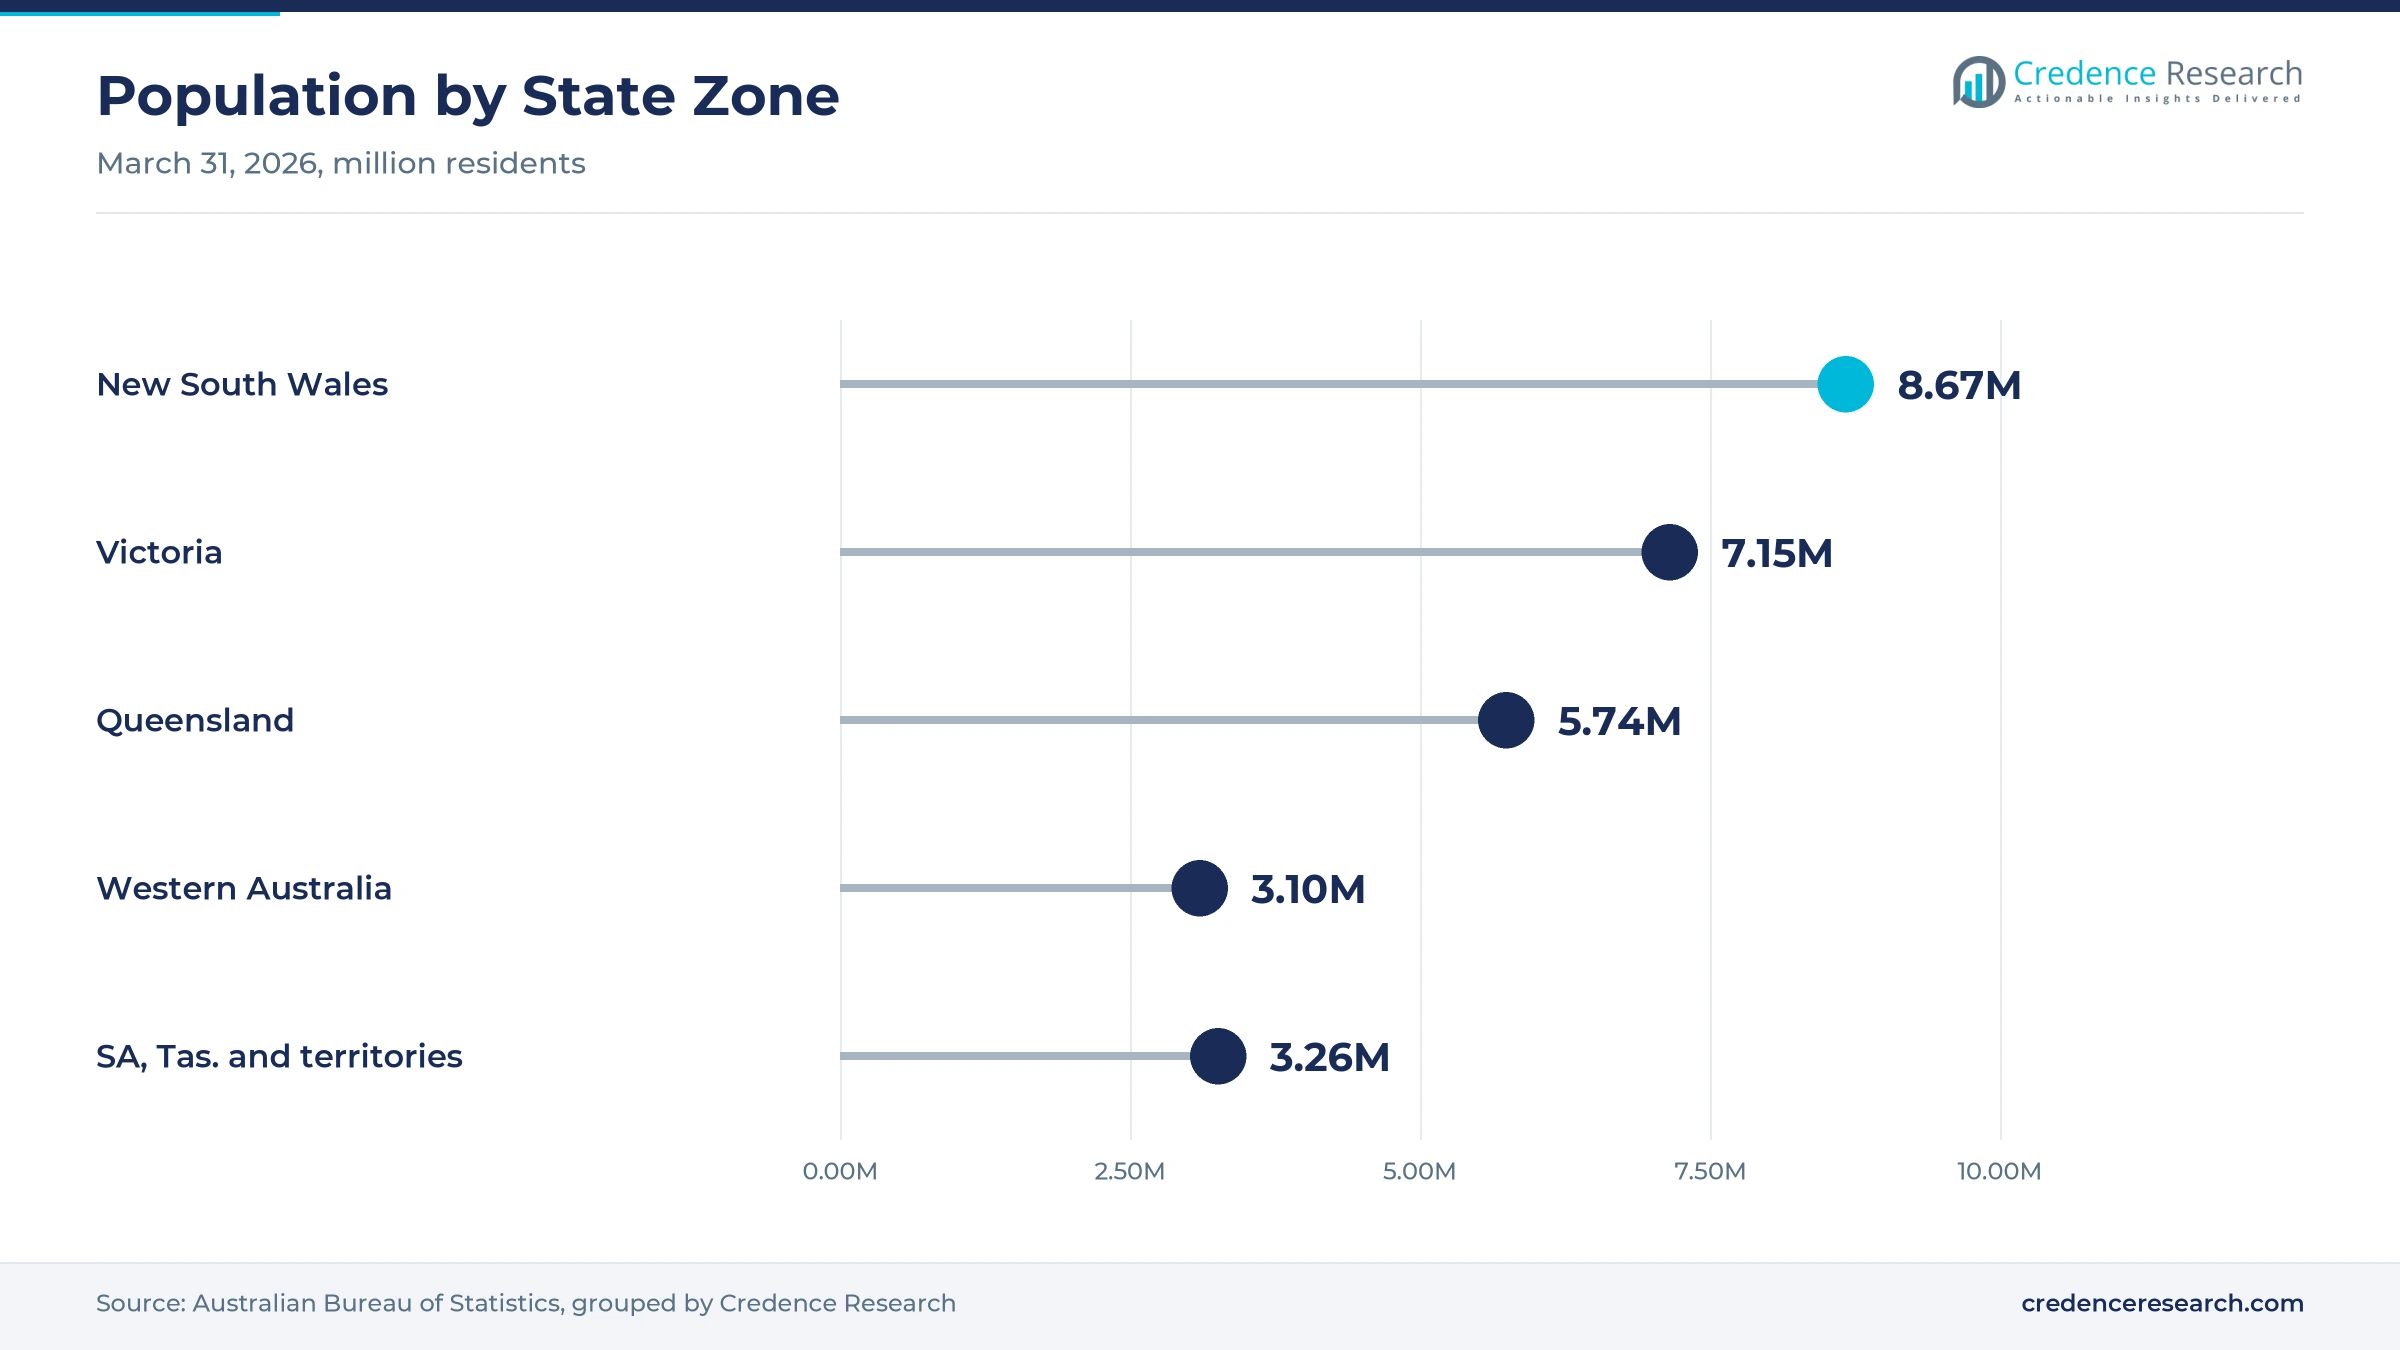
New South Wales held a 30.9% share of 2025 value and grows at 12.19% a year, because Sydney concentrates bank head offices, insurers, superannuation funds and the largest cloud data center cluster. The state had about 8.67 million residents at March 31, 2026, the largest population of any state. IBM also serves nine state government departments under its whole-of-government agreement. However, growth is close to the national rate because many large buyers already run mature platforms.
How does Victoria grow faster than other states?
Victoria held a 23.0% share of 2025 value and grows fastest at 12.49% a year, because Melbourne adds cloud data center capacity and financial services operations. The state had about 7.15 million residents at March 31, 2026, after adding about 109,500 people in a year. Amazon named Melbourne alongside Sydney in its data center expansion, and Axway opened a Melbourne office for the region. In turn, local banks, super funds and agencies can host transfer platforms close to their users.
What drives secure transfer demand in Queensland?
Queensland held a 19.0% share of 2025 value and grows at 12.09% a year, because state agencies, hospitals, insurers and logistics firms exchange large volumes of files. The state had about 5.74 million residents at March 31, 2026, after adding about 90,100 people in a year. As a result, demand for governed exchange rises in Brisbane, the Gold Coast and regional cities.
How do resources firms shape Western Australia demand?
Western Australia held a 16.0% share of 2025 value and grows at 11.79% a year, because mining and energy companies exchange engineering, logistics and contract files with many partners. The state population grew 2.1% over the year to March 31, 2026, the fastest of any state.
What supports demand in the remaining states and territories?
South Australia, Tasmania and the territories accounted for 11.1% of 2025 value and grow at 11.49% a year, because federal agencies in Canberra and military and health buyers in Adelaide need secure exchange under strict rules.
Laws, standards, flaws and investments from 2024 to 2025
| Development | Status and market relevance |
|---|---|
| In November 2024, the Cyber Security Act 2024 received Royal Assent. | Ransomware payment reporting rules started on May 30, 2025 |
| In December 2024, attackers began exploiting a zero-day flaw in Cleo MFT products. | Pushed buyers to review internet-facing transfer servers |
| In June 2025, Amazon announced AU$20 billion of data center investment in Australia through 2029. | Expands local cloud capacity in Sydney and Melbourne |
| In July 2025, APRA's operational risk standard took effect for regulated financial entities. | Covers material service providers and business continuity |
| In September 2025, Fortra disclosed a maximum severity flaw in GoAnywhere MFT. | Customers told to update to version 7.8.4 |
Encryption, automation and cloud gateways shape exchange
- End-to-end encryption protects files in transit and at rest, which helps banks and agencies meet security and privacy rules.
- Workflow automation schedules and monitors thousands of transfers, which replaces fragile scripts and reduces failed jobs.
- Cloud transfer gateways run in local cloud regions, which lets buyers retire their own servers without sending data offshore.
- Audit and analytics dashboards record every transfer and flag unusual activity, which supports compliance reviews and incident response.
Need a Custom Version of This Report?
Tailor the scope, geography, or segments to your exact requirements.
- Custom geography or segment scope
- Direct access to our analyst team
Vendors compete on security record and integration depth
Competition is led by global software vendors that sell transfer platforms, integration suites and managed services through local partners. IBM serves large banks and agencies and expanded its whole-of-government agreement with the NSW Government in 2021. Progress runs MOVEit Cloud on Microsoft Azure in Australia, while Axway has served the region from a Melbourne office with local sales and technical staff. OpenText completed an IRAP assessment at the PROTECTED level for two solutions in July 2025. Fortra sells GoAnywhere MFT and disclosed a critical flaw in September 2025, which showed how quickly vendors must ship fixes to customers. Rivals compete on security record, speed of patching, local hosting, integration with business systems and price, while local partners add migration and support services for buyers.
Companies profiled and their roles in this market
| Company | Type | Role in the market |
|---|---|---|
| IBM Corporation | Integration and security vendor | Expanded its NSW whole-of-government agreement in March 2021 |
| Progress Software | MFT software vendor | Runs MOVEit Cloud on Microsoft Azure in Australia since July 2021 |
| Axway Software | MFT and integration vendor | Opened a Melbourne office with local sales and technical staff |
| OpenText | Information management vendor | Completed an IRAP PROTECTED assessment for two solutions in July 2025 |
Credence Research view on Australian secure data exchange
Credence Research's view is that Australian secure file exchange will grow steadily because financial rules, cyber laws and breach volumes keep pushing organizations to replace scripts and email with governed platforms. Software licences remain the base of the market, while managed services and cloud hosting take most new spending. Banks, insurers and super funds stay the largest buyers, although healthcare grows faster. Vendors with a strong security record, fast patching and local hosting should gain share fastest.
How the Australian secure data exchange estimate was built
The report uses 2025 as the base year on a calendar basis, and market values come from the Credence Research model. That model combines official population statistics, World Bank digital infrastructure data, prudential standards, cyber security legislation, privacy regulator statistics, government threat reports and company releases on cloud services, assessments and security advisories. Segment splits and state growth rates are Credence Research estimates, while state shares follow the client-defined split. Sources used are public reports, official statistics, trade press, government releases and company releases, and no interviews or surveys were used.
Resilience rules and cloud moves carry growth to 2035
Secure file exchange value is expected to reach USD 240.5 million by 2035, a 12.10% CAGR during 2026–2035, as resilience rules, cloud moves and breach risk keep demand rising. Growth should be strongest while regulated entities complete upgrades for the new operational risk standard. After that, managed services and cloud hosting will carry more growth as smaller organizations hand over operation. A major attack on a transfer product would speed replacement, while cheaper collaboration tools could slow spending. Vendors with local hosting are expected to gain the most.
Frequently Asked Questions
How big is the Australia managed file transfer market?
Which industry leads Australian secure transfer demand?
Which state leads the Australia managed file transfer market?
How does APRA regulation affect secure file transfer?
How many data breaches were reported in Australia in 2025?
Which deployment model is growing fastest?
Who are the leading managed file transfer companies in Australia?
What are the main challenges for secure transfer vendors?
Table of Content
Chapter 1 Market Segmentation
- 1.1 Segmentation Framework
- 1.1.1 Product and Service Classification
- 1.1.2 Application and End-Use Classification
- 1.1.3 Technology and Solution Classification
- 1.1.4 Customer and Distribution Channel Classification
- 1.1.5 Geographic Segmentation
- 1.1.6 Market Segment Definitions and Boundaries
- 1.2 By Solution Type
- 1.2.1 MFT Software
- 1.2.2 Professional MFT Services
- 1.2.3 Managed MFT Services
- 1.3 By End-Use Industry
- 1.3.1 Banking, Insurance and Superannuation
- 1.3.2 Government and Public Sector
- 1.3.3 Healthcare and Life Sciences
- 1.3.4 Manufacturing
- 1.3.5 Telecommunications and Commerce
- 1.3.6 Media and Specialist Services
- 1.4 By Deployment Model
- 1.4.1 On-Premises
- 1.4.2 Public Cloud
- 1.4.3 Private and Hybrid Cloud
- 1.5 By Application
- 1.5.1 Internal Application File Exchange
- 1.5.2 External Trading-Partner File Exchange
- 1.5.3 Employee-Initiated Secure File Exchange
- 1.6 By State
- 1.6.1 New South Wales
- 1.6.2 Victoria
- 1.6.3 Queensland
- 1.6.4 Western Australia
- 1.6.5 South Australia, Tasmania and Territories
Chapter 2 Introduction
- 2.1 Report Objectives and Scope
- 2.2 Product Definition and Industry Terminology
- 2.3 Market Inclusions and Exclusions
- 2.4 Research Process
- 2.4.1 Primary Research and Expert Interviews
- 2.4.2 Secondary Research and Source Review
- 2.4.3 Top-Down and Bottom-Up Estimation
- 2.4.4 Data Triangulation and Verification
- 2.5 Market Size Measurement Basis
- 2.5.1 2025: USD 71.5 million → 2035: USD 240.5 million
- 2.6 Historical and Forecast Reference Periods
- 2.6.1 Historical Period: 2018-2025
- 2.6.2 Base Year: 2025
- 2.6.3 Forecast Period: 2025-2035
- 2.7 Research Assumptions and Limitations
Chapter 3 Executive Summary
- 3.1 Market Snapshot and Key Findings
- 3.2 Base-Year Market Size, 2025
- 3.3 Forecast Market Size, 2035
- 3.4 Revenue and Volume Growth Outlook
- 3.5 Key Demand and Supply Indicators
- 3.6 Leading Market Segments
- 3.7 Fastest-Growing Market Opportunities
- 3.8 Regional Performance Highlights
- 3.9 Technology and Industry Transformation
- 3.10 Competitive Landscape Summary
- 3.11 Analyst View and Strategic Implications
Chapter 4 Australia Managed File Transfer Market Trends and Developments
- 4.1 Historical Industry Development, 2018-2025
- 4.2 Recent Market Trends and Developments
- 4.3 Demand and Customer Behavior Trends
- 4.4 Technology and Product Innovation
- 4.5 Artificial Intelligence, Automation and Digitalization
- 4.6 Local Manufacturing and Supply Chain Realignment
- 4.7 Industry Partnerships, Mergers and Acquisitions
- 4.8 Sustainability and Circular Economy Developments
- 4.9 Government and Private Sector Investment Trends
- 4.10 Emerging Business Models and Commercialization
- 4.11 Industry Developments and Announcements
Chapter 5 Australia Managed File Transfer Market Production, Supply and Demand Analysis
- 5.1 Demand Trend and Consumption Analysis, 2018-2025
- 5.2 Demand Forecast, 2025-2035
- 5.3 Production and Output Trend, 2018-2025
- 5.4 Production and Output Forecast, 2025-2035
- 5.5 Installed Capacity and Capacity Utilization
- 5.6 Company-Wise Production Plants and Statistics
- 5.6.1 Installed Production Capacity
- 5.6.2 Actual Production
- 5.6.3 Planned Capacity and Expansion Targets
- 5.7 Supply Chain Structure and Procurement Trends
- 5.8 Supply-Demand Gap and Bottlenecks
- 5.9 Import Dependence and Sourcing Structure
- 5.10 Contract Manufacturing and Outsourcing
- 5.11 Regional Supply and Demand Concentration
Chapter 6 Australia Managed File Transfer Market Pricing Analysis
- 6.1 Pricing Structure and Measurement
- 6.2 Historical Pricing Trends, 2018-2025
- 6.3 Pricing Outlook, 2025-2035
- 6.4 Average Selling Price and Unit Economics
- 6.5 Pricing by Product and Market Segment
- 6.6 Geographic Pricing Differences
- 6.7 Key Input, Energy, Labor and Logistics Costs
- 6.8 Contract Pricing and Purchasing Models
- 6.9 Pricing Sensitivity and Competitive Positioning
- 6.10 Price, Margin and Profitability Implications
Chapter 7 Australia Managed File Transfer Market Dynamics
- 7.1 Market Growth Drivers
- 7.1.1 Demand-Side Drivers
- 7.1.2 Technology and Innovation Drivers
- 7.1.3 Infrastructure and Investment Drivers
- 7.1.4 Regulatory and Policy Drivers
- 7.2 Market Restraints
- 7.2.1 Cost and Affordability Constraints
- 7.2.2 Technology and Adoption Barriers
- 7.2.3 Supply Chain and Operational Constraints
- 7.3 Market Challenges
- 7.3.1 Competitive Pressure and Margin Erosion
- 7.3.2 Skills, Infrastructure and Implementation Gaps
- 7.4 Emerging Market Opportunities
- 7.5 Market Dynamics Impact and Time-Horizon Assessment
Chapter 8 Australia Managed File Transfer Value Chain Analysis
- 8.1 Industry Value Chain Overview
- 8.2 Upstream Suppliers and Critical Inputs
- 8.3 Technology and Component Providers
- 8.4 Manufacturing or Service Delivery
- 8.5 Distribution, Channel Partners and Integrators
- 8.6 Downstream Applications and End Users
- 8.7 Value Addition and Profit Pools
- 8.8 Vertical Integration and Outsourcing
- 8.9 Supplier Concentration and Risk
- 8.10 Supply Chain Localization and Resilience
Chapter 9 Australia Managed File Transfer Market Regulations and Policies
- 9.1 Relevant Laws, Standards and Compliance Frameworks
- 9.2 Product, Service, Safety and Quality Requirements
- 9.3 Government Policies, Incentives and Subsidies
- 9.4 Imports, Exports and Trade Barriers
- 9.5 Public Procurement and Local Content Requirements
- 9.6 Environmental and Sustainability Compliance
- 9.7 Data Protection, AI and Cybersecurity Compliance
- 9.8 Upcoming Policy Changes and Market Implications
Chapter 10 Australia Managed File Transfer Market Hotspots and Opportunities
- 10.1 Market Opportunity Mapping and Growth Hotspots
- 10.2 High-Growth Applications and Customer Groups
- 10.3 Underserved Markets and White-Space Opportunities
- 10.4 Emerging Technology and Product Opportunities
- 10.5 New Capacity and Investment Hotspots
- 10.6 Market Entry and Expansion Opportunities
- 10.7 Distribution and Partnership Opportunities
- 10.8 Near-Term and Long-Term Commercial Potential
- 10.9 Opportunity Attractiveness and Execution Risks
Chapter 11 Australia Managed File Transfer Market Outlook, 2025-2035
- 11.1 Market Size and Analysis
- 11.1.1 Revenue (Market Measurement: 2025: USD 71.5 million → 2035: USD 240.5 million)
- 11.1.2 Market Volume and Quantity Sold
- 11.1.3 Historical Market Size, 2018-2025
- 11.1.4 Base-Year Market Size, 2025
- 11.2 Market Forecast, 2025-2035
- 11.2.1 Revenue Forecast to 2035
- 11.2.2 Volume Forecast to 2035
- 11.2.3 CAGR and Year-on-Year Growth
- 11.2.4 Incremental Revenue Opportunity
- 11.3 Forecast Assumptions and Scenario Analysis
- 11.3.1 Base-Case Forecast
- 11.3.2 Optimistic and Conservative Scenarios
- 11.3.3 Technology, Pricing and Policy Sensitivities
- 11.4 Market Attractiveness and Growth Outlook
Chapter 12 Australia Managed File Transfer Market Segmentation and Outlook
- 12.1 Segmentation Summary and Market Shares, 2025
- 12.2 Largest and Fastest-Growing Segments
- 12.3 By Solution Type - Market Size and Forecast, 2025-2035
- 12.3.1 Segment Definition and Scope
- 12.3.2 Historical Market Size, 2018-2025
- 12.3.3 Revenue Forecast, 2025-2035
- 12.3.4 Volume Forecast, 2025-2035
- 12.3.5 Base-Year Market Share, 2025
- 12.3.6 Segment CAGR and Growth Drivers
- 12.3.7 Subsegment Market Size and Forecast
- 12.3.7.1 MFT Software
- 12.3.7.2 Professional MFT Services
- 12.3.7.3 Managed MFT Services
- 12.3.8 Subsegment Pricing and Adoption Trends
- 12.3.9 Leading Suppliers and Competition
- 12.3.10 Regional Demand and Opportunities
- 12.4 By End-Use Industry - Market Size and Forecast, 2025-2035
- 12.4.1 Segment Definition and Scope
- 12.4.2 Historical Market Size, 2018-2025
- 12.4.3 Revenue Forecast, 2025-2035
- 12.4.4 Volume Forecast, 2025-2035
- 12.4.5 Base-Year Market Share, 2025
- 12.4.6 Segment CAGR and Growth Drivers
- 12.4.7 Subsegment Market Size and Forecast
- 12.4.7.1 Banking, Insurance and Superannuation
- 12.4.7.2 Government and Public Sector
- 12.4.7.3 Healthcare and Life Sciences
- 12.4.7.4 Manufacturing
- 12.4.7.5 Telecommunications and Commerce
- 12.4.7.6 Media and Specialist Services
- 12.4.8 Subsegment Pricing and Adoption Trends
- 12.4.9 Leading Suppliers and Competition
- 12.4.10 Regional Demand and Opportunities
- 12.5 By Deployment Model - Market Size and Forecast, 2025-2035
- 12.5.1 Segment Definition and Scope
- 12.5.2 Historical Market Size, 2018-2025
- 12.5.3 Revenue Forecast, 2025-2035
- 12.5.4 Volume Forecast, 2025-2035
- 12.5.5 Base-Year Market Share, 2025
- 12.5.6 Segment CAGR and Growth Drivers
- 12.5.7 Subsegment Market Size and Forecast
- 12.5.7.1 On-Premises
- 12.5.7.2 Public Cloud
- 12.5.7.3 Private and Hybrid Cloud
- 12.5.8 Subsegment Pricing and Adoption Trends
- 12.5.9 Leading Suppliers and Competition
- 12.5.10 Regional Demand and Opportunities
- 12.6 By Application - Market Size and Forecast, 2025-2035
- 12.6.1 Segment Definition and Scope
- 12.6.2 Historical Market Size, 2018-2025
- 12.6.3 Revenue Forecast, 2025-2035
- 12.6.4 Volume Forecast, 2025-2035
- 12.6.5 Base-Year Market Share, 2025
- 12.6.6 Segment CAGR and Growth Drivers
- 12.6.7 Subsegment Market Size and Forecast
- 12.6.7.1 Internal Application File Exchange
- 12.6.7.2 External Trading-Partner File Exchange
- 12.6.7.3 Employee-Initiated Secure File Exchange
- 12.6.8 Subsegment Pricing and Adoption Trends
- 12.6.9 Leading Suppliers and Competition
- 12.6.10 Regional Demand and Opportunities
- 12.7 By State - Market Size and Forecast, 2025-2035
- 12.7.1 Segment Definition and Scope
- 12.7.2 Historical Market Size, 2018-2025
- 12.7.3 Revenue Forecast, 2025-2035
- 12.7.4 Volume Forecast, 2025-2035
- 12.7.5 Base-Year Market Share, 2025
- 12.7.6 Segment CAGR and Growth Drivers
- 12.7.7 Subsegment Market Size and Forecast
- 12.7.7.1 New South Wales
- 12.7.7.2 Victoria
- 12.7.7.3 Queensland
- 12.7.7.4 Western Australia
- 12.7.7.5 South Australia, Tasmania and Territories
- 12.7.8 Subsegment Pricing and Adoption Trends
- 12.7.9 Leading Suppliers and Competition
- 12.7.10 Regional Demand and Opportunities
- 12.8 Segment Growth Comparison
- 12.9 Segment Attractiveness and Priority Matrix
Chapter 13 Australia Managed File Transfer End-Use and Application Market Outlook
- 13.1 End-Use Industry and Customer Demand Structure
- 13.2 Leading Applications and Customer Groups
- 13.3 End-Use Market Size, Share and Forecast
- 13.4 Major End-Use Industry Deep Dives
- 13.4.1 Customer Requirements and Use Cases
- 13.4.2 Demand and Replacement Cycles
- 13.4.3 Technical and Regulatory Considerations
- 13.4.4 Purchasing and Procurement Models
- 13.4.5 Leading Vendors and Distribution Channels
- 13.4.6 Forecast and Commercial Opportunities
- 13.5 Emerging Applications and Cross-Segment Demand
- 13.6 End-Use Industry Investment Priorities
Chapter 14 Australia Managed File Transfer Geographic Market Outlook, 2025-2035
- 14.1 Domestic Market Distribution and Demand Clusters
- 14.2 State- or Province-Wise Market Size and Forecast, 2025-2035
- 14.3 City and Metropolitan Market Outlook
- 14.4 Industrial, Manufacturing and Commercial Clusters
- 14.5 Geographic Concentration of Key End Users
- 14.6 Local Pricing and Purchasing Differences
- 14.7 Domestic Production Facilities and Capacity Map
- 14.8 Local Infrastructure and Project Pipeline
- 14.9 State-Level Policy and Incentive Differences
- 14.10 Subnational Investment Hotspots and Opportunities
- 14.11 Distribution and Logistics Networks
- 14.12 Domestic Competitive Footprint
Chapter 15 Australia Managed File Transfer Technology, Innovation and Sustainability Outlook
- 15.1 Technology Landscape and Maturity
- 15.2 Product, Process and Service Innovation
- 15.3 AI, Automation and Digital Tools in the Industry
- 15.4 Technology Adoption and Performance Benchmarking
- 15.5 Innovation Pipeline and R&D Investment
- 15.6 Patent and Intellectual Property Trends
- 15.7 Energy Efficiency and Resource Management
- 15.8 Sustainability, Recycling and Circularity
- 15.9 Technology Roadmap, 2025-2035
- 15.10 Risks of Obsolescence and Technology Substitution
Chapter 16 Australia Managed File Transfer Market Key Strategic Imperatives
- 16.1 Growth and Market Entry Priorities
- 16.2 High-Return Products and Segments
- 16.3 Pricing, Profitability and Cost Optimization
- 16.4 Technology Investment and Product Differentiation
- 16.5 Supply Chain Localization and Resilience
- 16.6 Distribution and Customer Acquisition
- 16.7 Partnership, Acquisition and Capacity Strategy
- 16.8 Regional Expansion Priorities
- 16.9 Short-, Medium- and Long-Term Actions
Chapter 17 Competition Outlook
- 17.1 Industry Competition Characteristics
- 17.2 Market Structure and Concentration
- 17.3 Market Share and Competitive Positioning, 2025
- 17.4 Company-Wise Revenue and Product Benchmarking
- 17.5 Production and Service Capacity Benchmarking
- 17.6 Technology, Pricing and Differentiation
- 17.7 Regional Footprint and Distribution Strength
- 17.8 Mergers, Acquisitions and Strategic Alliances
- 17.9 New Entrants and Competitive Threats
- 17.10 Porter's Five Forces and Industry Attractiveness
- 17.11 Competitive Outlook, 2025-2035
Chapter 18 Company Profiles
- 18.1 Company Coverage and Selection Criteria
- 18.2 IBM Corporation
- 18.2.1 Business Description
- 18.2.2 Company Ownership and Geographic Presence
- 18.2.3 Product and Service Portfolio
- 18.2.4 Manufacturing and Operating Footprint
- 18.2.5 Production Capacity and Expansion Plans
- 18.2.6 Financial Performance and Investment
- 18.2.7 Market Share and Competitive Position
- 18.2.8 Technology and Innovation Capabilities
- 18.2.9 Strategic Alliances or Partnerships
- 18.2.10 Recent Developments
- 18.2.11 Growth Strategy and Outlook
- 18.3 Progress Software
- 18.4 Axway Software
- 18.5 Fortra
- 18.6 OpenText
- 18.7 Other Relevant Market Participants
Note: Every listed company is profiled on the structure shown under the first company. The company list is preliminary and may change based on research findings, market developments, data availability and client requirements.
Chapter 19 Disclaimer
- 19.1 Research and Forecast Disclaimer
- 19.2 Data Source and Estimation Limitations
Note: The depth of individual sections depends on data availability for this market. Volume, capacity, trade and other unit-based metrics are included where applicable.

